1. Introduction
Sustainable water resource management is a primary challenge for governments in arid regions. Extremes in the water cycle—primarily floods and droughts—may threaten all nations across the world and require the utmost attention by authorities. The United Arab Emirates (UAE) has limited reliable rainfall to support agricultural activities; receiving an average annual rainfall of less than 50 mm [
1]. Non-renewable fossil groundwater from aquifers is the major source of irrigation water for existing and new agriculture projects in the UAE [
2]. There are other potential sources of freshwater such as groundwater, re-use of agricultural drainage water, desalination, construction of dams to capture flash flood water in the Oman Mountains region and recycled wastewater; however, such resources are limited in terms of quantity and renewability [
3].
Arid regions typically experience episodic precipitation events of unpredictable magnitude [
4]. The sporadic nature of these events makes a determination of the most susceptible urban areas vital for planning and mitigation. Surface cover, topography and the degree of precipitation contribute to the hydrologic response of a watershed [
5]. Watersheds with little relief will have longer travel times as compared to those with greater slope. The length, roughness and depth of flow for a particular flow path also affect travel time in a similar way. Urbanization greatly affects watershed hydrology by altering traditional flow paths and reducing natural mitigation. For arid watersheds, where mitigation through natural vegetation is already limited, the conversion of open soil to impervious surfaces such as roads, sidewalks, parking lots and buildings greatly reduces the infiltration capacity and increases surface runoff [
6]. Increased surface imperviousness and the rerouting of natural flow paths though paved gutters, storm sewers and other artificial drainage systems increases peak discharge and leads to more rapid surface flow which can contribute to flash flooding if enough precipitation is present [
7].
Like many countries in the Middle East, the UAE population has exploded over a relatively short period. Its population in 1955 was estimated to be under 80,000. By 1990, the population had swelled to 1.9 million and only 5 years later to 2.5 million (
Figure 1). By 2010, the population was roughly 8.3 million, with present estimates at 9.7 million, which is more than double the 2005 population as stated in the Economic Annual Report by Ministry of Economy of the United Arab Emirates [
8]. The current percentage of urban population of the UAE is approximately 93%.
In the UAE, the conversion of pervious desert soils to expansive areas of impervious cover, through rapid urbanization, has drastically increased runoff and rerouted natural channels [
9]. Sandy soils of high infiltration capacity have been replaced by asphalt and concrete surfaces which allow for little natural mitigation to precipitation events. Natural channels have been realigned to conform to more direct drainage systems leading to greater peak discharges that occur sooner in succession and at higher velocity. Such conditions favor the accumulation of water which may result in flash flooding or water pooling depending on precipitation intensity and duration, as well as topographic changes in elevation. Public and environmental health may also become more susceptible to pollutants, as they are easily transported by water moving across impervious surfaces [
10].
The rapid urbanization of arid regions over the past several decades has not only altered the surface hydrology but has also changed other components of the water cycle (e.g., Salvadore [
11], Smith [
12]). Shepherd [
13] who studied rainfall anomalies in two major arid urban areas, Phoenix, Arizona and Riyadh, Saudi Arabia, noted that urban-topographic interactions may have led to a statistically significant increase in precipitation in these areas. Smith [
12] examined data from 21 storm events and found that the compaction of soils in urban catchments reduced the infiltration capacity by 70–90% compared to undisturbed soil. Litvak [
14] estimated evaporation in the urban area of Los Angeles and found that evaporation from impervious areas was negligible compared to evaporation from vegetated areas.
Most flooding in the UAE occurs during the rainy season from October to March, especially in the northern and eastern coastal watersheds [
9]. For example, heavy downpour in October and November 2017 resulted in flash flooding in Al Fujairah and Al Sharjah leading to street and wadi flooding that swept away cars and caused fatalities. One month later, floods occurred in the same area, leading to hundreds of traffic accidents and the evacuation of dozens of residents from homes in Al Fujairah and Khor Fakkan, Al Sharjah. According to Emirates Red Crescent 188 people were displaced by the flooding, which also resulted in, at least, three fatalities in the neighboring region of Oman. Heavy precipitation caused flash flooding in Sharjah and Dubai late March 2014 resulting in street flooding and road closures due to high water and multiple traffic accidents. A week earlier, heavy rainfall accompanied with strong winds caused widespread flash flooding in Fujairah resulting in the evacuation of tens of families from their damaged homes. A cold trough that passed over the UAE in November 2013 caused heavy rainfall accompanied by hail, intense lightning and strong wind and severe weather conditions across much of the country [
15]. The impacts included damage by hail as big as four inches in diameter, flooded homes, uprooting of trees, road closures due to flooded streets and accidents and school closures in major cities such as Al Ain, Dubai and Abu Dhabi. Recent events in 2018 and 2019 resulted in further social and economic loss.
Coastal regions of the UAE are also susceptible to cyclones. Although, the UAE has not faced any torrential rainfall event similar to those caused by cyclones in neighboring Oman, urbanization is creating conditions that can produce devastating flooding as a result of smaller events. For example, the east coast of the UAE suffered fatal flooding and significant damage due to Cyclone Gonu in 2007 [
16]. Moreover, the red tide (harmful algal blooms) believed to have been caused by the cyclone resulted in significant losses in the fishing industry for several months after the cyclone [
16]. In addition to meteorological hazards, other challenges facing the UAE coastal urban centers include sea level rise and land subsidence [
17].
The UAE coastal areas that stay dry most of the year, except for sporadic rainfall events and the depletion of coastal aquifers, make it worthwhile to explore innovative solutions such as Managed Aquifer Recharge (MAR) [
18] for storing excess runoff from these events. This might be a much better approach than dam construction. In addition to evaporation losses surface storage may motivate overuse of water because water in sight may bring about a false sense of water security and/or may lead to overuse due to fear of evaporation. Perrone [
19] reported that, for the same cost, ground water storage could provide six times more storage. This is especially true in the UAE as urban flooding is collocated with areas of groundwater depletion. However, for MAR to be effective, accurate estimation of runoff volumes and their spatial and temporal distributions must be well studied to identify optimal locations and method for MAR application [
20].
The inability to adequately capture the spatial and temporal variability of rainfall is one of the main sources of error in the estimation of hydrological response in urban areas (e.g., Omranian [
21], Furl [
22], Emmanuel [
23], Emmanuel [
24]). While rain gauges remain the most accurate rainfall measurement instruments; however, when applied in urban areas, they have many limitations due to strong small-scale variability [
25]. Fortunately, new satellite-borne precipitation sensors are a promising example of recently developed instruments because they are able to estimate rainfall variability at much higher spatial resolution [
21,
26]. Even at their current resolutions, satellite rainfall products are already demonstrating their capabilities in urban hydrological research and quantitative rainfall estimation and forecasting applications (e.g., Ricciardelli [
27]; Sharif [
28]).
None of the studies that examined the hydrology of the region or the impact of urbanization on runoff (e.g., Shanableh [
9], Al-Ghamdi [
29], Sharif [
30]) addressed, nor tried to quantify, coastal runoff. To the best knowledge of the authors, no previous studies have tried to quantify coastal runoff in the UAE and the factors that control its spatial and temporal distributions. In this study, high-resolution satellite rainfall products were processed for recent extreme rainfall events in the UAE and used as input for hydrologic models of coastal catchment to quantify runoff into the sea. Satellite images and GIS were used to delineate land use in these catchments. The impacts of land-use change on coastal runoff was examined in detail. The analysis presented is complementary to those calculating the impact of potential floods under future, possible climate scenarios. The paper also demonstrates the usefulness of remotely sensed satellite data and simple mapping methods as a means for identifying where MAR treatments can be applied to improve water storage and reduce flooding hazards. The paper discusses the lesson learned from this study in terms of urban development and water resources planning and management.
4. Hydrologic Model
The main goal of this study is to quantify coastal runoff and examine its spatial and temporal characteristics. For such hydrologic analysis, observed discharge and spatial distribution of runoff should be available for some events for hydrologic model calibration. However, for ungauged basins and in regions with very limited runoff observation, as in the case of this study, this information is not readily available and the hydrologic analysis must be based on hydrologic model results driven by estimated watershed characteristics and meteorological inputs. There are several well-known watershed models currently in use in flood studies all over the world. These models vary significantly in terms of process simulations capabilities and data needs [
44]. Based on the available meteorological and spatial watershed data for this study, it was decided to use the Hydrologic Engineering Center’s Hydrologic Modeling System (HEC-HMS) [
45,
46] with precipitation input based on event rainfall observed by satellite and frequency storm data. The Watershed Modeling System (WMS) [
47], HEC-GeoHMS [
45] and ArcGIS were used for processing model input and output. A brief overview of HEC-HMS is presented below.
Developed by the U.S. Army Corps of Engineers, HEC-HMS is a semi-distributed, sub-basin-based generalized modeling system that simulates the precipitation-runoff processes over different types of dendritic drainage watersheds with minimal data requirements [
48]. The modeling system is comprised of several sub-models that can simulate different components of the runoff generation process with different choices of infiltrations, unit hydrograph and flood routing methods. The main components of the system are an analytical model for calculating direct runoff and channel routing, a basin model for representing the hydrological elements of a watershed; an input system for entering, editing, managing and storing data; and a functional system for displaying and documenting the simulation results [
49]. HEC-HMS is widely used across the world because of its simplicity and the small number of parameters needed, which makes calibration relatively easier. The Soil Conservation Service (SCS) (currently the Natural Resources Conservation Service (NRCS)) curve number (CN) method [
50] is the main approach used in HEC-HMS for estimating the infiltration capacity and runoff for various combinations of soil and land use/cover types although other options are available. The Curve Number value depends on the soil type, LULC type, impervious fraction and antecedent moisture. Several studies demonstrated that the CN method can be applied in different environments and is able to produce reasonable results comparable to those of more sophisticated models despite its simplicity (e.g., Halwatura [
51], Du [
52]).
Runoff Volume Computation: The SCS Curve Number Loss Model (CNLM, McCuen [
53]) was used for determining direct runoff from precipitation events. The method was developed by the USDA Natural Resources Conservation Service through empirical analysis of runoff from small watershed catchments monitored by the USDA. CNLM Well established and widely accepted [
54]. Based on the CN and cumulative precipitation, CNLM estimates excess precipitation for each sub-basin as follows:
where Pe is the accumulated excess precipitation at time t; P is the accumulated rainfall depth at time t; Ia is the initial abstraction of water by soil or vegetation prior to runoff (usually represented as either 0.2S or 0.05S); S is the potential maximum soil moisture retention after runoff begins
Assuming that Ia = 0.2S as most empirical studies has shown, Equation (1) can be expressed as:
The potential maximum retention S is related to curve number as follows:
Curve number values, which range from near 100 for impervious sloping areas to 30 for high infiltration soils, were studied and estimated by the U.S Soil Conservation Service in published Technical Report 55 [
50]. However, researchers typically use their own judgment to modify the published values based on site conditions and/or model calibration results.
Direct runoff transformation: This process in the model refers to the transformation of precipitation excess (direct runoff) into a discharge hydrograph at the sub-basin outlet. HEC-HMS can perform this transformation employing one of two methods: empirical hydrograph construction models (e.g., Snyder’s Unit Hydrograph and Clark’s Unit Hydrograph) and the kinematic wave model. This is done by dividing each sub-basin into three conceptual elements: overland flow planes, collector channels and a main channel. The Snyder’s Unit Hydrograph was used in this study.
Channel flow routing: There are five methods for channel routing in HEC-HMS. The Muskingum method is used as the flow routing method for this study. The method is easy to use and is one of the most popular routing methods among HEC-HMS users. The Muskingum routing method uses a simple finite difference approximation to solve the following equation:
where O is the outflow, I the inflow, t time and K and X are parameters that depend on the sub-basin characteristics such as the slope and length. Parameters including reach length, channel width, channel side slope and energy slope were computed though the use of HEC-HMS interface while values for Manning’s roughness were entered manually. Estimation of Manning’s roughness coefficients, which represent the ease of flow through a channel, were estimated based on land cover types using tabulated values in HEC-HMS manual.
5. Hydrologic Simulations
The study area included 17 main basins ranging in size between 46 and 1830 km
2 with each basin having between 5 and 131 sub-basins based on the diversity of topography, LULC type and soils within the basin.
Figure 4 and
Figure 5 show the delineated basin and sub-basins flowing into the Arabian Gulf and Gulf of Oman, respectively, in more detail. Basin names were designated numerically from the most upstream reach to the most downstream. Generated sub-basins range in size from 0.01 km
2 to 31 km
2. Basin variables, used for the computation of basin hydrologic/hydraulic parameters, were generated automatically upon delineation. Variables such as mean catchment slope, width/length ratio, elongation ratio, drainage density and bifurcation ratios were used to gain a general understanding of potential runoff and flooding before the application of modeling.
Basin parameters were assigned based on the CN method with lag time and runoff potential for individual basins directly connecting to CN values. For, example the lag time was computed using the SCS method in which the lag time is expressed as a function of the hydraulic length of the watershed, the curve number and the percent slope of the sub-basin. Accurate CN estimates are limited by the unavailability of detailed LULC and soil type data and initial moisture conditions. Determining the local soil’s hydrologic group, for the estimation of CN values required soil data. Soil type data classified the major soil types for the area as Calcids and Entisols, both of the order Aridisol. The soil moisture regime for the area was determined to be Ustic. Aridisols are dry sandy soils that exhibit some development of subsurface horizons, usually high in calcium carbonate, salts or clay accumulation. Ustic soils are soils with limited moisture typically present along the banks of wadis. The sandy nature of Aridisols implies that they belong to hydrologic group A, which corresponds to soils of more than 90% sand and with CN values contributing to lower runoff potentials.
CN values for each LULC type were assigned based on values developed by the U.S. National Resource Conservation Service. The high degree of impervious land cover, especially in urbanized districts, implies much greater CN values would be assigned. Key land use types such as open space, residential, industrial at different intensities, commercial, paved impervious areas and natural desert landscape were used for assigning the appropriate CN values. To account for the estimation uncertainty of land use, soil and antecedent moisture, composite CN for individual basins were computed based on three separate CN profiles. These profiles are shown in
Table 1. The three profiles are: CN-1 (CN profile 1, 10% lower than CN-2) having the lowest potential, CN-2 is based on our best estimate and the literature (e.g., Shanableh [
42], Sherif [
55]) and CN-3 (10% higher than CN-2) having the highest potential for runoff.
Precipitation inputs were based on the IMERG product (the March 2016 event) and the SCS hypothetical type II storm with precipitation values corresponding to 100, 50, 25 and 5 year return periods [
56]. Since HEC-HMS is a lumped model, the IMERG data were processed for each sub-watershed and treated as a single gauge for each sub-watershed. The areal average of all the pixels surrounding the sub-watershed was used to for the HEC-HMS models. The SCS hypothetical storm method was chosen to quantify the impact of urbanization of runoff generation. Key benefits are that a SCS storm distribution contains storm depth information for events of all duration up to 24 hours, provides cumulative rainfall at any point in time and expresses runoff values through computationally simple means. Hypothetical storm type II distribution was selected for its resemblance to extreme precipitation events in this region (e.g., Sharif [
29], Al-Zahrani [
57]).
5.1. Simulation Results
Based on IMERG data the precipitation event started on 21 March 2016 at 11:00 p.m. local time and ended at 08:00 a.m. on 22 March 2016.
Figure 3 shows the spatial distribution of the accumulated event rainfall over the delineated watersheds as estimated by the IMERG. HEC-HMS was used to quantify the volumetric runoff from all coastal watersheds for the March event by simulating the period from 21 March 2016 at 04:00 p.m. local time to 12:00 a.m. on 23 March 2016.
Figure 6 shows the hydrograph and the areal average of the storm event that occurred on March 21, 2016 to the Oman Gulf from the eastern watersheds. The steep rise in the hygrograph indicates the high response of the watershed even though the elevation difference is not very significant. This is mainly due to a significant portion of the watershed is urbanized. The runoff ratio for this event was 15%, which is relatively high for a dry region.
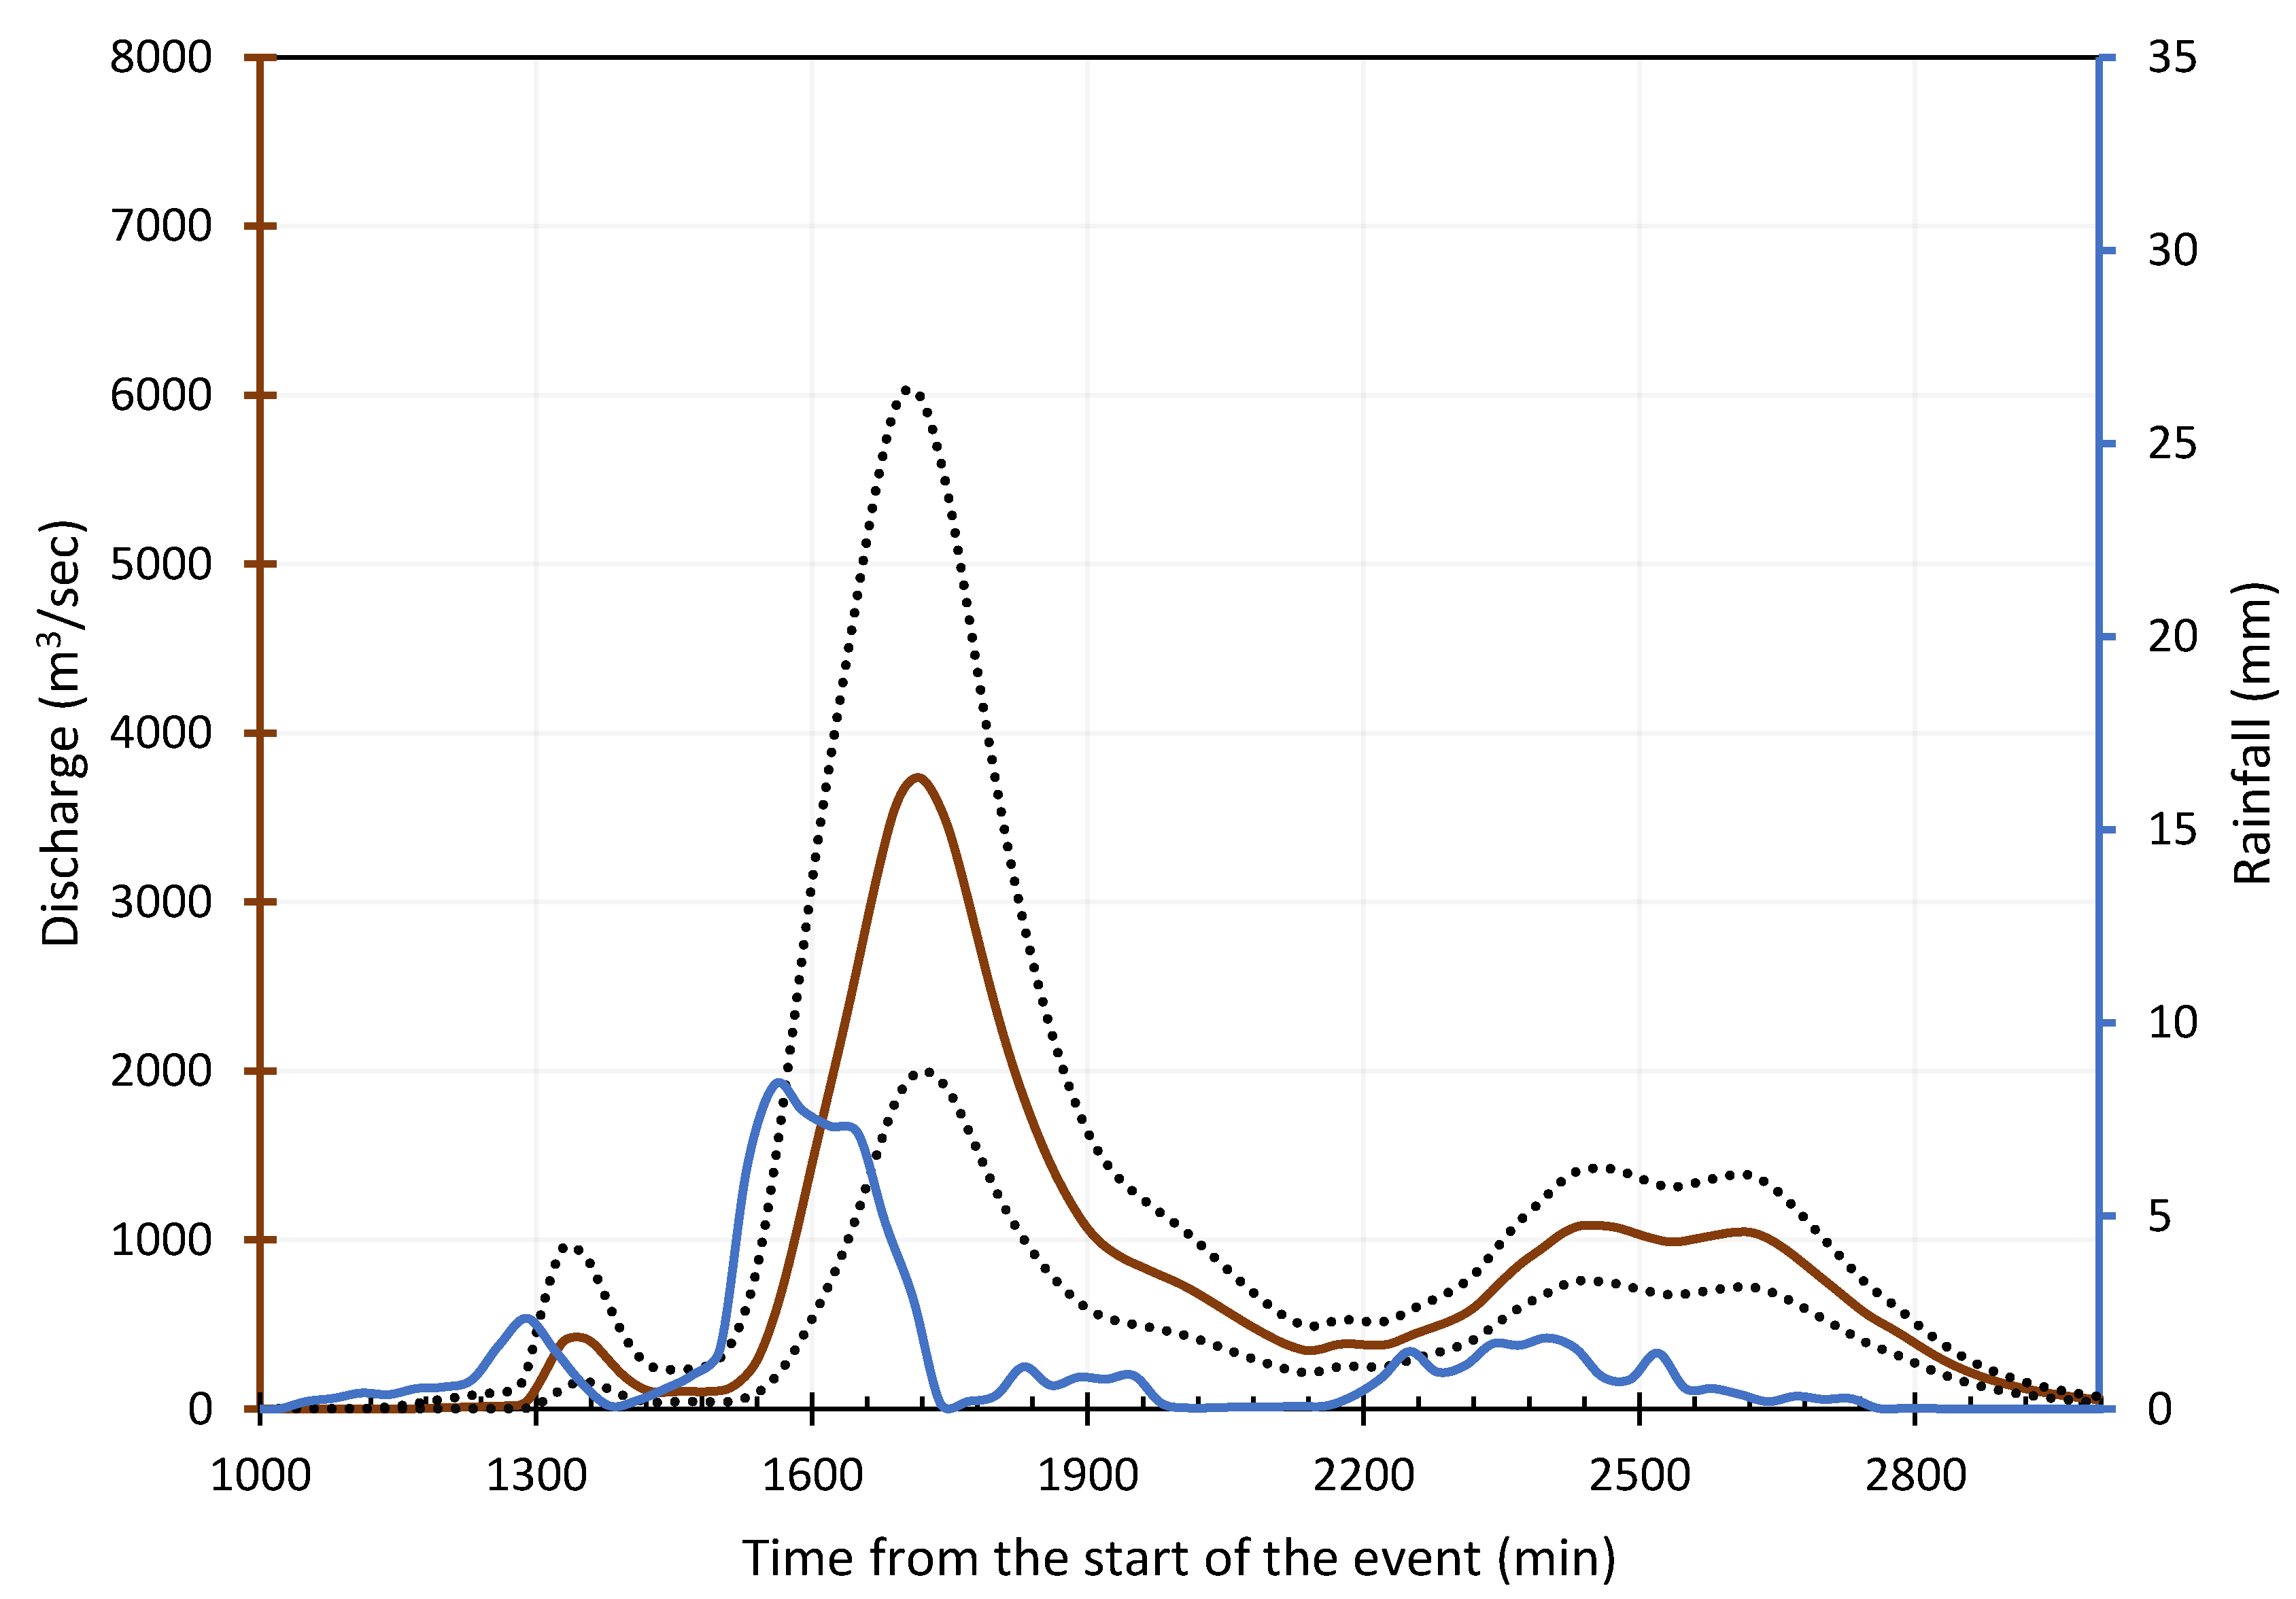
Figure 7 shows the areal average rainfall of the event and the hydrograph of all the watersheds that drain to Arabian Gulf. The uncertainty of the estimated parameter values was represented in the figure by allowing the CN to vary within a 10% range in the model simulations. The total runoff volume into the Gulf of Oman could range between 8.3 and 24.2 MCM and that of the Arabia Gulf could range between 53.4 and 147.03 MCM.
The HEC-HMS model was also used to simulate the response of coastal watersheds to design storms of different return periods.
Table 2 below shows the precipitation and coastal runoff volumes for each annual exceedance probability event. Even frequent events (5-year return period) result in a significant runoff especially for urbanized watershed. The total coastal runoff volume was between about 105.62 and 478.13 million cubic meters (MCM) for the 5-year and 100-year storm events, respectively.
5.2. Spatial Distribution of Runoff
Widespread flooding occurs occasionally in arid and semi-arid regions such as the UAE especially in coastal urban areas. The main driver of such events is the high-intensity rainfall but in the past few decades rapid urbanization has contributed significantly to the frequency and size of such flood events in coastal areas. Although rightfully conceived as hazards, these events provide opportunities for water harvesting and MAR applications. Especially for MAR applications, the most important step is to identify the areas where excess water is available for capturing. However, mapping areas where runoff accumulates is complex because of the many factors involved. Moreover, runoff mapping is an extremely data-intensive procedure requiring detailed information about the channels and watercourses. However, in regions where data is scarce, alternative simpler methods with fewer data requirements can be employed. Analytical Hierarchy Process (AHP) [
58] is a multi-criteria decision analysis method used to study the risk associated with overland flooding. It uses a small number of parameters that are readily available in most catchments. Based on a set of weights the AHP can effectively evaluate choices among alternatives. The method can be applied to overland runoff mapping. In runoff mapping, the main drivers of water accumulation (elevation, slope, land use/land cover, soil type and antecedent moisture) are given different weights. For this study, the direct runoff (excess rainfall) is dependent on the effect of land use, soil type and antecedent moisture on flooding potential (Ia and S in CN method). Based on these parameters, AHP was used to map the area’s most vulnerable to runoff accumulation.
To illustrate the approach, AHP was applied to map the areas of runoff accumulation on two watersheds: The Fujairah watershed on the Gulf of Oman coast and the Sharjah watershed on the Arabian Gulf coast. The Fujairah watershed has an area of about 256 km2 and is located over the eastern mountain region, with a small portion developed area near the outlet at the coast of Gulf Oman. Sharjah watershed is about 140 km2 in size and is composed of mostly urban developed area near and around of the coastal city of Sharjah on the Arabian Gulf.
The elevation difference is high in the Fujairah watershed reaching as high as 1112 m above MSL. The watershed is quite steep with a maximum slope of around 87° and an average slope of 66°. The fast hydrologic response of the watershed is due to the mountainous upstream landscape. The watershed is located on ophiolite mountain aquifers covering the entire eastern coast of the UAE. The hard and compact igneous and metamorphic rocks of the semail ophiolite complex provide for rapid runoff for wadi aquifer storage and freshwater springs that are mostly ephemeral and have few perennial supplies [
59]. The salinity of groundwater in the watershed is less than 2000 mg/L with major salts composed of Bicarbonate and magnesium chloride [
60]. In contrast, the Sharjah watershed is almost flat with a maximum elevation of 60 m above MSL The average slope of the watershed is about 30°. Hence, the response time of the watershed is much slower than that of the Fujairah watershed. The aquifer beneath the watershed is located in the Sand Dune and Coastal Sabkha areas [
59]. This aquifer is highly saline with a salinity level ranging between 10,000 (high brackish) and 275,000 mg/L (hyper-saline) [
60]. The groundwater level is very shallow (less than 10 m deep) with Sodium-Chloride as the main salt.
The AHP procedure started with the development of three layers (as raster) for the two watersheds: slope, elevation and excess rainfall (direct runoff, see Equations (2) and (3)). Each of the three layers was reclassified into five zones according the values of the variable. A value of 5 represents the range of the variable corresponding to highest runoff accumulation potential and a value of 1 corresponds to the lowest potential. Steep slopes are assigned a value of 1 since they are inversely related to runoff accumulation and lower degree slopes were assigned 5. The same classification was applied to the elevation but the opposite assignment was used for excess rain because it is directly related to flooding. Since the main cause for runoff accumulation is excess rainfall, it was given the greater weight of 60% and the rest 40% were shared among elevation and slope [
61].
Combinations of the weights and classes resulted in the development of the maps shown in
Figure 8 and
Figure 9 for the Fujairah and Sharjah watersheds, respectively. The areas delineated in the two figures provide information on where MAR may be applied if the other factors such as the built environment, zone and drainage oversight regulation allow such applications. The Elevation map in
Figure 8A shows that a significant part of the Fujairah watershed prone to flooding is located near the outlet. The same areas are also identified to be in high risk of flooding by the slope data (
Figure 8B). The AHP analysis indicated that 5% of the watershed was flagged as flooded in the 21 March 2016 event. The flooded area was located in the watersheds with high excess rain in
Figure 8C. This is due to the fact that the excess rain was given a higher (60%) weight than the other two variables. The Elevation map in
Figure 9A shows that a significant part of the Sharjah watershed is flat, especially in the coastal area. The AHP analysis indicated that 8% of the watershed was flagged as flooded in the 21 March 2016 event. The flooded area, which is almost 11.5 km
2, was located in two watersheds that both have a high risk of flooding (see red regions in
Figure 9D).
5.3. Impacts of Urbanization
As mentioned earlier, the runoff potential depends not only on the storm characteristics but also on the built environment and on how it will evolve in the future. In order, to highlight the impact of expansion of urban areas on runoff potential (and consequently MAR opportunities), we estimate what would have been (or would be) the runoff volumes should that have occurred in the past or future by running HEC-HMS model under different urbanization levels. As explained above, most of the model parameters depend on land use—primarily the percentage of impervious cover, which significantly affects the value of the CN. The process starts by first assuming a value for the urbanized fraction, then computing the HEC-HMS parameters based on that value and then running the model using the parameters corresponding to that urbanization level. The model is run 10 times by varying the urbanization level and thus the impervious fraction. This is done three times for each watershed by changing the rainfall input to correspond to different return periods (5, 25 and 100 years—a total of 30 model runs for each watershed). The Fujairah watershed is currently at less than 10% urbanization while the Sharjah watershed is 60% urbanized (2016 land use data estimated from Google Earth’s aerial imagery [
62]). The impact of urbanization in flooding potential of the two watersheds expressed as the percentage change in peak discharge as a function of the watershed level of urbanization relative to the current levels, for the 5-year, 25-year and 100-year storms. The current fractions of the urban area represent the reference urbanization levels for the two watersheds. As expected, the impact of the urbanization will affect lower return period storms more than the more extreme ones for both watersheds as shown in
Figure 10; that is, the smaller events are affected more by the change in land use (e.g., 5-year event vs 100-year event). For the Fujairah watershed, full urbanization of the inhabited area of the watershed would increase the runoff volume by 28% for the 5-year return period storm. The expected increase in the runoff volume would be 16% and 12% for the 25-year and 100-year return periods, respectively. On the other hand, full urbanization of the Sharjah watershed would increase the runoff volume by 38%, 25% and 20% for the 5-year, 25-year and 100-year return periods, respectively. Urbanization, in general, will not only increase the runoff volumes but will also increase the spread of runoff (
Figure 8;
Figure 9) and the potential for MAR application. The sensitivity to expansion of urban areas will be even higher for the more frequent storms (i.e., return period less than 5 years), which would, in turn, increase the return from MAR applications.
6. Summary and Conclusions
Recent flooding events in the Middle East have made coastal flooding assessment in the UAE very relevant. This paper attempts to quantify the volume of coastal runoff in the UAE and explore the potential for capturing excess runoff to recharge coastal aquifers. Remote sensing data and GIS techniques were used to prepare inputs for hydrologic and hydraulic models, with the former based on the very popular Curve Number (CN) approach. Use of empirically based quasi-distributed models, such HEC-HMS, allowed a preliminary quantification of the volumes of water that drain into the sea after extreme events. To account for the lack of detailed land surface information ground validation data, a relative uncertainty of 10% is assumed for the estimated Curve Numbers. Although exact spatial distribution of excess direct runoff depth could not be determined, locations associated with ponding and slow movement of water were identified through AHP, which can serve as guidance on where to apply low impact development and Managed Aquifer Recharge (MAR) methods. Select basin characteristics indicated susceptibility to flooding. As expected, rapid urbanization is leading to more runoff generation, which increases the flood hazard while creating opportunities for Managed Aquifer Recharge (MAR) measures. Unlike dam construction, the proposed MAR approach will try to return the local water cycle to it is natural conditions by injecting the excess rainfall caused by urbanization into the ground, which my help restore environmental balance.
The approach used here to quantify and locate runoff assist in the planning of future urban planning, as demonstrated by quantifying runoff under different urbanization scenarios. The results of this study indicate that rapid urbanization can significantly increase the runoff volumes resulting from a given storm and therefore the potential for capturing the excess runoff. The impact of urbanization was also found to be higher for small and moderate rainfall events than for larger events meaning that MAR application opportunities may become a reliable viable source of badly needed fresh water.
This study represents an attempt to investigate the true potential for another source of water that can be included in an engineering approach to simultaneously mitigate floods and droughts in a hyper-arid region. We do not argue that all the excess runoff in coastal areas we estimated will be captured. However, we provide key information needed for a comprehensive water resources management policy that includes cost-effective water saving and capturing technologies, enhanced economic policies, sound water-related regulations and public education. For example, in September 2017 the Ministry of Energy & Industry unveiled the UAE Water Security Strategy 2036, which aims to ensure sustainable access to water during both normal and emergency conditions in line with local regulations, standards of the World Health Organization and the UAE’s vision to achieve prosperity and sustainability. Capturing runoff water can significantly augment groundwater storage, a key source identified in the UAE Water Security Strategy 2036 together with desalinated and recycle water.
Accurate quantification of coastal runoff is not only helpful for properly investigating MAR opportunities but also to provide tools for policy makers, urban planners and city managers that will ultimately guide them through the decision process of reducing the impacts of future events. Knowing that climate change is influencing the frequency and intensity of storms and floods, it is important to demonstrate that the impact associated with those events heavily depends on urban development, especially along the coast and in urban centers. Our work does not only provide new insights for policy makers and city planners but it also describes the tools that can be used to better manage the challenges posed by these climate extremes. Effective runoff management requires a good understanding of catchment response to rainfall events and the different factors that influence this. Successful planning studies require not only reliable rainfall estimation and hydrologic modeling methodologies such as those employed in the present study but also reasonable projections of the growth of the built area. Remote sensing and GIS technologies make such studies easier with their spatial analysis tools and data management capabilities. Sustainable development could reduce the country’s vulnerability to flood and drought extremes.
In addition to flood control, MAR benefits in the UAE coastal regions may include mitigation against sea level rise through subsidence control, water supply augmentation during droughts, reduction of aquifer salinity, rehabilitation of ecosystems, cleansing polluted runoff and preventing excessive runoff into the Gulf that can contribute to red tide events. However, MAR has some downsides that need to be addressed. The local hydrogeology, aquifers, direction of groundwater flow and quality of runoff must be studied before any implementation. A detailed cost-benefit analysis that will consider the costs of infrastructure to capture, transport, treat and store excess must be conducted.
The results presented were based on the land use and soil data available at the time of publication. Before implementing a MAR project, aquifer properties including storage, lithology, groundwater flow and water levels need to be studied in detail. The most recent (or even projected) characteristics of the built environment need to be taken into consideration. Another limitation of the study is that spatial distribution of water supply and demand was not investigated, an important factor for deciding whether and where MAR projects are needed. Finally, existing water harvesting efforts need to be considered in MAR feasibility studies.


