Article

Residents’ Willingness to Participate in Green Infrastructure: Spatial Differences and Influence Factors in Shanghai, China

1
School of Environmental and Geographical Sciences, Shanghai Normal University, Shanghai 200234, China
2
Institute of Urban Studies, Shanghai Normal University, Shanghai 200234, China
3
State Key Laboratory of Estuarine and Coastal Research, East China Normal University, Shanghai 200062, China
4
Department of Hydraulic Engineering, Delft University of Technology, 1 Stevinweg, 2628 CN Delft, The Netherlands
*
Author to whom correspondence should be addressed.
Sustainability 2019, 11(19), 5396; https://doi.org/10.3390/su11195396
Submission received: 30 August 2019 / Revised: 19 September 2019 / Accepted: 26 September 2019 / Published: 29 September 2019

Abstract

:
Green infrastructure (GI) plays a fundamental role in achieving urban pluvial flood management, mitigating urban heat island effect, and improving living suitability. Residents’ participation is the main driving force of GI implementation. Based on semi-structured interviews, GIS spatial analysis, and multiple regression, we investigated residents’ willingness to participate in the implementation of GI in public and private space and identified the influence factors in Shanghai, China. The results show that, compared with private space, residents prefer to implement GI in public space, where they have different preferences of GI measures. On urban scale, residents’ willingness to participate in the implementation of GI in private space is characterized as “high in the inner city, low in the suburban areas”, while the spatial difference is insignificant for public space. In addition, the factors affecting residents’ willingness to participate in the implementation of GI are different in private and public space. The deterministic factors of GI participation are gender, education level, and floor for private space, while only include building age for public space, in addition to the common factors of free time, cognition of GI, perception of pluvial flood risk, supportive factors, and environment-improving factors that can influence both private and public space GI participation. Our analysis therefore provides valuable information for policymakers concerning nature-based solutions to climate change adaptation and urban sustainability.

1. Introduction

In the context of climate change and rapid urbanization, pluvial flooding has posed an increasing challenge for urban sustainability and residents’ well-being [1,2,3]. Nature-based solutions represented by green infrastructure (GI) to address the issues have been highlighted internationally in achieving ecosystem’s flood regulation service (EFRS) [4,5,6,7,8,9]. The Environmental Protection Agency (EPA) [10] suggested that “Compared to conventional pluvial flood management approaches, GI has great ecological and environmental benefits, such as reducing urban heat island effect, achieving pluvial flood management, improving water quality”. Beauchamp and Adamowski [11] reviewed GI development and management in Europe and North America, indicating that GI also has a potential for aesthetics and psychological benefits. GI is widely recognized and practiced, with various adaptive measures, such as rain garden, roof greening, residential rain collection facilities, and permeable pavement, to achieve on-site management of pluvial flooding through soil and vegetation natural processes [12,13,14,15]. China has also proposed a similar concept of “Sponge Cities” [16,17]. In addition, GI is relatively fast, low-cost, and has broad public appeal [18,19].
Despite GI having many merits, the public lacks the motivation to participate in the implementation of GI, and GI implementation sometimes faces many obstacles in practice [20,21,22,23,24,25,26,27]. According to an NRC study [28], there are three major barriers to urban storm water-related GI: institutional, technological, and perceptual. Clean Water America Alliance (CWAA) [12] reported the common issues interwoven with technical and physical barriers to GI implementation including lack of understanding and cognition of GI and its benefits; deficiency of data demonstrating benefits, costs and performance; insufficient technical knowledge and experience; lack of design standards; and best management practices. Matthews et al. [29] and Cousins [30] found that the main obstacles to residents’ participation in the implementation of GI were lack of policy innovation, which was mainly related to GI planning and design, and post-maintenance. After reviewing studies related to the practice of GI implementation in Western countries, Dou et al. [31] suggested that the biggest limitation in China is the lack of policy guarantees in GI implementation. Brown et al. [32] found that residents in a community of Chicago are more willing to build rain barrels in private space, mainly because they can be used as a water storage device that is both environment-friendly and can be used for car wash and other values. However, some people hold the opposite attitude, believing that rain barrels will cause dampness and loss of leisure space, and is subject to installation costs, technical trust, etc. Keeley [33] and Faehnle et al. [22] conducted interviews with government policymakers, planning practitioners, residents and other stakeholders to show that residents have low perception level of local natural disasters, and the main obstacles for GI implementation are living experience and funding issues. Besides, Baptiste et al. [34] analyzed the factors affecting residents’ participation in the implementation of GI on private space in a typical community in New York, USA. They suggested that residents’ perception of pluvial flooding and GI is the key factor affecting the implementation, which is influenced by various factors, such as the residents’ social attributes (gender and education level) and the cost-effectiveness of GI. In addition, Byrne et al. [35] took tree plant activities in public space as a case study, developed a model combining residents’ social variables (e.g., gender, age, and education level) and tree benefit perception, and found that older people with higher tree benefit perception are more willing to plant trees in public space to promote climate adaptation change in Hangzhou, China. Beery et al. [36] suggested that improving residents’ cognition of GI and perception of pluvial flood risk play an important role in promoting residents’ active participation in the implementation of GI. In general, many studies suggested that public involvement is needed, and the barriers to implementation are policy, technology, perception, funding, residents’ living experiences, etc. However, few studies outline processes for gauging residents’ perceptions of GI, their willingness to participate in the implementation of GI in public and private space, and its influence factors.
The objective of our study was to explore the willingness and influence factors of residents to participate in implementation of GI in private (house courtyards, balconies, etc.) and public space (streets, parks, etc.). Based on the literature review above, the research hypotheses are as follows: (1) the residents’ willingness to participate in the implementation of GI has spatial difference in public and private space; (2) the factors affecting the residents’ willingness to participate in the implementation of GI include technology, policy, funding, perception, socio-economic attributes and geographical location; and (3) the factors have different influences on the residents’ willingness to participate in the implementation of GI in public and private space.

2. Materials and Methods

2.1. Methods

The research framework of this study is shown in Figure 1. First, the socio-economic attributes and characteristics of residents were defined. Second, the assumed influence factors on residents’ willingness to participate in implementation of GI were the residents’ cognition of GI; their perception of pluvial flood risk; and the factors of policy, technology, funding, etc. Finally, a multivariate regression model was employed to illustrate which key factors affect residents’ willingness to participate in implementation of GI in private and public space.

2.1.1. Questionnaire Survey

According to the research hypotheses, a closed-ended questionnaire was used in the survey, which was designed to consist of five parts. The first part is about the socio-economic attributes of the interviewees. The second and third parts show the respondents’ cognition of GI and the perception of pluvial flood risk. The fourth part requests respondents to indicate their level of agreement or disagreement (on a five-point Likert scale: 1 = strongly disagree; 3 = neutral; 5 = strongly agree) with 30 questions related to policy, technology, funding, and other influence factors [25,35,37,38]. Finally, the willingness to adopt different GI measures were determined by the statements related to the attitude to participate in the implementation of GI in private and public space on a five-point Likert scale.

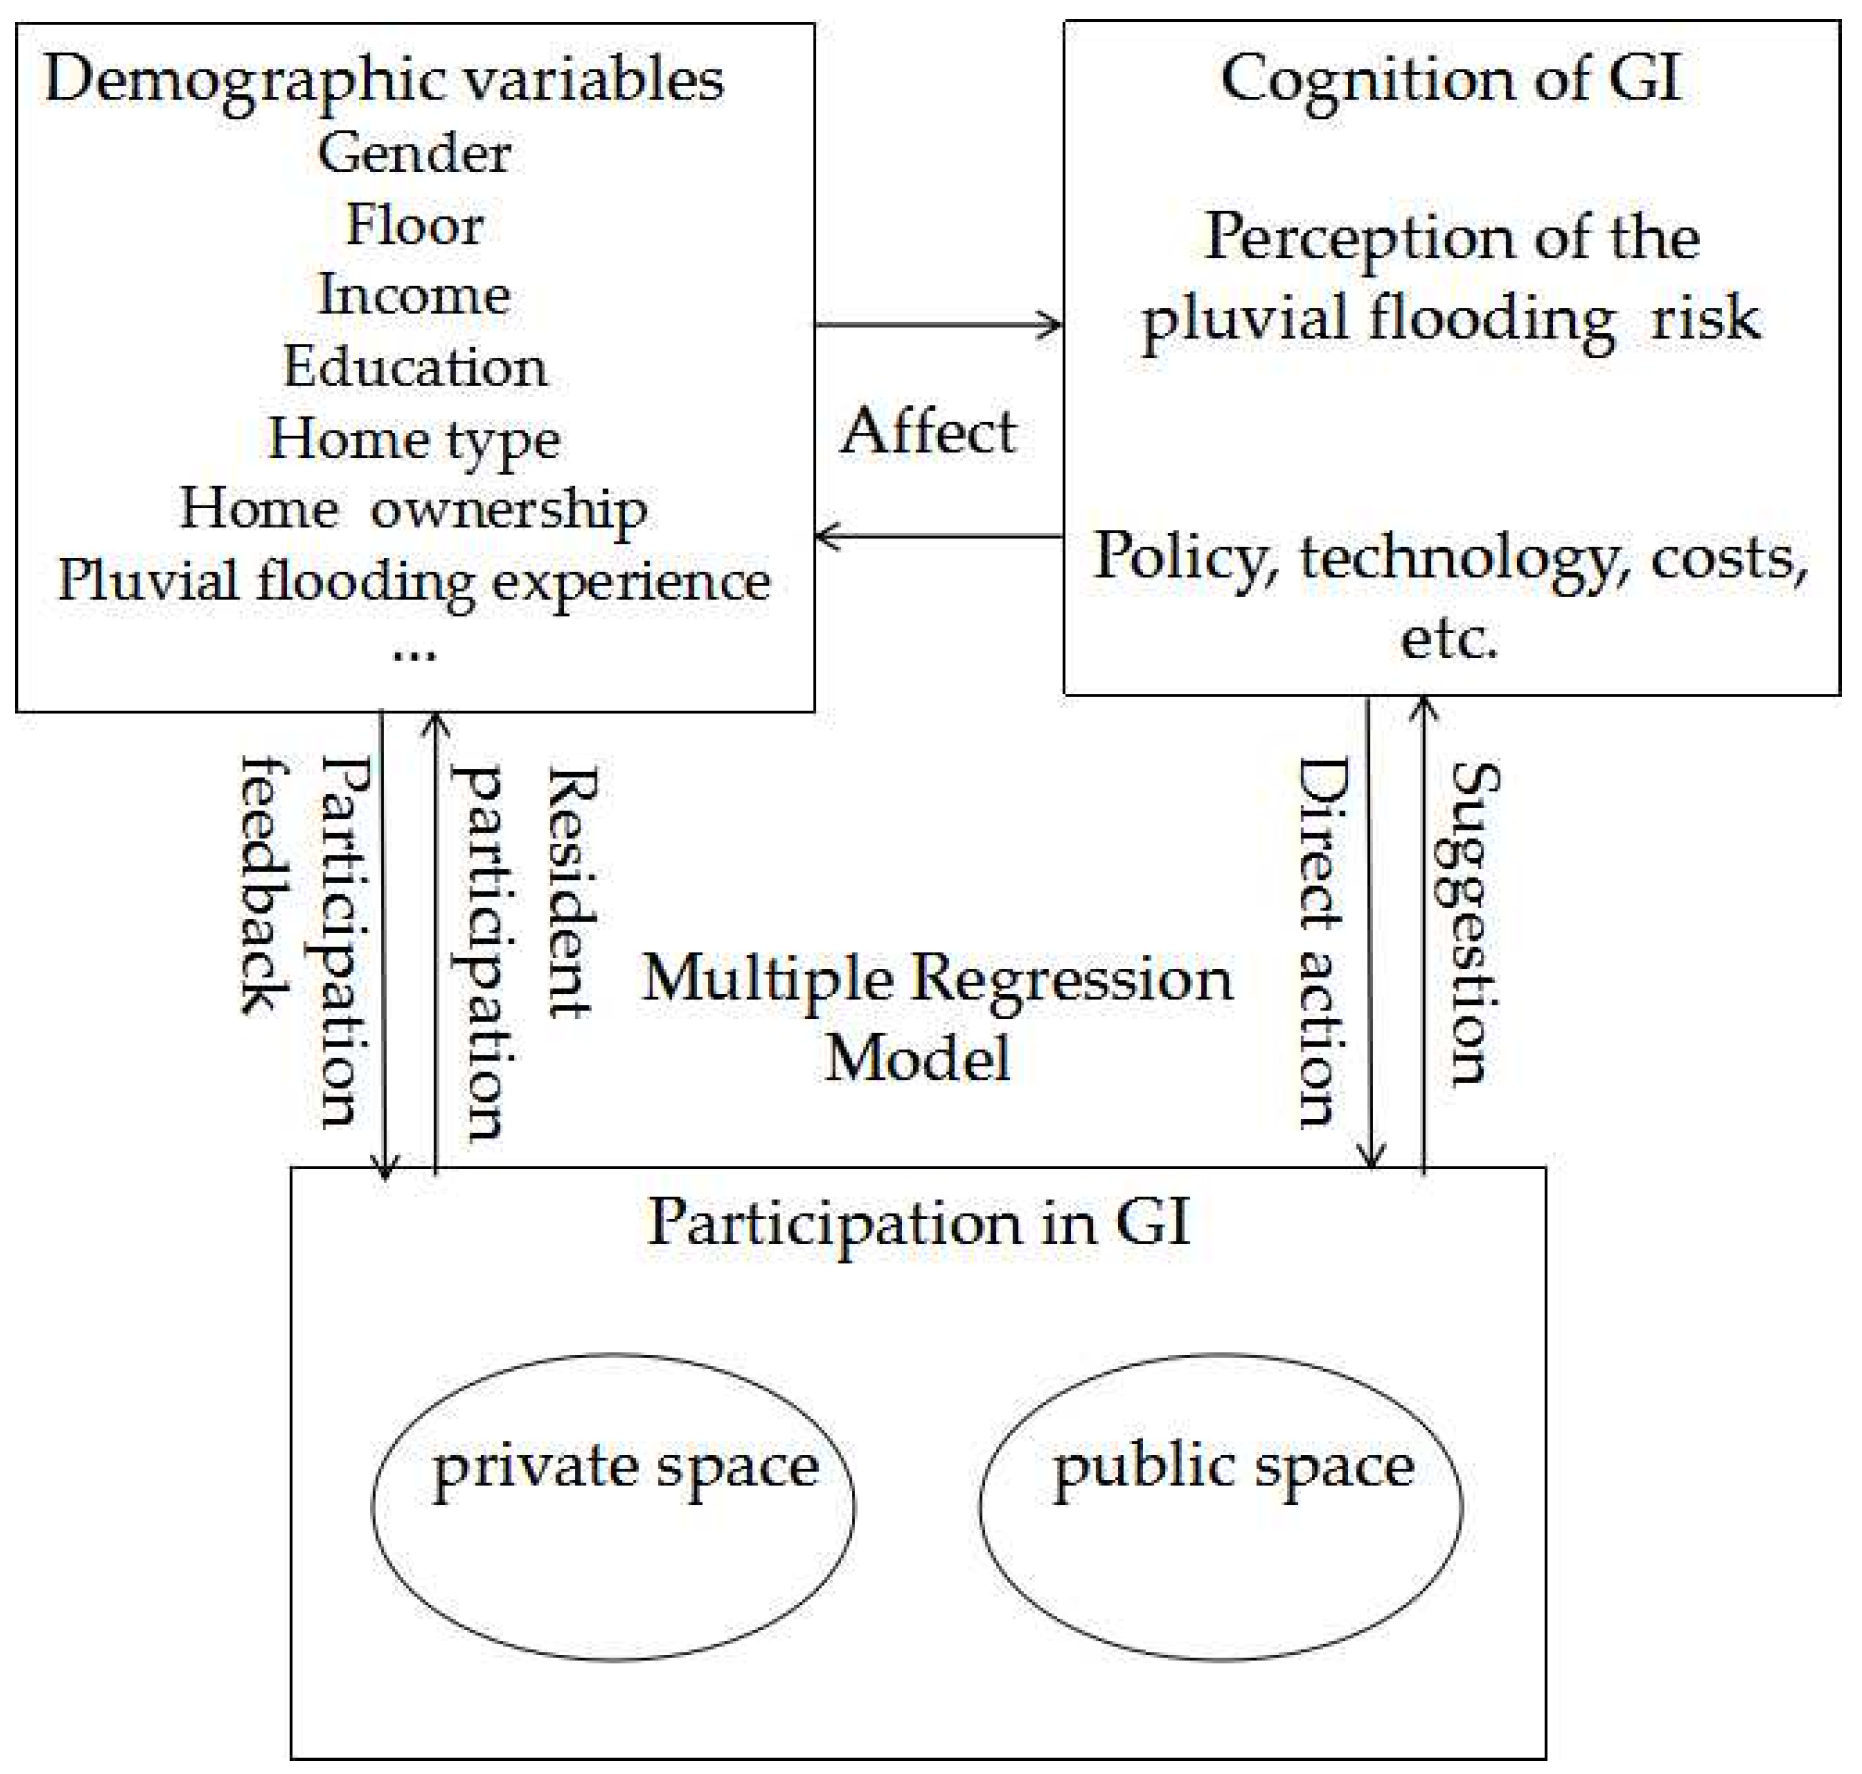
2.1.2. Analysis Methods
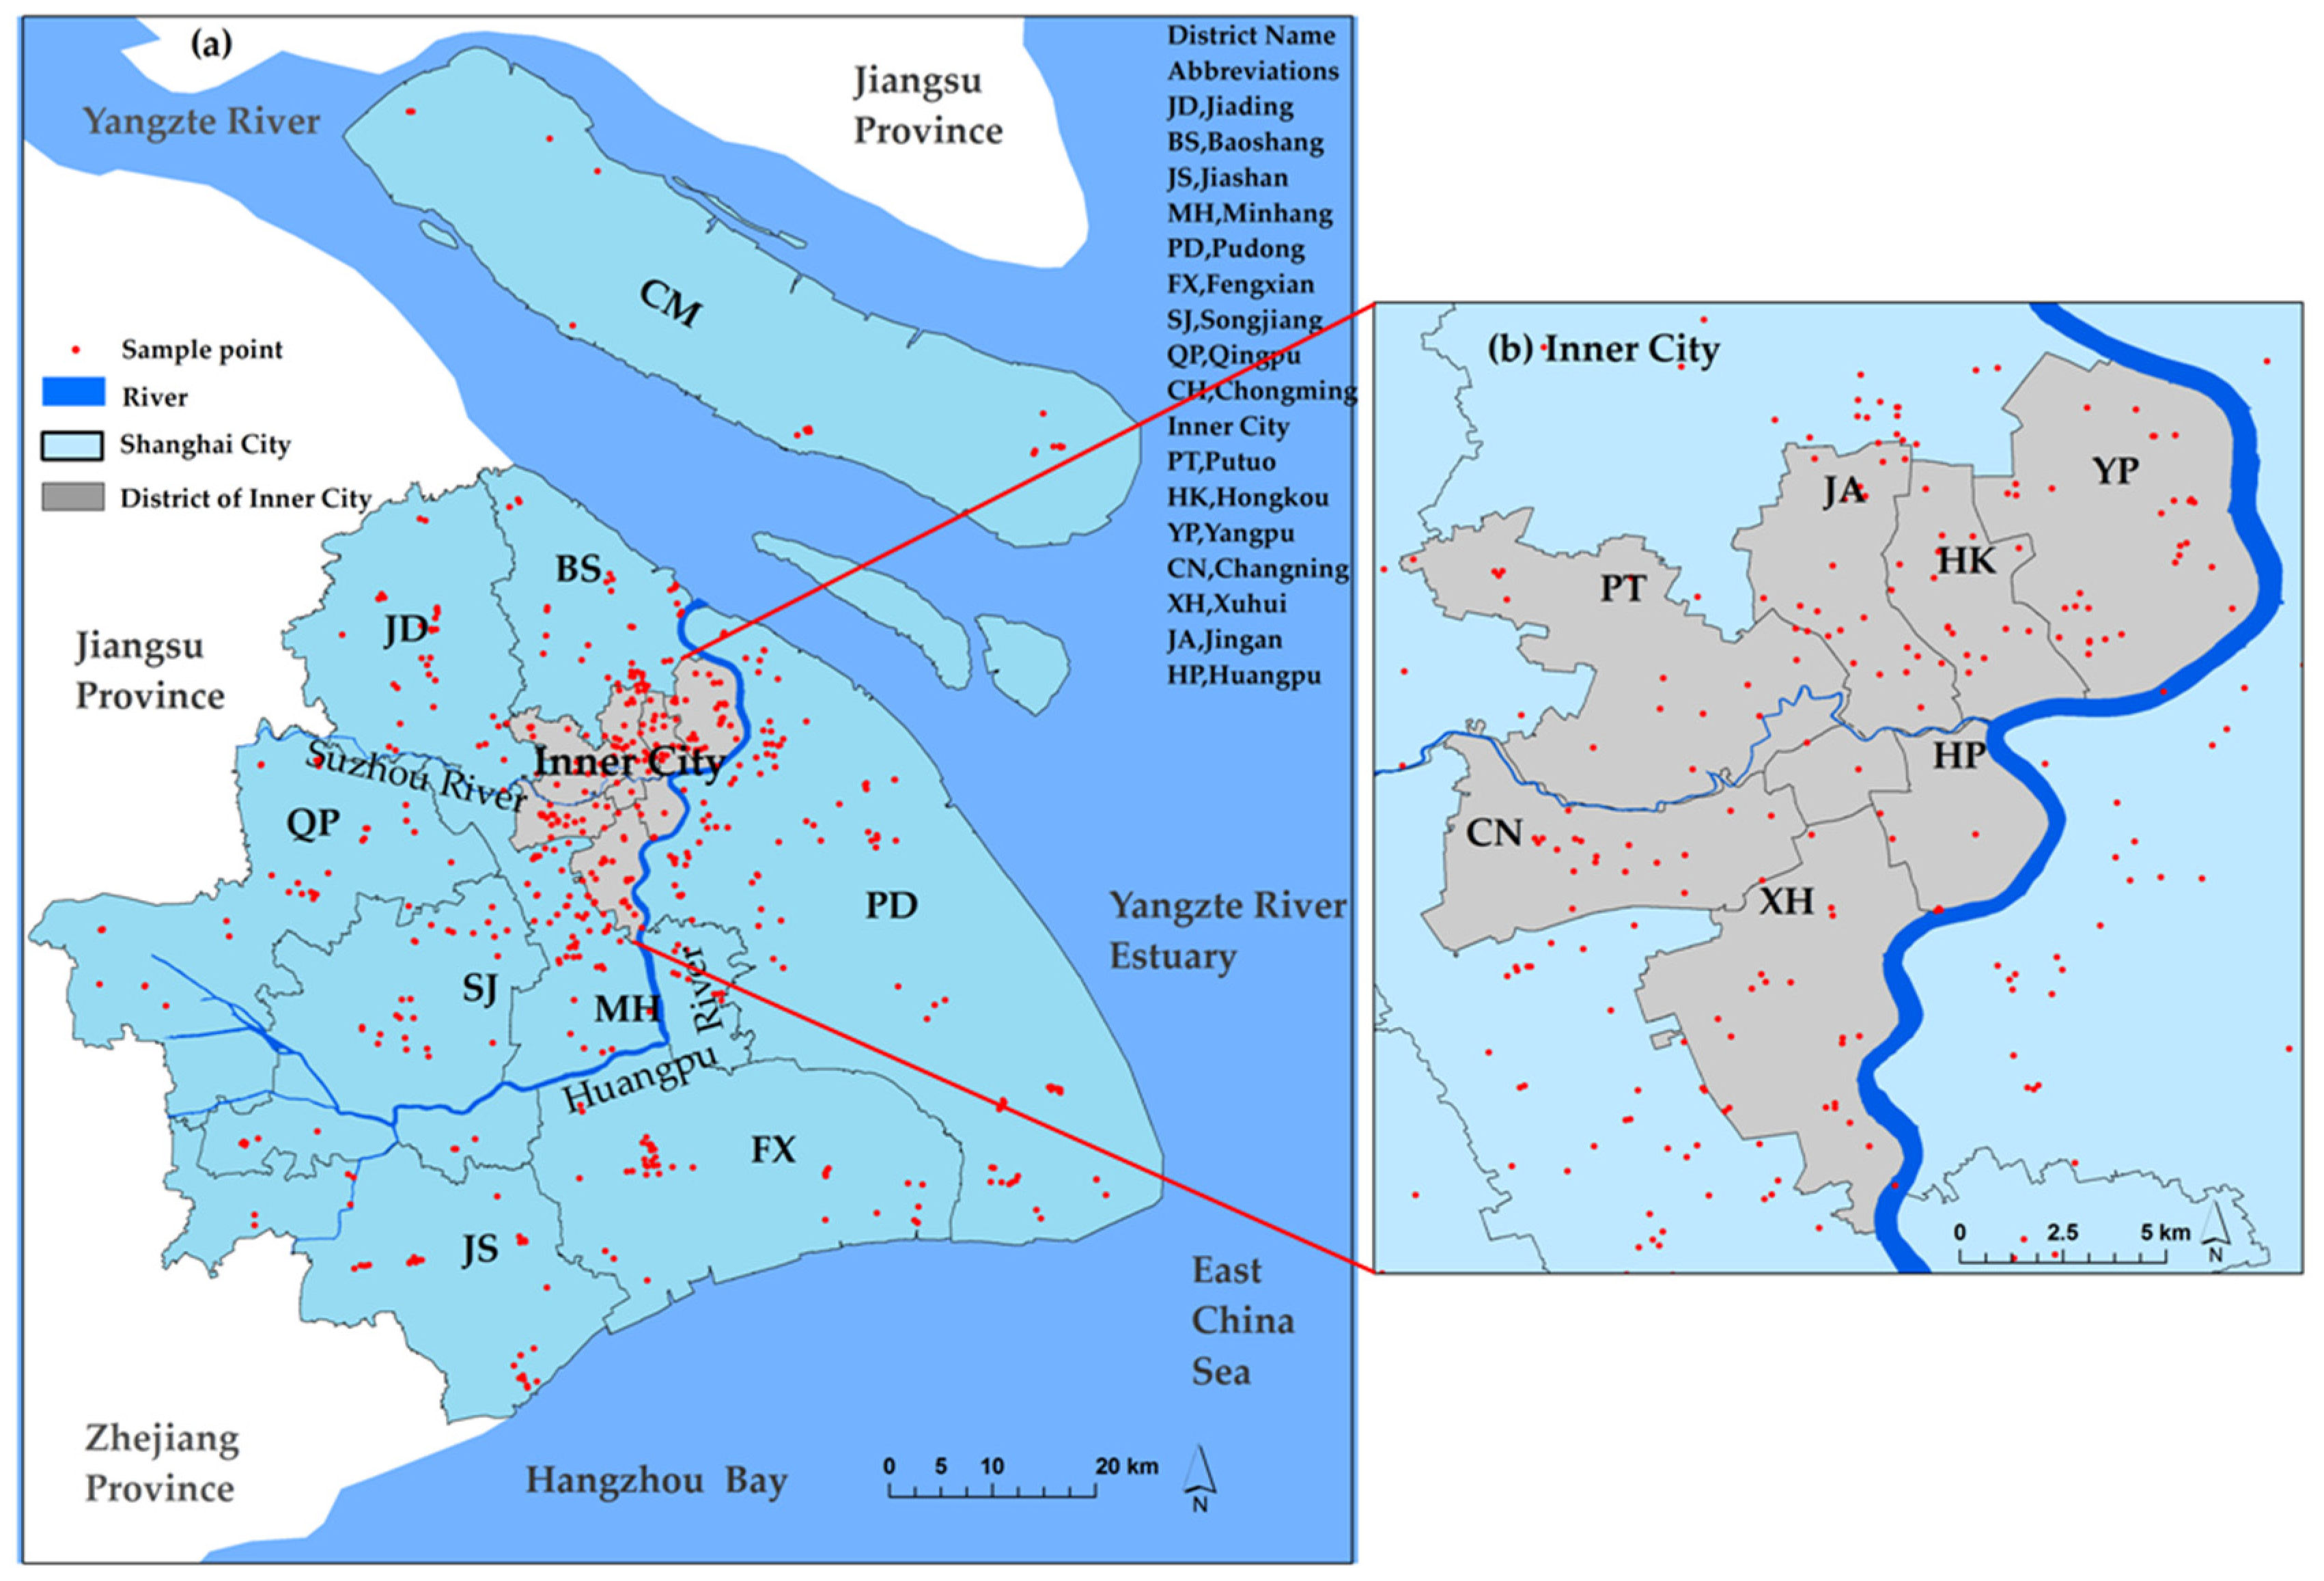
Qualitative research, multiple regression, logistic regression, and data coding are often used to study factors affecting residents’ willingness to participate in the implementation of GI [33,34]. Because there are many factors affecting residents’ willingness, and there may be some correlation between indicators, in this study, we used principal component analysis (PCA) to classify 30 influence variables. On this basis, we used multiple regression models to further explore the influence factors and their mechanisms of behaviors based on the analysis of residents’ participation level. The basic model is:
y = α 0 + α 1 x 1 i + α 2 x 2 i + + α n x ni + u i
where “y” is the dependent variable, representing residents’ willingness to participate in the implementation of GI; “x” is the explanatory variables, including the cognition of GI and the perception of pluvial flood risk, socio-economic characteristics, geographical location, and the related policy, technology, and funding classified by PCA; “i” represents different individuals; α is the regression coefficient; and “ui“ is a noise component.

2.2. Study Area

This study took Shanghai City as a study area. Shanghai is one of the largest coastal megacities in the world, with a population of 24.18 million and a population density of 3814 person/km2 in 2017. Located at the mouth of the Yangtze River, the whole city situates in a flat and low-lying coastal region with an average elevation of about 4 m. There are 16 districts, including the inner city (Jingan, Yangpu, Hongkou, Putuo, Changning, Huangpu, and Xuhui Districts), the suburban areas (Baoshan, Jiading, Pudong and Minhang Districts) and the outer suburban areas (Chongming, Fengxian, Jinshan, Songjiang and Qingpu Districts) (Figure 2). A subtropical monsoon climate results in an annual average precipitation of 1170 mm, which is concentrated (69%) during the wet season from April to September [39]. Heavy rainstorms are frequent due to the influence of thunderstorms, Meiyu front and typhoons [40].
The percentage of impervious surface is approximately 81% in the inner city [41]. The per capita public green area of the city is only 9.21 m2 [42]. A lack of space for citizens’ ecological recreation, the risks of pluvial flooding and high-temperature events in the city have become severe urban problems in Shanghai. Because of the capacity of the urban drainage system and impacts of rapid urbanization, pluvial flooding presents a strong increasing trend over the recent several decades in Shanghai [43]. Shanghai is listed as a pilot of the Chinese national “Sponge Cities” project [9]. In this context, it is helpful to discuss residents’ willingness to participate in GI and its influence factors.

2.3. Data

The data for this study were mainly acquired from the questionnaire survey of Shanghai residents’ willingness to participate in the implementation of GI from June to October 2018. The survey was conducted for residents who were 12 years or older and had lived for more than one year in Shanghai. The survey spatially covered typical urban communities in the inner city, suburban areas and outer suburban areas in Shanghai. In total, 598 questionnaires were collected, of which 588 were valid. The spatial distribution of survey samples and the socio-economic attributes of respondents are shown in Figure 2 and Table 1, respectively.

3. Results

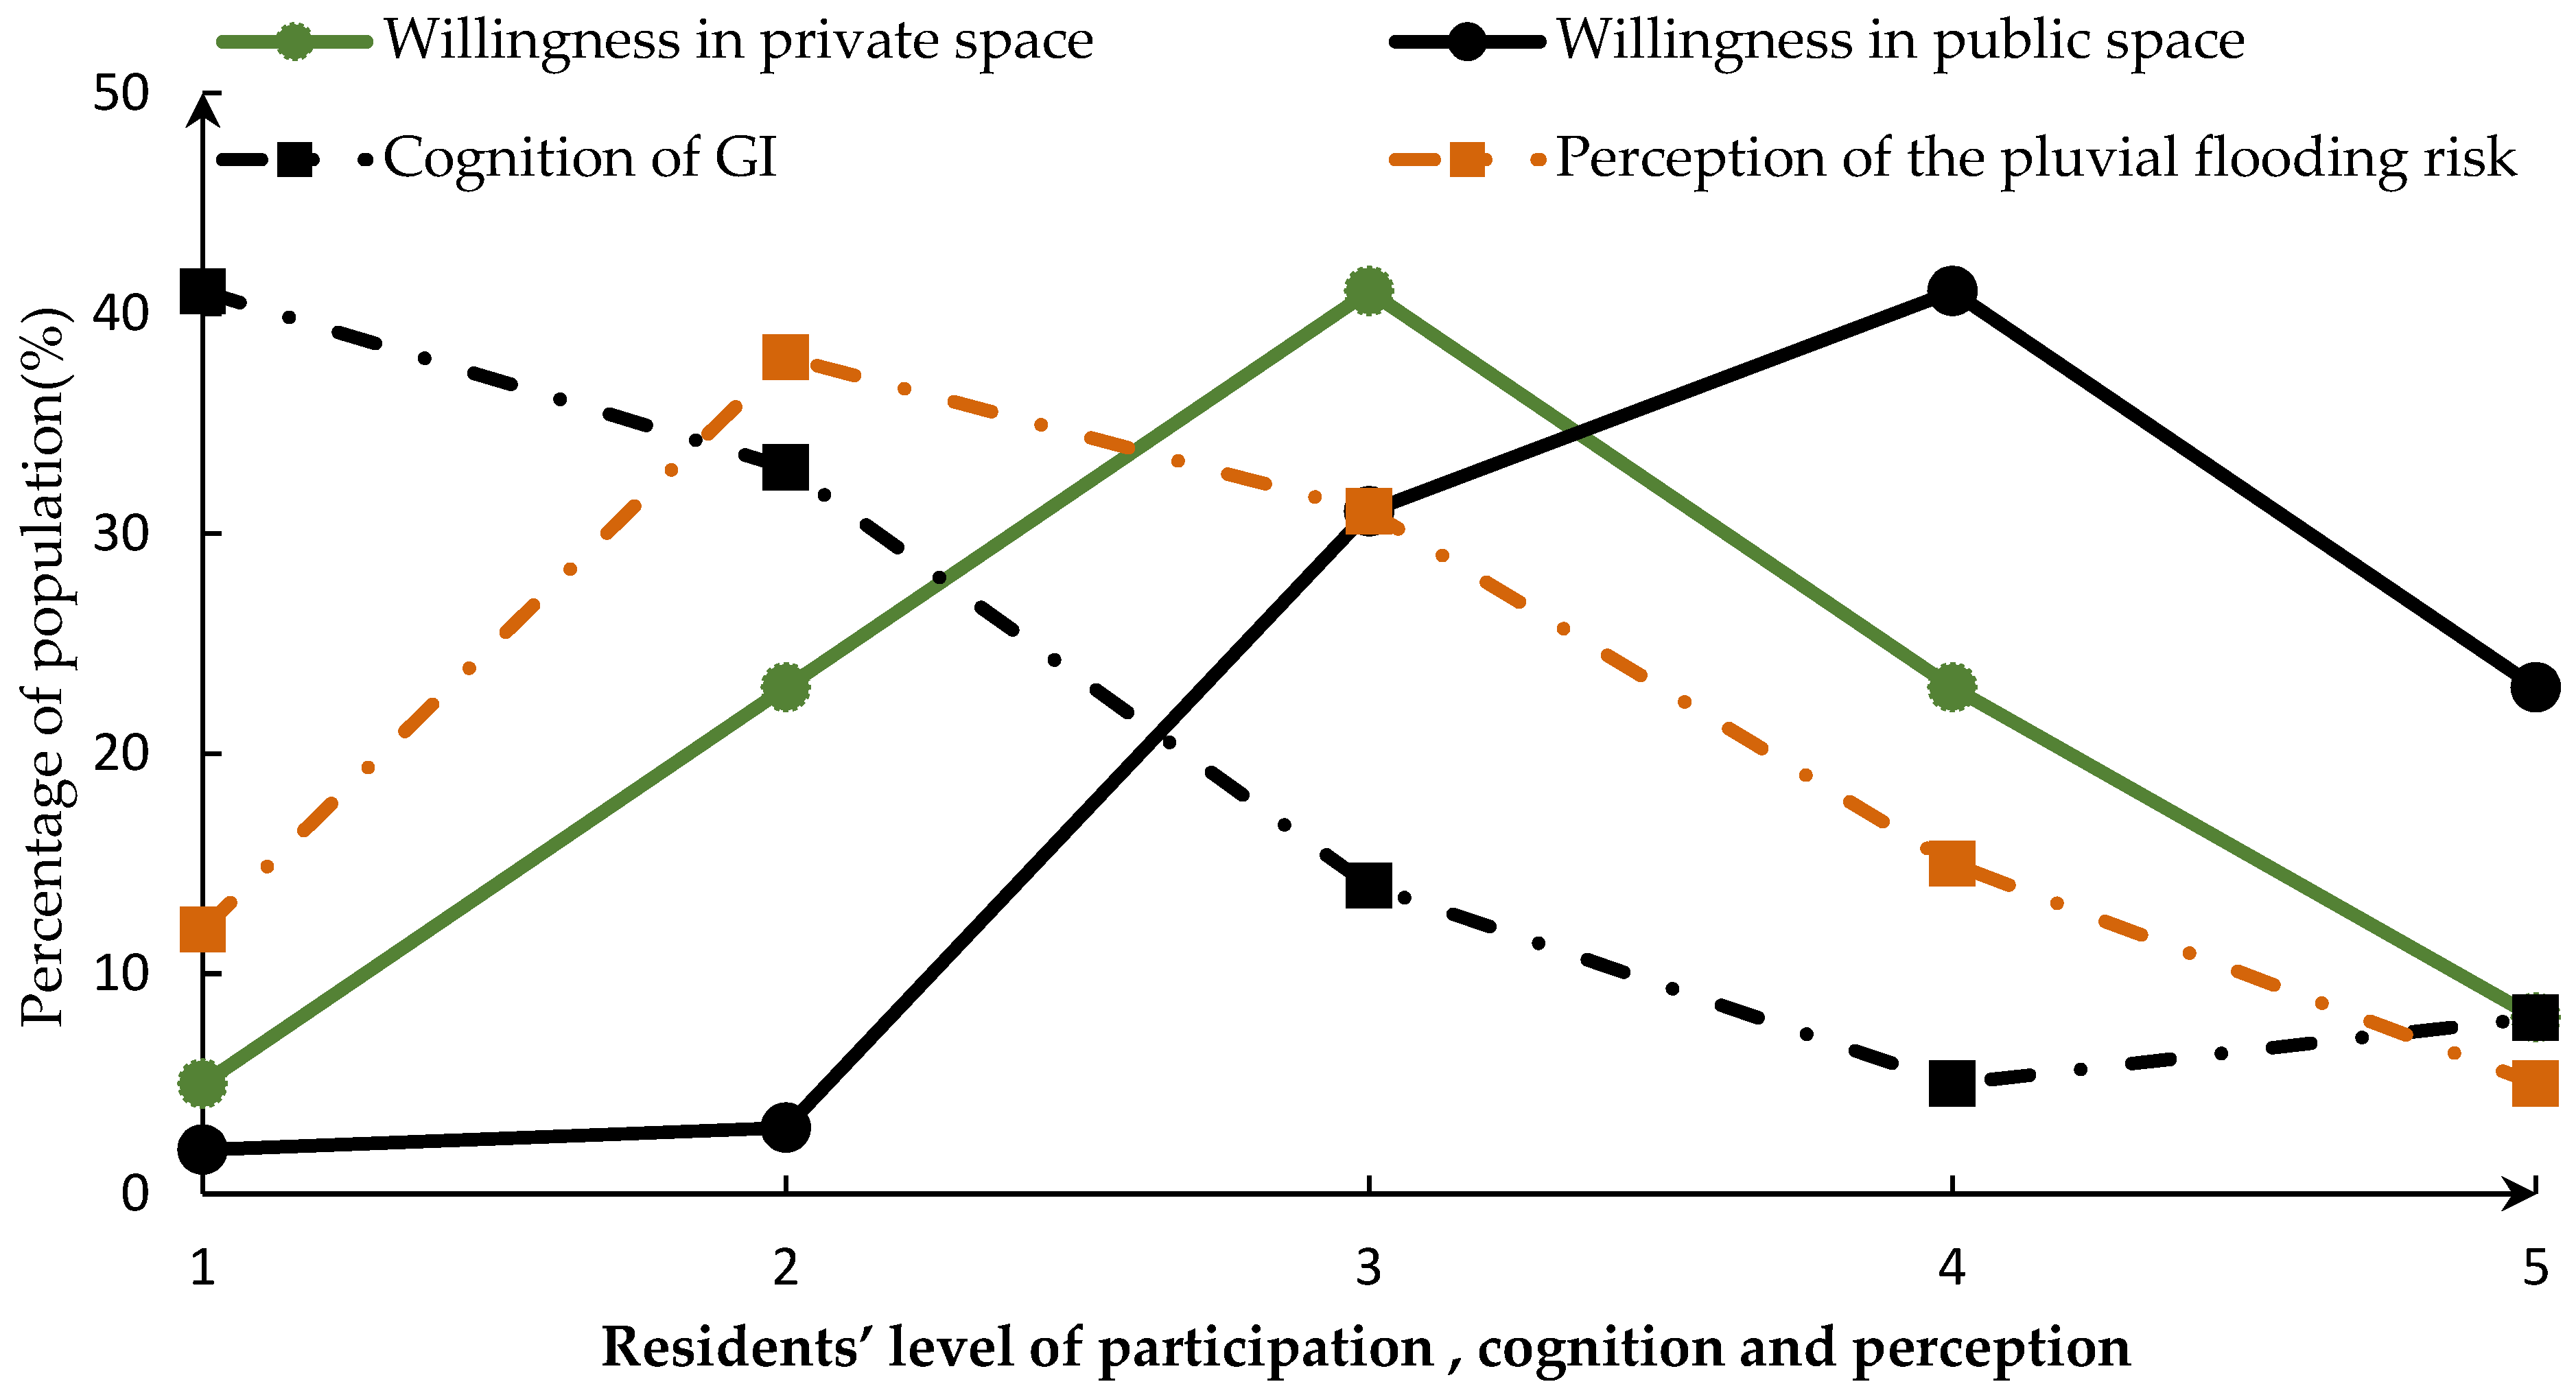
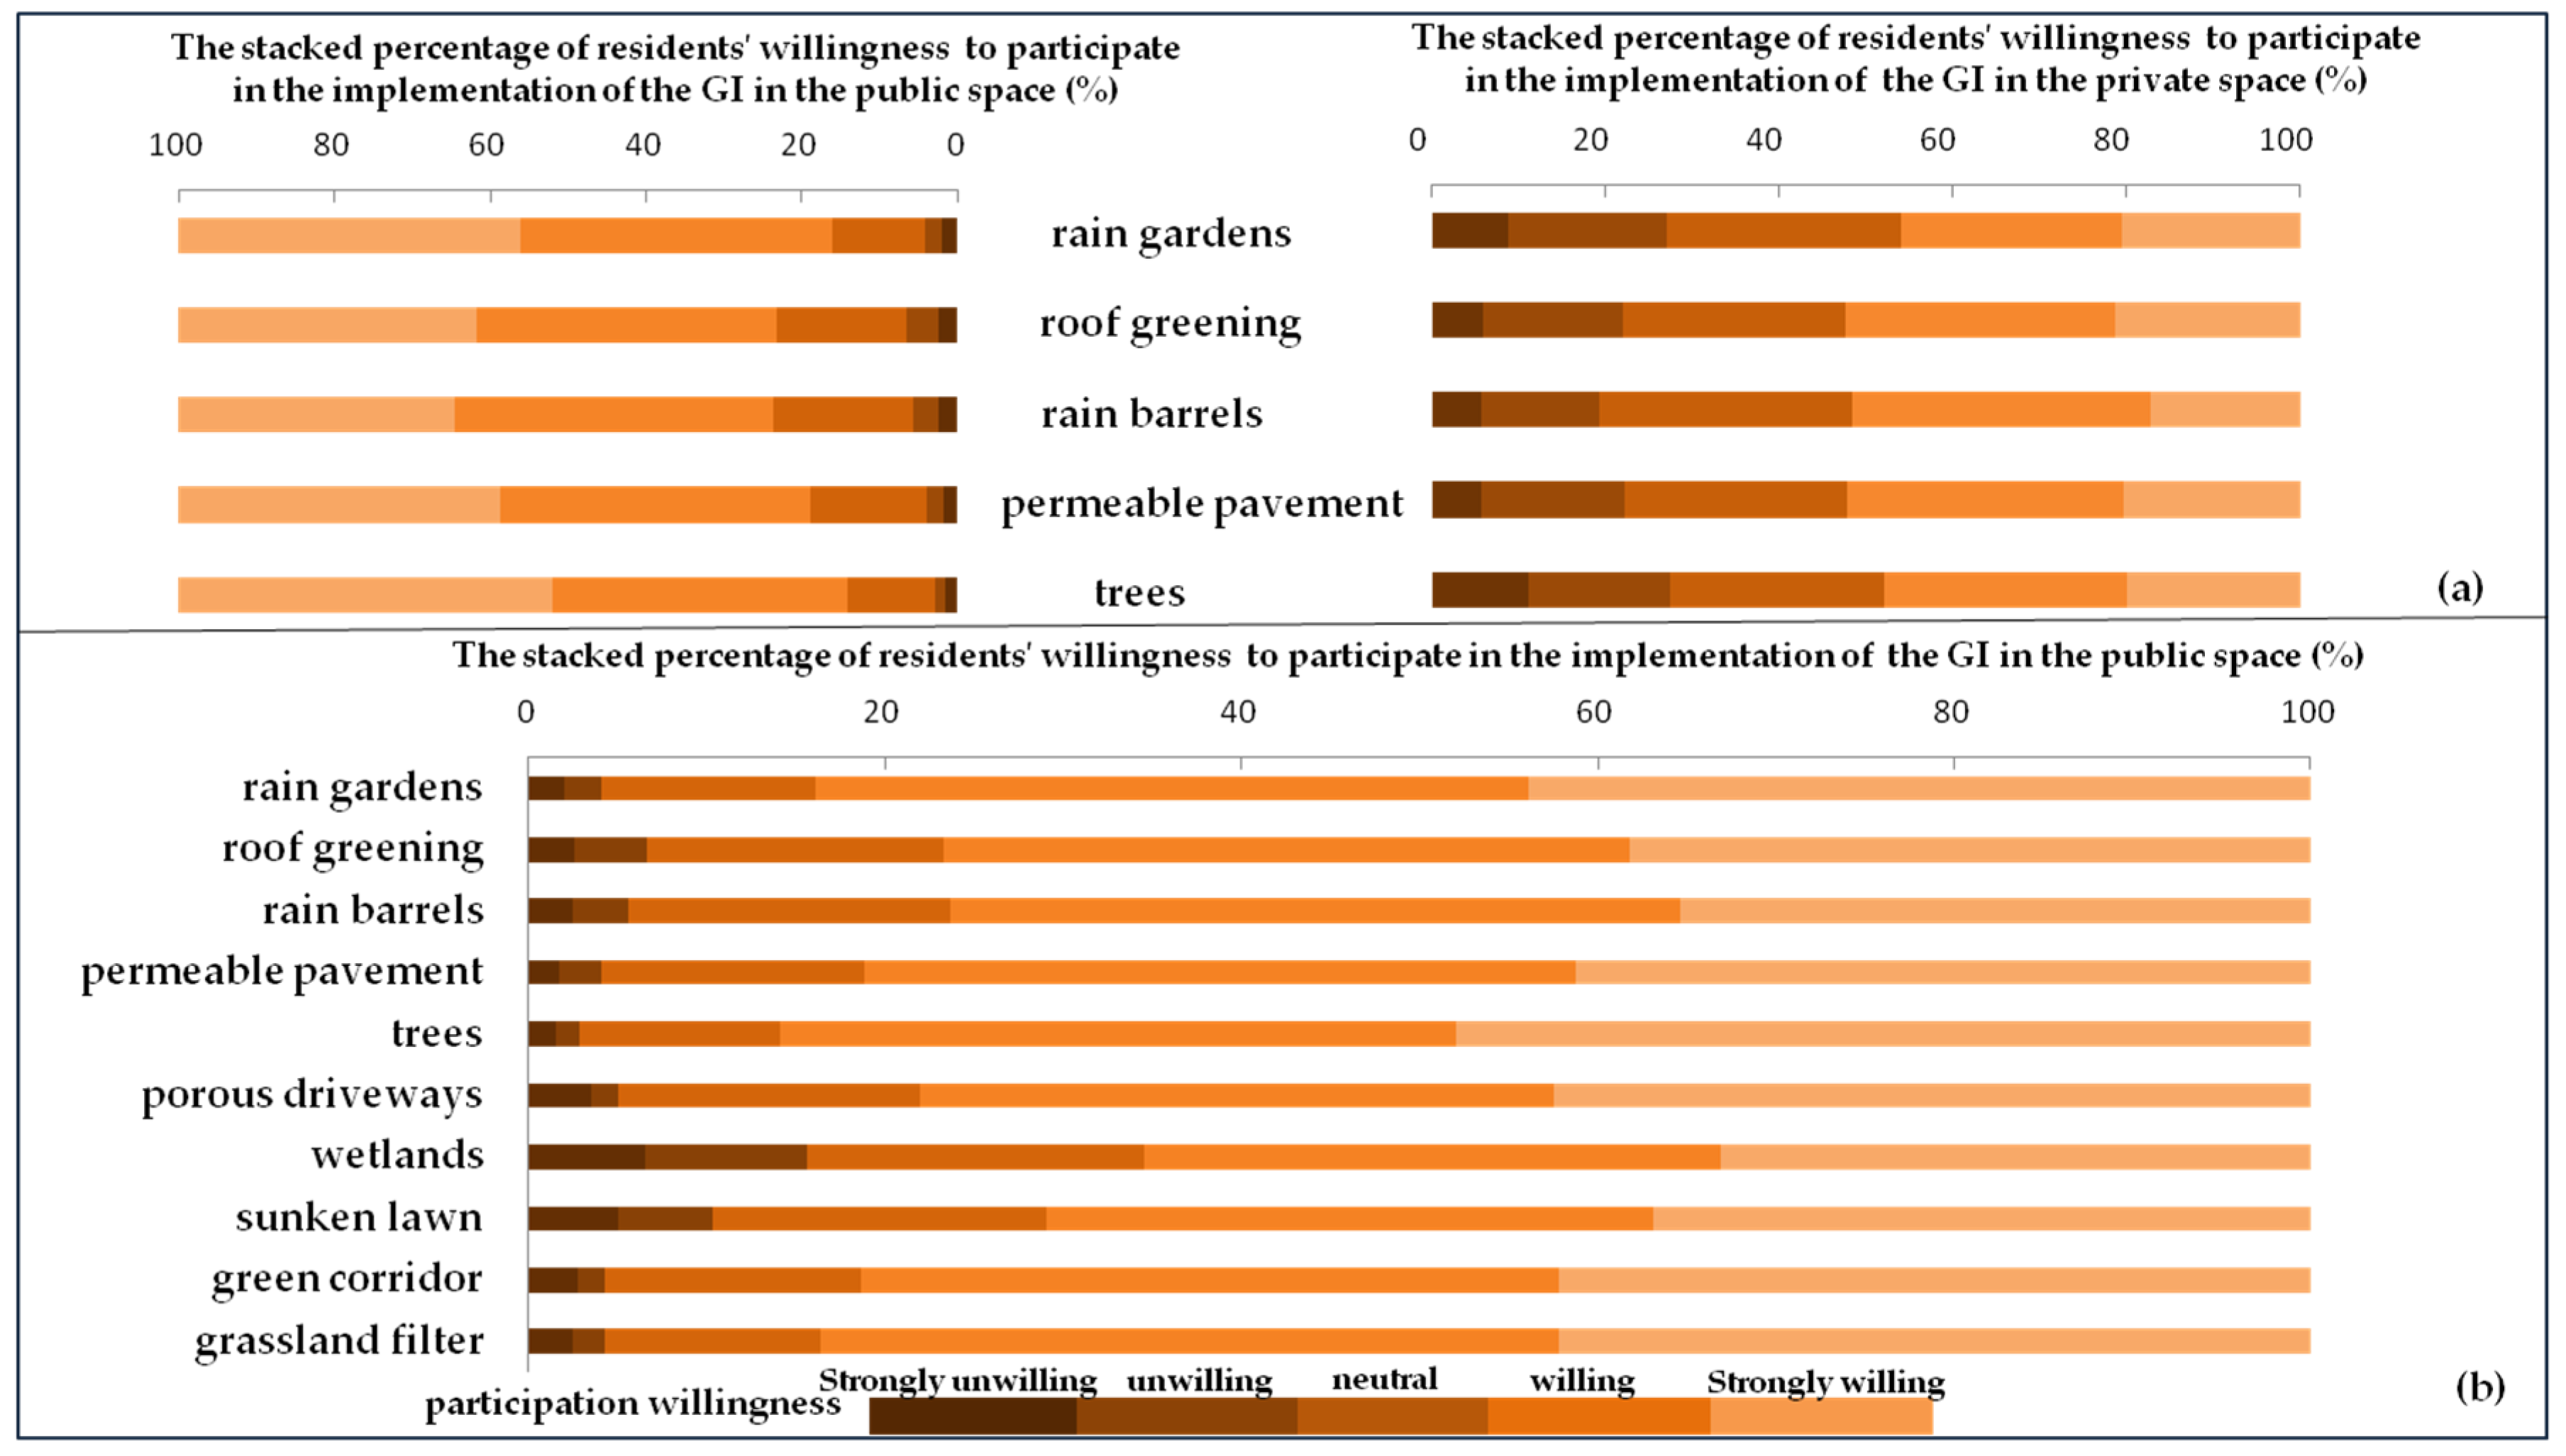
3.1. GI participation Level and Perception

The willingness of residents to participate in the implementation of GI presents the following characteristics: (1) In general, the level of willingness to participate in the implementation of GI in public space is higher than that in private space (Figure 3). The proportions of residents that would strongly be willing or willing to participate in implementing GI in public space are 23% and 41%, respectively. In contrast, in terms of private space, the proportions are 8% and 23%, respectively. (2) In terms of the choice preference for the same GI measures, the level of residents’ willingness to participate in the implementation of GI in public space is higher than that in private space. (3) In private space, residents prefer roof greening and rain barrels to collect rain water. The proportions of residents who would strongly be willing or willing to choose the roof greening are 21% and 31%, and the rain barrels are 17% and 34%, respectively (Figure 4a). (4) In public space, residents show their preference for planting trees, with the proportions of strongly willing and willing being 48% and 38%, respectively (Figure 4b).
The residents’ cognition of GI and perception of pluvial flood risk show that: (1) The residents’ level of cognition and perception are both low. The proportions of residents who have high and very high perception of the pluvial flood risk are 5% and 15%, respectively, while the percentage are 8% and 5% in terms of very strong and strong cognition of GI, respectively (Figure 3). (2) Those residents with higher cognition of GI and perception of pluvial flood risk are more willing to participate in the implementation of GI, which is consistent with previous studies [44,45].

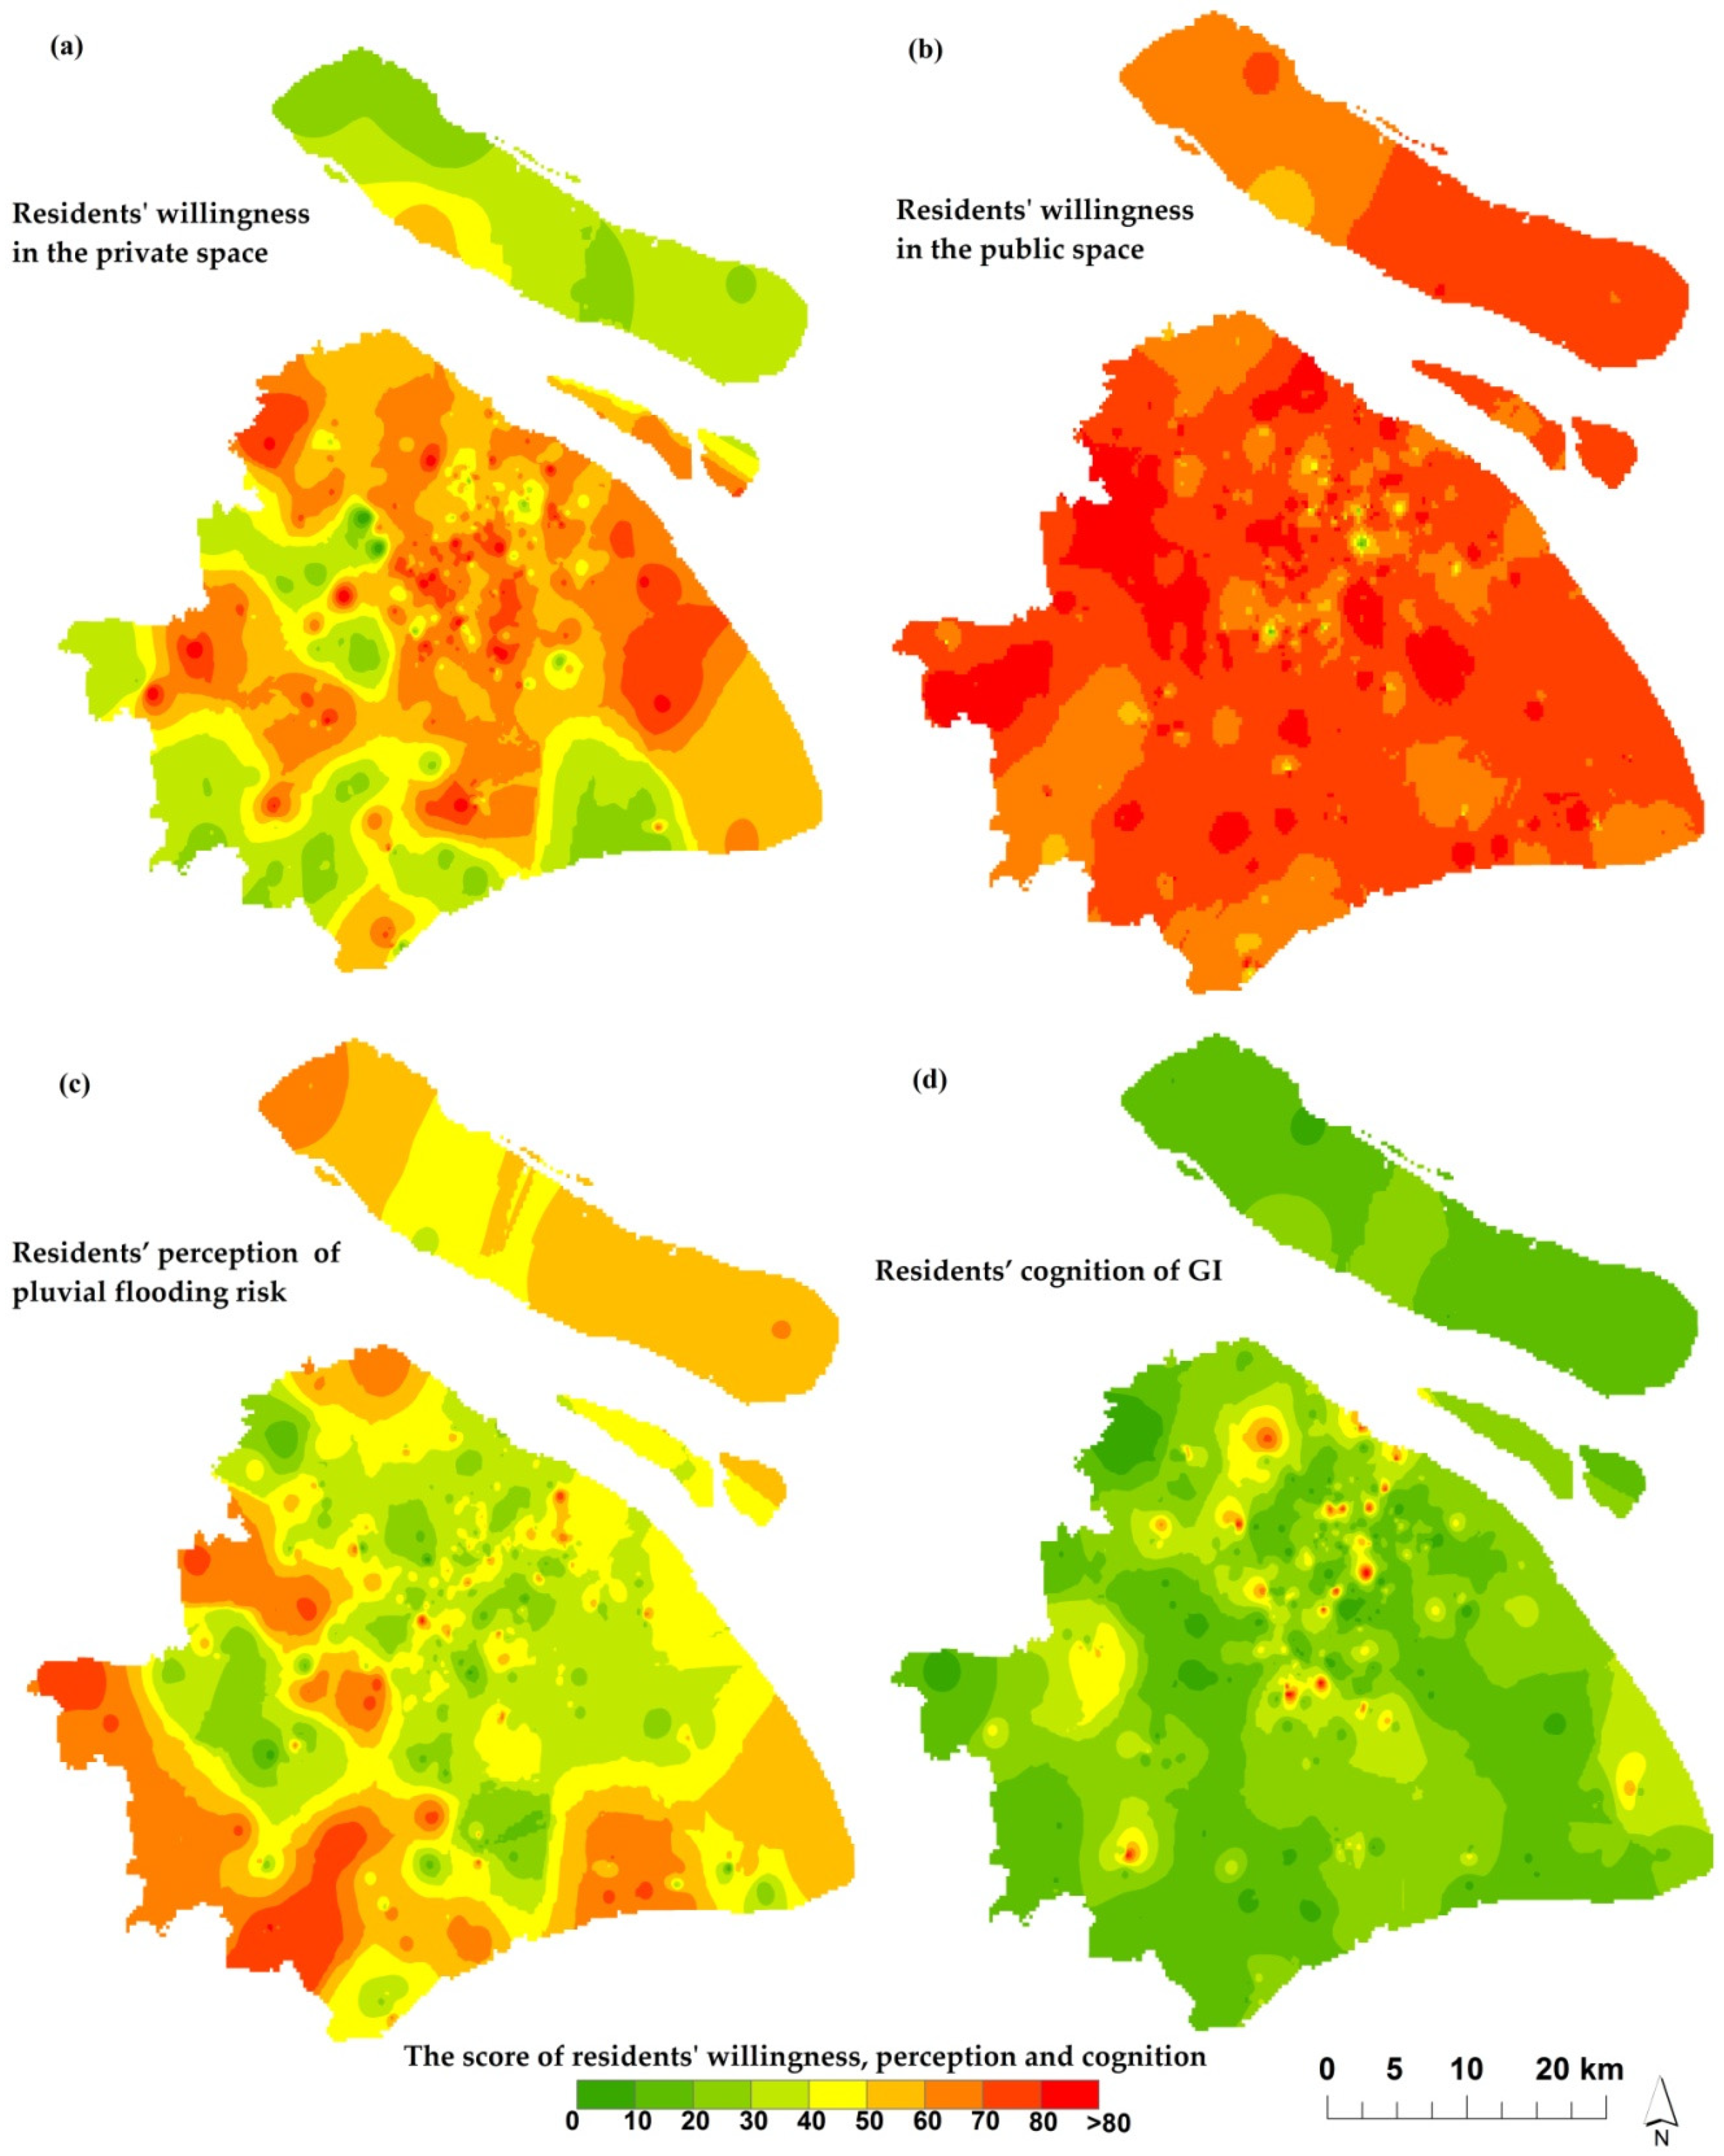
3.2. Spatial Distribution of Residents’ Participation, Cognition and Perception Level

All survey questions in this study utilize a five-point Likert scale, and the cumulative scores varied for different items. To ensure the consistent comparability, the five-point Likert scale was converted into the hundred-point system. The options were assigned based on the hundred-point system, and scores were then accumulated and divided by the number of items to obtain the final scores. Higher scores indicated higher levels of participation in and cognition of GI, and the perception of pluvial flood risk.
Spatial differences of residents’ participation, cognition and perception level were mapped, using Kriging interpolation at township scale (Figure 5). Figure 5a presents the significant spatial differences of residents’ willingness to participate in the implementation of GI in private space, which characterizes in general higher scores in the inner city while lower in the outer areas, indicating that, in private space, the residents in the inner city are more willing to participate in the implementation of GI than that in surrounding areas. For public space, residents’ scores are high in the whole Shanghai, which shows residents have strong willingness to participate in the implementation of GI in public space (Figure 5b). Figure 5 also indicates significant spatial difference of residents’ perception of pluvial flood risk, characterized as lower in the inner city and higher in the outer areas, especially in southern Shanghai, where the pluvial floods are more frequent, which is consistent with the research of Wang and Yin et al. (Figure 5c). There are large areas of crops which are sensitive to pluvial floods. Therefore, scores of residents’ pluvial flood risk perception in outer suburban areas are higher than in other areas [46,47]. However, residents’ cognition of GI stay low in general (Figure 5d).

3.3. Analysis of Influence Factors

3.3.1. Participation Level of Various Different Groups of Residents

Table 2 presents the proportion of residents who would be strongly willing or willing to participate in GI of private and public space. The results show: (1) For private space, the proportion of females who would be strongly willing or willing to participate in the implementation of GI is 3.6% higher than that of males. However, in terms of public space, the proportion of females is 2.82% lower than that of males. (2) The elderly or residents with more leisure time have stronger willingness to participate in the implementation of GI in private space. (3) There is a certain correlation between residents’ education level, family size and residents’ willingness to participate. Higher education level and larger family size are more willing to participate in the implementation of GI. (4) The residents living on higher floors show lower willingness to participate in the implementation of GI in private space, but higher willingness in public space. (5) In terms of housing types, residents living in shantytowns show the highest willingness (up to 50%) to participate in the implementation of GI in private space. The main reason is that the living environment is poor, therefore residents have stronger willingness to improve living condition. (6) In terms of the home ownership, building age, and the experience of pluvial flood in, they all revealed a statistically significant relationship with residents’ willingness to participate in the implementation of GI.

3.3.2. Mechanism Analysis of Residents’ Participation in GI

Principal component analysis (PCA) was used to categorize the 30 influence variables into four components (Table 3). Component 1 (Fac_Technology) includes factors that consist of technology installation, trust, complicated operation, etc. (Cronbach’s alpha = 0.970). Component 2 (Fac_Support) includes factors that support GI implementation in technology, economic, policy, etc. (Cronbach’s alpha = 0.956). Component 3 (Fac_Limit) includes factors related to restrictive factors about the implementation of GI (Cronbach’s alpha = 0.956). Component 4 (Fac_Improve) includes factors that improve the physical personal space with GI measures (Cronbach’s alpha = 0.802).

3.3.3. Influence Factors of Residents’ Participation in the Implementation of GI in Private Space

Multiple regression modeling was applied to analyze the data. Correlation coefficients of variables are all smaller than 0.6, indicating there is no serious collinearity in the model. Then, the ordinary least squares (OLS) regression was applied to Equation (1). In the regression analysis, the overall p-value is 0.001, indicating the rejection of the null hypothesis and existence of heteroscedasticity. Considering the effect of heteroscedasticity on the significance testing of the model coefficients, we adopted the regression results in which the heteroscedasticity was eliminated with the weighted least squares (WLS) (Table 4). Model 1 adds the socio-economic attributes of residents. Model 2 adds the cognition of GI. Model 3 continues to add perception of pluvial flood risk. Model 4 adds influence factors (Fac_Technology, Fac_Support, Fac_Limit and Fac_Improve). Based on Model 4, Model 5 adds a dummy variable of the spatial location to assess the effect of geographical distribution on the level of residents’ willingness to participate in the implementation of GI. To better reflect the effect of the individual socio-economic attributes on residents’ willingness to participate in GI and to make comparison among different types of variables, we set the following variables as reference ones: “female” in gender variables, “more than 4 h” in free time variables, “owner” in home ownership variables and “no experience” in pluvial flooding experience variables.
When compared the socio-economic attributes, the cognition of GI, the perception of pluvial flood risk, and the influence factors (Fac_Technology, Fac_Support, Fac_Limit and Fac_Improve), all show a statistically significant relationship with residents’ level of willingness to participate in the implementation of GI (Table 4).
Model 1 shows that, for gender, there is negative correlation between males and the residents’ level of willingness to participate in GI in private space, indicating that males have lower willingness to participate in the implementation of GI in private space than females do. There is a positive correlation between education level and the residents’ level of willingness to participate in the implementation of GI in private space, which proves that the higher education level have higher willingness to participate in the implementation of GI. Compared with residents with 4 h or more free time, less free time has lower participation level. Meanwhile, residents living in high floors have a low level of willingness to participate in the implementation of GI in private space, while residents living in low floors have a high level. There is no significance among home ownership, pluvial flooding experience and the residents’ level of willingness to participate in the implementation of GI in private space.
Model 2 presents that the correlation is significantly positive between cognition of GI and the residents’ level of willingness to participate in the implementation of GI in private space, indicating that the higher cognition level of GI shows stronger willingness to participate in the implementation of GI. Model 3 shows that there is a positive correlation between the perception level of pluvial flood risk and the residents’ level of willingness to participate in the implementation of GI in private space, which validates that the higher perception level of the pluvial flood risk indicates higher level of participation in the implementation of GI. Adding the variables of the cognition of GI and the perception of pluvial flood risk in sequence, the model’s goodness of fit rises from 0.069, to 0.096 and 0.104, correspondingly, reflecting the cognition of GI and the perception of pluvial flood risk play an important role on the residents’ level of willingness to participate in the implementation of GI in private space.
Model 4 adds four types of factors: Fac_Technology, Fac_Support, Fac_Limit and Fac_Improve. The result shows that Fac_Support and Fac_Improve can significantly affect the residents’ level of willingness to participate in the implementation of GI in private space. Adding those four types of factors, the model’s goodness of fit increases from 0.104 to 0.241, which fully demonstrates that Fac_Support and Fac_Improve affect the residents’ level of willingness to participate in the implementation of GI in private space.
Model 5 adds the geographical location variable to show the influence of the spatial location on the residents’ level of willingness to participate in the implementation of GI in private space. The regression result indicates that the coefficient of the suburban areas is negative, and this verifies that the residents’ level of willingness to participate in the implementation of GI in private space in the suburban areas is lower than that in the inner city.

3.3.4. Influence Factors of Residents’ Participation in the Implementation of GI in the Public Space

Residents’ socio-economic characteristics, the cognition of GI, the perception of pluvial flood risk and other influence factors (Fac_Technology, Fac_Support, Fac_Limit and Fac_Improve) have significant influences on the residents’ willingness (Table 5). Model 1 shows: (1) Compared with residents with 4 h or more free time, those with less free time have lower participation level. (2) In terms of the building age, residents who have newer houses are more willing to participate in the implementation of GI in public space. Models 2 and 3 show those with higher level of GI cognition and flood risk perception have stronger willingness to participate in the implementation of GI. Adding the variables of the cognition of GI and the perception of pluvial flood risk in sequence, the model’s goodness of fit rises from 0.042, to 0.053 and 0.063, correspondingly, reflecting the cognition of GI and the perception of pluvial flood risk have an important influence on the residents’ level of willingness to participate in the implementation of GI in public space. Finally, adding Fac_Technology, Fac_Support, Fac_Limit and Fac_Improve to Model 4, the model’s goodness of fit rises from 0.063 to 0.297, which indicates that Fac_Support and Fac_Improve play important roles in residents’ willingness to participate in the implementation of GI in public space.

4. Discussion and Conclusions

This paper contributes to the literature on residents’ willingness to participate in the implementation of GI as it explores spatial differences and the influence factors of GI participation in public and private space. The research reveals some interesting findings as follows.
First, residents’ willingness to participate in the implementation of GI is different between public and private space, and this discrepancy varies spatially. Compared with private space, residents prefer to implement GI in public space, where they have different preferences of GI measures. In private space, residents prefer roof greening and rain barrels, while, in public space, residents prefer planting trees. This finding is consistent with that of H.L. Brown et. al. [32] on private space study and shows the residents preference in public space. Perhaps the reason is the limited private space, as implementing GI in the courtyard, the balcony and other private space would occupy much space. In terms of urban scale, residents’ willingness to participate in the implementation of GI in private space is characterized as high in the inner city and low in the suburban areas, while the spatial difference is insignificant for public space. This is completely different from previous research [32,33,34,35,36], which shows that the willingness of residents to participate in the implementation of GI is different in private space and public space. There are many old residential areas in the inner city, with poor (green) environment and lack of GI (the per capita green area is 1–4 m2). In contrast, with the rapid development of economy and the emergence of counter-urbanization, in the suburban areas, the environmental quality is much better than the inner city (the per capita green area is 8–12 m2) [42]. Therefore, in private space of the inner city, it shows higher willingness to implement GI than in the suburban areas.
Second, the deterministic factors of GI participation are gender, education level, and floor for private space, while only include building age for public space, in addition to the common factors of free time, cognition of GI, perception of pluvial flood risk, supportive factors, and environment-improving factors that can influence both private and public space GI participation.
Residents’ socio-economic attributes, such as gender and education level can affect the participation willingness of GI implementation in private space. This finding is consistent with previous results [34,36,45]. The floor and free time significantly influence the implementation of GI. Residents living in a higher floor or having less free time will have a lower level of participation in the implementation of GI in private space. This also explains J.A. Byrne et al.’s [35] conclusion that the elderly have high level of participation because they have much more free time compared to other ages of residents. The finding is different from that of H.L. Brown et. al. [32,34,35]. We found that the building age can significantly affect residents’ willingness to participate in the implementation of GI in public space. The residents living in the older building indicates lower willingness to participate in the implementation of GI.
Residents with higher cognition of GI and perception of pluvial flood risk have higher willingness to implement GI, which demonstrates that the high level of environment perception is a potential driver for residents to participate in GI [44,45]. Supportive factors of GI and improving environmental ones are the main factors that affect residents’ willingness to participate in the implementation of GI, which is different from A.K. Baptiste et al.’s [34] study. Since China started to implement GI in recent years, and there are not enough related policies, economic incentives, technical support and training. Therefore, one of the main obstructive factors is the policy innovation, which is also verifies the finding of X.S. Dou [31]. The improving environmental factors affect residents’ willingness to participate in the implementation of GI, which is consistent with previous studies [34,37,48]. Geographical location is one of the factors that affect residents’ participation level in the implementation of GI, which is in accordance with our hypothesis. Residents in the inner city have the highest willingness, suburban areas is second, and outer suburban areas is third.
The finding of this research suggest residents’ cognition of GI and perception of pluvial flood risk stay at a low level, but the high levels of cognition of GI and perception of pluvial flood risk directly drive residents’ willingness to participate in the implementation of GI. Therefore, the most effective way to promote residents’ willingness to participate in the implementation of GI is first to popularize the public’s cognition of GI and to enhance the public’s perception of pluvial flood risk, for example, the community should organize courses to help residents understand the benefits of GI and the problems of pluvial flood, or the government organization should increase publicity on public platforms. Second, the main factors affecting residents’ willingness to participate in the implementation of GI include the supportive factors of GI implementation. Residents are mainly concerned about the lack of technology, funding and regulatory support. Therefore, the government can provide in-kind subsidies, such as trees and rain barrels when residents participate in the implementation of GI; the government organization should cancel restrictions such as demolition of illegal buildings and provide technical support for families with conditional implementation of green roofs; the community could regularly invite experts to train residents on technology and maintenance; and, finally, the government should provide some suppliers that can provide reliable and qualified products of GI.

Author Contributions

Y.Y. analyzed the data and wrote the paper; H.X. conceived and designed the research and edited the paper; X.W. collect the data; J.W., S.D., M.Z. and Q.K. reviewed and edited the paper.

Funding

This research was funded by the National Natural Science Foundation of China (Grant numbers: 71603168, 41701001, 41871200 and 51708350), National Key Research and Development Plan (Grant numbers: YS2017YFC and 1503001), and The Netherlands Organization for Scientific Research NWO (Grant number: ALWSD.2016.007).

Conflicts of Interest

The authors declare no conflict of interest.

References

  1. Liu, J.K.; Sun, W.P. The Report on the Development of China’s Eco-Cities; Beijing Social Sciences Academic Publishing: Beijing, China, 2018; pp. 3–17. (In Chinese) [Google Scholar]
  2. Berry, P.M.; Betts, R.A.; Harrison, P.A. High-End Climate Change in Europe; Pensoft Publishers: Sofia, Bulgaria, 2017; pp. 80–100. [Google Scholar]
  3. UNISDR. How to Make Cities More Resilient: A Handbook for Local Government Leaders; United Nations: Geneva, Switzerland, 2017; pp. 30–80. [Google Scholar]
  4. EEA. Exploring Nature-Based Solutions: The Role of Green Infrastructure in Mitigating the Impacts of Weather and Climate Changerelated Natural Hazards; EEA Technical Report; European Environment Agency: Copenhagen, Demark, 2015. [Google Scholar]
  5. Willner, S.N.; Levermann, A.; Zhao, F.; Frieler, K. Adaptation required to preserve future high-end river flood risk at present levels. Sci. Adv. 2018, 4, 1–8. [Google Scholar] [CrossRef] [PubMed]
  6. Shen, J.; Du, S.Q.; Huang, Q.X.; Yin, J.; Zhang, M.; Wen, J.H.; Gao, J. Mapping the city-scale supply and demand of ecosystem flood regulation services—A case study in Shanghai. Ecol. Indic. 2019, 106, 105544. [Google Scholar] [CrossRef]
  7. UN-Water. The United Nations World Water Development Report 2018: Nature-Based Solutions for Water; United Nations: Geneva, Switzerland; Paris, France, 2018; pp. 21–36. [Google Scholar]
  8. Jongman, B. Effective adaptation to rising flood risk. Nat. Commun. 2018, 9, 1986. [Google Scholar] [CrossRef] [PubMed]
  9. Jiang, Y.; Zevenbergen, C.; Ma, Y. Urban pluvial flooding and stormwater management: A contemporary review of China’s challenges and “sponge cities” strategy. Environ. Sci. Policy 2018, 80, 132–143. [Google Scholar] [CrossRef]
  10. US EPA. What Is EPA Doing to Support Green Infrastructure? Available online: https://www.epa.gov/green-infrastructure/what-epa-doing-support-green-infrastructure-0 (accessed on 23 April 2018).
  11. Beauchamp, P.; Adamowski, J. An integrated framework for the development of green infrastructure: A literature review. Eur. J. Sustain. Dev. 2013, 2, 3. [Google Scholar] [CrossRef]
  12. Clean Water America Alliance (CWAA). Barriers and Gate Ways to Green Infrastructure. 2011. Available online: http://www.us.watera.lliance.org/pdfs/gireport.pdf (accessed on 11 May 2018).
  13. Demuzere, M.; Orru, K.; Heidrich, O.; Olazabal, E.; Geneletti, D.; Orru, H.; Bhave, A.G.; Mittal, N.; Feliu, E.; Faehnle, M. Mitigating and adapting to climate change: Multi-functional and multi-scale assessment of green urban infrastructure. J. Environ. Manag. 2014, 146, 107–115. [Google Scholar] [CrossRef] [PubMed]
  14. Zhang, Q.Q.; Miao, L.P.; Wang, X.K.; Liu, D.D.; Zhu, L.; Zhou, B.; Sun, J.C.; Liu, J.T. The capacity of greening roof to reduce stormwater runoff and pollution. Landsc. Urban Plan. 2015, 144, 142–150. [Google Scholar] [CrossRef]
  15. Krebs, G.; Kuoppamäki, K.; Kokkonen, T.; Koivusalo, H. Simulation of green roof test bed runoff. Hydrol. Process. 2016, 30, 250–262. [Google Scholar] [CrossRef]
  16. Guiding Opinions of the General Office of the State Council on Advancing the Buildingof Sponge Cities. 16 October 2015; (In Chinese). Available online: http://www.gov.cn/zhengce/content/2015-10/16/content_10228.htm (accessed on 11 May 2018).
  17. National Standard Building System for Sponge City Construction. February 2016; (In Chinese). Available online: http://www.mohurd.gov.cn/wjfb/201602/W020160204051432.pdf (accessed on 11 May 2018).
  18. Bowler, D.E.; Buyung, A.L.; Knight, T.M.; Pullin, A.S. Urban greening tocool towns and cities: A systematic review of the empirical evidence. Landsc. Urban Plan. 2010, 97, 147–155. [Google Scholar] [CrossRef]
  19. Bulkeley, H. Cities and Climate Change; Routledge: Oxon, UK, 2013; pp. 36–47. [Google Scholar]
  20. Dhakal, K.P.; Chevalier, L.R. Implementing low impact development in urban landscapes: A policy perspective. J. Environ. Manag. 2015, 322–333. [Google Scholar] [CrossRef]
  21. Rijke, J.; Farrelly, M.; Brown, R.; Zevenbergen, C. Configuring transformative governance to enhance resilient urban water systems. Environ. Sci. Policy 2013, 25, 62–72. [Google Scholar] [CrossRef]
  22. Faehnle, M.; Bäcklund, P.; Tyrväinen, L.; Niemelä, J.; Yli, P.V. How can residents’ experiences inform planning of urban green infrastructure? Case Finland. Landsc. Urban Plan. 2014, 130, 171–183. [Google Scholar] [CrossRef]
  23. Sohyun, P. A preliminary study on connectivity and perceived values of community green spaces. Sustainability 2017, 9, 692. [Google Scholar] [CrossRef]
  24. Lieberherr, E.; Green, O.O. Green infrastructure through citizen stormwater management: Policy instruments, p articipation and engagement. Sustainability 2018, 10, 2099. [Google Scholar] [CrossRef]
  25. Cilliers, E.J. Reflecting on green infrastructure and spatial planning in Africa: The complexities, perceptions, and way forward. Sustainability 2019, 11, 455. [Google Scholar] [CrossRef]
  26. Xia, J.; Zhang, Y.Y.; Xiong, L.H.; He, S.; Wang, L.F.; Yu, Z.B. Opportunities and challenges of the Sponge City construction related to urban water issues in China. Sci. China Earth Sci. 2017, 60, 652–658. [Google Scholar] [CrossRef]
  27. Wang, H.; Mei, C.; Liu, J.H.; Shao, W.W. A new strategy for integrated urban water management in China: Sponge city. Sci. China Technol. Sci. 2018, 61, 317–329. [Google Scholar] [CrossRef]
  28. National Research Council (NRC). Urban Stormwater Management in the United States; National Academy Press: Washington, DC, USA, 2008.
  29. Matthews, T.; Lo, A.Y.; Byrne, J.A. Reconceptualizing green infrastructure for climate change adaptation: Barriers to adoption and drivers for uptake by spatial planners. Landsc. Urban Plan. 2015, 138, 155–163. [Google Scholar] [CrossRef]
  30. Cousins, J.J. Infrastructure and institutions: Stakeholder perspectives of stormwaterpluvial flooding governance in Chicago. Cities 2017, 66, 44–52. [Google Scholar] [CrossRef]
  31. Dou, X.S.; Wang, Z.F.; Yuan, H.M. Function, Barriers and Police of Green Infrastructure Construction in Urban Environment. Adv. Mater. Res. 2015, 1065, 2814–2818. [Google Scholar]
  32. Brown, H.L.; Bos, D.G.; Walsh, C.J.; Fletcher, T.D.; RossRakesh, S. More than money: How multiple factors influence householder participation inat-source stormwater management. J. Environ. Plan. Man. 2016, 59, 79–97. [Google Scholar] [CrossRef]
  33. Keeley, M.; Koburger, A.; Dolowitz, D.P.; Medearis, D.; Nickel, D.; Shuster, W. Perspectives on the use of green infrastructure for stormwater management in Cleveland and Milwaukee. Environ. Manag. 2013, 51, 1093–1108. [Google Scholar] [CrossRef] [PubMed]
  34. Baptiste, A.K.; Foley, C.S.; Smardon, R. Understanding urban neighborhood differences in willingness to implement green infrastructure measures: a case study of Syracuse, NY. Landsc. Urban Plan. 2015, 136, 1–12. [Google Scholar] [CrossRef]
  35. Byrne, J.A.; Lo, A.Y.; Yang, J.J. Residents’ understanding of the role of green infrastructure for climate change adaptation in Hangzhou, China. Landsc. Urban Plan. 2015, 138, 132–143. [Google Scholar] [CrossRef]
  36. Beery, T. Engaging the private homeowner: Linking climate change and green stormwater infrastructure. Sustainability 2018, 10, 4791. [Google Scholar] [CrossRef]
  37. Dhakal, K.P.; Chevalier, L.R. Managing urban stormwater for urban sustainability: Barriers and policy solutions for green infrastructure application. J. Environ. Manag. 2017, 203, 17. [Google Scholar] [CrossRef]
  38. Tsantopoulos, G.; Varras, G.; Chiotelli, E.; Fotia, K.; Batou, M. Public perceptions and attitudes toward green infrastructure on buildings: The case of the metropolitan area of Athens, Greece. Urban Urban Gree. 2018, 6, 17. [Google Scholar] [CrossRef]
  39. Wang, C.; Du, S.; Wen, J.; Zhang, M.; Gu, H.; Shi, Y.; Xu, H. Analyzing explanatory factors of urban pluvial floods in Shanghai using geographically weighted regression. Stoch. Environ. Res. Risk Assess. 2017, 31, 1777–1790. [Google Scholar] [CrossRef]
  40. Deng, J.L.; Shen, S.L.; Xu, Y.S. Investigation into pluvial flooding hazards caused byheavy rain and protection measures in Shanghai, China. Nat. Hazards 2016, 83, 1301–1320. [Google Scholar] [CrossRef]
  41. Du, S.Q.; Wang, C.X.; Shen, J.; Wen, J.H.; Gao, J.; Wu, J.P.; Lin, W.P.; Xu, H. Mapping the capacity of concave green land in mitigating urban pluvial floods and its beneficiaries. Sustain. Cities Soc. 2019, 44, 774–782. [Google Scholar] [CrossRef]
  42. Shanghai Municipal Statistics Bureau. Shanghai Statistical Yearbook 2018. (In Chinese). Available online: http://www.stats-sh.gov.cn/html/sjfb/201901/1003014.html (accessed on 23 April 2019).
  43. Du, S.Q.; Gu, H.H.; Wen, J.H.; Chen, K.; Van Rompaey, A. Detecting flood variations in Shanghai over 1949–2009 with Mann-Kendall Tests and a Newspaper-Based Database. Water 2015, 7, 1808–1824. [Google Scholar] [CrossRef]
  44. Meinhold, J.L.; Malkus, A.J. Adolescent environmental behaviors: Can knowledge, attitudes, and selfefficacy make a difference? Environ. Behav. 2005, 37, 511–532. [Google Scholar] [CrossRef]
  45. Baptiste, A.K. Experience is a great teacher: Citizens’ reception of a proposal for the implementation of green infrastructure as stormwater management technology. Community Dev. 2014, 45, 337–352. [Google Scholar] [CrossRef]
  46. Wang, X.; Yin, Z.E. Precipitation in Shanghai under climate change. Trop. Geogr. 2015, 35, 324–333. (In Chinese) [Google Scholar]
  47. Yin, J.; Yin, Z.E.; Yu, D.P.; Xu, S.Y. Vulnerability analysis for storm induced Flood: A case study of Huangpu River Basin. Sci. Geogr. Sin. 2012, 32, 1155–1160. (In Chinese) [Google Scholar]
  48. Barnhill, K.; Smardon, R. Gaining ground: Green infrastructure attitudes and perceptions from stakeholders in Syracuse, New York. Environ. Pract. 2012, 14, 6–16. [Google Scholar] [CrossRef]
Figure 1. Research framework for the level of residents’ willingness to participate in GI.
Sustainability 11 05396 g001
Figure 2. Shanghai City and spatial distribution of survey samples.
Sustainability 11 05396 g002
Figure 3. Statistical distribution of residents’ participation, cognition and perception level.
Sustainability 11 05396 g003
Figure 4. The willingness of residents to participate in the implementation of GI: (a) a comparison of residents’ willingness to implement the same GI measures between private and public space; and (b) residents’ willingness to participate in the implementation of GI in public space.
Sustainability 11 05396 g004
Figure 5. Spatial distribution of residents’ willingness, perception and cognition level in Shanghai: (a) the score of residents’ willingness to participation in the implementation of GI in private space; (b) the score of residents’ willingness to participation in the implementation of GI in public space; (c) the score of residents’ perception of pluvial flooding risk; and (d) the score of residents’ cognition of GI.
Sustainability 11 05396 g005
Table 1. Statistics for socio-economic demographic variables of respondents.
VariableVariable Setting and Sample Percentage
Age (year)13–18 (13%); 19–25 (39%); 26–60 (40%); ≥60 (8%)
GenderMale (34%); female (66%)
Education levelElementary (16%); High School (18%); College (60%);
Graduate (4%)
Family size (people)1 (1%); 2 (12%); 3 (62%); 4 (15%); ≥5 (10%)
Family annual Income (Chinese Yuan)≤120,000 (30%); 120,000–180,000 (20%); 180,000–240,000 (18%);
240,000–360,000 (19%); ≥360,000 (12%)
Type of housingVilla (8%); Apartment (74%); Old public flats (13%);
Placement of the housing (4%); Shantytowns (1%)
Home ownershipOwners (90%); Renters (10%)
Floor1 (5%); 2–3 (38%); 4–6 (38%); ≥7 (19%)
Building age (year)≤1980 (11%); 1989–1990 (17%); 1990–2000 (9%); 2000–2010 (47%);
≥2010 (16%)
Free time (h)≤1 (3%); 1–2 (6%); 2–3 (13%); 3–4 (18%); ≥4 (60%)
Pluvial flood experienceNo (65%); Yes (35%)
Table 2. Participation level of different groups of residents.
VariableAttributeWilling/Strongly Willing to Participate in GI (%)p-ValueVariableAttributeWilling/Strongly Willing to Participate in GI (%)p-Value
pa *pb **pa *pb **
Age (year)13–1826.6751.11pa < 0.05Floor133.3361.11pa < 0.05
19–2526.0964.49pb > 0.052–328.4847.02pb < 0.05
26–6033.5163.78 4–63265.33
≥6035.7164.29 ≥731.4362.86
Gendermale27.9463.97pa < 0.01Home ownershipOwners30.4563.41pa < 0.01
female31.5461.15pb < 0.01Renters31.4360pb < 0.01
Family annual income (Chinese Yuan)≤120,00035.2660.9pa > 0.05Free time (hour)≤1 h066.67pa < 0.01
120,000–180,00028.9963.77pb > 0.051–221.7452.17pb < 0.05
180,000–240,00030.366.67 2–331.8259.09
240,000–360,00029.0367.74 3–432.2664.52
≥360,00013.9555.81 ≥431.2860.66
Type of housingVilla36.3669.7pa < 0.01Family population (people)12550pa < 0.05
Apartment33.4561.77pb > 0.05229.1760.42pb < 0.05
Old public flats3264 329.6361.32
Housing placement46.6766.67 433.3366.67
Shantytowns5050 ≥530.7761.54
Education levelelementary22.7345.45pa < 0.01Rainstorm experienceno32.1664.31pa < 0.01
High school31.3363.86pb < 0.05yes27.7461.31pb< 0.01
college31.4867.59
graduate27.2754.55
Note: * pa, private space; ** pb, public space.
Table 3. Rotated structure matrix with Varimax rotation of a four-component solution to the question on the influence factors to implement GI.
ComponentVariableRotated Component CoefficientsCommunalities
Fac_TechnologyLack of trust in waterproof0.9200.0250.086−0.0340.855
Leaking0.879−0.0060.133−0.030.792
Private space occupied by GI0.867−0.0430.102−0.0580.767
Risk (safety; invasive species)0.8550.0410.14−0.0680.758
Block light0.8210.1060.2990.0480.778
Complicated operation0.8080.0550.3010.0330.747
Fac_SupportTechnical support−0.0120.8760.1190.1380.8
Suitable roof structure0.0110.8740.0710.1940.806
Benefits in kind0.0150.8620.0940.0780.758
Economic benefit0.0040.852−0.0170.0260.727
Simple operation−0.0140.8040.10.3190.759
Enforcement measures0.0120.7470.0710.3770.705
Training0.0390.7440.0580.3870.709
Fac_LimitLack of interest0.085−0.010.914−0.0230.843
Cost to install0.110−0.0540.902−0.0340.83
Lack of economic benefit evidence0.002−0.0020.9020.0320.815
Unsuitable roof structure0.1130.0230.8950.0570.818
Maintenance cost0.0940.0570.88−0.0340.788
Lack of economic benefit0.0320.070.8770.0120.775
Lack of technical support0.2320.0220.8680.0560.811
Legal restrictions0.2810.080.830.0280.774
Lack of time0.2990.1060.8210.0480.778
Dismantle illegal building0.2850.0680.8020.010.729
Fine−0.0360.1640.7150.0080.539
Fac_ImproveReduced water or electricity rate0.0280.1360.0330.8670.771
Plant cash crops0.0380.2490.0920.8550.803
Add beautification to property−0.0920.3880.0980.8420.878
Add shade or green space−0.0710.4220.080.8130.85
Keep water and prevent water pooling−0.0590.4340.130.7790.816
Health−0.0150.293−0.0670.520.361
Note: Major loadings for each item are in bold.
Table 4. Multivariate linear regression results of residents’ willingness to participate in GI of private space.
VariableModel 1Model 2Model 3Model 4Model 5
BtBtBtBtBt
Gender
Male−0.214 **−1.968−0.212 **−1.975−0.218 **−2.040−0.245 **−2.473−0.233 **−2.367
Education level0.212 ***2.9380.230 ***3.2240.219 ***3.0640.219 ***3.3080.229 ***3.442
Free time
<1 h−0.131−0.375−0.044−0.128−0.068−0.198−0.079−0.247−0.012−0.037
1–2 h−0.303 *−1.3450.285 *−1.277−0.343 *−1.529−0.332 *−1.596−0.308 *−1.487
2–3 h−0.326 **−1.9490.381 **−2.294−0.371 **−2.242−0.350 **−2.263−0.371 **−2.414
3–4 h−0.078 ***−0.536−0.095 ***−0.659−0.105−0.734−0.032−0.237−0.006−0.044
Floor−0.172 ***−2.627−0.180 ***−2.778−0.176 ***−2.648−0.134 ***−2.219−0.123 ***−2.062
Home ownership
Renters0.0350.1960.07910.3100.13750.5600.1310.5400.1150.492
Pluvial flooding experience
Yes−0.022−0.204−0.022−0.2050.1000.8040.2101.8100.228 **1.984
Cognition of GI 0.134 ***3.2830.143 ***3.4770.159 ***4.1860.152 ***4.022
Perception of pluvial flood risk 0.118 **1.9540.124 **2.2140.120 **2.147
Fac_Technology 0.022 0.0430.0120.024
Fac_Support 0.322 ***6.8180.310 ***6.615
Fac_Limit −0.064 *−1.344−0.069 *−12.462
Fac_Improve 0.214 ***4.4750.205 ***4.305
Geographical location
Suburbs −0.274 **−2.470
Outer suburbs 0.0940.761
Constant3.437 ***29.0113.694 ***26.2443.315 ***14.8383.255 ***14.5673.304 ***14.414
IR20.069 0.095 0.104 0.241 0.260
Note: *** p < 0.01, ** p < 0.05, * p < 0.10.
Table 5. Multivariate linear regression results of residents’ willingness to participate in GI of public space.
VariableModel 1Model 2Model 3Model 4
BtBtBtBt
Free time
<1 h−0.228−0.841−0.270−0.997−0.276−1.02−0.255−1.081
1–2 h−0.043 *−0.249−0.052−0.301−0.082−0.472−0.026−0.174
2–3 h−0.392 **−3.001−0.364 ***−2.788−0.349 ***−2.679−0.299 ***−2.61
3–4 h−0.031 ***−0.270−0.022−0.197−0.022−0.2000.0590.595
Building age0.093 ***2.6320.091 ***2.5900.096 ***2.7510.047 *1.537
Cognition of GI 0.069 **2.1260.062 *1.9250.039 *1.373
Perception of pluvial flood risk 0.084 **2.0590.049 *1.372
Fac_Technology 0.0120.334
Fac_Support 0.251 ***7.188
Fac_Limit 0.034 0.967
Fac_Improve 0.310 ***8.646
Constant3.832 ***32.1813.172 ***28.2743.485 ***20.3743.745 ***24.751
R20.042 0.053 0.063 0.297
Note: *** p < 0.01, ** p < 0.05, * p < 0.10.

