Article

Objective Measurement of the Mode of Commuting to School Using GPS: A Pilot Study

by
Emilio Villa-González
1,*,
Sergio Rosado-López
2,
Yaira Barranco-Ruiz
1,
Manuel Herrador-Colmenero
2,
Cristina Cadenas-Sánchez
2,
Maria Paula Santos
3 and
Palma Chillón
2
1
Department of Physical and Sports Education, PROFITH “PROmoting FITness and Health through Physical Activity” Research Group, Sport and Health University Research Institute (iMUDS), Faculty of Education and Sport Sciences, University of Granada, 52005 Melilla, Spain
2
PROmoting FITness and Health through physical activity research group (PROFITH), Department of Physical and Sports Education, Faculty of Sport Sciences, University of Granada, 18071 Granada, Spain
3
Centro de Investigação em Actividade Física, Saúde e Lazer (CIAFEL), Faculty of Sport, University of Porto, Rua Dr. Placido Costa, 91, 4200-450, Porto, Portugal
*
Author to whom correspondence should be addressed.
Sustainability 2019, 11(19), 5395; https://doi.org/10.3390/su11195395
Submission received: 22 August 2019 / Revised: 24 September 2019 / Accepted: 24 September 2019 / Published: 29 September 2019
(This article belongs to the Special Issue Applications of New Technologies in Promoting Healthy Lifestyles)

Abstract

:
Background and objectives: Active commuting to school (ACS) is a promising strategy to increase the daily physical activity (PA) in youths. However, more studies are required to objectively quantify the mode of commuting to school, as well as the health impact of this behavior. Thus, the aims of this study were: (1) to objectively determine the mode of commuting to school using GPS; (2) to quantify the sedentary time, PA levels, energy expenditure, and the steps derived from each mode of commuting; and (3) to analyze the associations between ACS trips and sedentary time, PA, energy expenditure, and steps. Participants and Methods: A total of 180 trips to school were detected, which corresponded to 18 adolescents (12 girls, mean age = 15 ± 0.0 years old). Mode of commuting to school was detected using a novel method merging GPS data in the Personal Activity Location Measurement System (PALMS), whereas sedentary time, PA levels, energy expenditure, and steps were objectively evaluated through accelerometry. Logistic regressions were used to analyze the associations of these variables with walking trips. Results: A total of 115 trips were recorded. Most trips were performed by walk (49.5%), followed by vehicle (39.1%) and mixed transport (11.3%). In the active school trips, youths were less likely to spend minutes in sedentary behaviors (OR: 0.481, p = 0.038), a higher increase on Metabolic-Equivalent of Task (METs) (OR: 5.497, p = 0.013), and greater steps (OR: 1.004, p = 0.029) than in the passive school trips (both active and passive modes were objectively measured). Conclusions: ACS (mainly walking) contribute to higher METs and steps in adolescents. GPS could be an appropriate method to objectively evaluate the PA variables related to the ACS trips.

1. Introduction

Physical inactivity is the fourth most prevalent cause of mortality, involving a wide range of non-communicable diseases in the overall population, such as cardiovascular disease or cancer [1]. The decline in physical activity (PA) is more pronounced throughout adolescence [2], with between 60% and 70% failing to meet the daily recommendations of at least 60 min of Moderate-to-Vigorous Physical Activity (MVPA) [3]. Different epidemiological studies have supported the positive effects of active commuting to increase the PA levels in young and adult populations [4,5].
Active commuting to school (ACS)—traveling to and from school by walking or cycling—can increase by 20%–30% the daily amount of MVPA in children and adolescents [6]. A previous systematic review indicated that 82% of the included studies showed positive associations between ACS and PA levels with modest quality of evidence [7]. However, this review study noted that there are few studies that objectively quantified PA or ACS. Objective tools usually require a lot of preparation time and have significant associated cost, whereas subjective measures such as questionnaires often save time and costs, although there are also certain disadvantages and limitations (low response rates or inability to probe responses). Most research on transport-related PA relies on self-reported data and geographic information system (GIS)-based estimates of routes taken, which are not always representative of actual routes [8]. Thus, comparing results across studies should be done with caution as discrepant methods are commonly used to access and classify ACS [9]. In this sense, to the best of our knowledge, few studies used a combination of objective devices to quantify the mode of commuting to and from school and the PA generated by ACS. For instance, in a recent study carried out in Portuguese adolescents using objective measurements (GPS and accelerometer) [10], an average of 12 min of MVPA during walking trips to/from school were observed, corresponding to 20% of the recommendation of daily PA levels. Furthermore, walking to school is considered light or moderate PA, whereas cycling has been shown as MVPA [11].
Another study [12] conducted with Dutch adolescents used a combination of heartrate and accelerometry by the Actiheart monitor and found that ACS contributed to 15% of the total PA energy expenditure. In addition, in New Zealand adolescents, walking commuters to school accumulated an average of 2300 steps per day more than passive travelers measured by pedometer [13]. However, to the best of our knowledge, there is insufficient literature analyzing the energy expenditure and/or the total number of steps associated with ACS behavior, especially addressing each mode of travel separately.
Thus, objective estimations of the mode of commuting to school, including the PA levels, energy expenditure, and number of steps associated with each mode of commuting, are necessary, in order to quantify the health impact of the interventions designed at changing the commuting behavior [14]. Accordingly, our main hypothesis was that a GPS could be a suitable method to objectively evaluate ACS trips, and a combination of GPS with accelerometry could be an appropriate strategy to measure the PA generated by the ACS. Therefore, the aims of this study were: (1) to objectively determine the mode of commuting to school using GPS; (2) to quantify the sedentary time, PA levels, energy expenditure, and the steps derived from each mode of commuting; and (3) to analyze the associations between ACS trips and sedentary time, PA, energy expenditure, and steps.

2. Participants and Methods

2.1. Study Design

2.1.1. Trips to and from School

The participants were recruited from a secondary school within the National Educational System, selected by convenience in Granada (south of Spain) in March 2017. Granada is the capital city of the province of Granada, in the autonomous community of Andalusia (Spain), with an average elevation of 738 m (2421 ft.) above sea level and ranking as the 13th-largest urban area of Spain. The selected school had a medium socio-economic level, being in an urban environment 5.1 km from the center of the city. Regarding weather data, the mean temperature registered in Granada from the Spanish Meteorological State Agency (www.aemet.es) averaged 11 °C during the period of the study) March 2017). The researchers visited the school and invited the students to take part in the study. The school board, parents, and scholars were informed about the study protocols and they agreed to participate. We obtained a written consent from the parents (n = 20). For this study, the total trips to and from school during the school days were analyzed (i.e., 10 possible trips to and from school for each participant during the five school days). The inclusion criteria of the participants were the following: (1) properly completing the activity diary and having all anthropometric measurements; (2) providing GPS data of at least 3 school days/week with a minimum of 9 h of registration [6]; and (3) providing accelerometry data with at least one complete trip to and from school. A flow chart with the total trips collected from the selected sample is presented in Figure 1. Of the 20 participants initially recruited for the study, only 18 met the inclusion criteria (2 boys did not meet the criteria of carrying a minimum of 9 h of GPS registration). Thus, of the 18 participants included, a total of 180 trips were detected (10 possible weekly trips to and from school per participant). The final sample analyzed was 115 trips derived from 18 participants (12 girls, 66.6%) with a mean age of 15 ± 0.0 years old.

2.1.2. Study Design and Procedure

This is a cross-sectional study where the mode of commuting to and from school, sedentary time, PA levels, energy expenditure, and number of steps were objectively evaluated during one week in a sample of Spanish adolescents. Briefly, the adolescents wore an elastic belt with a GPS and an accelerometer device; the GPS was placed on the left side [15] and the accelerometer on the right side of the hip [16] (Figure A1 in Appendix A). The data from the GPS and PA levels were measured during 7 consecutive days. The participants were trained to wear the monitors at all times excluding when sleeping or in water activities. In addition, the adolescents completed a personal diary to register (i) the time they took the devices off, (ii) the time they got up from bed, (iii) the time they went to bed, (iv) the time they left home, and (v) the times they arrived at and returned from school. The study design, study procedures, and informed consent was registered at the Ethical Committee at University of Granada in the Human Research section (14 April 2016, number 162).

2.2. Measurements

2.2.1. Positional Data and Mode of Commuting during the Trips to and from School

The positional data were recorded with a GPS (Qstarz BT-Q1000XT Travel Recorder, International Co., Ltd. Taipei, Taiwan) every 5 s (epoch) [17]. As well as a high accuracy under several environmental circumstances and an optimal signal acquisition time, the GPS has also shown a suitable dynamic accuracy in dissimilar modes of commuting in numerous environments [17]. Functions concerning vibration systems, alarms, and beepers were deactivated before delivering the devices.
The participants were requested to wear the GPS device for 7 consecutive days (left side of the hip). Weekend days were removed from the analysis. A researcher charged the GPS monitors at the school every day. The Personal Activity Location Measurement System (PALMS) (https://ucsd-palms-project.wikispaces.com/) was applied for data managing and analyses. PALMS used the distance and speed among GPS points to establish whether each epoch was part of a trip and to determine the mode of commuting of that trip based on a protocol previously described [10]. This protocol consisted of (1) groups of sequential fixes (≥2 min), which were treated as trips if they reached ≥100 m with an average speed of ≥1.5 km/h, and (2) pauses of up to 3 min that were allowed during a trip to account for conditions such as traffic lights.
Regarding the mode of commuting, PALMS detected “walking trips” if the speed was <10 km/h, “cycling trips” if the speed was between ≥10 and <35 km/h, and “vehicle trips” if the speed was ≥35 km/h [18]. The data (points) were grouped into 30-s intervals. For the current study, we only considered walking and vehicle trips, and when both modes of commuting (i.e., walking and by vehicle) were detected in the same trip, it was categorized as a “mixed transport”. The points estimated as indoors were eliminated from the beginning and end of each trip. Indoor recognition was based on the highest value of the signal to noise ratio of 225 and a maximum satellite ratio of 50. Then, we geocoded the school and participants’ household addresses. The school was considered to be the section on which the geocode point fell, whereas a 25 m Euclidean buffer was applied to each participant’s home address point to consider signal errors. Each trip to or from the school was considered one journey and was used as a unit of analysis. The physical characteristics of the trips, such as the total distance (km), total time (min), and the increase and loss in ground elevation (m) were collected from the GPS device and Google Earth software V. 7.1.4 [19]. Finally, a new variable of ACS was created, where walking trips were categorized as ACS, vehicle trips were categorized as non-ACS, and both cycling and mixed trips were excluded.

2.2.2. Activity Diary

Throughout the evaluation period, the adolescents filled an activity diary in which they were requested to register all PA achieved every day. The adolescents were trained to include the exact times of start and end of all physical activities that lasted more than 5 min. The activities were detailed in the diary to the most exact minute, and the participants were taught to complete the diary just after they had completed every activity. The participants were also requested to record the periods during which the accelerometer was not worn in the diary (e.g., during swimming or bathing). The activity diary was small and with a convenient size for easily be kept in a back-bag or pocket.

2.2.3. Sedentary Time and PA

The participants were instructed to wear the accelerometer for 7 complete days (right side of the hip). We assessed, in total, 5 days of sedentary time and PA levels using ActiGraph accelerometers (GT3X, ActiGraph, Pensacola, FL). Weekend days were removed for the analysis. The raw accelerations collected at a sampling frequency of 100 Hz were processed in ActiLife software (v.6). To process the data in ActiLife: 1) we imported the ActiGraph’s activity counts over 15s epochs using the default (normal) filter following previous recommendations for this age group [20]; 2) we calculated the non-wear time using Troiano’s algorithm [21]; and 3) we selected the time intervals of commuting to and from school for specific analyses.
For sedentary time and PA intensities (light and MVPA), we applied the cut-off points of Hänggi et al. [22]. Energy expenditure (METs) was calculated using the algorithm of Freedson et al. [23]. The number of total steps was also recorded. PA information was extracted from the trips to school, from school, to and from school together as well as from the whole day (i.e., 100%) for each of the participants. The type of activity regarding intensity (sedentary, light, and moderate-to-vigorous) was presented in percentages of time spent in sedentary behavior, light PA, and MVPA, as well as, in total time spent in sedentary behavior, light PA, and MVPA according to the mode of commuting to school.

2.2.4. Anthropometric Characteristics

Anthropometric characteristics were measured wearing sportwear (shorts and a short sleeve shirt) and without shoes. The weight was assessed with a 0.1 kg approximation using a scale weighing system (Seca 876, Ltd., Hamburg, Germany). The height was evaluated using the Frankfort plane, with a 0.1 cm approximation applying a stadiometer (Seca 2013, Ltd., Hamburg, Germany). The waist circumference (minimum circumference) was measured on a horizontal plane, at the level of the natural waist, with a measuring tape (Seca 201, Ltd., Hamburg, Germany). The height, weight, and waist circumference were measured twice but not consecutively, and the average of the two measurements was used for the final analysis. Body mass index (BMI) was estimated as the weight (kilograms) divided by the square of the height (meters) (kg/m2) [24].

2.3. Statistical Analyses

The descriptive statistics (means, standard deviations, and percentages) were reported for all analyzed variables. We used one-way analysis of variance to compare the three modes of commuting detected during the trips to and from the school (i.e., walking, vehicle, and mixed transport) with the Bonferroni post hoc test. The Chi-square test was used to compare the modes of commuting by gender. We used logistic regressions to analyze the associations of sedentary and PA time (i.e., minutes of light PA, and MVPA), energy expenditure, and number of steps with walking to school trips (i.e., ACS) among adolescents in different models, controlling by total PA time and increase in ground elevation. The analyses were carried out using the SPSS (v. 20.0 for Windows, Chicago, IL, USA), and the level of significance was set at p < 0.05.

3. Results

Table 1 shows the characteristics of the trips in each mode of commuting carried out by the participants of the study. From a total of 180 trips (i.e., 10 possible trips per week by 18 adolescents), a total of 115 trips (63.8%) to and from school were detected. Main reasons for the missing data were that some devices were not worn the full day. These trips derived from the final sample, where there was total of 18 participants (12 girls) who presented a similar age (both 15.0 ± 0.1 yr). Regarding their anthropometric characteristics, boys were taller than girls (boys = 172.9 ± 5.9 cm; girls = 160.7 ± 5.3 cm, p < 0.001). Boys also displayed higher values than girls in weight (boys = 62.5 ± 14.3 kg; girls = 54.0 ± 8.0 kg), waist circumference (boys = 74.1 ± 9.2 cm; girls = 65.7 ± 6.7 cm), and BMI (boys = 21.3 ± 3.4 kg/m2; girls = 21.1 ± 3.5 kg/m2) (all p > 0.05).
Boys reported a higher percentage of trips walking (+4.4%), but a lower percentage of trips by vehicle (−1.3%) and mixed transport (−2.8%) than girls. However, we observed no statistical differences between the modes of commuting according to the gender (Chi-square; p = 0.857). Regarding the physical characteristics of the trips, mixed transport trips accounted for a significant higher average of total distance (km) and increase and loss in elevation (m) than the walking and vehicle trips (p < 0.001 for all comparisons). Trips by vehicle, on the other hand, showed a significantly lower average of total time (min) compared to trips in other modes of commuting (vehicle = 7.6 ± 5.6 min vs walking = 19.7 ± 9.7 min and mixed transport = 35.6 ± 28.8 min; p < 0.001). Regarding time spent doing PA, trips by mixed transport spent significantly more minutes in sedentary behavior (p = 0.11) and light PA (p < 0.001), compared to trips by walking. Conversely, a significant greater average of minutes on MVPA was found in the walking trips (walking = 11.4 ± 6.4 min vs vehicle = 0.8 ± 2.1 min; p < 0.001 and walking = 11.4 ± 6.4 min vs mixed transport = 1.9 ± 1.1 min, p = 0.001). Finally, walking trips also showed a significant higher daily amount of METs/min (p < 0.001) and number of steps compared with trips by vehicle or mixed transport (p < 0.001 and p = 0.004, respectively).
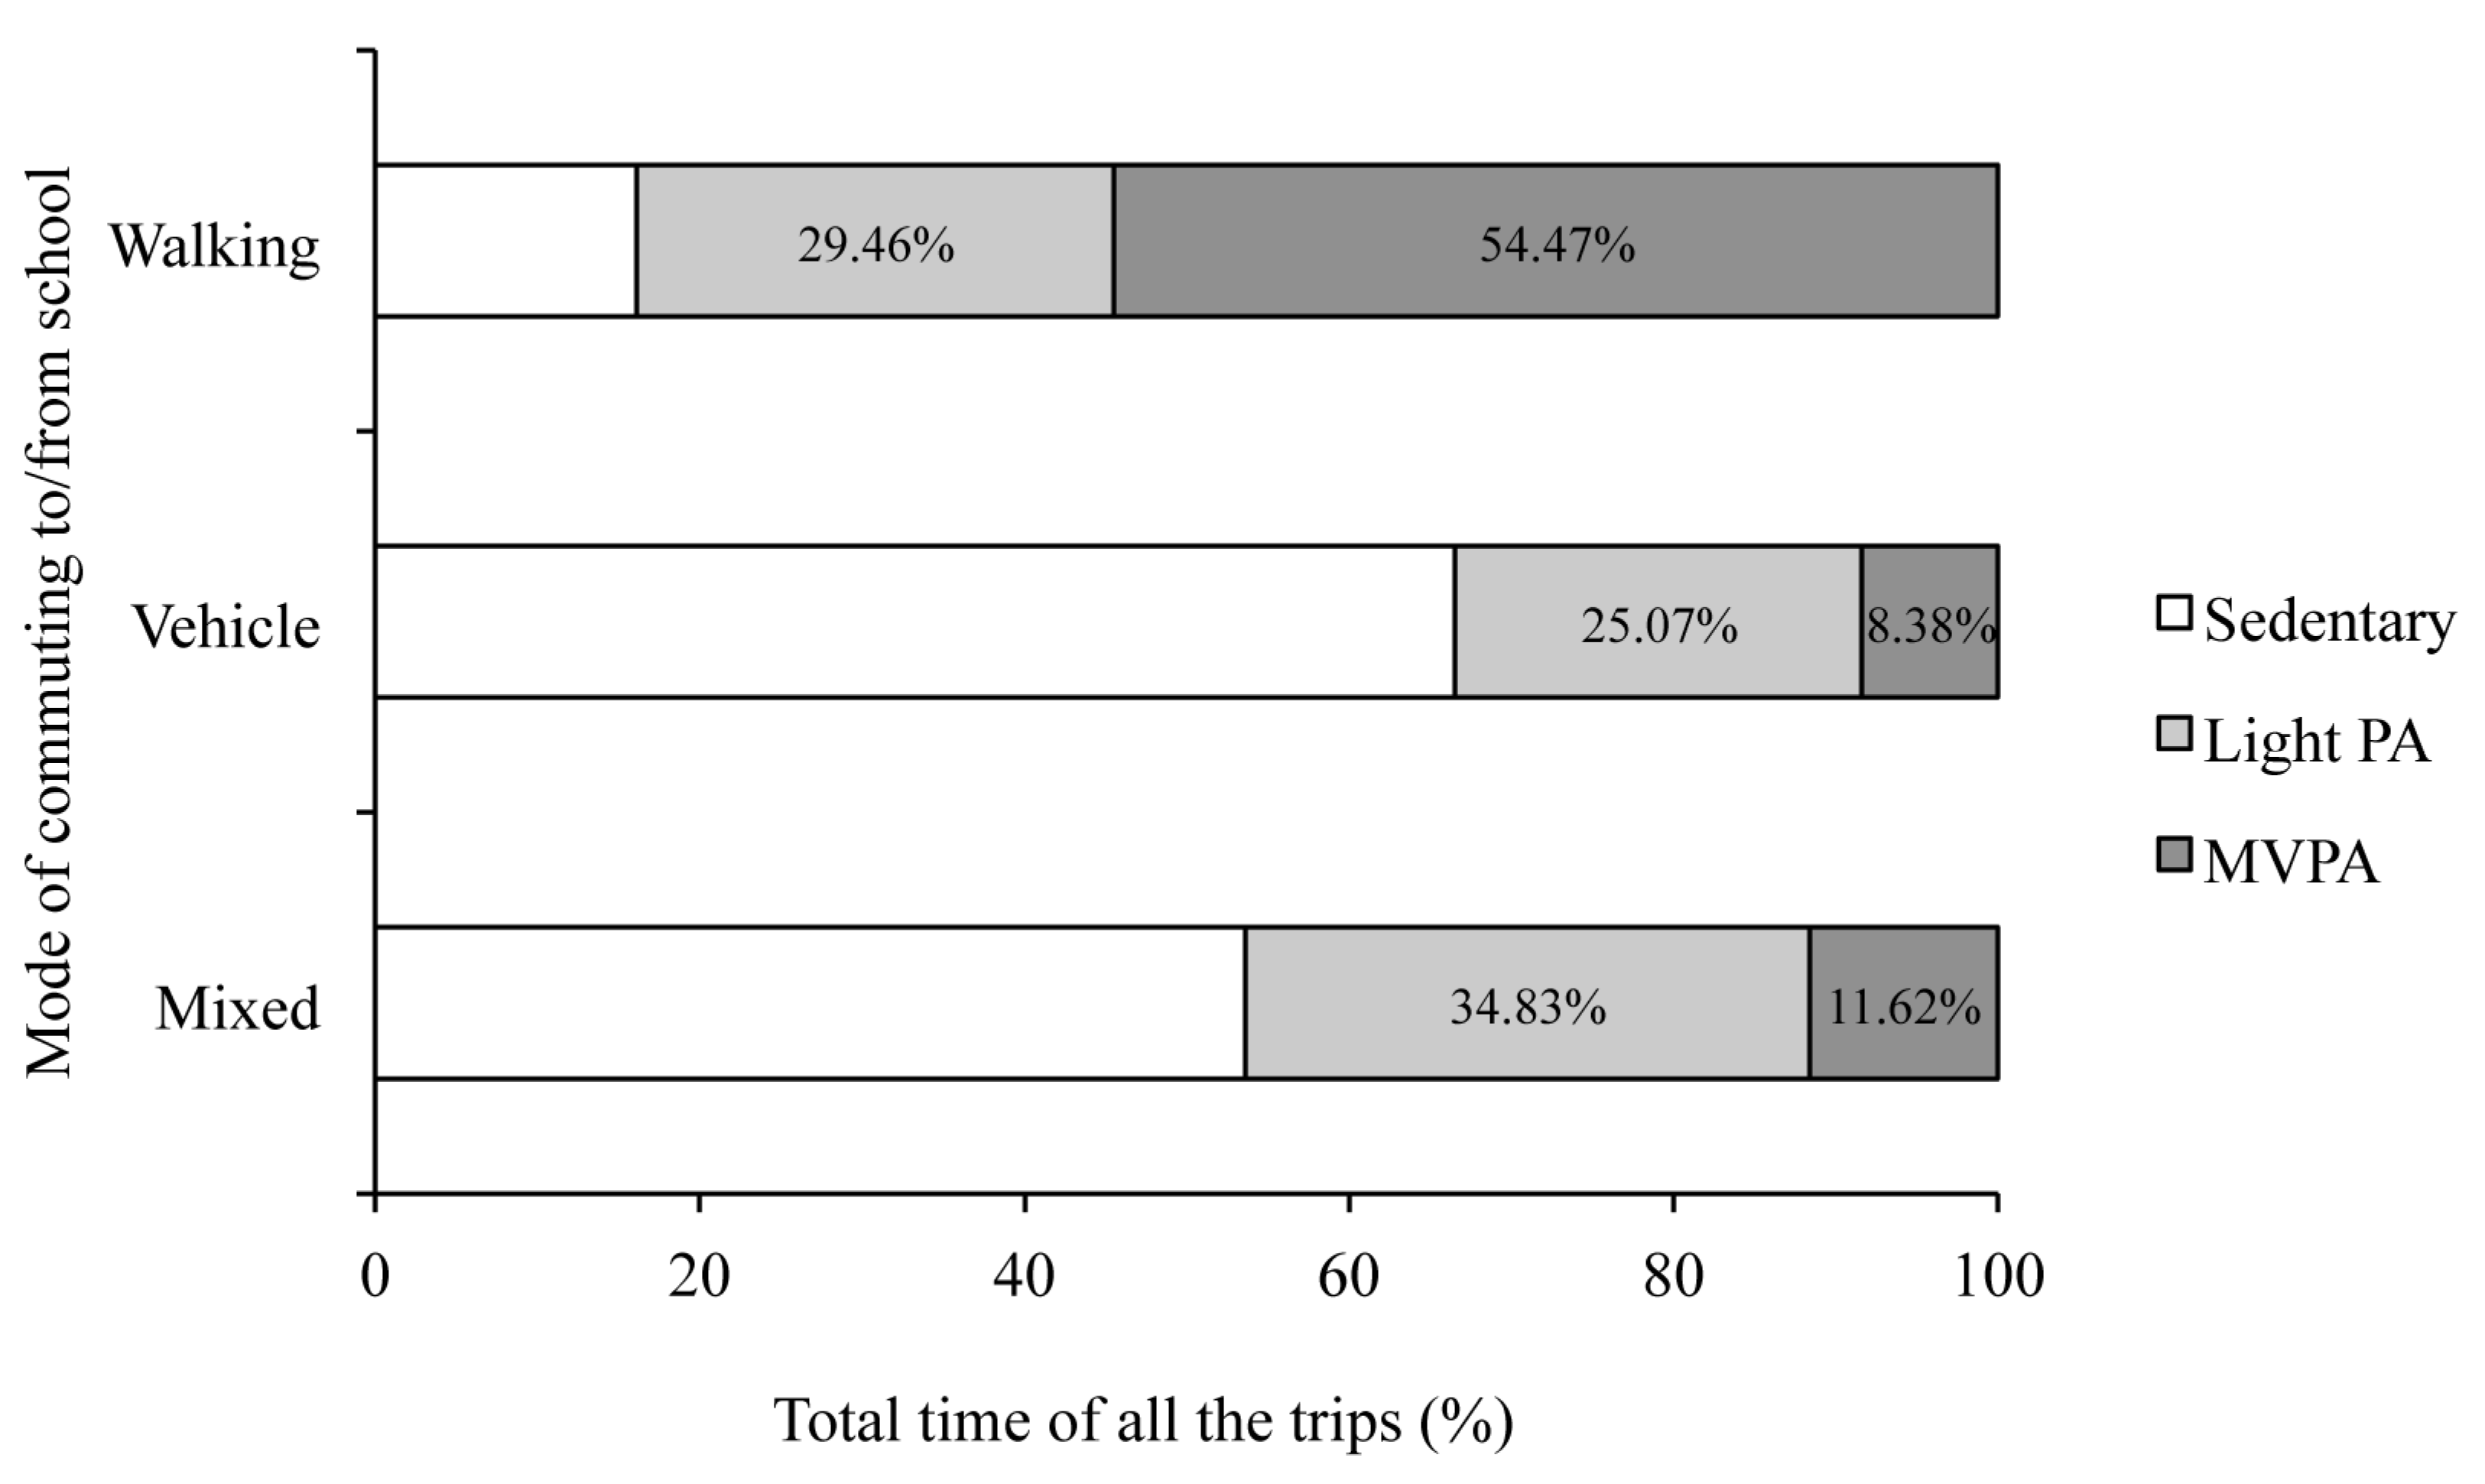
Within all the trips, the percentages of time spent in sedentary behavior, light PA, and MVPA by mode of commuting are shown in Figure 2. The highest percentage of sedentary time was observed in trips by vehicle (66.6%) and by mixed transport (53.6%). In walking trips, the sedentary time was the lowest (16.1%). Regarding light PA, the percentages were similar in all modes of transport (25–35%), whereas the percentages of MVPA were entirely different in walking trips (54.5%) compared to trips by mixed transport (11.6%) and vehicle (8.4%).
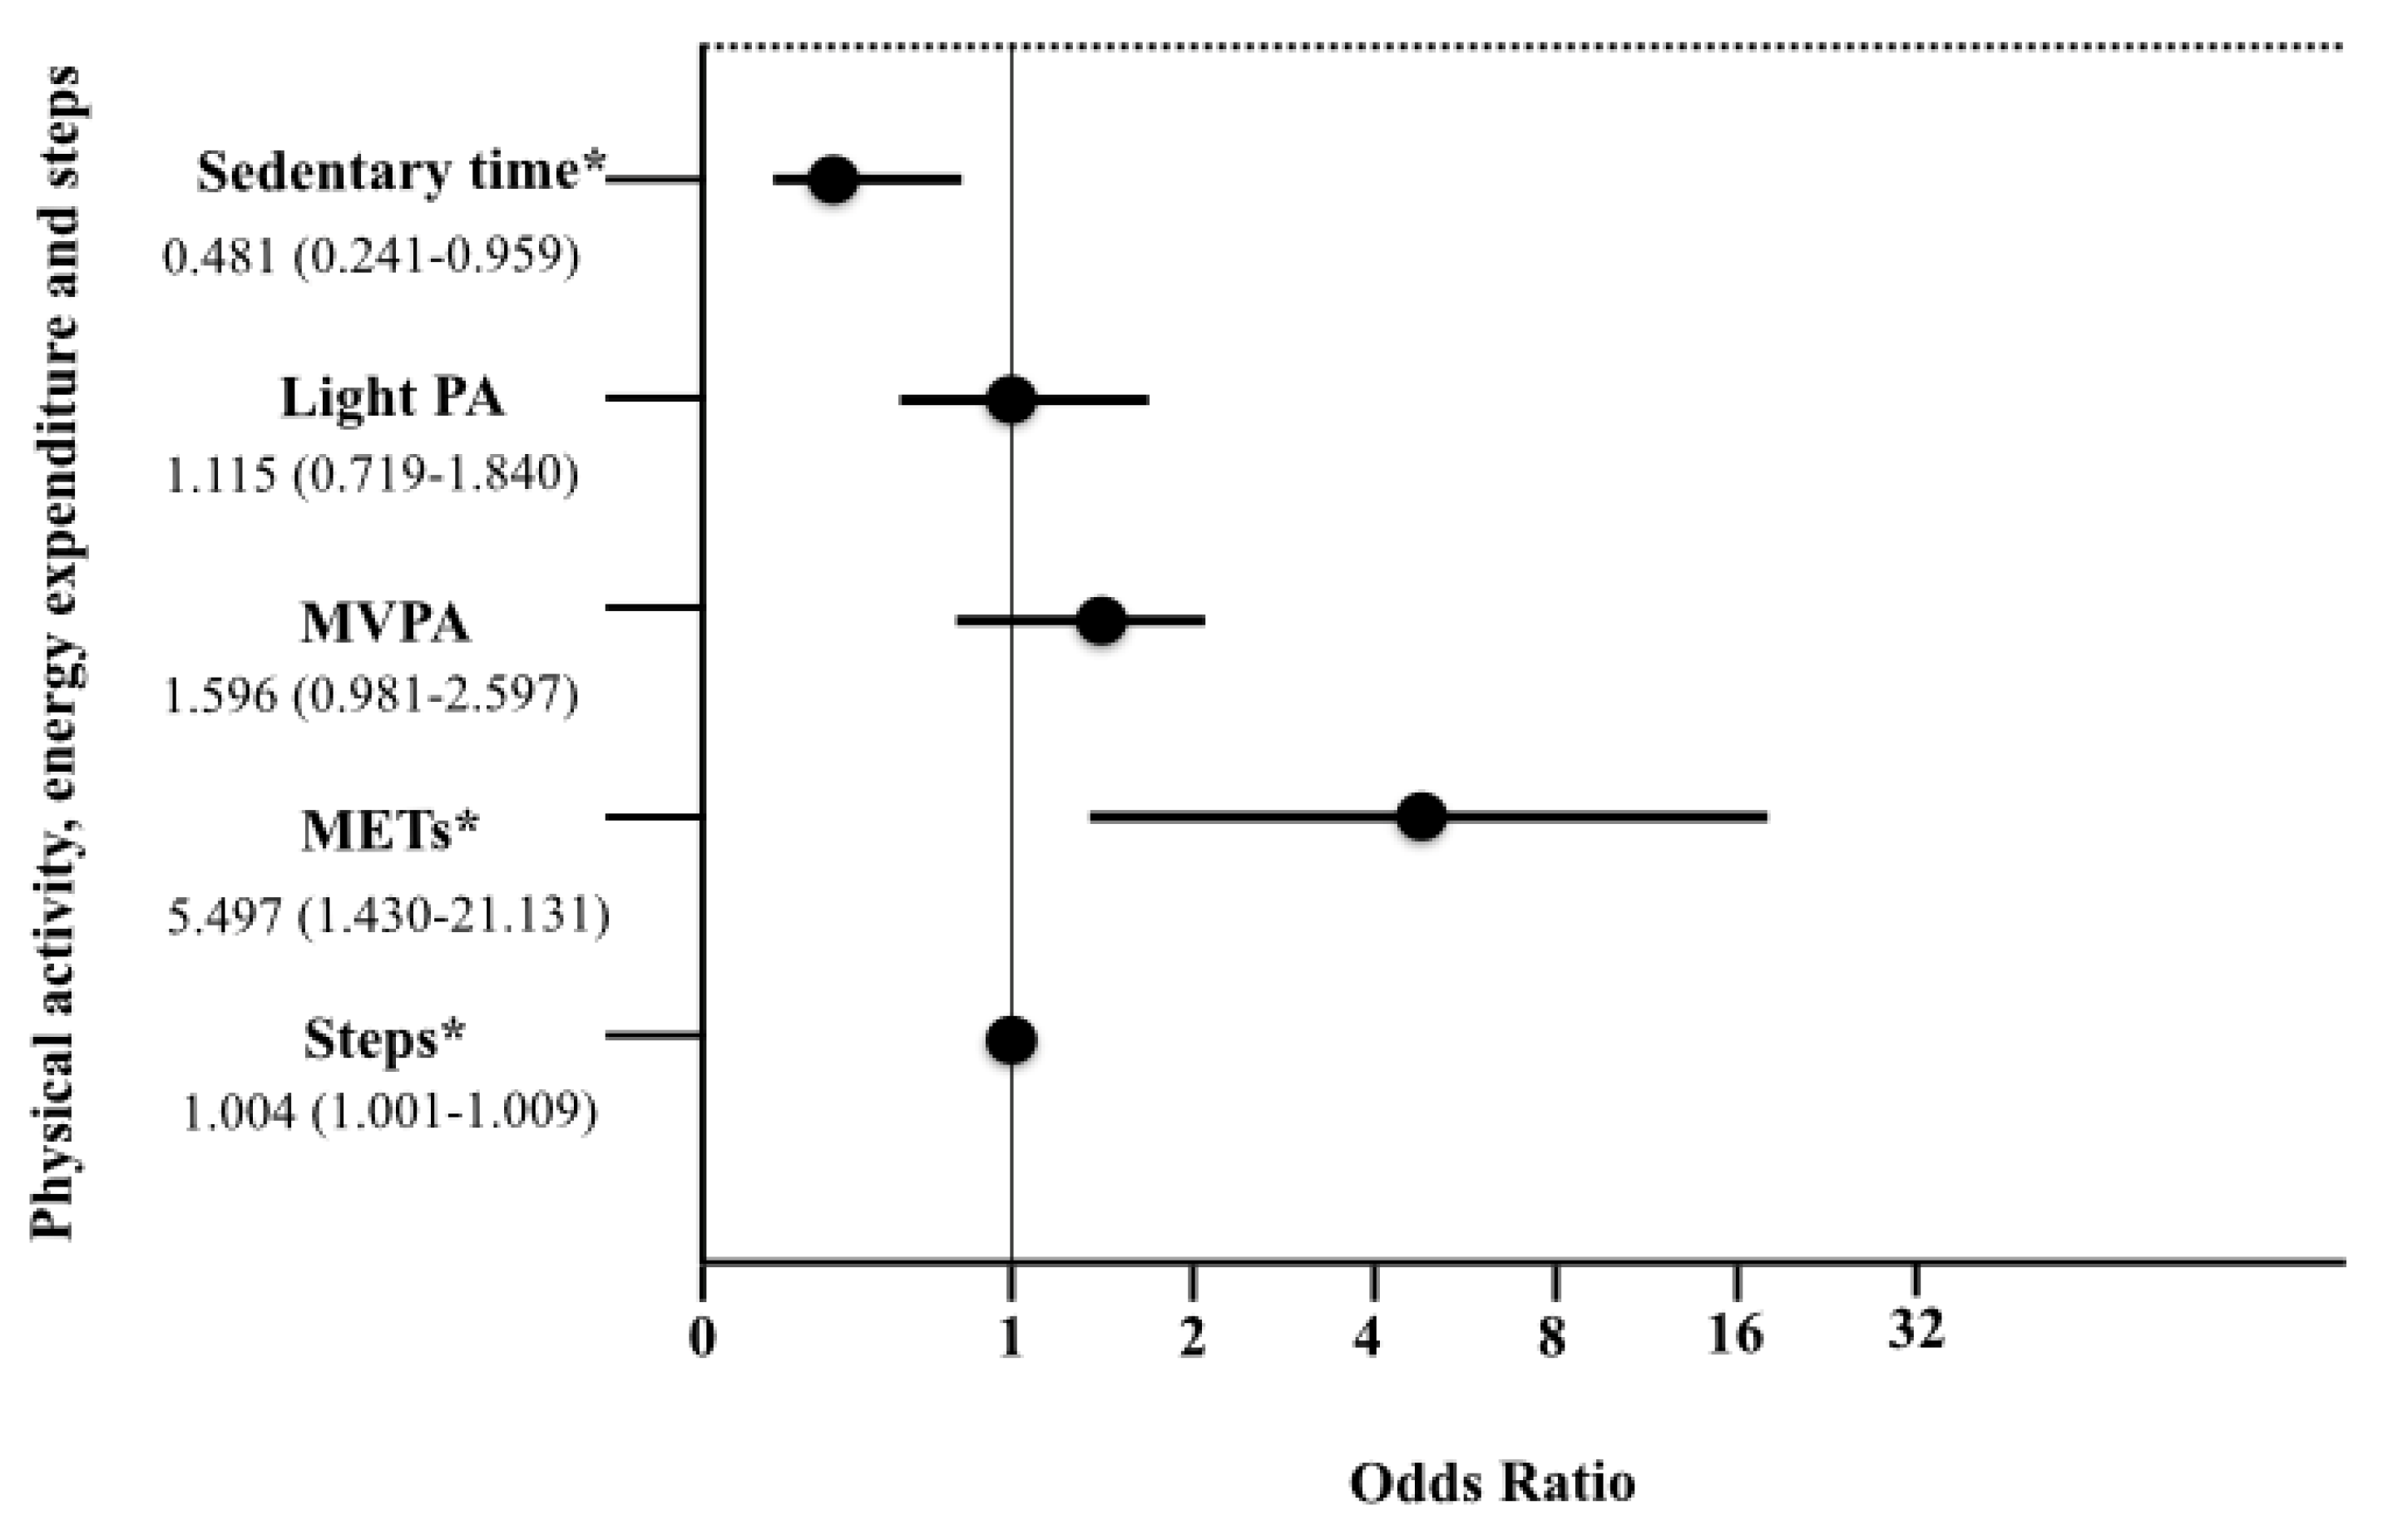
The associations between the new variable of ACS (i.e., walking trips) with PA (sedentary, light PA, and MVPA), energy expenditure (METs), and steps (nº) are shown in Figure 3. For PA variables, no associations were found between ACS and light PA or MVPA (both p > 0.05). In the walking trips objectively measured, there was less likely to spend minutes in a sedentary behavior (OR: 0.481, 95% CI: 0.241–0.959, p = 0.038), they presented a higher increase on METs (OR: 5.497, 95% CI: 1.430–21.131, p = 0.013) as well as a greater number of steps (OR: 1.004, 95% CI: 1.001−1.009, p = 0.029), than the passive trips.

4. Discussion

The main findings of the present study were that walking trips objectively measured using GPS were the main mode of commuting to and from school, as well as the mode with the largest amount of MVPA (54.5%). In addition, in the walking trips youths were less likely to spend minutes in a sedentary behavior, there was a higher increase on METs, and a greater number of steps than in the passive trips.
In the current study, walking was the main mode of commuting, accounting for 50% of the trips to and from school. Similarly, in a study conducted from 2007 to 2008, 50% of adolescents displayed ACS, mainly walking [25], whereas another study found that 60% of Spanish children aged 8–15 years old showed ACS [26]. The differences between children and adolescents could be because children are less independent than adolescents to choose the mode of commuting to school, since they are often guided by their parents [26]. In addition, the difficulty to compare both studies should be noted, given the different types of assessments conducted (i.e., GPS vs. self-reported questionnaires). Likewise, a study [10] carried out in Portuguese adolescents (average age 15.9 ± 1.1 years old) also measured the mode of commuting by GPS and found that walking was the main mode of commuting to school (68.8%), while bicycling was less usual (14.4%). The average home–school walking trip distance in this study was 0.9 km with a trip mean of duration of 14.5 min. In our study, we observed an average distance of 1.3 km and an average of duration of 19.7 min in the walking trips. We did not include cycling as a mode of commuting in our analysis, and therefore we could not compare these data with those of other studies. The exclusion was based on several reasons. First, although preceding studies discovered a 73% agreement between PALMS bicycling and SenseCamp trips [18], the percentages of youth cycling to school in Spain were low (≈1%) [27,28]. Secondly, in the Portuguese study, the cycling trips were overestimated based on the same method to categorize trips, i.e., GPS and PALMS software [10].
Regarding the association between PA and ACS trips, the main findings were that there were no associations, but there were twice more likely to choose an active mode of commuting for every minute less of sedentary time (p < 0.05). A previous systematic review [7] showed positive associations between ACS and daily PA levels, but there are few studies analyzing the association only derived from the PA generated by ACS journeys. A study [29] conducted in adolescents from New Zealand (mean age = 15 years old) showed that fewer screens per household (OR: 0.53, 0.35–0.82) and meeting screen time guidelines (OR 1.74: 1.22–2.50) were positively associated with ACS. However, it seems that studies examining the relationship between sedentary time and PA behaviors, such as ACS, have reported incongruous results [30].
Regarding energy expenditure, we observed that the highest mean of METs/min was presented in walking trips (3.4 ± 0.7 METs/min) compared to vehicle and mixed commuting modes. Moreover, adolescents who chose ACS trips were 5 times more likely to have a higher increase on METs. Although some studies have dedicated on evaluating total PA energy expenditure (PAEE) in adolescents [31,32], the contribution of different daily activities, such as ACS, to total PAEE in adolescents is undetermined, perhaps due to methodological problems in calculating PAEE in daily living situations [33]. In a previous study conducted in Dutch adolescents [12], ACS contributed 15% to total PAEE, being a stronger predictor of PAEE than of other daily activities, such as physical education class, leisure time activities, sports, or work. In addition, a positive linear relationship was discovered between the distance walked to and from school and MVPA, where children who performed trips to school of 3 km had higher overall daily MVPA. Furthermore, total PAEE (kJ/day) was significantly higher in boys than in girls during school time (p < 0.05), according to heart rate and accelerometer data. In the present study, there were no differences among gender (data not shown), and comparisons must be drawn with caution due to difference in the methods used to quantify energy expenditure (i.e., we estimated energy expenditure using an indirect formula by accelerometry).
Finally, we found that by every 100 additional steps per day, there is a 50% probability to perform ACS trips. Moreover, the walking mode presented the greatest number of steps (mean = 1681 ± 858), corresponding to 17% of the daily recommendations, which for adolescents (boys and girls) may be associated with 60 min of MVPA [34]. In line with our findings, a study [13] conducted in New Zealand adolescents observed significant differences in the number of steps between the different modes of commuting. In this sense, active commuters who traveled on foot presented a total of 13,308 ± 483 steps, being these 2300 daily steps more than the passive peers. However, in this study the steps derived from commuting to and from school were not measured. Thus, comparisons between results must be drawn with caution given the different methods used to measure the number of steps, such as accelerometers or pedometers.
A relevant practical implication is to translate the mode of commuting into PA recommendations. Walking trips to and from school contributed to a mean of 11.4 min on MVPA, corresponding to ≈20% of the daily recommendations in this population. Our results emphasize the important role that the trip to/from school may have in youth to reach the recommended PA levels according guidelines, and accomplishing health benefits. Thus, strategies aiming to increase this behavior are an appropriate approach for increasing PA levels in this population [35]. However, to the best of our knowledge, few studies used a combination of GPS, accelerometry, and PALMS software to objectively quantify the PA generated by ACS. In the Portuguese study [10], a similar average of 12 min on MVPA was observed during walking trips to and from school. Likewise, Southward et al. [36] detected approximately 11 min of MVPA during home–school trips, whereas in the Voss et al. study [37] walking trips imply average gains of 9.2 min of MVPA. The difference in MVPA time during school trips may be linked to characters of the built environment (e.g., slope) as well as the measures used to assess ACS (e.g., interview, questionnaires, GPS, etc.) or PA (e.g., accelerometry, questionnaires, etc.); hence further research is needed. However, the translation of active commuting to commuting into PA recommendations should be done with caution, since the sample is relatively small in our study. Additionally, as expected, in this study vehicle trips presented the highest sedentary time (66.5%), followed by mixed transport (53.5%). However, and interestingly, walking trips presented sedentary time (16%), while trips by vehicle showed time on MVPA (8.3%). Several reasons could explain these findings; 1) the cut-off point on the time of departure and arrival from home to school, taken from the diary filled by participants, may not be an exact time since it was self-reported by participants. In this sense, it could be possible that the hypothetical trip to and from the school included other activities (e.g., going down the home stairs, running towards the vehicle or school, etc.); 2) The road while driving could be irregular, then, the axis of the accelerometer could change position, quantifying that activity as MVPA. Consequently, mixed and vehicle trips accounted for a higher increase and loss in elevation (m) average than the walking trips in this study. Finally, it should be taken into account that although vehicle trips presented a small percentage on MVPA, it is a very low rate (0.8 ± 2.1 min).
The present cross-sectional study has some limitations. First, there is a lag between the GPS connecting with satellites and when a person leaves a building. In addition, the GPS signal may also be interrupted by buildings or tree cover [38]. Secondly, we are aware that there was a difference in the sample frequency of the devices and that a frequency below 1 Hz was not reported to be valid in different walking studies. Third, although this study includes a reduced sample size of participants (i.e., n = 18), the data for analysis used has been the number of trips including a total of 115 trips to and from school. The main strength was that, to the best of our knowledge, this is one of the first studies using objective methods to classify trip modes in home–school trips in a sample of Spanish adolescents.

5. Conclusions

Walking was the main mode of commuting to and from school in this study, reporting the largest amount of MVPA (54.5%). Moreover, the active trips were less likely to spend minutes in sedentary behaviors, showed a higher increase in METs, and greater number of steps than in passive trips. Thus, ACS trips objectively measured using GPS could be an appropriate method to evaluate this behavior.

Author Contributions

Conceptualization, E.V.-G., S.R.-L., and P.C.; Data curation, S.R.-L., Y.B.-R., M.H.-C. and C.C.-S.; Formal analysis, E.V.-G., Y.B.-R., M.H.-C. and P.C.; Methodology, E.V.-G., M.P.S., and P.C.; Project administration, P.C.; Writing—original draft, S.R.-L., E.V.-G., Y.B.-R. and M.H.-C.; Writing—review & editing, E.V.-G., Y.B.-R., C.C.-S., M.P.S., and P.C.

Funding

This study was supported by the Spanish Ministry of Economy, Industry and Competitiveness and the European Regional Development Fund (DEP2016-75598-R, MINECO/FEDER, UE). Additionally, this study takes place thanks to funding from the University of Granada, Plan Propio de Investigación 2016, Excellence actions: Units of Excellence; Unit of Excellence on Exercise and Health (UCEES). To PACO project (Pedalea y Anda al Cole), from PROFITH group, University of Granada.

Acknowledgments

The authors acknowledge the help of the subjects that took part in the study and thank their parents for their cooperation. We are also grateful to Ms. Carmen Sainz-Quinn for assistance with the English language.

Conflicts of Interest

The authors declare no conflict of interest.

Appendix A

Figure A1. Example of a participant wearing the accelerometer and GPS devices.
Sustainability 11 05395 g0a1

References

  1. WHO. Global Recommendations on Physical Activity for Health; World Health Organ Publications: Geneva, Switzerland, 2010. [Google Scholar]
  2. Dumith, S.C.; Gigante, D.P.; Domingues, M.R.; Kohl, H.W. Physical activity change during adolescence: A systematic review and a pooled analysis. Int. J. Epidemiol. 2011, 40, 685–698. [Google Scholar] [CrossRef] [PubMed]
  3. Ekelund, U.; Tomkinson, G.; Armstrong, N. What proportion of youth are physically active? Measurement issues, levels and recent time trends. Br. J. Sports Med. 2011, 45, 859–865. [Google Scholar] [CrossRef] [PubMed]
  4. Crawford, S.; Garrard, J. A combined impact-process evaluation of a program promoting active transport to school: Understanding the factors that shaped program effectiveness. J. Environ. Public Health 2013, 2013, 816961. [Google Scholar] [CrossRef] [PubMed]
  5. McDonald, N.C.; Steiner, R.L.; Lee, C.; Smith, T.R.; Zhu, X.M.; Yang, Y.Z. Impact of the safe routes to school program on walking and bicycling. J. Am. Plan. Assoc. 2014, 80, 153–167. [Google Scholar] [CrossRef]
  6. Klinker, C.D.; Schipperijn, J.; Toftager, M.; Kerr, J.; Troelsen, J. When cities move children: Development of a new methodology to assess context-specific physical activity behaviour among children and adolescents using accelerometers and gps. Health Place 2015, 31, 90–99. [Google Scholar] [CrossRef] [PubMed]
  7. Larouche, R.; Saunders, T.J.; Faulkner, G.; Colley, R.; Tremblay, M. Associations between active school transport and physical activity, body composition; cardiovascular fitness: A systematic review of 68 studies. J. Phys. Act. Health 2014, 11, 206–227. [Google Scholar] [CrossRef] [PubMed]
  8. Duncan, M.J.; Mummery, W.K. Gis or gps? A comparison of two methods for assessing route taken during active transport. Am. J. Prev. Med. 2007, 33, 51–53. [Google Scholar] [CrossRef] [PubMed]
  9. Sirard, J.R.; Slater, M.E. Walking and bicycling to school: A review. Am. J. Lifestyle Med. 2008, 2, 372–396. [Google Scholar] [CrossRef]
  10. Pizarro, A.N.; Schipperijn, J.; Andersen, H.B.; Ribeiro, J.C.; Mota, J.; Santos, M.P. Active commuting to school in portuguese adolescents: Using palms to detect trips. J. Transport. Health 2016, 3, 297–304. [Google Scholar] [CrossRef]
  11. Cooper, A.R.; Andersen, L.B.; Wedderkopp, N.; Page, A.S.; Froberg, K. Physical activity levels of children who walk, cycle, or are driven to school. Am. J. Prev. Med. 2005, 29, 179–184. [Google Scholar] [CrossRef]
  12. Slingerland, M.; Borghouts, L.B.; Hesselink, M.K. Physical activity energy expenditure in dutch adolescents: Contribution of active transport to school, physical education, and leisure time activities. J. Sch. Health 2012, 82, 225–232. [Google Scholar] [CrossRef] [PubMed]
  13. Hohepa, M.; Schofield, G.; Kolt, G.S.; Scragg, R.; Garrett, N. Pedometer-determined physical activity levels of adolescents: Differences by age, sex, time of week, and transportation mode to school. J. Phys. Act. Health 2008, 5 (Suppl. 1), S140–S152. [Google Scholar] [CrossRef] [PubMed]
  14. Shephard, R.J. Is active commuting the answer to population health? Sports Med. 2008, 38, 751–758. [Google Scholar] [CrossRef] [PubMed]
  15. Perez, L.G.; Carlson, J.; Slymen, D.J.; Patrick, K.; Kerr, J.; Godbole, S.; Elder, J.P.; Ayala, G.X.; Arredondo, E.M. Does the social environment moderate associations of the built environment with latinas’ objectively-measured neighborhood outdoor physical activity? Prev. Med. Rep. 2016, 4, 551–557. [Google Scholar] [CrossRef] [PubMed]
  16. Torres-Luque, G.; Fernandez, I.; Santos-Lozano, A. Actividad física y acelerometría; orientaciones metodológicas, recomendaciones y patrones. Nutr. Hosp. 2014, 31, 115–128. [Google Scholar]
  17. Schipperijn, J.; Kerr, J.; Duncan, S.; Madsen, T.; Klinker, C.D.; Troelsen, J. Dynamic accuracy of gps receivers for use in health research: A novel method to assess gps accuracy in real-world settings. Front. Public Health 2014, 2, 21. [Google Scholar] [CrossRef] [PubMed]
  18. Carlson, J.A.; Jankowska, M.M.; Meseck, K.; Godbole, S.; Natarajan, L.; Raab, F.; Demchak, B.; Patrick, K.; Kerr, J. Validity of palms gps scoring of active and passive travel compared with sensecam. Med. Sci. Sports Exerc. 2015, 47, 662–667. [Google Scholar] [CrossRef] [PubMed]
  19. Wang, Y.; Zou, Y.; Henrickson, K.; Wang, Y.; Tang, J.; Park, B.J. Google earth elevation data extraction and accuracy assessment for transportation applications. PLoS ONE 2017, 12, e0175756. [Google Scholar] [CrossRef]
  20. Migueles, J.H.; Cadenas-Sanchez, C.; Ekelund, U.; Delisle Nystrom, C.; Mora-Gonzalez, J.; Lof, M.; Labayen, I.; Ruiz, J.R.; Ortega, F.B. Accelerometer data collection and processing criteria to assess physical activity and other outcomes: A systematic review and practical considerations. Sports Med. 2017, 47, 1821–1845. [Google Scholar] [CrossRef]
  21. Troiano, R.P. Large-scale applications of accelerometers: New frontiers and new questions. Med. Sci. Sports Exerc. 2007, 39, 1501. [Google Scholar] [CrossRef]
  22. Hanggi, J.M.; Phillips, L.R.; Rowlands, A.V. Validation of the gt3x actigraph in children and comparison with the gt1m actigraph. J. Sci. Med. Sport 2013, 16, 40–44. [Google Scholar] [CrossRef]
  23. Freedson, P.; Pober, D.; Janz, K.F. Calibration of accelerometer output for children. Med. Sci. Sports Exerc. 2005, 37, S523–S530. [Google Scholar] [CrossRef]
  24. Coelho, J.S.; Pullmer, R.; Robertson, M.; Marshall, S.; Lam, P.Y. Attitudes toward anthropometric measurements in youth: The role of eating pathology. Can. J. Behav. Sci. -Rev. Can. Sci. Comport. 2016, 48, 232–237. [Google Scholar] [CrossRef]
  25. Chillon, P.; Martinez-Gomez, D.; Ortega, F.B.; Perez-Lopez, I.J.; Diaz, L.E.; Veses, A.M.; Veiga, O.L.; Marcos, A.; Delgado-Fernandez, M. Six-year trend in active commuting to school in spanish adolescents. The avena and afinos studies. Int. J. Behav. Med. 2013, 20, 529–537. [Google Scholar] [CrossRef] [PubMed]
  26. Herrador-Colmenero, M.; Villa-Gonzalez, E.; Chillon, P. Children who commute to school unaccompanied have greater autonomy and perceptions of safety. Acta Paediatr. 2017, 106, 2042–2047. [Google Scholar] [CrossRef] [PubMed]
  27. Villa-Gonzalez, E.; Ruiz, J.R.; Ward, D.S.; Chillon, P. Effectiveness of an active commuting school-based intervention at 6-month follow-up. Eur. J. Public Health 2016, 26, 272–276. [Google Scholar] [CrossRef] [PubMed]
  28. Villa-Gonzalez, E.; Ruiz, J.R.; Mendoza, J.A.; Chillon, P. Effects of a school-based intervention on active commuting to school and health-related fitness. BMC Public Health 2017, 17, 20. [Google Scholar] [CrossRef]
  29. Mandic, S.; de la Barra, S.L.; Bengoechea, E.G.; Stevens, E.; Flaherty, C.; Moore, A.; Middlemiss, M.; Williams, J.; Skidmore, P. Personal, social and environmental correlates of active transport to school among adolescents in otago, new zealand. J. Sci. Med. Sport 2015, 18, 432–437. [Google Scholar] [CrossRef] [PubMed]
  30. Aires, L.; Pratt, M.; Lobelo, F.; Santos, R.M.; Santos, M.P.; Mota, J. Associations of cardiorespiratory fitness in children and adolescents with physical activity, active commuting to school; screen time. J. Phys. Act. Health 2011, 8, S198–S205. [Google Scholar] [CrossRef]
  31. Vermorel, M.; Vernat, J.; Bitar, A.; Fellmann, N.; Coudert, J. Daily energy expenditure, activity patterns, and energy costs of the various activities in french 12-16-y-old adolescents in free living conditions. Eur. J. Clin. Nutr. 2002, 56, 819–829. [Google Scholar] [CrossRef]
  32. Ekelund, U.; Sjostrom, M.; Yngve, A.; Nilsson, A. Total daily energy expenditure and pattern of physical activity measured by minute-by-minute heart rate monitoring in 14-15 year old swedish adolescents. Eur. J. Clin. Nutr. 2000, 54, 195–202. [Google Scholar] [CrossRef] [PubMed]
  33. Corder, K.; Ekelund, U.; Steele, R.M.; Wareham, N.J.; Brage, S. Assessment of physical activity in youth. J. Appl. Physiol. 2008, 105, 977–987. [Google Scholar] [CrossRef]
  34. Tudor-Locke, C.; Craig, C.L.; Beets, M.W.; Belton, S.; Cardon, G.M.; Duncan, S.; Hatano, Y.; Lubans, D.R.; Olds, T.S.; Raustorp, A.; et al. How many steps/day are enough? For children and adolescents. Int. J. Behav. Nutr. Phys. Act. 2011, 8, 78. [Google Scholar] [CrossRef]
  35. Villa-González, E.; Barranco-Ruiz, Y.; Evenson, K.R.; Chillón, P. Systematic review of interventions for promoting active school transport. Prev. Med. 2018, 111, 115–134. [Google Scholar] [CrossRef] [PubMed]
  36. Southward, E.F.; Page, A.S.; Wheeler, B.W.; Cooper, A.R. Contribution of the school journey to daily physical activity in children aged 11-12 years. Am. J. Prev. Med. 2012, 43, 201–204. [Google Scholar] [CrossRef]
  37. Voss, C.; Winters, M.; Frazer, A.; McKay, H. School-travel by public transit: Rethinking active transportation. Prev. Med. Rep. 2015, 2, 65–70. [Google Scholar] [CrossRef] [PubMed] [Green Version]
  38. Kerr, J.; Duncan, S.; Schipperijn, J. Using global positioning systems in health research: A practical approach to data collection and processing. Am. J. Prev. Med. 2011, 41, 532–540. [Google Scholar] [CrossRef]
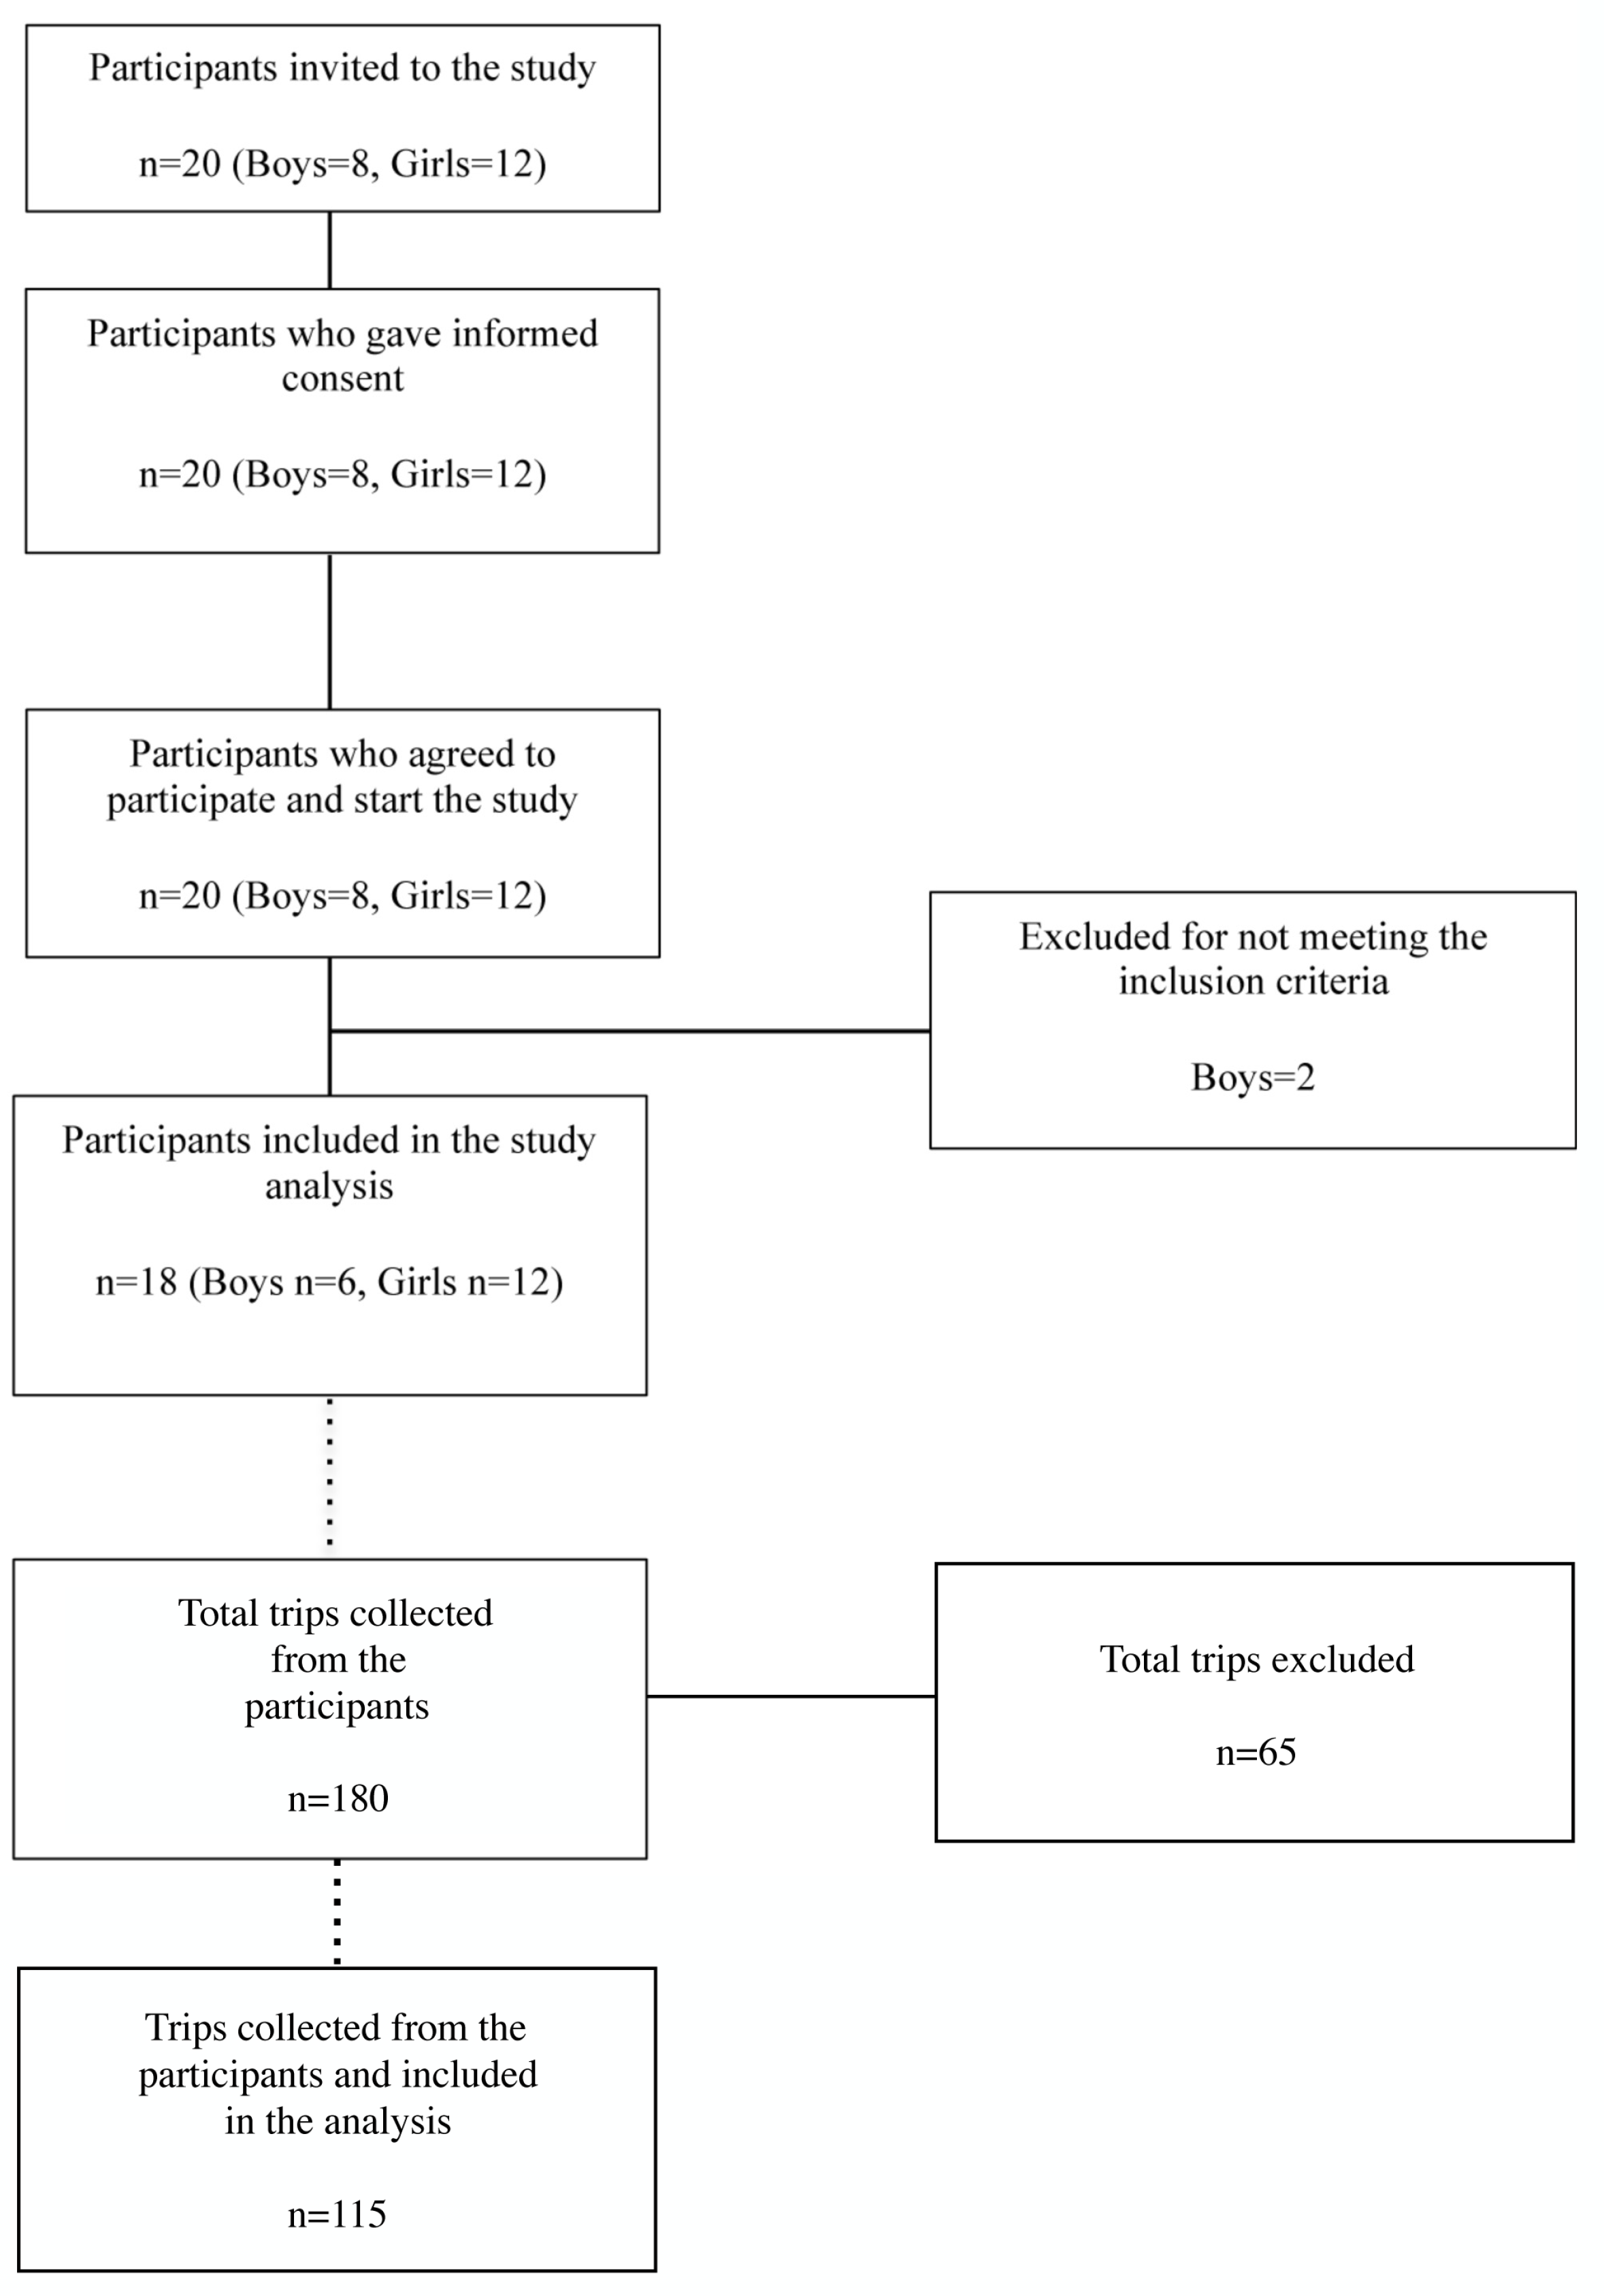
Figure 1. Recruitment flow chart of the participants and trips collected
Sustainability 11 05395 g001
Figure 2. Percentages of time spent in sedentary behavior, light PA, and MVPA in the total of the trips to and from the school by mode of commuting. PA: Physical activity, MVPA: Moderate-to-Vigorous Physical Activity.
Sustainability 11 05395 g002
Figure 3. Associations of sedentary time, PA, energy expenditure, and steps with active commuting to/from school trips. All analyses were controlled by Total PA time and elevation increase. Reference; ACS trips, * p < 0.05.
Sustainability 11 05395 g003
Table 1. Trip characteristics by modes of commuting (n = 115).
Modes of Commuting (n = 115 Trips)
Trips CharacteristicsAllWalkingVehicleMixed
Participants *
Boys (n = 6, 33.3%)42 (35.2)22 (52.4)16 (38.1)4 (9.5)
Girls (n = 12, 66.7%)73 (64.8)35 (48.0)29 (39.7)9 (12.3)
Physical characteristics#(n = 115)(n = 57)(n = 45)(n = 13)
Total distance (Km)3.1 (5.6)1.3 (0.61)3.1 (4.9)11.6 (10.6) b,c
Total time (min)16.8 (15.16)19.7 (9.8)7.6 (5.6)35.6 (29.8) a,b,c
Elevation increase (m)32.2 (51.3)16.2 (12.9)32.7 (43.9) 101.3(103.8) b,c
Elevation loss (m)34.8 (51.3)21.7 (11.4)31.4 (54.4)104.6 (96.4) b,c
PA during transport to school (total min)#(n = 86)(n = 47)(n = 35)(n = 4)
Sedentary (min)4.3 (5.0)3.1 (2.8)5.2 (6.3)10.6 (6.6) b
Light PA (min)4.2 (4.1)5.9 (4.6) a1.8 (1.6)6.2 (2.0)
MVPA (min)6.6 (7.1)11.4 (6.4) a,b0.8 (2.1)1.9 (1.0)
Energy expenditure#(n = 86)(n = 47)(n = 35)(n = 4)
METs/min2.5 (1.2)3.4 (0.7) a,b1.4 (0.6)1.7 (0.1)
Steps#(n = 86)(n = 47)(n = 35)(n = 4)
Total Steps (nº)992.0 (1008.4)1681.3 (858.3) a,b117.8 (268.8)540.2 (258.5)
PA, physical activity; MVPA, moderate-vigorous physical activity; min, minutes; * Mode of commuting is presented as n (%); # Trip characteristics are presented as average (standard deviation) Chi-Square was used to compare the modes of commuting by gender; One-way analysis to compare the modes of commuting by trip characteristics. Bonferroni post hoc; P-value set at p < 0.05; a Difference between walking and vehicle (p < 0.05); b Difference between walking and mixed transport (p < 0.05); c Difference between vehicle and mixed transport (p < 0.05).