1. Introduction
Currently a large EU project is being implemented in Poland, with modernization of the railway network throughout the country. As part of the planned investments, construction, reconstruction, and modernization of 9000 km of railway lines are planned. Performing such an ambitious plan involves many risks, including the possibility of unforeseen or additional work. Choosing the right risk management strategy will minimize the negative effects of risks and guarantee the correct implementation of investment objectives.
The implementation of large infrastructure construction projects according to sustainable development goals is a complex process consisting of many stages. The largest investments can take up to several years, from the moment of creating the initial concept until the commissioning of the object. Situations related to uncertainties occurring during the implementation of projects are referred to as risk, while the actions taken to optimize the impact of risk are known as risk mitigation [
1]. A properly selected risk management strategy taking into account comprehensive scenarios of dealing with all types of risks can be a guarantee of implementation in a specified time and with the assumed budget of a planned construction investment.
Risk management in construction is a fairly widely discussed problem in the industry literature. There are many proprietary approaches to risk. The most important concepts include those of the Project Management Institute [
2], PRINCE 2 [
3], and the Institute of Civil Engineering [
4]. Regardless of the methodology adopted, risk management strategies are based on the standard provisions contained in ISO 31000: 2012 Risk management—Principles and guidelines [
5]. The content of this document includes risk management schemes, definitions, and key stages of the entire process.
Risk, according to the provisions of the ISO standard, can be treated as a combination of the event’s consequence and the related probability of its occurrence. In view of the above, risk is described by the function according to Formula (1) [
1].
where
is risk,
is the possibility of a certain event occurring, and
is the impact or consequence of the event on the final effect of the implemented project.
Quantitative and qualitative research is conducted to determine the possibility of a certain event. Topics include the dependence of factors initiating the emergence of risk on many variables, which include the type and size of the project [
6], legal and political conditions of the project [
7,
8], and the construction environment [
9,
10]. Each of these factors requires a mathematical description. In addition to the approach proposed in the standard, various risk quantification methods are investigated in the literature [
11].
The effects of emerging risks are presented as a change in the duration of the investment or a change in the cost of the project [
12,
13,
14]. Similarly to the likelihood of occurrence of risks, the impact of events depends on the specifics of the implemented undertaking [
15] or legal conditions [
7].
There is much research related to the individual stages of risk management (
Figure 1). Studies involve include proprietary risk analysis methods including specialized software [
16], risk identification, assessment and determination of risk validity [
17,
18], or the creation of risk management strategies dedicated to a given type of project [
19,
20]. The selection of the most suitable mathematical models is also checked [
21]. For risk assessment, among others, multi-criteria methods [
22,
23], Bayesian networks [
24,
25], and fuzzy set [
26,
27] approaches are used, providing groups of models which are then compared with each other [
28]. Some research is also related to the search for the most appropriate method suited to a given type of risk [
12,
29].
One of the risks that has a considerable impact on a construction project involves the occurrence of additional works. These are the result of many different factors, which, despite the investor’s due diligence (or lack thereof) when designing a construction project, lead to the occurrence of an undesirable situation related to a change in the assumed design and procedural, organizational, or technological solutions. Detection of factors initiating the appearance of this type of work and determining their consequences is associated with in-depth analysis of available data, obtaining expert knowledge, or predicting the probability of occurrence of phenomena that may occur during the project.
The subject of additional works in construction is relatively rarely discussed in the literature. Until now, there have been rather few works relating to discussion of the broadly understood changes occurring during the construction project. Some of the researchers describe factors in the occurrence of additional works (substitutions) [
30,
31,
32], while others have undertaken studies to assess the effects of additional works (changes) [
33]. In the context of the analysis of additional works, it is important to consider the local conditions in which the construction project is carried out. Research in this field may include research on the identification of factors causing additional works [
34,
35], or discussion of awarding contracts for additional works in road investments [
36,
37].
Taking into account the specificity of infrastructure construction in risk management seems to be crucial for the research problem discussed. The work to date indicates that, starting from the stage of announcing the tender procedure for construction works, one should be aware of the risk of exceeding the assumed resources, in particular the adopted budget [
38]. This assumption is confirmed by other works that suggest improving the estimation of costs of the planned investment and optimization of their spending during the investment [
39,
40].
The paper presents the author’s method of assessing the risk of additional works in railway infrastructure construction projects using the standard approach specified in the ISO 31000: 2012 Risk management—Principles and guidelines [
5]. The main element of the method will be the Bayes network model, which will be used to build data from expert interviews. The scenario will be presented together with an attempt to introduce a risk reduction factor into the model.
2. Framework Model for the Risk Assessment Method
The risk assessment procedure presented in the ISO 31000: 2012 Risk management—Principles and guidelines standard will be used as the baseline procedure [
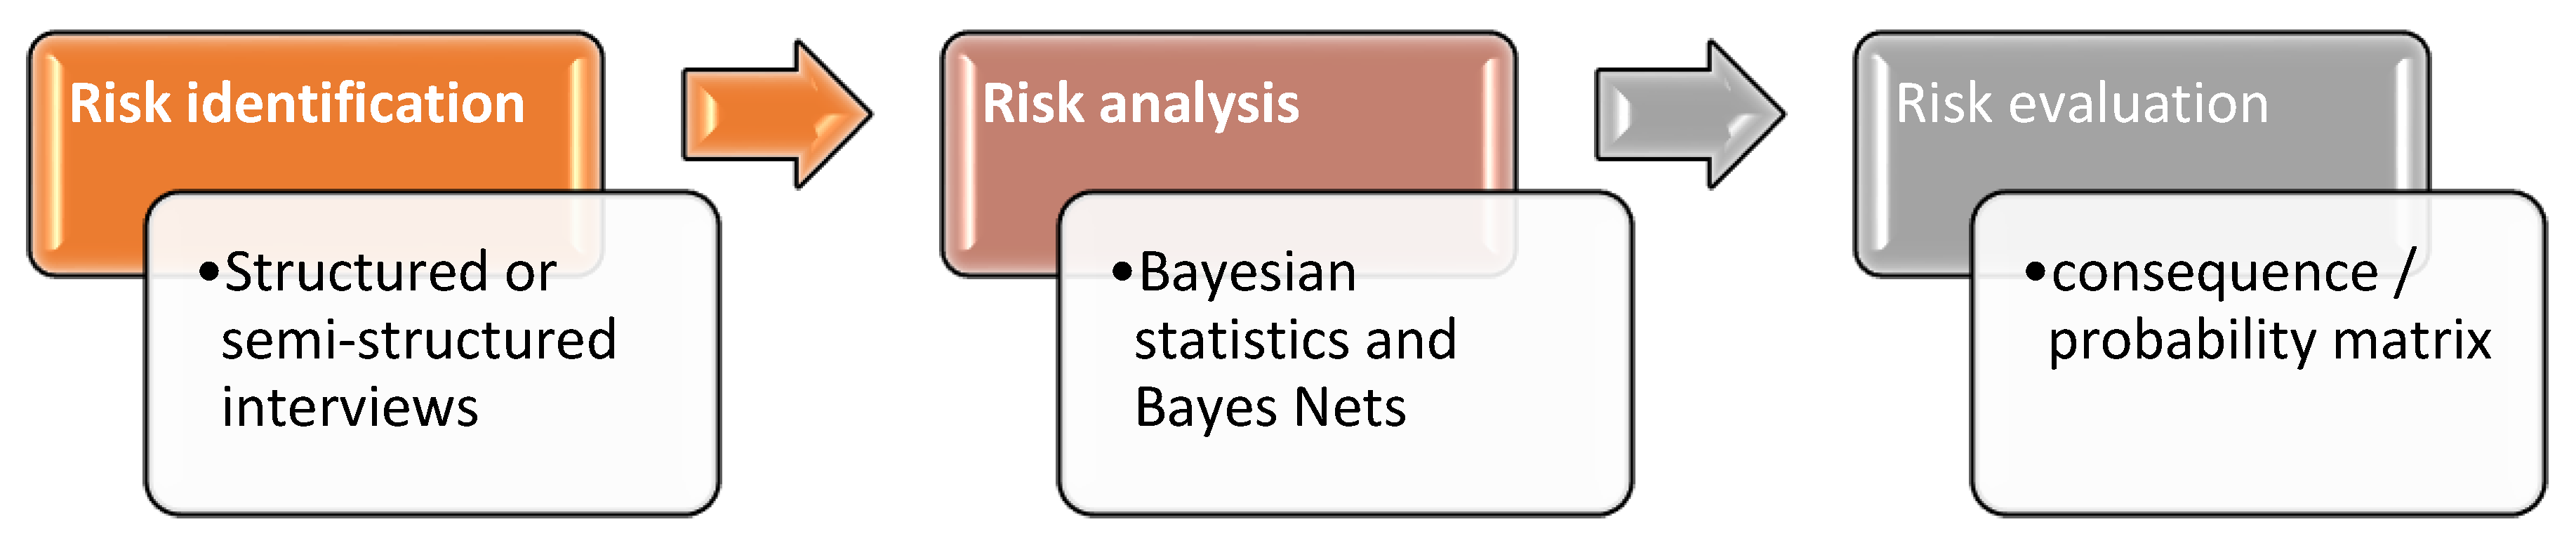
5]. According to the guidelines of the standard, item 5.4 (Risk Assessment) consists of three successive stages, which include:
Risk identification
Risk analysis
Risk evaluation
Each of the stages refers to different procedures included in the risk assessment. For each of them, the provisions of the standard discuss the main assumptions and actions that should be carried out by decision-makers managing the risk in the enterprise (points 5.4.2, 5.4.3, and 5.4.4 of the standard). The standard does not indicate precise solutions or methods, indicating only the directions of actions that should be taken to carry out a comprehensive risk assessment.
Comprehensive identification of all factors can be difficult, but according to the adopted methodology, the identification process should be carried out as comprehensively as possible, taking into account all contexts, factors, and conditions specific to the discussed issue. In addition IEC/ISO 31010 Risk Management—Risk Assessment Techniques [
41], which characterizes the most commonly used techniques for hazard identification and analysis, can support the risk identification process. The content of the standard mentions 31 methods, which are divided according to their usefulness in relation to the problem and assigning them a degree of suitability. The selection of the appropriate technique depends on the characteristics of the risk being examined, as well as its individual conditions.
In order to assess the risk of additional works in railway construction projects, the authors used the structured or semi-structured interviews method at the risk identification stage, the Bayesian statistics and Bayes networks method for risk analysis, and the consequence/probability matrix method for the selected scenario for risk assessment.
The choice of the above methods is dictated by the current state of knowledge regarding additional works in railway investments, to obtain input data on the issue, expert knowledge collected using structured or semi structured interviews was used. Further analysis of the results obtained will be performed using Bayes networks, which allow modeling assuming high uncertainty, or on the basis of cause and effect inference. Risk evaluation will be performed using the consequence/probability matrix, which, according to the authors, allows us to clearly determine the level of risk and to carry out activities aimed at its mitigation. The stages of risk assessment along with the methods used in the work are presented in
Figure 2.
3. Identification of the Risk of Additional Works in Railway Projects
In accordance with the adopted assumptions (selection of the structured or semi-structured interviews method), the authors prepared a questionnaire with questions that allow for the identification of the most important parameters describing emerging additional works in rail infrastructure construction investments in Poland. The respondents were asked the following:
Please specify factors initiating the creation of additional works in railway infrastructure construction investments and indicate the probability of their occurrence;
Please specify the types of construction works that occur with the occurrence of additional works in railway infrastructure construction investments and indicate the probability of their occurrence;
Please specify three time periods (in months), which are the most likely date for extending the duration of the railway infrastructure construction project as a result of additional works and specify the probability of their occurrence;
Please specify three amount ranges (in % of the investor budget), which are the most likely to increase the financial resources that the investor must obtain for the implementation of the railway infrastructure construction project as a result of additional works and specify the probability of their occurrence.
After creating the questionnaire, individual, direct interviews were conducted with five participants of the construction process who deal with the construction of railway infrastructure in Poland. The choice of experts was deliberate, and the research was conducted in the form of interviews. Each respondent represented a different company and was chosen consciously by the authors. People from large construction companies (employing over 200 people), with relevant experience, seniority, and practice (over 15 years) in managing the implementation of such investments were selected for the study.
The answers provided were used to describe the risk factors as well as a qualitative description of emerging types of additional construction works. In addition, the respondents indicated the impact of individual factors of additional works on the appearance of additional costs during the implementation of a construction investment and the extension of the duration of construction and assembly works. The respondents were also asked to assign a probability of occurrence, expressed in %, to each answer given. The assumed risk level was presented as the arithmetic mean of the obtained expert responses. As a result of the tests, the answers presented in
Table 1 were obtained. For the risk factors causing additional works and types of additional works, the probability level of their occurrence was expressed in %. Determination of the level of probability of the consequences of additional works (extension of time, increase in financial resources), due to the large number of all combinations, was included in the Bayes network model presented in
Section 4.1.
The obtained results (determined average probability of risk factors above 60% and the probability of the occurrence of a type of additional works above 10% ) were presented to an expert with the longest seniority and experience in the implementation of railway works (Subject Matter Expert) who did not participate in the research. In some cases, the probability was not completely covered by the Expert’s subjective assessment; but after analysis this was considered justified and met with acceptance. It was decided to use the cases to build the proposed model.
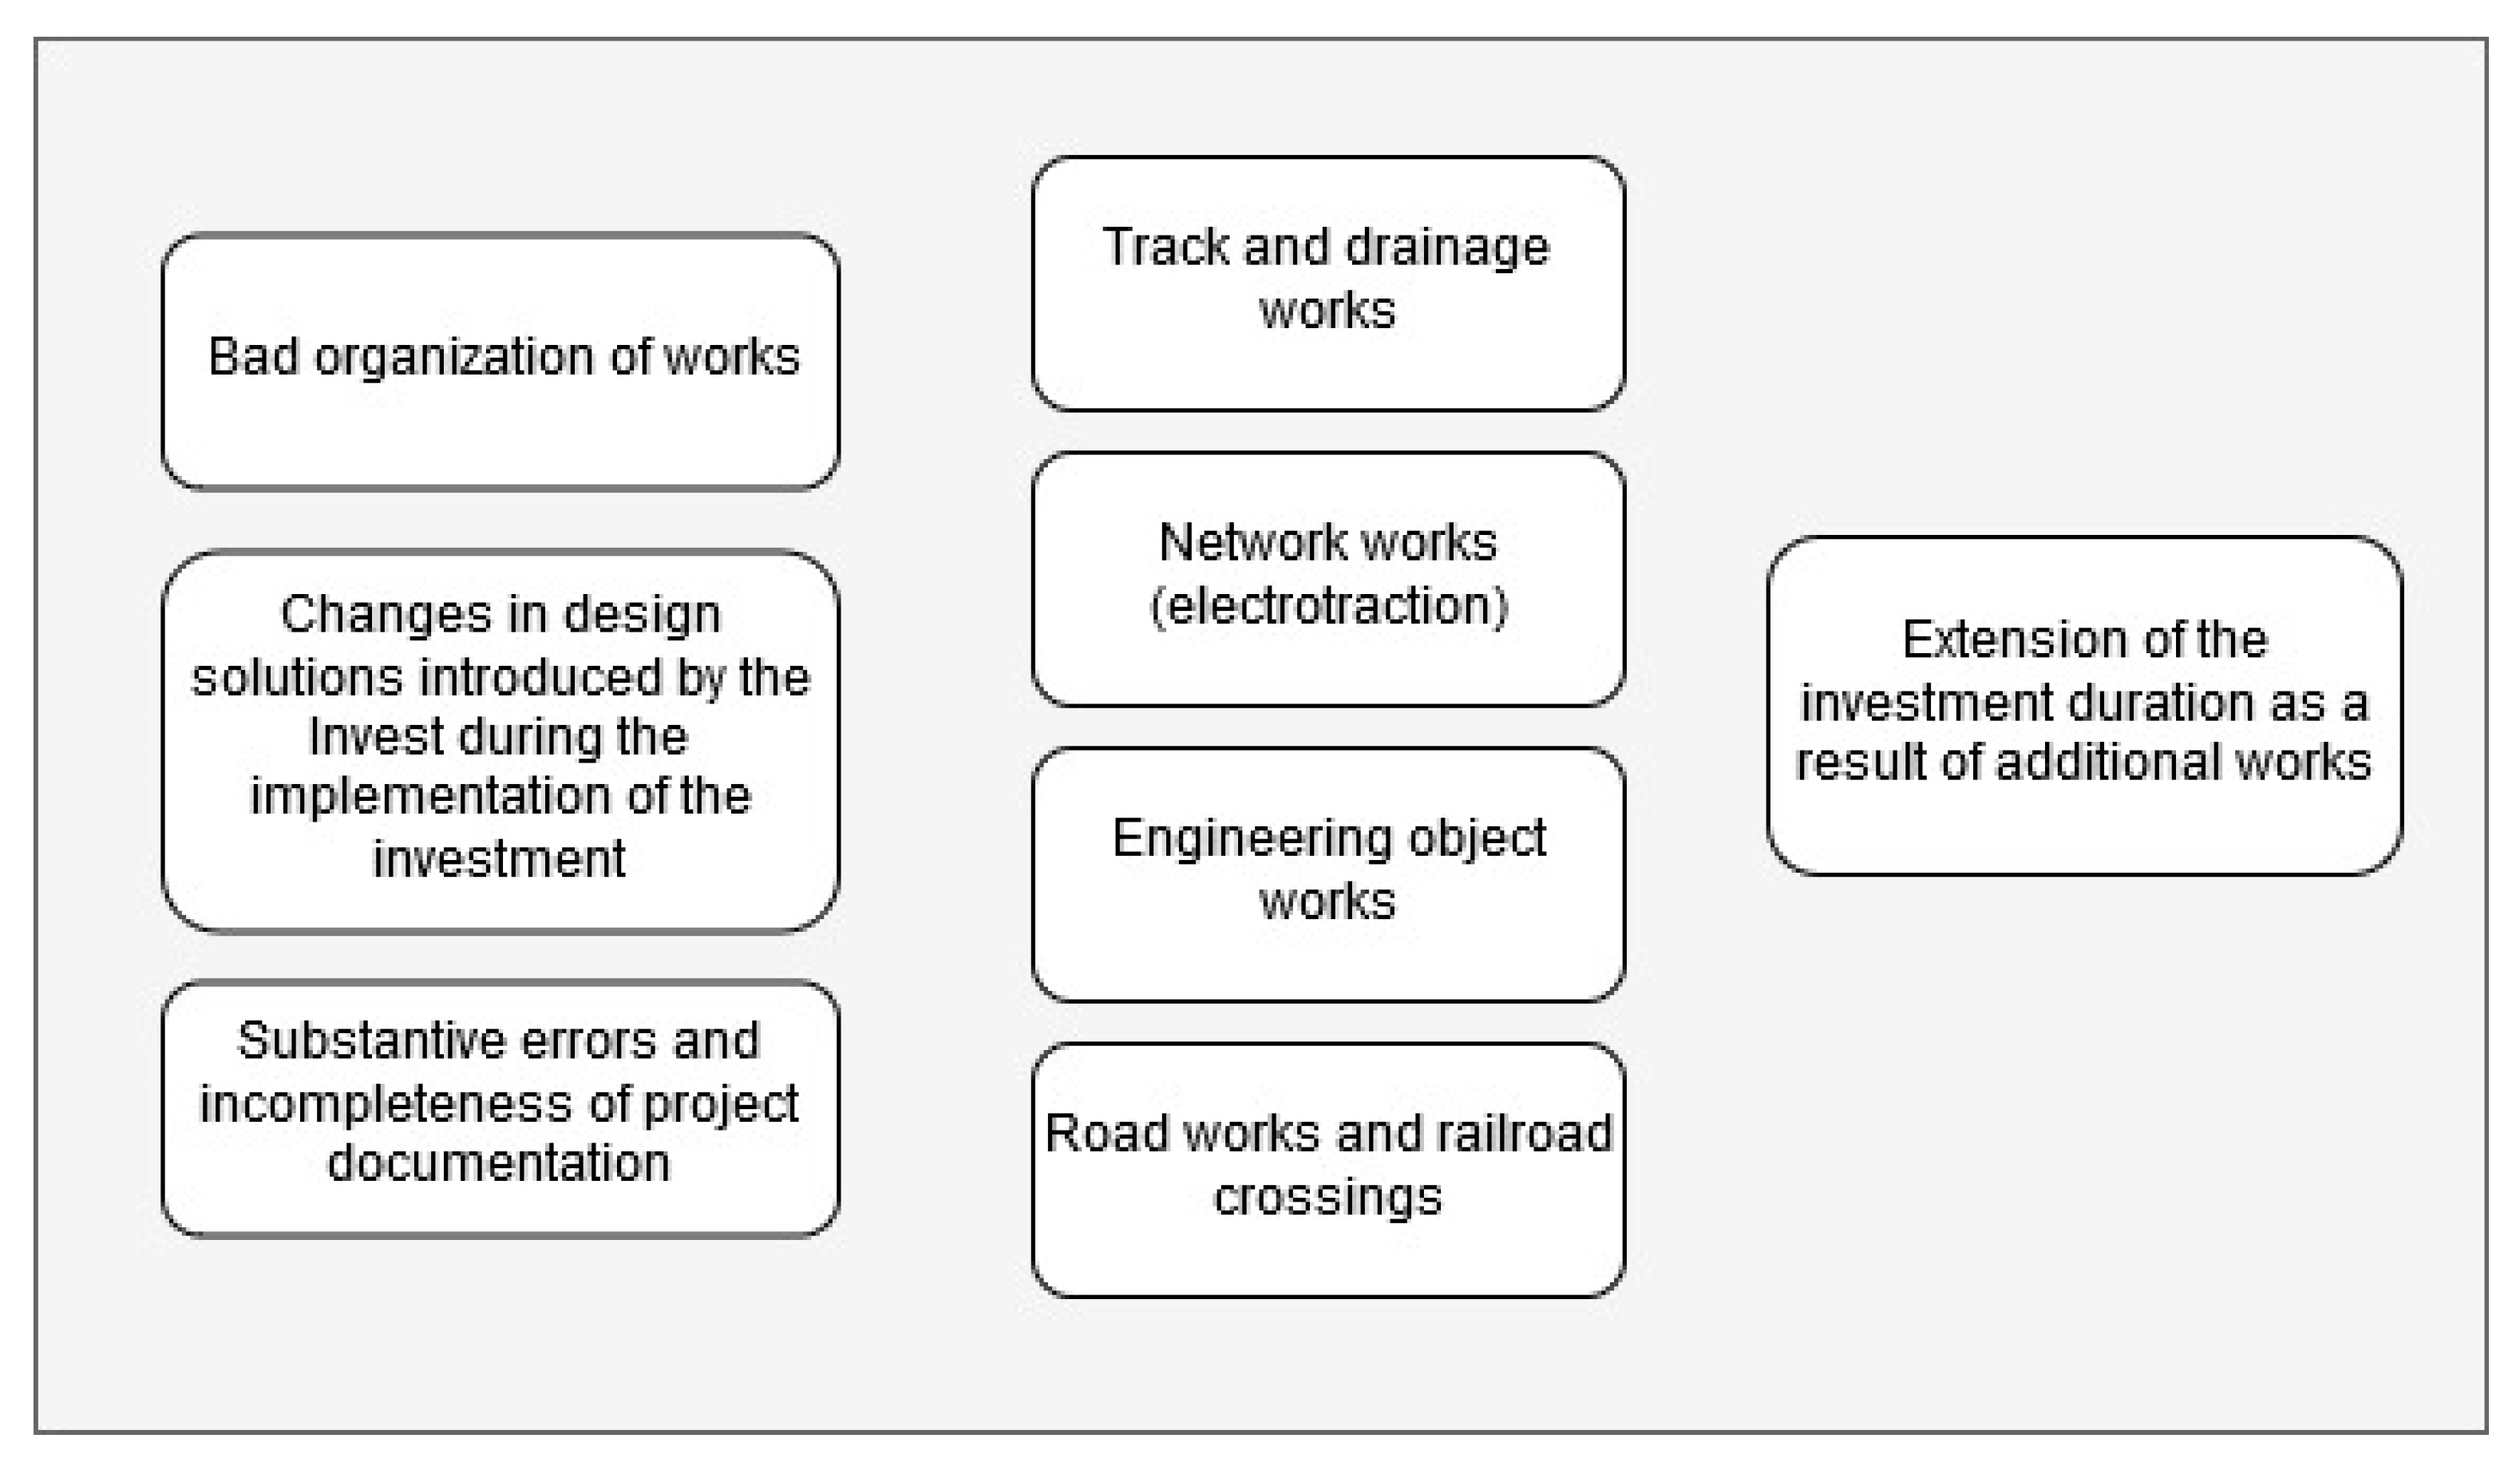
Risk identification in accordance with the standard guidelines should include the following elements: determination of risks, determination of consequences, and determination of possible scenarios. The answers given by the respondents were grouped according to the proposed scheme. As a result, three groups were obtained, which are presented in
Figure 3. The risk group was divided into risks related to the appearance of additional works and risks related to the occurrence of individual types of additional works. Division of elements into groups completed the process of risk identification.
4. Risk analysis—Bayesian Statistics and the Bayes Network Method
Based on the results of the research, the authors chose the factors where the probability of occurrence was most highly rated by the participants in the construction of the risk assessment model for additional works (the percentage values of the factors are listed in
Table 1) The selection of factors used to build the proposed risk assessment model is presented in
Figure 4.
For risk modeling, the Bayes network method was chosen, which seems to be the most appropriate for the problem in question because it is based on the probability of events and allows the introduction of new information to the model using expert knowledge or historical data (“teach the network”).
The Netica Software (by Norsys Softwar Corp.) was used to build the model in the form of a Bayes network. Risk analysis was carried out in four stages that were related to the Bayesian network design. The individual steps include:
- (1)
Creating the nodes of the Bayes network
- (2)
Giving relationships to particular nodes
- (3)
Assigning event probabilities
- (4)
Performing calculations
4.1. Creation of the Nodes of the Bayes Network
Selected risk factors, the possibility of additional works, types of additional works, and the consequences of this phenomenon were used to create the nodes of the Bayes network. The risk assessment model has nine nodes. Each of them was assigned unique events corresponding to the characteristics of a given node. In the events at a later stage of the model’s operation, the consequences of their occurrence are described. An example of a node describing the event of the appearance of poor organization of works (“Bad Organization Of Work”) together with possible scenarios of this risk assessment factor is presented in
Figure 5.
For each of the nine selected risk assessment factors, an analogous process of attributing possible events was carried out.
The basis of the correct structure of the Bayes network is related to the determination of the relationship of individual nodes in the network [
42]. So far, different approaches have been used that depend on many variables, including, but not limited to, the characteristics of the phenomenon being studied, data availability, and the complexity of the problem. Many researchers also stress that the process of creating relationships on the web is an iterative process [
42]. The problem has not been studied before using the Bayes network, so the authors do not have any primary network that can be modified. The creation of the relationship of individual nodes was based on expert knowledge obtained from interviews, research, and the authors’ own experiences. The relationships will be used to examine possible scenarios or consequences of events occurring in the process of assessing the risk of additional works.
The uniqueness of the studied problem (occurrence of additional works) required the creation of an indirect event in the form of Bayes network in the form of the “Additional Works” node. This node was proposed as separate, because an important context of the work is to determine the occurrence or absence of additional works. The event was modeled by connecting the nodes constituting the risk factors (“Bad Organization Of Work”, “Changes By TheInvestor”, “Errors Of The Project Documentation ”) and the effects of the appearance of works in the form of types of industry works (“Track Works”, “Engineering Object Works”, “Road Works”, and “Network Works”). The network proposed in
Figure 6 was used for further calculations.
4.2. Assigning Event Probabilities
The correct functioning of the model requires assigning to each event the probability of its occurrence (expressed by means of a percentage scale). In addition, the Bayes network is characterized by the fact that the events of the initiating nodes (in the network they are “Bad Organization Of Work”, “Changes By The Investor”, and “Errors Of The Project Documentation”) are introduced directly by determining the probability level. Other nodes connected by mutual relations must be described using the so-called “Conditional probabilities”, which are based on the chain method [
43]. This requires the authors to analyze all possible combinations of consecutive events and determine their probabilities. For this purpose, there are the so-called “Conditional probability tables”. An example table of conditional probabilities is presented in
Figure 7.
Determining the probability of all events is a labor-intensive process. It is important to identify events and shape the implementation between them.
4.3. Performing Calculations
The basic relationship used in the construction of the Bayesian network is the theorem of Thomas Bayes, binding the conditional probabilities of two events conditioning each other [
44]. Applying this theorem to a series of events allows us to determine the probabilities of all events forming the network. Creating extensive networks requires appropriate programming (assigning relationships, giving probabilities to nodes), which can be associated with great difficulties. Bayes’ theorem is presented in Formula (2), while the conditional probability theorem is presented in Formula (3) [
43].
where
and
are events and
;
is the probability of event
occurring if event
occurs; and
is the probability of event
to occurring if event
occurs.
where
and
are events and
;
is the probability of event
occurring if event
occurs; and
is the probability of the common part of events
and
.
After preparing the model (creating a working Bayes network), calculations were carried out. Calculation of conditional probabilities was performed using the Netica software [
42]. The result of the calculations is a functioning network that can be used for the next stage of risk assessment evaluation.
The network, after calculations, together with the determined conditional probabilities of events, is presented in
Figure 8.
5. Risk Evaluation—Building a Risk Assessment Matrix
Before starting the risk assessment, one must set up risk criteria for the subject. In the available literature on the subject, the authors did not find a method dedicated to additional works, so the matrix method was proposed to determine the risk criteria. This method corresponds to the assumption of a work in which the risk is expressed as the product of probability and its effects (Formula (1)). Risk evaluation using a matrix requires specifying ranges of probability values and effects of events, and adopting point values for these ranges. For the probability of events, five intervals were proposed corresponding to the assumed probability levels, while the effects of the events were characterized by three intervals, which are associated with events that result in a longer implementation time (consequence in the studied model). The probability ranges of events and effects are shown in
Table 2 and
Table 3.
Comparison of risk criteria requires a reference to assumed risk levels. Four levels of risk (Low, Medium, High, and Very High) were proposed for the needs of the analysis, together with the possible scenarios of events. The proposed scenarios include a proposal for further risk management. Matching the risk to the appropriate level required specifying a point range for values from 2 (lowest and rarest risk) to 50 (very high and almost certain risk). The ranges of risk levels together with point values and scenarios of actions are presented in
Table 4.
Risk assessment requires the introduction of the assumed risk criteria and the effects of risk in the matrix. Individual matrix cells were additionally described using point value and color. The color was selected according to the risk level as follows:
Low risk level—blue
Medium risk level—green
High risk level—yellow
Very high level—red
The risk assessment matrix is presented in
Figure 9.
The application of the Bayes’ network to the discussed problem allows the use of unique possibilities of this mathematical method in the form of analysis of selected event scenarios. In addition to the base event probabilities modeled on the basis of the research, one can develop further modifications based on the relationships of the original model. Individual variants are created by specifying conditional probabilities of the selected nodes. It is possible to analyze different levels of event detail (e.g., as probability ranges), but the situation that best reflects the scenarios that are possible in reality, according to the authors, is to declare probability as 0% or 100%. The assignment of these values can be read as the occurrence of an event (100% probability level) or as a certainty of the event not appearing (0% probability value). Depending on individual needs, all possible scenarios of events can be analyzed, or the key ones that have the greatest impact on the appearance of negative (positive) effects can be focused on. In this work, one selected scenario of events will be analyzed, and risk will be evaluated in accordance with the previously established procedure.
5.1. Event Scenario Analysis
The scenario analyzed will be the occurrence of a risk factor including occurrence of project documentation errors. This event has been modeled at the top of the “Errors Of Project Documentation”. A 100% probability was needed to investigate the scenario in the event described as “Faulty”. The effects of the occurrence of an event involving the existence of faulty design documentation are shown in
Figure 10.
Modeling the occurrence of an event affects the entire network. Since the occurrence of the phenomenon can be studied in relation to many variables, the authors chose to analyze the effect presented in the node “Extension Of Time”. The probability was read from the “Extension of Implementation Time” node:
- (1)
Extending the duration of implementation to 3 months—at the level of 36.0%
- (2)
Extending the duration of implementation from 3 months to 6 months—at 40.7%
- (3)
Extending the duration of implementation over 6 months—at 23.3%
Subsequently, the effects of additional works (extension of the duration of implementation) were given the point values described in
Table 3 and assigned to probability intervals according to
Table 4. After assigning points for the variants discussed, the risk was calculated in accordance with Formula (1) and classified in the appropriate cells of the risk assessment matrix (
Table 5). The results of calculations along with the qualification of the variants are presented in
Table 5.
The obtained results allow for the classification of potential events into two groups of risk level: low risk level (2–5 points) and high risk level (11–29 points). According to the assumptions of the developed risk assessment method, a low level of risk may be accepted by the investor, while a high level of risk should be further assessed, which may lead to the elimination of subsequent extensions of the duration of the investment. For a high level of risk, a conservative method of reducing the level of risk has been proposed, namely the so-called risk mitigation [
44].
5.2. Risk Mitigation Proposal
The selection of the best risk management strategy depends on a variety factors (e.g. list of risk hierarchies, probability of achieving cost and time goals, list of potential methods of action, etc.) and includes a response to each type of risk in the project. The action plan is selected so that the actions taken are as effective as possible. The most popular strategies include [
44]:
Risk avoidance
Risk transfer
Risk mitigation
Risk acceptance
Emergency plan
The discussed scenario of the occurrence of errors in the project documentation results in the appearance of high risk. As per the assumption, its acceptance is not desirable. Additionally, based on the results obtained, it can be assumed that the risk will not be avoided (all probability values >0%). Therefore, among the possible strategies to choose from: risk transfer, risk mitigation and a contingency plan, the authors selected one method of risk mitigation that seems to be implementable in the process of railway investment implementation.
Risk mitigation is a strategy of reducing the likelihood or effects of an adverse risk event to an acceptable level [
44]. According to this definition, the possible actions include reducing the likelihood of faulty documentation, or reducing the duration of implementation time. It was assumed that it is more realistic to reduce the likelihood of faulty documentation as a result of various investor activities. Examples of procedures include: checking the documentation created by an additional design office, analysis of industry experts, or the use of typical catalog solutions [
44]. Regardless of the procedure adopted, it was assumed that the investor obtained a reduction in the probability of the appearance of faulty design documentation to 50%. For such a reduced risk factor, the scenario was reassessed. The network model together with the reduced risk factor for faulty design documentation is shown in
Figure 11. The obtained results of the options for extending the implementation of the investment were re-calculated, and the results of the calculations together with the risk level qualification are described in
Table 6.
Based on the results obtained, there was no change in the risk level for option A, while for options B and C a change from high to medium risk was obtained. According to the adopted risk assessment methodology, this level may be accepted by the investor.
6. Summary and Conclusions
The authors presented one of the available methodologies for creating risk management strategies using a standard algorithm that includes risk identification, risk analysis, and risk assessment. The selected scenario contains an original method based mainly on the Bayes network. This method allows for the construction of complex impact networks that can be modeled on the basis of surveys, historical data, or expert opinions. As presented in the discussed event scenario, a well-programmed network can be used to implement risk mitigation methods (i.e., mitigation) and study its impact on other network nodes. Mitigants can be modeled as actions that directly reduce the probability of risk factors occurrence.
These networks are a useful tool for studying the impact of individual event scenarios. Using the network, the user is able to compare different ways to reduce risk, check the effect of reducing the risk of factors causing additional works on the other tops of the network, or determine a satisfactory level of effects, e.g., increase in the value of financial resources as a result of additional works.
The proposed model is a simplified version of the Bayes network created by the authors, which will be used to study more factors and the effects of the risk of additional works. The authors also plan to implement network “learning” using new information obtained from expert opinions or historical data. The analysis of extended structures together with the proposed risk mitigation strategy may become a comprehensive method of managing the risk of additional works occurring during the implementation of railway investments, which can be implemented and used by investors or railway line managers in practice.


