1. Introduction
The principle of “high risk high return” is popularly used in many fields, including financial investment [
1,
2]. According to this principle, a person invests in a high-risk product because the product is expected to yield high return because of the possibility of loss. The investment risk–return tradeoff is valid when a high-risk product averages a yield high return even though the return severely fluctuates.
Interestingly, the construction field maintains two contradictory opinions regarding the risk–return tradeoff. First, high-risk projects are expected to gain high profitability [
3,
4]; and second, high risk yields a low return because the bid competition cannot allow the bidder to allocate sufficient profit according to the risk amount [
5,
6]. These two arguments would be adjusted depending on the owner and contractor perspectives. From the contractors’ perspective, many researchers support the latter opinion when showing that high-risk projects are likely to incur cost overruns and schedule delays, which can cause project failure [
7,
8,
9]. Due to limitations or stagnation in the domestic construction industry, many construction contractors enter the international market [
10]. The international market, while huge and constantly growing, is quite risky, with multidimensional uncertainties such as political, economic, infra and social, and cultural risks that are less familiar than in the domestic market [
11]. In order to survive in the international construction market, construction contractors must bid on risky projects and earn profit. Thus, construction contractors must be able to select potentially high-return projects among the high-risk projects, and to mitigate the high risk to achieve sustainable revenue and profitability.
Many researchers have studied project selection based on risk amount, suggesting analyses and models to identify the risk factors and to develop risk assessments to screen unsuccessful projects [
12,
13,
14]. Their results are useful and effective given that users can accurately evaluate risk: if the user assesses the risk as high, the model presents negative results. However, in real construction industry situations evaluating risk is somewhat different. International contractors are difficult to evaluate risk accurately because they frequently over-assess or under-assess the risk.
This study aims, therefore, to show what enables projects to yield high return or low return even if the project risk is assessed as high, and what causes projects to yield a high or low return even if the project risk is assessed as low. This study limits the research questions whether or not risk management performance, depending on high and low-risk situations, affects project returns from the three perspectives: (1) risk assessment performance; (2) contingency amount; and (3) risk mitigation performance. Our study proceeds by first explaining the risk–return tradeoff related backgrounds from the perspectives of risk assessment accuracy, contingency, and risk mitigation performance. Second, this study presents the questionnaire, samples, and analysis method. Then, we show what enables high or low risk projects to become high return projects based on the results of a Mann Whitney U test. Finally, this study discusses its contributions, limitations, and suggestions for future research.
2. Research Background
2.1. Risk–Return Tradeoff in Financial Investment and Construction
The risk–return tradeoff has been studied much in the financial industry [
1,
2,
15,
16,
17,
18,
19,
20] The risk is defined as the degree of exposure to the uncertainty that can have a positive or a negative effect on outcome [
21,
22]. In the financial investment, the risk is usually divided into interest rate risk, market risk, credit risk, sovereign risk, and operating risk [
2,
23]. Depending on the researcher, the risk is differently grouped into external risk such as interest rate risk country risk and market risk, and the internal risk such as strategical risk, credit risk, and operational risk [
24]. In the construction industry, many researchers also suggested the various risk groups: (1) country, market, and project group [
8]; (2) country, inter-country, project team, construction, and contractual group [
25]; (3) macro, market, and project group [
26]; and (4) country, project, and corporate group [
27]. The return is generally defined as the expected return. The expected average returns should converge the actual average returns when many investments are conducted over a long period [
28]. Therefore, the expected average return can be measured as actual average return.
In financial investment, high levels of risk have high volatility of profits, but requires high average expected profits [
1,
2]. Many researchers insist that there is a positive relationship between risk and return [
15,
16,
17]. Moreover, many empirical studies prove the principle of “high-risk high-return” and many models such as risk premium and portfolio have been developed based on this principle [
18,
19,
20]. This principle is taken for granted in most industries.
In the construction business, the risk–return relationship depended on the perspectives of the project owners and contractors. From the perspective of the project owners who invest assets directly into construction projects, project owners can choose projects that meet their expected returns that they wanted so that the principle of “high risk high return” can be applied. On the other hand, contractors have relatively less opportunity to choose the projects that meet expected returns that they wanted. In addition, regularly, they cannot fully reflect their profits on project returns in order to award the projects. From the contractors’ perspective, therefore, two contrary opinions on risk–return tradeoff exist. One is that the high-risk projects lead to obtaining high profitability. Connolly [
3] stated that profitability increases when the risk is high. Chiara [
4] argued that if project risk can be well managed, high returns could be expected from high-risk projects. The other opinion is that potential returns decrease with an increase in risk since contractors cannot fully reflect their profits on project returns. Generally, researchers in the field of international construction support the second opinion. Qazi et al. [
7] stated that project complexity increases uncertainties within the project, which pose cost and time overruns. Smitha and Bohn [
5] and Laryea and Hughes [
6] asserted that contractors could not fully reflect risk in bid prices so that as risk increases, profit should decrease. The author’s previous conference paper [
29] showed that international construction projects slightly tend to follow the principles of “high-risk low-return.” These studies lack in-depth analysis of what enables the project’s profit or loss depending on risk. Therefore, this study compares high return and low return projects under high risk and the conditions to determine what makes a project high return.
2.2. Relation between Risk Assessment and Return
Risk assessment is an important process for contractors to achieve sustainable revenue and profitability in the international market. Contractors make critical decisions such as internationalization, market selection, project selection, and mark-up selection based on risk assessment results [
30,
31]. In addition, accurately assessing and identifying problems in the early stages of construction is a critical success factor because the most appropriate solution will be found and implemented [
32].
Many studies advance project risk assessment models based on quantitative methods such as the probability impact (PI) method [
12,
33], Monte-Carlo simulation method [
34,
35], analytic hierarchy process (AHP), and fuzzy sets [
25,
36]. In these models, if users evaluate the risk as high, the results are negative. In practice, although the principle of “high risk high return” is not correctly applied in international construction, not all projects evaluated as high risk yield negative results, nor do all projects evaluated as low risk yield positive results. Further, since contractors frequently tend to under evaluate project risk when they prepare project bids [
31,
37], they cannot be sure that the relation of risk assessment to return is negative.
Therefore, this study investigates the relation between risk assessment performance and return based on a comparative analysis between high and low return projects under high and low risk conditions. This study also investigates which risk is well predicted under different risk–return conditions. The results provide insights for the practitioner into the importance of risk assessment in risk–return tradeoff.
2.3. Relation between Contingency and Return
Risk money is well known as the risk premium in financial investment. The risk premium is a form of compensation for tolerating extra risk and is compared with the return of a risk-free asset [
38]. Risk premium is defined as the difference between the return of risk-free assets when the risk is close to zero and the return of a risky asset. The return of a risky asset is higher than the return of a risk-free asset because of the risk premium. Therefore, the principle of “high risk high return” can be applied in financial investments. However, in the construction industry the concept of risk money has a slightly different meaning. In a construction project, risk money is known as the contingency and allowance. In general, since the information for an allowance in estimation is difficult to obtain, many studies represent contingency as the risk money. The contingency is defined as the budget to deal with uncertainties during construction [
39] or the budget needed to reduce the risk that leads to overruns [
21]. The difference is that the risk premium is a concept of reward for risk, while the contingency is a concept for the reserve amount to manage the risk.
Many studies seek to estimate contingency in construction. Panthi et al. [
40] suggested a contingency estimation method through the relation between project risk and bill of quantity (BOQ) items. Elbarkouky et al. [
41] developed a contingency estimate model based on project risk with fuzzy arithmetic analysis. Sonmez et al. [
42] presented four factors—country risk, type of contract, advance payment amount, and availability of construction materials in the host country—that affect the variations of contingency. These studies suggest that contingency should be estimated in consideration of expected risks.
In practice, however, risk is not well reflected in estimating contingency for a number of reasons. First, it is difficult to estimate contingency based on assessing uncertainty accurately; second, contractors intentionally reduce the contingency for maximizing competitive bidding; and finally, overhead cost, profit, and contingency are sometimes customarily determined by each contractor without regard to project risk. Some studies show that contingency is not significantly proportional to risk amount [
43,
44]. The risk amount that is not fully reflected in contingency has a direct impact on cost overruns and ultimately on project return.
This study investigates whether the contingency is a significant factor for enabling high-risk projects to yield high return. The results provide practitioners with important information about contingency and return under different risk conditions.
2.4. Relation between Risk Mitigation and Return
Risk mitigation is one of the risk response strategies to reduce the probability and negative impact of an adverse risk event. Unmanaged or unmitigated risk is one of the primary causes of project failure [
45], and early action to reduce the probability or impact of risk is more effective than trying to deal with it after it has occurred [
46]. An appropriate mitigation strategy leads to project success, and the more that risk mitigation is managed, the more effective it is. Effective mitigation strategies can reduce the impact of external and internal risk on return, directly or indirectly [
47]. Due to its importance, risk mitigation has been well studied, especially in identifying the manageable risk and in suggesting mitigation strategies according to manageable risk [
32,
48,
49,
50]. However, research on mitigation performance by risk type or level of risk is lacking.
Therefore, this study attempts to examine whether risk mitigation performance is a significant factor that enables high-risk or low-risk projects to yield high return and to investigate which risk is better mitigated under different risk conditions.
3. Research Methodology
3.1. Research Process
This study aimed to determine the risk management difference between high return projects and low return projects under both high and low risk conditions.
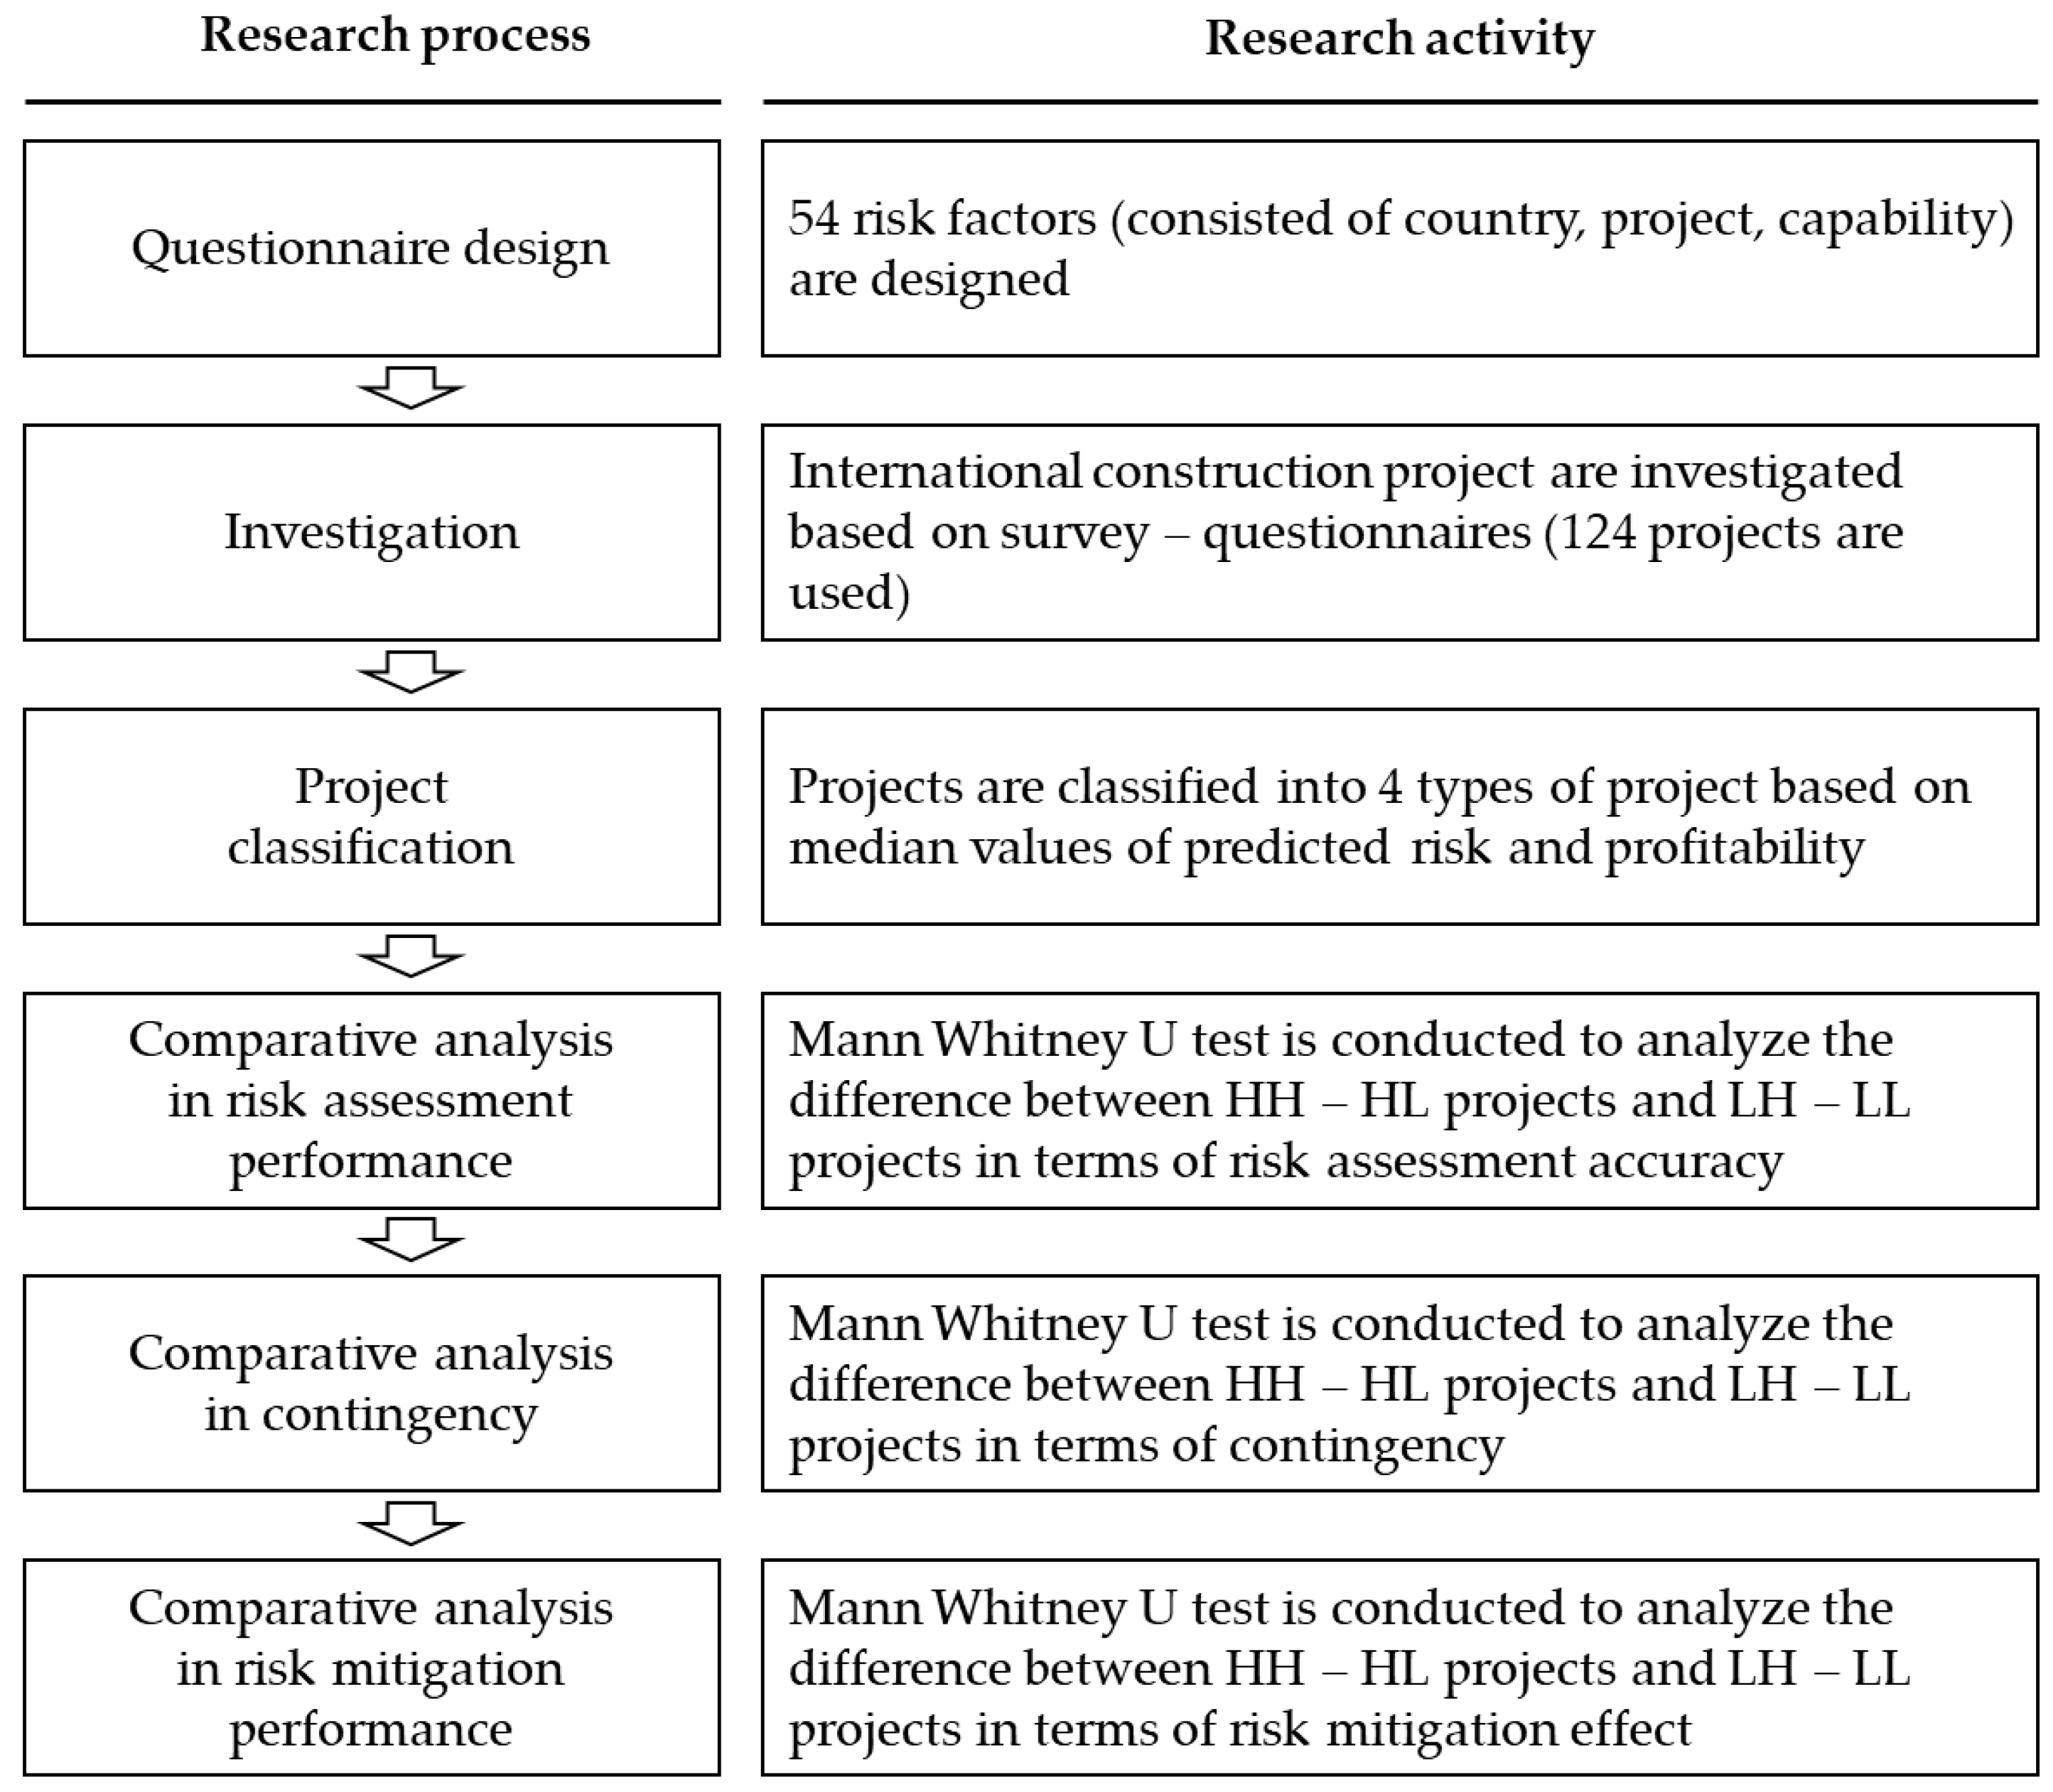
Figure 1 presents the research process. First, a structured questionnaire was designed to measure predicted risk, actual risk, and residual risk. Second, international construction projects were surveyed. Third, the predicted risk and profitability of each individual project were calculated and classified into four project groups: high-risk high-return (HH), high-risk low-return (HL), low-risk high-return (LH), and low-risk low-return (LL). Fourth, the differences between HH–HL projects and LH–LL projects were analyzed from the perspective of risk assessment performance. Fifth, the differences were analyzed from the perspective of contingency. Finally, the differences were analyzed from the perspective of risk mitigation performance. To analyze the difference, a Mann Whitney U test was conducted.
3.2. Questionnaire Design
3.2.1. Risk Factor
This study used the 54 risk factors from the previous study [
50]. The 54 risks were grouped into country risk (12 risk factors), project risk (22 risk factors), and capability risk (20 risk factors), each of which consists of a subcategory risk: country risk consisted of political risk, economic risk, and infra and social risk; project risk consisted of owner risk, contract risk, and site risk; and capability risk consisted of management risk, technical risk, and partner risk.
Table 1 shows the 54 risks factors and risk structure.
3.2.2. Questionnaire and Survey
The data used in this study were the same as in a previous study [
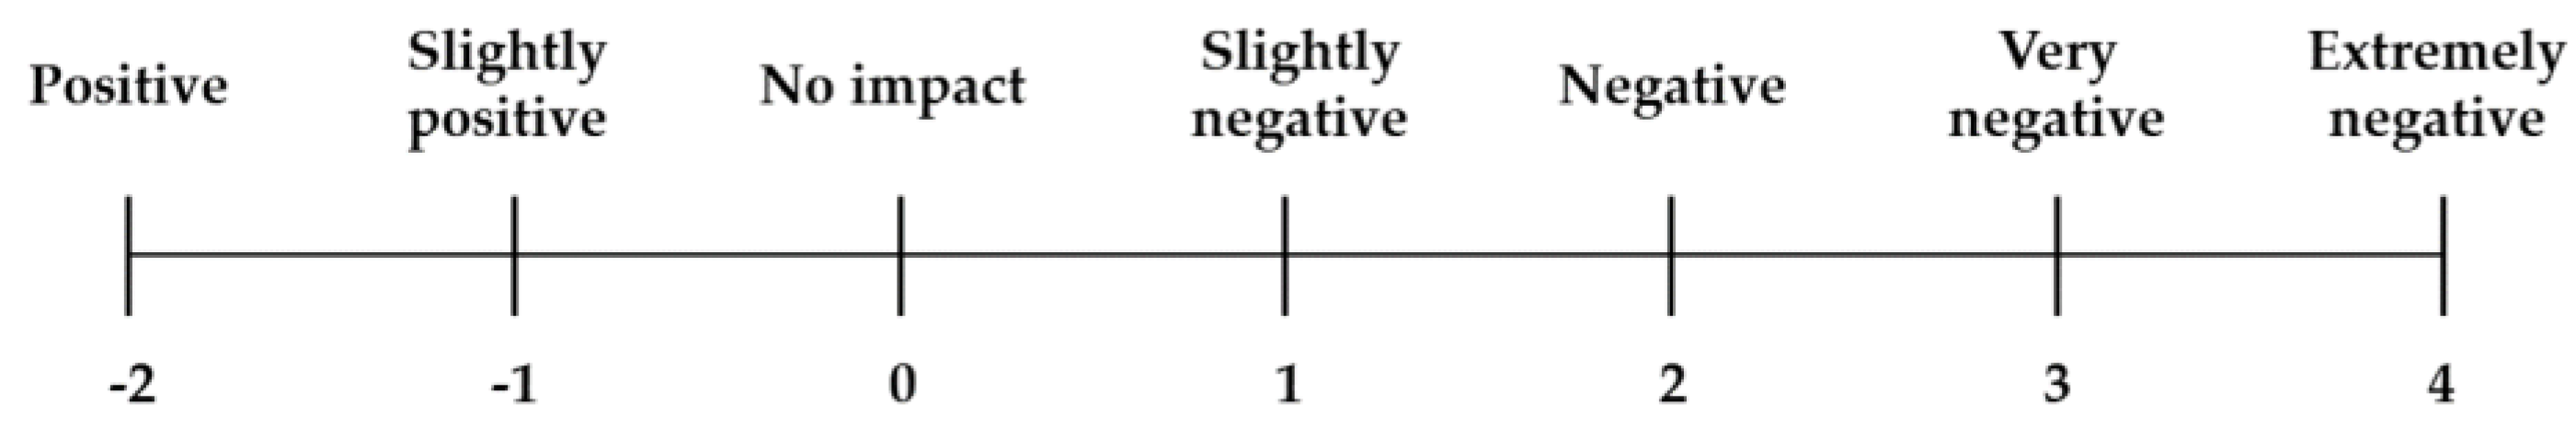
50]. The survey method is as follows. The researchers conducted a structured-questionnaire survey to investigate 54 risk factors. All risk factors were investigated using the three types of questions: (1) how much was the predicted risk before bid?; (2) how much was the actual risk after award?; and (3) how much was the residual risk after mitigation? Risk values were collected by a Likert scale to align the measurement scale so that these risk values could be compared easily. In addition, since risk has a two-sided nature, positive and negative [
41,
48], this study considered risk’s positive and negative effects. However, especially, positive risk cases in construction projects are rare, so this study used a skewed scale (−2, −1, 0, 1, 2, 3, and 4) as is seen in
Figure 2.
The questionnaires were distributed by e-mail to 400 international construction projects conducted by 28 Korean companies. The list of 400 projects was obtained from the International Contractors Association of Korea (ICAK), who manages the international construction project conducted by Korea contractor on the basis of national law. Among the 400 projects, 153 responded. Afterward, 29 projects with poor and inconsistent answers or without profitability information were accepted. Finally, the 124 projects conducted by 23 Korean companies were classified into four project groups.
3.3. Sample Profiles and Classification
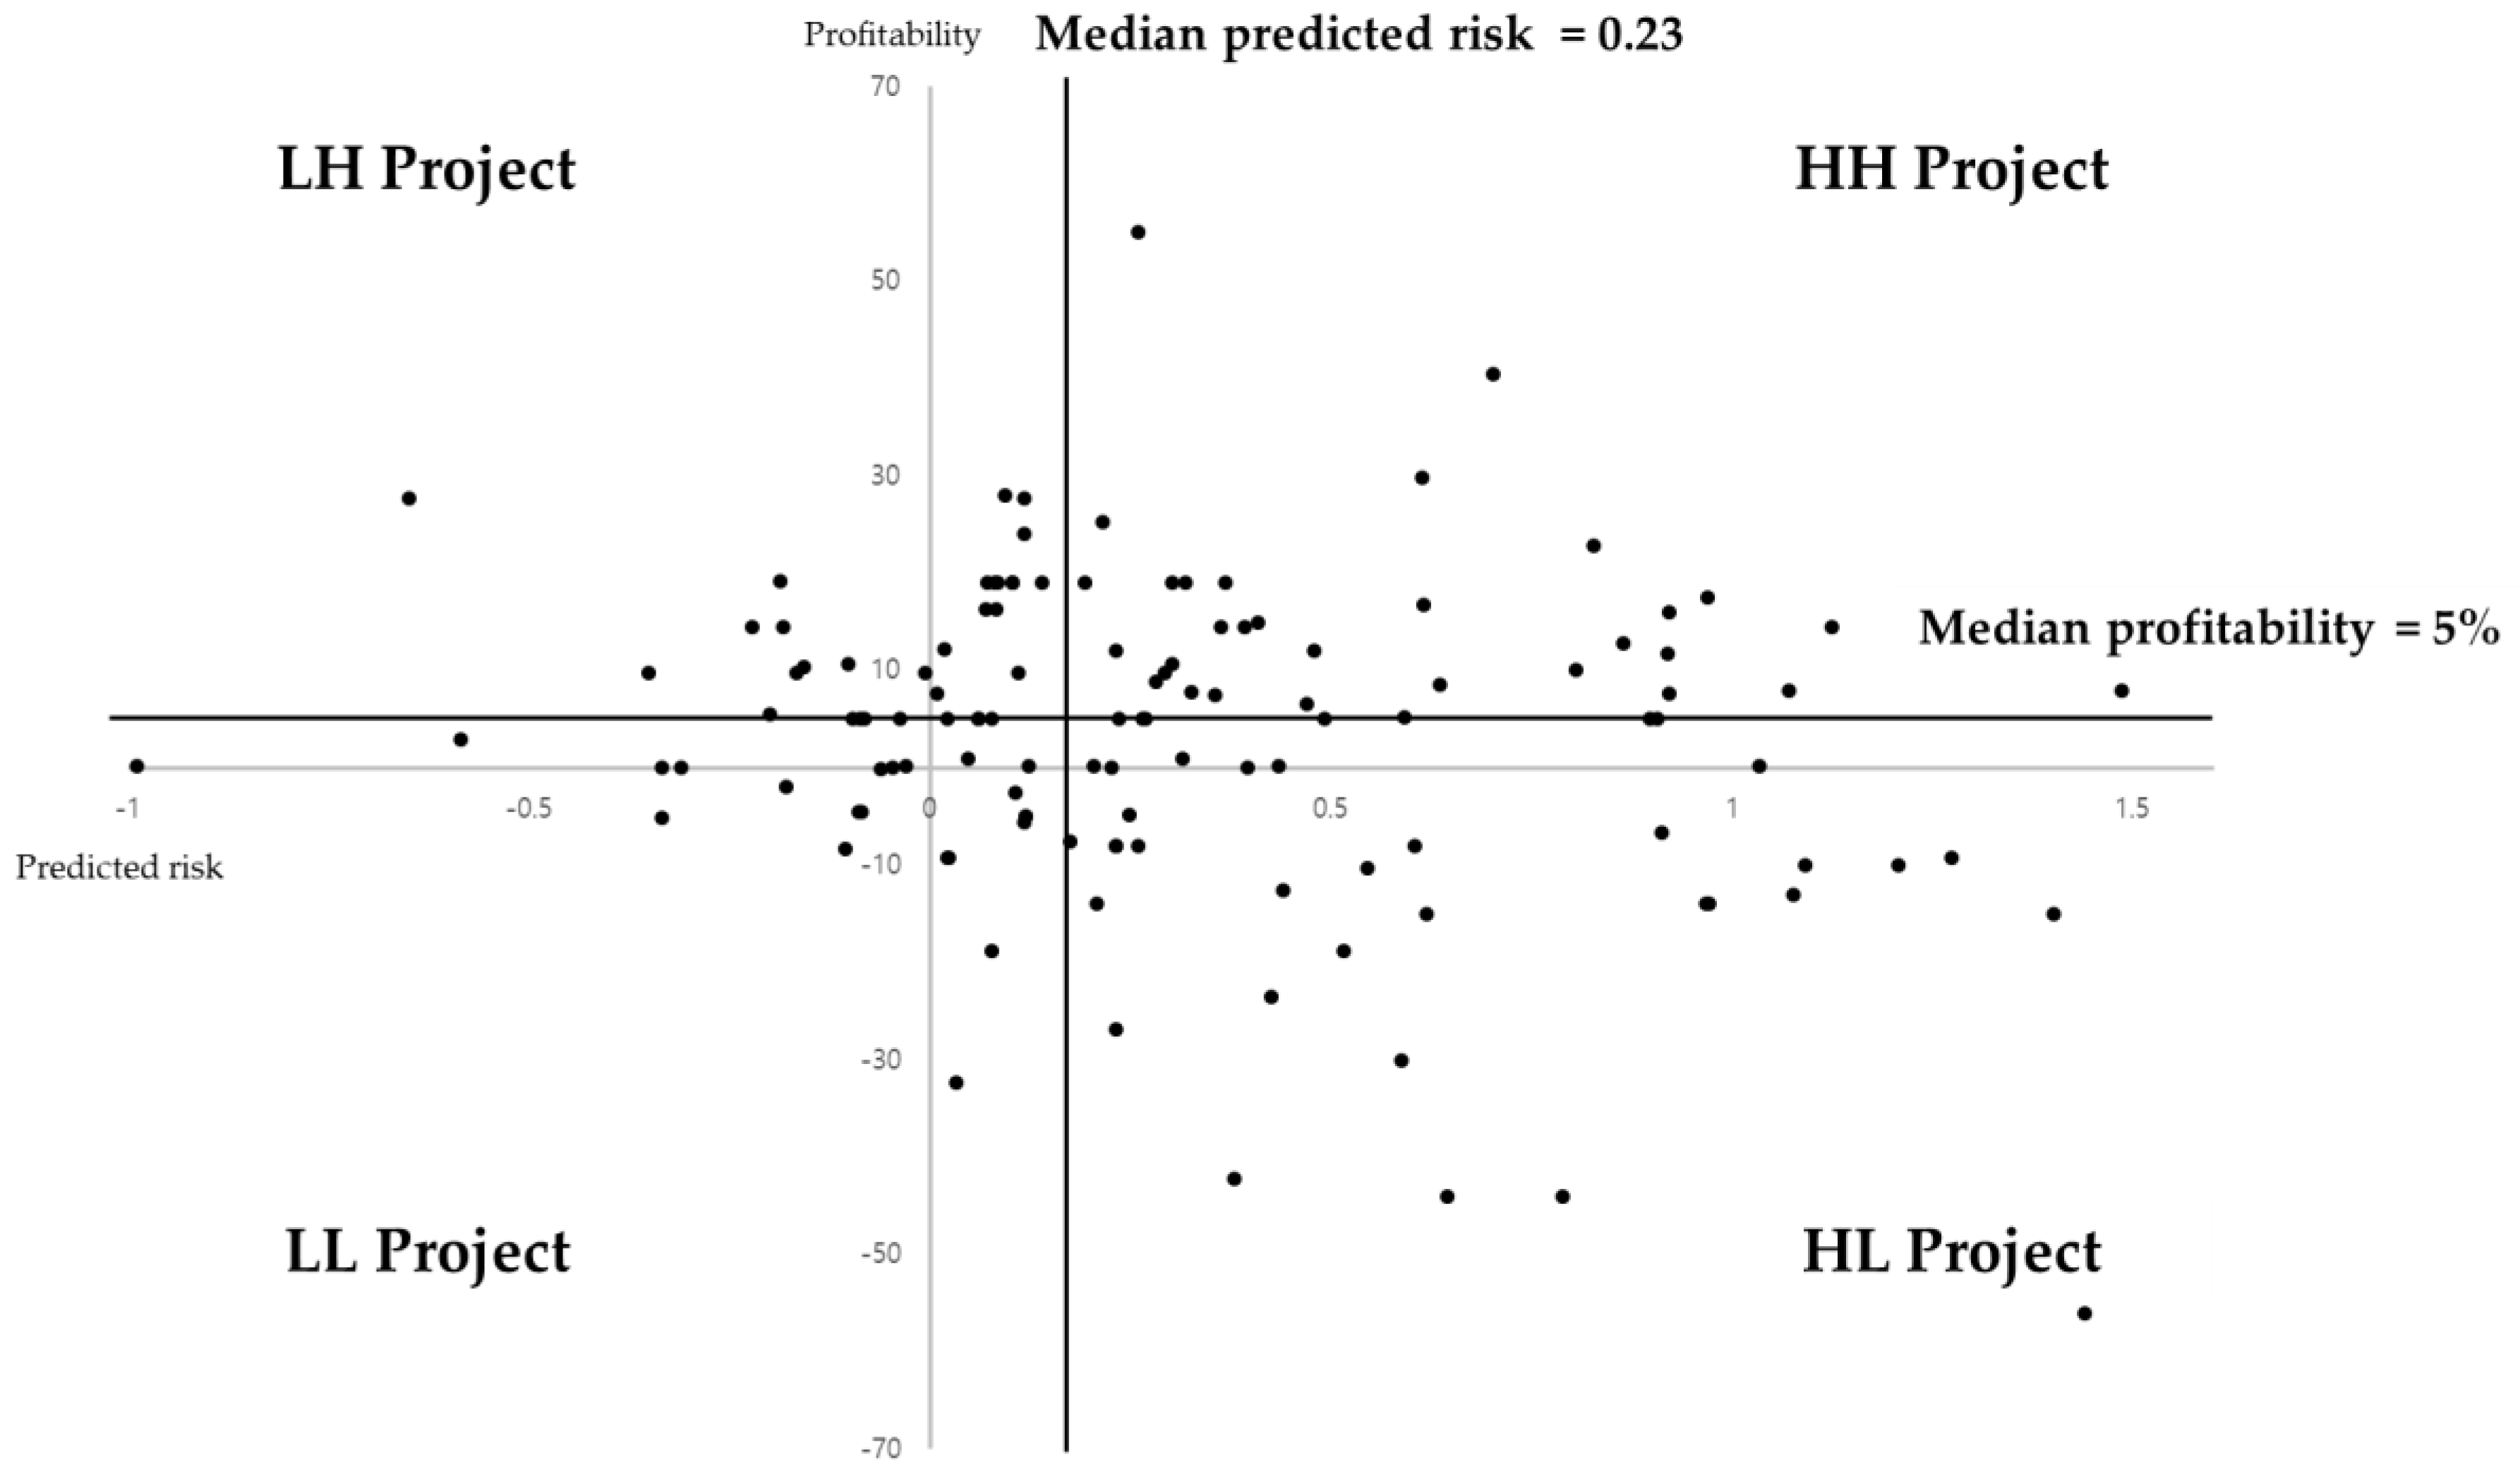
The 124 projects were classified into four project groups based on their predicted risk and profitability value as can be seen in
Figure 3. The criteria for distinguishing between high risk and low risk and high return and low return was relative value based on the median of predicted risk and profitability derived from the 124 projects. In this study, profitability as the difference between contract amount and actual execution cost excluding headquarter overhead cost. These cost data were collected by investigating project manager or cost manager. In order to increase the accuracy, we double-checked our survey data with the registered project data reported to the ICAK. In Korea, construction companies must biannually report the detail information on the award international construction projects to the ICAK. This information includes contract type, contract amount, execution cost, construction duration, and so on. The median value of the predicted risk was 0.23 and the median value of profitability was 5%.
High risk–high return projects (HH projects): projects that the predicted risk is higher than the median value of predicted risk and the profitability is higher than the median profitability;
High risk–low return projects (HL projects): projects that the predicted risk is higher than the median value of predicted risk and the profitability is lower than the median profitability;
Low risk–high return projects (LH projects): projects that the predicted risk is lower than the median value of predicted risk and the profitability is higher than the median profitability;
Low risk–low return projects (LL projects): projects that the predicted risk is lower than the median value of predicted risk and the profitability is lower than the median profitability.
Table 2 shows the profiles of the four project groups.
3.4. Risk Performance Indicators
This study compared the four project groups from three perspectives: (1) risk assessment performance, (2) contingency, and (3) risk mitigation performance. Risk assessment accuracy (RAA) and risk mitigation effect (RME) are used as variables to analyze risk assessment performance and risk mitigation performance. Both variables are calculated by combining the three types of risk investigated by the survey-questionnaire: predicted risk, actual risk, and residual risk. These risk values are calculated as the average value of risk factor. Individual risk factors at level 3 are calculated as the average of the risk values evaluated in 124 projects. The risk values at overall, level-1, and level-2 risk factors are calculated as the average of the risk values in the subcategory.
Risk assessment accuracy is calculated as the difference between predicted risk and actual risk as in Equation (1). Positive value means underestimation and negative value means overestimation. The higher the magnitude of the absolute value means the lower accuracy of the prediction.
where
= risk assessment accuracy of g group, g = risk group = {overall risk, country risk, project risk, capability risk, political risk, economic risk, infra and social risk, owner risk, contract risk, site risk, management risk, technical risk, partner risk}, i = project number,
n = the number of sample project,
= initial risk factor belonging to g group,
= last risk factor belonging to g group,
is the predicted risk value for risk factor
of project I, and
is the actual risk value for risk factor
of project i.
Risk mitigation effect is calculated as the difference between actual risk and residual risk as in Equation (2). The higher value means the better mitigation performance.
where
= risk mitigation effect of g group and
is the residual risk value for risk factor
of project i.
Contingency is divided into project contingency and headquarter contingency. In this study, however, the sum of two types of contingency was used and the allowances in the estimate are not included. Contingency was investigated as a percentage of contract amount by a survey-questionnaire.
3.5. Analysis Method
In order to test normality, the Shapiro–Wilk test was conducted on 52 compared groups (HH–HL and LH–LL) and the result shows that only four compared groups satisfy normality distribution at significance level 0.05. Therefore, this study uses the U-test not the T-test. The Mann Whitney U test compares the HH–HL projects and the LH–LL projects in terms of risk assessment performance, contingency, and risk mitigation performance. The Mann Whitney U test is non-parametric statistical analysis that tests for the difference between two sample groups with no normal distribution [
51]. If the test results are satisfied at the significance level, a statistical difference exists between the two compared samples.
4. Results
4.1. Risk Assessment Performance
Table 3 shows the risk assessment performance of the HH and HL projects. The Mann Whitney U test result indicates that the RAA in overall risk was significantly different between the HH projects and HL projects (
p-value = 0.001). HH projects performed −0.040 RAA, whereas HL projects resulted in 0.293 RAA. In addition, all level-1 risks such as country, project, and capability risk were significantly different between the HH projects and HL projects (
p-value = 0.005,
p-value = 0.006,
p-value = 0.006 in order). These results mean that the risk assessment performance was one of the important triggers distinguishing between high return and low return.
Level-2 risks show three interesting results. First, the RAA of infra and social risk, technical risk, and contract risk were very significantly different between the HH projects and HL projects (
p-value = 0.001,
p-value = 0.002,
p-value = 0.003 in order). Particularly, HH projects estimated technical risk quite well (RAA = −0.043, Rank 1), whereas HL projects severely underestimated technical risk (RAA = 0.383, Rank 6). HH projects also estimated contract risk quite well (RAA = 0.051, Rank 2), whereas HL projects severely underestimated contract risk (RAA = 0.392, Rank 8). These results imply that when the contractors met high-risk projects, if they were confident in assessing technical and contract risk, these contractors were likely to earn high return. Second, the RAA of political risk, owner risk, and partner risk were not significantly different between the HH projects and HL projects (
p-value = 0.076,
p-value = 0.077,
p-value = 0.215 in order). These results imply that when the contractors met high-risk projects, if they were confident in assessing political risk, owner risk, and partner risk, that confidence did not guarantee high return. Last, both HH and HL projects severely underestimated partner risk (HH: RAA= 0.264; Rank 9, HL: RAA = 0.461; Rank 9). International contractors tend to collaborate with international JV partners and local subcontractors because they are not accustomed to doing business in the host country [
52,
53]. However, these strategies did not work well in both HH and HL projects.
Table 4 shows the risk assessment performance in the LH and LL projects. The Mann Whitney U test result indicates that the RAA in overall risk was significantly different between the LH projects and the LL projects (
p-value = 0.006). LH projects performed 0.047 RAA, whereas LL projects resulted in 0.266 RAA. This result means that risk assessment performance was one of the important triggers distinguishing between high return or low return like high-risk projects.
In risk level-1, country and project risk were significantly different between the LH projects and LL projects (p-value = 0.000), whereas capability risk was not significantly different between the LH projects and LL projects (p-value = 0.703). These results imply that even LH projects did not estimate well the capability risk when compared to LL projects.
In risk level-2,
Table 4 shows three interesting results. First, the RAA of contract risk, infra and social risk, and site risk was significantly different between the LH projects and LL projects (
p-value = 0.001,
p-value = 0.011,
p-value = 0.012 in order). Particularly, LH projects overestimated infra and social risk (RAA = −0.348, Rank 8) and site risk (RAA = −0.296, Rank 6), whereas LL projects underestimated infra and social risk (RAA = 0.158, Rank 3) and site risk (RAA = 0.108, Rank 1). This result implies that the risk avoider of infra and social risk and site risk was more likely to yield LH projects. Second, LH projects estimated contract risk quiet well (RAA = −0.010, Rank 2), whereas LL projects underestimated contract risk (RAA = 0.242, Rank 6). This result means that the accuracy of contract risk assessment was the most important criteria to discriminate LH from LL projects. Third, the RAA of management risk, technical risk, and partner risk was not much different between LH and LL projects. Especially, this result implies that accurately assessing capability risk did not guarantee high returns in low-risk projects.
4.2. Contingency
Table 5 shows the contingency in the four project groups. The Mann Whitney U test result indicates that the contingency was not significantly different between the HH projects and HL projects (
p-value = 0.874) and the LH projects and LL projects (
p-value = 0.360). However, a different result was derived in terms of the relation between predicted risk and contingency.
Table 6 shows the predicted risk of the high contingency group and the low contingency group in HH projects and HL projects. The contingency group was divided into relative values through the median values of the contingency size in the same way as the risk and return criteria. The Mann Whitney U test result shows that the overall predicted risk was significantly different between the high contingency group and low contingency group in HH projects (
p-value = 0.049), whereas the overall predicted risk was not significantly different in HL projects (
p-value = 0.256). In HH projects, the predicted risk of low contingency was 0.524, while the predicted risk of high contingency was 0.709. This result implies that the HH projects had a positive relation between risk and contingency so that estimating contingency based on predicted risk had a positive effect on project performance when the risk was evaluated at a high level.
Table 7 shows the predicted risk of the high contingency group and low contingency group in the LH projects and the LL projects. The Mann Whitney U test result indicates that the overall predicted risk was not significantly different between the high contingency group and low contingency group in both the LH projects (
p-value = 0.845) and LL projects (
p-value = 0.146). Contingency is the budget to deal with uncertainties or to reduce the risk that leads to overruns [
39,
40,
41]. Therefore, the smaller the impact of risk on project returns, the lesser the effect of contingency on risk management.
4.3. Risk Mitigation Performance
Table 8 shows the risk mitigation performance of HH and HL projects. The Mann Whitney U test result indicates that the RME in overall risk was not significantly different between the HH projects and HL projects (
p-value = 0.322). Although both HH (RME = 0.266) and HL projects (RME = 0.220) reduced the overall risk amounts, the amounts of each of the HH and HL projects were not significantly different.
Table 9 shows the risk mitigation performance of the LH and LL projects. The Mann Whitney U test result indicates that the MAE in overall risk was not significantly different between the LH projects and the LL projects (
p-value = 0.091). In both projects, the actual risks were very small and sufficiently manageable so that mitigation performance had no significant impact on project profitability.
5. Discussion
In the construction industry, it is difficult for a high-risk project to become a high return project: high-risk projects have been known to be a challenge for yielding a high return. However, even though a construction project looks high risk, a contractor frequently should bid on the project to win the award and gain some profits for business sustainability. Thus, if a contractor can earn a profit on a high-risk project, it means that the contractor has strong market competitiveness.
First, if contractors meet high-risk projects, the accuracy of the risk assessment is the most important factor in yielding a high return. This study showed that the overall RAA was significantly different between HH and HL projects. Particularly, an HH project accurately assessed the technical risk and contract risk rather than an HL project, which could be a key indicator for predicting HH and HL projects. For example, technical risks such as insufficient design management capability and estimation capability could be accurately evaluated based on an understanding of the contractors’ own technical capabilities. Thus contractors must consider assessing their own technical capabilities objectively in order to produce high returns when they meet high-risk projects. On the other hand, both HH and HL projects had the lowest assessment accuracy of partner risk. Partner risk such as the nominated subcontractor’s insufficient capability was difficult to be exactly evaluated before the contract award. Besides, this study revealed that the overall RME was not significantly different between HH and HL projects, unlike the overall RAA. Even if both HH and HL projects succeeded in reducing the risk amounts, the amounts for each HH and HL project were not significantly different. Thus, from the high-risk high return perspective, better risk assessment was more crucial than better risk mitigation.
Second, if contractors met low-risk projects, the accuracy of risk assessment was also important for gaining a high return. This study showed that the overall RAA was significantly different between LH and LL projects. Particularly, an LH project accurately assessed the country and project risk rather than LL projects, whereas an LH project and LL project did show the significant difference in capability risk. Unlike HH and HL projects, the capability risk assessment was not very important to distinguish high return and low return. In level 2 risk, an LH project accurately assessed the contract risk rather than an LL project. This was the same result as in high-risk projects. For example, contract risk such as unfavorable tax and tariff treaty and retained earning transfer was directly affecting to contractors’ profitability. Therefore, contractors should improve their contract risk assessment capabilities and then establish effective risk response plans based on accurate contract risk assessment in order to achieve high returns regardless of the level of risk. On the other hand, interestingly, the RAA of management risk and technical risk were not very different between LH and LL projects unlike in high-risk projects. This study also presented that the overall RME was not significantly different between LH and LL projects. Even if both LH and LL projects successfully reduced the risk amounts, the amounts were similar. From the low-risk low return perspective, then, better risk assessment was also more critical than better risk mitigation.
Last, this study showed that contingency was not significantly different between high-risk projects and low-risk projects. Nevertheless, only the HH projects had a positive relation between contingency and predicted risk. This result implies that more contingency could be effective in yielding high returns. Unfortunately, in practice, it is difficult to apply enough high contingency to an international construction bid.
6. Conclusions
This study sought to increase our knowledge of the kinds of risk factors and management performances that can enable a project to yield a high return. This study classified the 124 projects into four project groups (HH, HL, LH, and LL projects) and compared them in three perspectives: risk assessment performance, contingency, and risk mitigation performance. First, risk assessment performance was the most important factor in causing a project to produce high returns in both high risk and low-risk projects. Especially, the study shows that the accuracy of assessing contract risk was the key indicator in distinguishing high and low return projects regardless of high and low-risk projects. The study also provided that the risk assessment accuracy of the capability was a crucial performance indicator in high-risk projects. Second, contingency was not significantly different in both high risk and low-risk projects. However, only the HH project showed a positive relation between contingency and predicted risk. Last, risk mitigation performance did not significantly affect project return in high both high risk and low-risk projects. Overall, the results show that better risk assessment was more critical than better risk mitigation. This study contributes to furthering our understanding of the difference between high return and low return projects from the perspectives of risk assessment, contingency, and risk mitigation. In so doing, practitioners can be helped in establishing risk management strategies for achieving sustainable profitability when they meet high-risk projects or low-risk projects. Despite these contributions, this study had several limitations. First, a project’s risk–return relationship can differ depending on the owner’s or the contractor’s perspective. However, this study focused on only the contractors’ perspective. Second, this study only investigated and analyzed international construction projects conducted by Korean contractors. Thus, the results could not be completely generalized: when applied to other countries, practitioners should consider different risk attitudes and market situations. Third, this study did not give in-depth management practice information because this study was not conducted by in-depth interviews and case studies but by questionnaire survey. Last, this study could not consider all factors that impact project return. If the market average profit, bidder number, competitiveness, and risk attitude are considered, the findings would be more practical and reliable. Therefore, future studies will deal with these limitations to provide more valuable information and knowledge for sustainable international construction businesses.


