Article

Genetic Diversity and Structure of the Portuguese Pear (Pyrus communis L.) Germplasm

by
Álvaro Queiroz
1,†,
Joana Bagoin Guimarães
2,†,
Claudia Sánchez
3,
Fernanda Simões
2,
Rui Maia de Sousa
3,
Wanda Viegas
4 and
Maria Manuela Veloso
2,4,*
1
Instituto Politécnico de Viana do Castelo, Escola Superior Agrária, P 4990-706 Ponte de Lima, Portugal
2
Instituto Nacional de Investigação Agrária e Veterinária, Unidade de Investigação de Biotecnologia e Recursos Genéticos, Quinta do Marquês, 2784-505 Oeiras, Portugal
3
Instituto Nacional de InvestigaçãoAgrária e Veterinária, Estação Nacional de Fruticultura Vieira de Natividade, 2460-059 Alcobaça, Portugal
4
LEAF, Linking Landscape, Environment, Agriculture and Food, Instituto Superior de Agronomia, Universidade de Lisboa, Tapada da Ajuda, 1349-017 Lisboa, Portugal
*
Author to whom correspondence should be addressed.
These authors contributed equally to the work.
Sustainability 2019, 11(19), 5340; https://doi.org/10.3390/su11195340
Submission received: 12 July 2019 / Revised: 18 September 2019 / Accepted: 19 September 2019 / Published: 27 September 2019
(This article belongs to the Special Issue Genetic Resources for Sustainable Agriculture)

Abstract

:
A rich heritage of traditional pear varieties is kept in national Portuguese collections. Out of these varieties, “Rocha” dominates national pear production. Although a noticeable phenotypic variation among clones of this variety has been reported, little is known about its genetic variability, as to date molecular studies have been performed on a single “Rocha” clone. Eleven Simple Sequence Repeats (SSR) markers were used to assess the genetic diversity of 130 local cultivars, 80 of them being “Rocha” clones. The results allowed the differentiation of 75 genotypes of which 29 are “Rocha”. Three synonyms groups and four homonymous groups of other local varieties were confirmed. A Bayesian model-based clustering approach identified two distinct clusters. Using flow cytometry, six cultivars were found to be triploids. These results show high genetic variability among “Rocha” clones. In conclusion, there is a need for different “Rocha” clones to be preserved to enable the correct selection of the multiplication material.

1. Introduction

Pear (Pyrus communis L.) is an important fruit crop that has long been cultivated in Europe. Portugal ranks third in pear production in Europe, after Italy and Spain [1]. A large number of local traditional varieties have been abandoned and replaced by modern varieties bred to meet the demands of both producers and consumers. However, from the heritage of traditional pear varieties, kept in Portuguese national collections [2], “Rocha” stands out as a true commercial success. The origin of this variety is uncertain but it is frequently assumed that it originated in the 19th century from a seedling tree detected by Mr. Rocha in his Sintra farm [3]. Due to the fruit high quality (taste, consistency, form, colour, high conservation capacity) “Rocha” was greatly propagated and cultivated in every orchard of “Região do Oeste” (northwest of Lisbon) [4]. In 1950, it ranked second among the pear varieties sold in Lisbon [5] and, since 2003, has been labeled as Protected Denomination of Origin. At present, “Rocha” orchards occupy about 11,000 ha with an average annual fruit production of 173,000 tons (99% of the national pear production). Around 60% of this production is exported to Brazil, United Kingdom, France, Germany, and Morocco, with a revenue value that is expected to reach a value of 100 million € in 2019 [6].
A breeding program aiming at a “Rocha” clonal selection for yield and virus free plants began in 1970 and it was observed that a high clonal variation existed in farmers orchards. This fact prompted researchers of the Vieira de Natividade Fruit Research Station (Alcobaça) to establish a field collection of “Rocha” clones [4].
The genetic diversity of fruit trees is nowadays assessed using DNA-based molecular markers [7,8,9,10,11,12] and the Portuguese Pyrus diversity has already been studied using RAPDs [13], AFLPs [14] and microsatellites—SSRs [15]. SSRs have become markers of choice because they are highly informative, reliable, and easy to use for cultivar identification thereby improving the management of collections by enabling the identification of duplicates, synonymies, and homonymies [15,16,17]. They are also valuable tools to understand the origin of local varieties, and to ascertain the importance of introgression, polyploidy, and hybridization in their evolution [18].
In our previous SSR study, we targeted a limited number of Portuguese pear landraces [15]. The present study is extended to 12 more landraces that include “Rocha”. Given the importance of “Rocha” and its high phenotypic variation, evident even in growth vigor and fruit size, the study also included 80 of its clones. The more reliable genetic evaluation with an increased sample number enables the understanding of evolutionary processes such as hybridization and polyploidy in the pear plants studied. The association between fruit size and ploidy level is also a valuable descriptor for characterization of plant genetic resources [19] and so, this diversity was evaluated in our accessions using microsatellite and genome size as markers. This work provides further insights into the diversity and genetic structure of pear landraces that contribute to improved management of this local resource.

2. Materials and Methods

2.1. Plant Material and DNA Extraction

A total of 132 accessions of P. communis (of which 50 are local varieties, 80 are “Rocha” clones, and two are the international references “Conference” and “Abbé Fétel”) were analyzed in this study (Table 1). Forty (40) samples were collected from the Portuguese National Pear Collection, located at the Centro Experimental de Horto-Fruticultura, Quinta da Sobreira, Vidago (41° 38.2′ N, 7°34.6′ W) and at Quinta de Sergude, Felgueiras (41°22.7′ N, 8°10.9′ W), twenty one (21) samples from the field collection from Instituto Nacional de Investigação Agrária e Veterinária (INIAV), at “Polo de Alcobaça”, Alcobaça (39°57′28.90″ N, 8°91′72.11″ W) and seventy one (71) “Rocha” pear accessions from Quinta de São João, at Caldas da Rainha. The Quinta de S. João orchard was established in 1989. Accessions are referred in the text by their clone number and provenance (V for Vidago, S for Sergude, and A for Alcobaça); Rocha 9–Rocha 79 for pear accessions from Quinta de S. João orchard. DNA was isolated from young leaves using the innuPREP Plant DNA Kit (Analytik Jena AG, Berlin, Germany), according to the manufacturer’s protocol. DNA quality was checked on 0.8% agarose gel, and the DNA concentration was estimated using a NanoDrop ND2000 spectrophotometer (Thermo Scientific, Massachusetts, MA, USA).
Genome size and DNA ploidy levels were assessed using flow cytometry, performed by Plant Cytometry Services (www.PlantCytometry.nl). The determination of the nuclear DNA content of Pyrus was performed with the simultaneous analysis of nuclei isolated from Pachysandra communis and P. communis. The commercial variety “Conference” used as a control reference, is diploid (2X) and has a relative DNA ratio with Pachysandra of 0.37.

2.2. PCR Amplification and Fragments Sizing

The following eleven SSR loci, recommended by the European Cooperative Plant Genetic Resources (ECPGR), out of a list of 17, as the “minimum core” for pear fingerprinting [20] were used: CH01d08, CH03g07, CH01f07a, CH05c06, EMPc11, EMPc117, CH01d09, CH02b10, GD96, CH03d12, and CH04e03. Eight microsatellite loci were developed in apple [21] but present a high transferability and polymorphisms in the subtribe Pyrinae, allowing their use to assess cultivar identification in pear. The amplification was performed in a 10 μL solution using forward primers fluorescently labeled (D3 or D4) at the 5´ end and unlabeled reverse primers. PCR contained 2x QIAGEN Multiplex PCR Master Mix, 10x primer mix (2 μM of each primer), BSA BIOLABS (20 mg/mL), RNase-free water and 10 ng of genomic DNA. The PCR was programmed as follows: 15 min at 95 °C for initial denaturation, followed by 40 cycles of denaturation at 94 °C for 30 s, annealing at optimum Ta for 1 min and 30 s and extension at 72 °C for 1 min. A final extension step at 60 °C for 30 min and the reaction was finished with a continuous cycle at 8 °C. The reactions were conducted in an MWG AG Biotech thermocycler. The PCR reactions were carried out in two marker sets of 11 microsatellites, and mixtures of PCR products of different markers with different dyes (or distinct allele size ranges) were prepared for simultaneous detection of the amplified alleles. Subsequently, 1.0 µl of the PCR mixture was added to 24 µl formamide and 0.5 µl fragment size standard labeled with WellRED dye D1 (DNA size standard kit, 400, Beckman Coulter). Capillary electrophoresis was performed to separate the PCR products using the CEQ 8000 Genetic Analysis System (Beckman Coulter Inc., Brea, CA, USA). The sizes of the amplified products were determined based on a internal standard included with each sample. Data analysis was performed using the CEQ 8000 Fragment Analysis software, version 9.0, according to the manufacture´s recommendations (Beckman Coulter Inc., Brea, CA, USA). Sizes of fragments were automatically calculated using the CEQ 8000 Genetic Analysis System.

2.3. Data Analysis

GenAlEx 6.503 [22] was used to assess the genetic diversity measured as the number of alleles per locus (Na), observed and expected heterozygosity (Ho and He), number of private alleles and to calculate the pairwise standard genetic distances and the standard Fst (via frequency) values.
For diploid individuals, the genetic distance between each pair of individuals was calculated following Nei and Li [23]. Triploids were added to the analysis by hand calculation of their distances to the other individuals and by adding these to the distance matrix. The neighbor-joining algorithm, as implemented in the DARwin software package version 6.0.12 [24], was based on a dissimilarity matrix, and the reliability of the tree topology was assessed via bootstrapping over 1000 replicates.
Regarding the PCoA, the distance matrix was calculated following Peakall and Smouse [22]. Principal co-ordinate analysis (PCoA) was used to assess the diversity of all accessions but triploids.
The level of genetic stratification among the studied germplasm was assessed using the STRUCTURE v.2.3.4 software [25]. This analysis was performed based on the SSR genotypes with two alleles, excluding those genotypes for which a third allele was observed for one or more loci. The analysis was performed considering both the admixture model and the correlated allele frequencies between populations, with values of K set from 1 to 15. The population information was incorporated into the analyses (LOCPRIOR model). Each run consisted of a burn-in period of 104 steps followed by 106 MCMC (Monte Carlo Markov Chain) replicates assuming admixture model and correlated allele frequencies. K is the probable maximum population number that is assumed to represent and to contribute to the genotypes of sampled individuals. To check the consistency of the results between runs with the same K, fifteen replicates were run for each assumed K value. The approach suggested by Evanno et al. [26] was adopted to calculate the most likely value of K based on the second-order rate of change of the likelihood function with respect to K (DK). Once the number of genetic clusters was established, each individual was assigned to a cluster, and the overall membership of each sampled individual in the cluster was estimated.

3. Results

3.1. Overall Genetic Diversity

The eleven SSR loci amplified a total of 129 alleles with an average of 11.7 alleles ranging from eight (CH01d08 and GD96) to sixteen (CH01d09) and the average number of effective alleles was 5.8 (Table 2 and Table S1).
The expected heterozygosity (He) ranged from 0.46 (CH04e03) to 0.89 (CH03g07) with an average of 0.79. The observed heterozygosity (Ho) ranged from 0.46 (CH04e03) to 1.00 (GD96) with an average of 0.83. The Polymorphism Information Content (PIC) value indicated that the SSR discriminatory power was quite good except for that of the CH05c06 and CH04e03, respectively 0.301 and 0.337 (Table 2).
The “Rocha” genotypes identified as synonymous were not considered for cluster analysis nor PCoA which means that the “Rocha” genotypes were therefore restricted to 29 (Table S2). The remaining traditional pear landraces correspond to 46 distinct SSR profiles (Table S1). Three groups of synonymies were identified (Table 3) and four groups of homonyms were detected (Table 4).

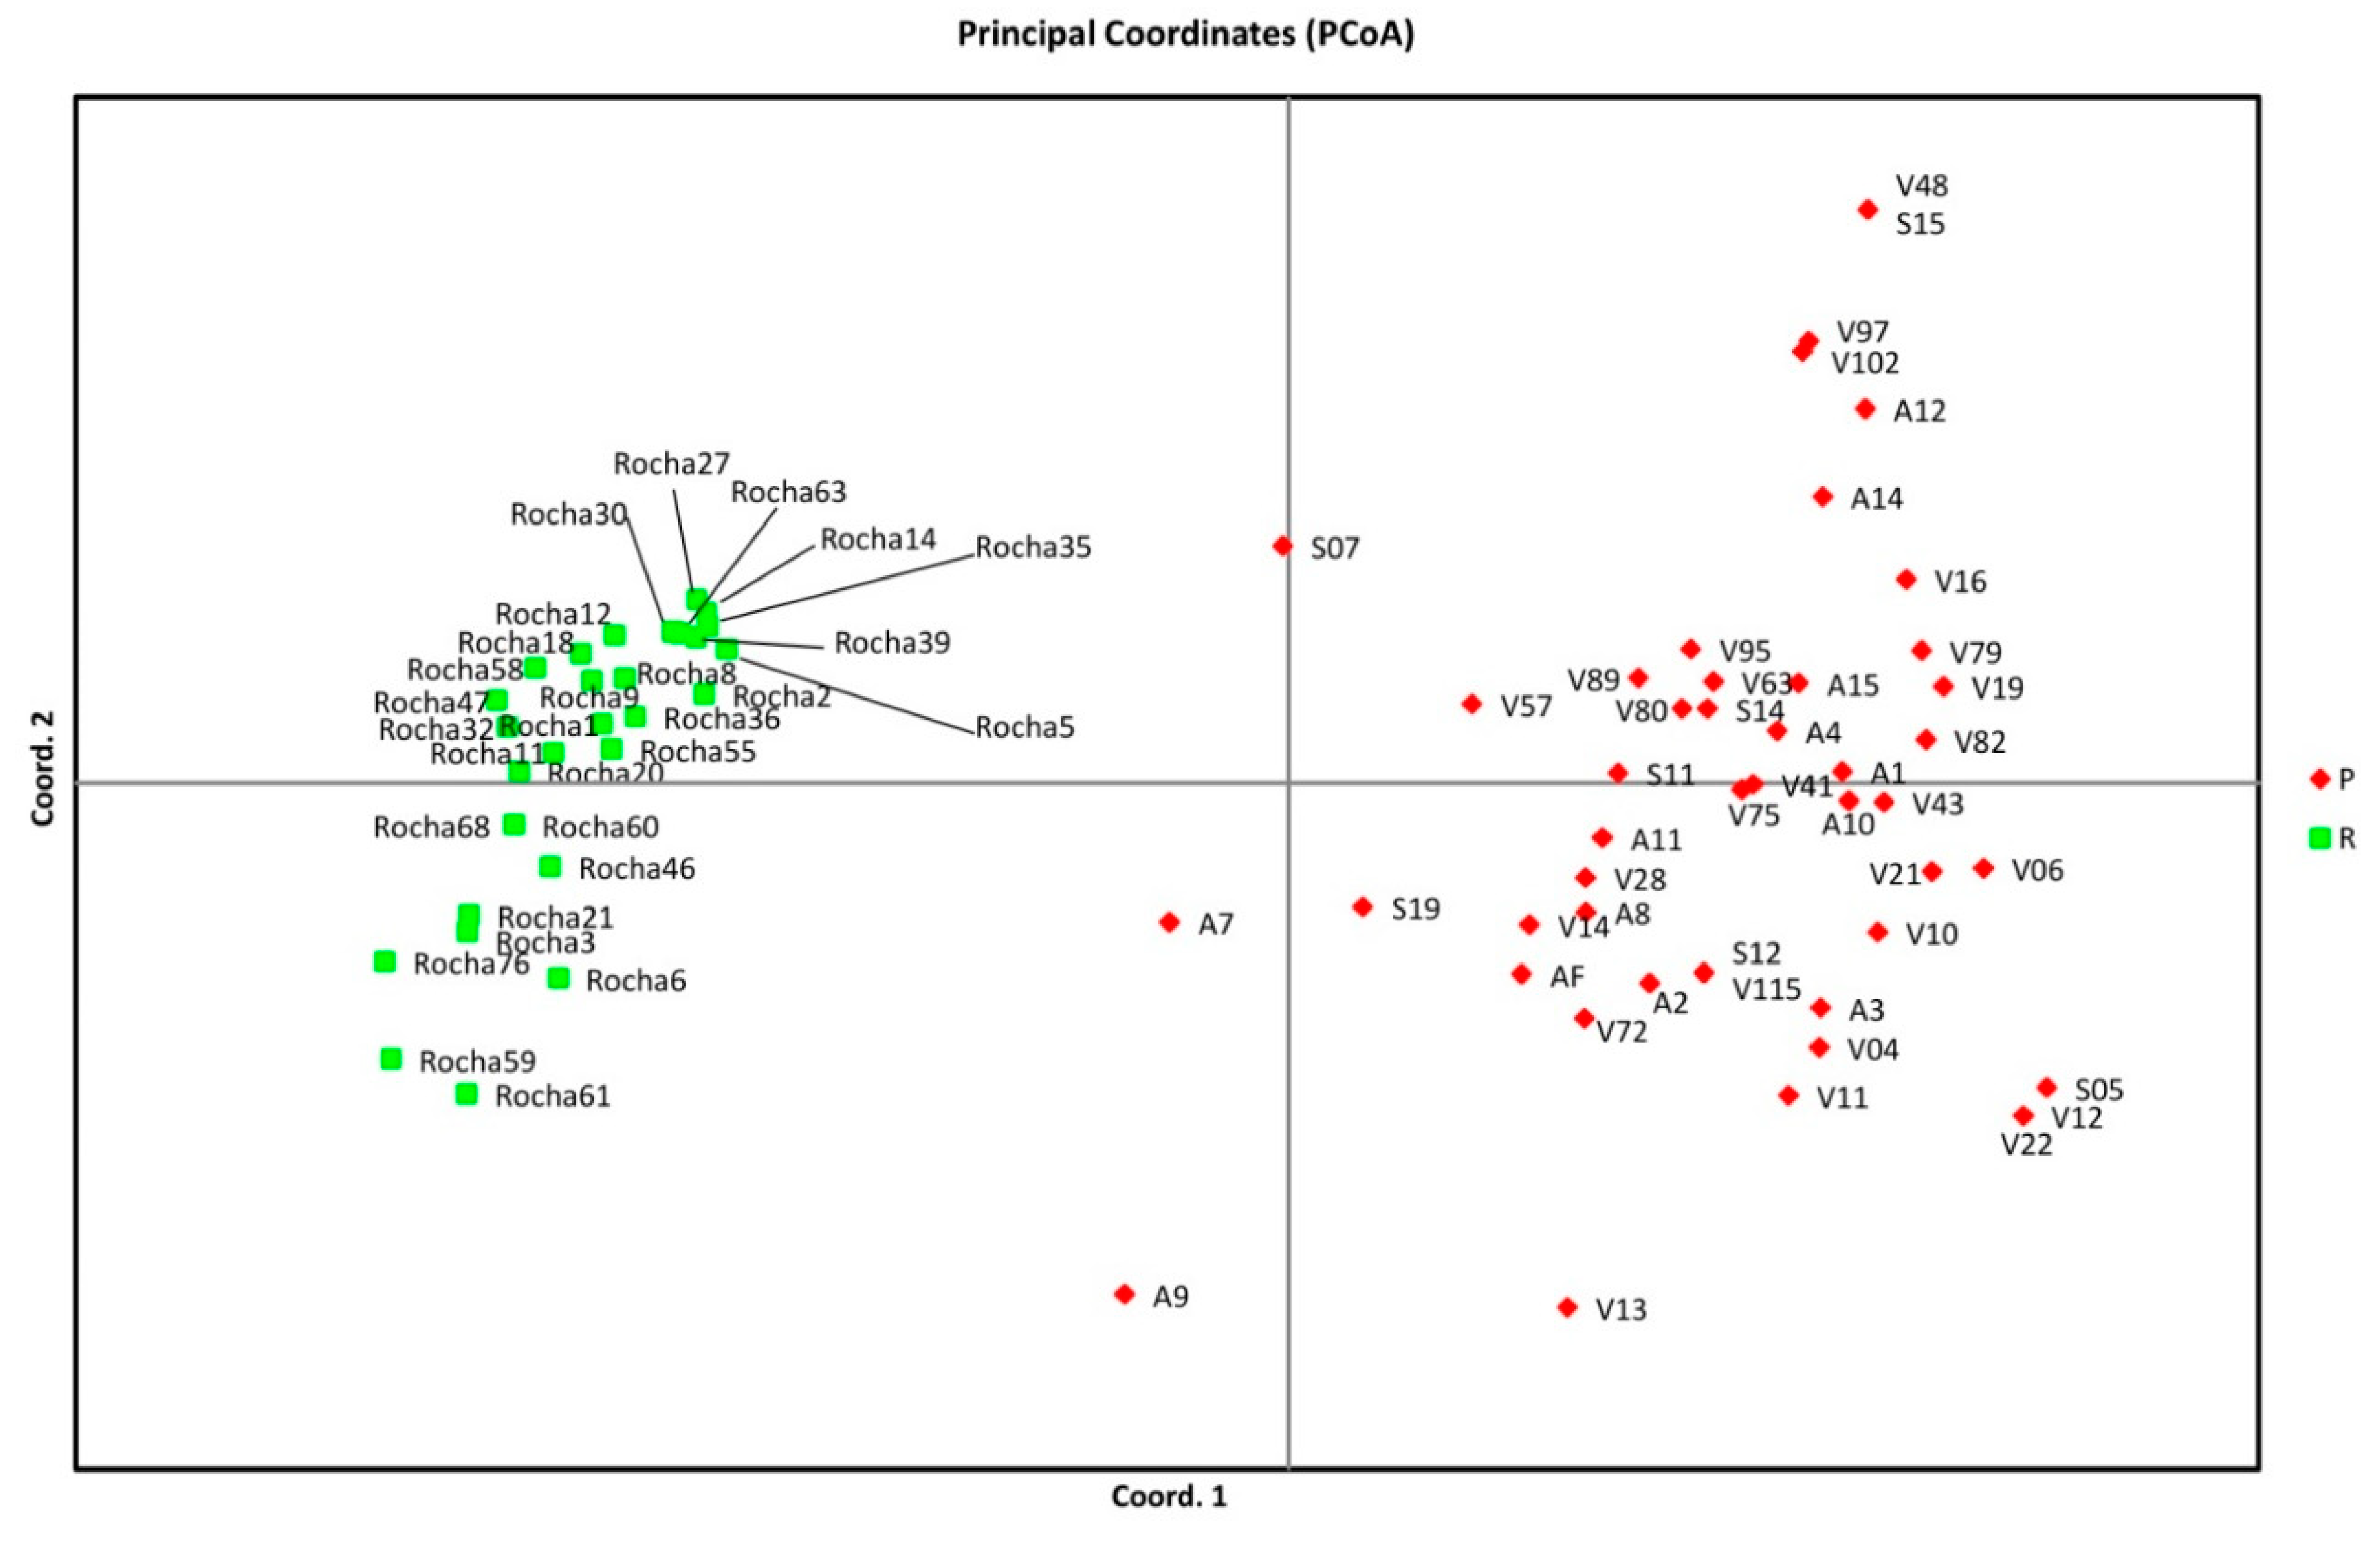
3.2. Genetic Relationships among Pear Genotypes

The neighbor joining dendrogram in the cluster analysis identified two main clusters. One cluster is entirely made of “Rocha” and includes 2 subgroups (Figure 1A,B).The other cluster is composed by 44 traditional pear landraces with distinct SSR profiles and two international references (“AF” and “S19”). “Amendoa I” (V12) and “RaboTorto” (V22), “Amorim” (S15), “Amorim Branco” (V48) and “LambeosDedos” (V97), “Carapinheira” (V115), and “CarapinheiraBranca” (S12) were undistinguished. The landraces “Baguim” (V39), “CoradaParda” (V07), “Marquesinha” (S18), “PeraCabaça” (V26), and “PérolaAmarela 1” (V66) clustered with the remaining traditional cultivars. The landraces “Cristo” (A7) and “Bojarda” (S07) did not group with any of the two clusters forming two individual branches.
The overall PCoA analysis explained 45.94% of the variation and the first two axes accounted for 33.51% and 7.34% of the variation (Table 5). Despite the low percentage of variation, it is evident the presence of two main clusters. The landraces “Bojarda” (S07), “Cristo” (A7), “Marmela” (A9), and “Marmela 1” (V13) are outliers (Figure 2).

3.3. Genetic Structure of Pears

The Bayesian approach indicated that the most likely number of genetic clusters (hereafter called subpopulations) was K = 2 (Delta K = 569.68), while the second-best solution was K = 9 (Delta K = 1.99) (Figure 3 and Figure S1). At K = 2, all the 80 “Rocha” accessions were assigned to a unique sub-group (green) distinct from that subpopulation formed by the remaining 45 landraces plus the 2 international references (AF and S19) (red subpopulation). It is interesting to notice that the samples “Cristo” (A7), “Marmela” (A9), “Bojarda” (S07), and “Conference” (S19) have admixed characteristics (Figure 3A). At K = 9 it is still evident the existence of the two subpopulations, that of “Rocha” and that of the remaining germplasm accessions. However, in what concerns the remaining accessions there is a better definition of the differences existing between them. For instance, “Amorim Branco” (V48) and “LambeosDedos” (V97) are shown as undistinguished but “Cristo” (A7), “Marmela” (A9), and “Bojarda” (S07) are shown as partially admixed with “Rocha” (Figure 3B).

3.4. Polyploidy

Nuclear DNA content of the pear accessions indicated that “Baguim” (V39), “CoradaParda” (V07), “Marquesinha” (S18), “PeraCabaça” (V26), “PérolaAmarela 1” (V66), and “Rocha 25” are triploids (Figure S2). The remaining accessions are diploid.

4. Discussion

4.1. Overall Genetic Diversity

This study deepened the knowledge on diversity of Portuguese local pears, previously reported [15], since 130 accessions were now genotyped using eleven SSR markers. The number of alleles identified in our study was very similar to that referred to by Sehic et al. [27] except for the number of alleles produced by CH03d12 and CH04e3 loci. Mean heterozygosity values (Ho = 0.83 and He = 0.79) were similar to those found for local varieties and reported by other groups [18,27,28,29,30]. This high level of observed heterozygosity results from the fact that pear is an outcrossing plant and also has gametophytic self-incompatibility [31]. Ghosh et al. [32] found an observed heterozygosity equivalent to 0.63 and Hokanson et al. [33] reported 0.62 when nine SSR loci were used to study 142 Malus accessions. According to these studies, a correlation between heterozygosity and the plant pollination nature can be observed in the subfamily of Pomoideae.
The present study classified as synonymous “Amendoa I” (V12) and “RaboTorto” (V22) which have distinct phenotypic characteristics [34]. This was a result of mislabeling when the “RaboTorto” (V22) clone was sent to the National Collection (A. Assunção, personal communication).

4.2. Genetic Relationships among Pear Genotypes

In our study, the Portuguese pear accessions were clearly discriminated by the SSR markers. The 29 distinct “Rocha” genotypes clustered together in an independent genepool well separated from the cluster of the remaining landraces; “Bojarda” (S07) and “Cristo” (A07) are exceptions as they form separated branches (Figure 1). Minor genetic variation was observed among the different “Rocha” clones, which could be due to somatic mutations related to grafting [35] or, in some cases, the results of hybridization with unknown pear plants. Previously, a great variability and heterogeneity was referred among Malvasia grapevine clones that were cultivated in different geographic areas [36,37]. Clonal variation has also been reported within ancient Portuguese grapevine varieties [38]. It should be stressed that most of the reported molecular mechanisms underlying clonal variation are still unknown [35,36].
Contrary to our results, two previous work using AFLP and RAPD markers showed that “Rocha” clustered with the other Portuguese cultivars [13,14]. The authors of these works, besides using different molecular markers from ours, only analyzed one “Rocha” clone. This fact could explain the observed differences, taking in consideration that “Rocha” clones are highly variable. Bassil et al. [28], using SSRs to analyze the Portuguese pear genotypes, found that they were separated into two clades, with the only “Rocha” pear studied being placed between the two clades. Since this work only used a “Rocha” accession, it is impossible to understand from such a study which is the “Rocha” relationship with the other Portuguese accessions.
When considering the characteristics of the Portuguese accessions other than “Rocha”, it should be mentioned that the introduction of French, English and Belgian varieties in Portugal have played an important role in the genetic variability found in Portuguese pear genetic resources. For instance, it is known that “D. Joaquina” and “Amorim” (also called “Lambe-os-Dedos”) did not originate in Portugal [14,15]. Also, Amaral [5] suggested that “Bojarda” could be of Italian or French origin.

4.3. Genetic Structure

At present, STRUCTURE is one of the most widely used population analysis methods to perform inferences of genetic structure in a set of samples and to understand the patterns of genetic diversity [12,39]. In our study, the STRUCTURE analysis allowed the clear distinction of the two subpopulations of “Rocha” from the old local varieties. The results can be obtained irrespective of the K value used, but at K = 9 we could, additionally, identify the origin of “Rocha” plants: Alcobaça (blue colour) and Caldas da Rainha (red colour) (Figure 3B). Since the analysis was performed with the “high priority” recommended marker sets [20], we consider that this result evidencing the two subpopulations for the genetic structure of the Portuguese pear is a robust one. In fact, Urrestarazu et al. [12] confirmed the ability of STRUCTURE to detect a clear differentiation of P. communis germplasm and suggested that several genepools could be considered. Also using STRUCTURE, Santos et al. [18] found a division between Northern European cultivars and Western Spanish pear germplasm. Independent and local selection was also reported for other fruit trees such as Western Mediterranean olive cultivars [40,41].
When we performed a PCoA analysis, we obtained results that were in accordance with the results of STRUCTURE, where two main subpopulations are visible. Concerning the accessions “Cristo” (A7), “Marmela” (A9), and “Bojarda” (S07), which in the PCoA graphic are in an intermediate position between the two subpopulations (Figure 2), it is not possible to know their origin for certain although Amaral [5] suggested that S07 could be of Italian or French origin.

4.4. Polyploidy

The majority of cultivated pears are diploid (2n = 2X = 34) but a few cultivars of P. communis are polyploids [28,42] and it is known that the size of the Pyrus genome was influenced by polyploidy [43]. Queiroz et al. [15], using six SSRs, verified that “Baguim” (V39), “PerolaAmarela 1” (V66), and “PeraCabaça” (V26) were triploids, which we confirmed in the present work using flow cytometry. Furthermore, this technique also identified “CoradaParda” (V07), “Marquesinha” (S18), and “Rocha 25” as triploids. These “Rocha” polyploidy clones are from a field collection that resulted from clonal selection performed in different farmers´ fields, on the basis of important agronomic traits such as yield, fruit size, and virus free plants. Despite the agronomic importance of fruit size, it was not possible to directly correlate it with a ploidy level.

5. Conclusions

Our results provide useful information for improved management and conservation of the P. communis germplasm in Portugal. “Rocha” has a relatively independent genepool with significant intra-variety diversity. This suggests the need to preserve different “Rocha” clones for the correct selection of multiplication material. Given the importance of polyploidy in crop improvement, more research is needed to understand its association with better agronomic performance that includes fruit size.

Supplementary Materials

The following are available online at https://www.mdpi.com/2071-1050/11/19/5340/s1, Table S1: SSR screening of 132 P. communis accessions using 11 loci. Table S2: The 29 “Rocha” accessions that were used for cluster analysis and PCoA analysis. Figure S1: Exploration of K values for STRUCTURE analysis of pear germplasm. Figure S2: Flow cytometric histograms of relative fluorescence intensities of stained nuclei isolated from P. communis.

Author Contributions

M.M.V. and Á.Q. conceived the study; R.M.d.S. selected and provided the germplasm from the INIAV collection; F.S. participated in sample collecting; J.B.G. and Á.Q. performed the lab work and the SSR data analysis; Á.Q., C.S. and M.M.V. wrote the manuscript; W.V. critically revised the manuscript. All authors read and approved the final manuscript.

Funding

This study was supported by the project InovPomo—“Melhoramento do processo produtivo de peras e maçãs através da conservação e caracterização do material vegetal” (Proder 40448) and by Fundação para a Ciência e a Tecnologia (UID/AGR/04129/2019).

Acknowledgments

We are very grateful to Luis Carneiro for help in statistical analysis and A. Assunção for providing the pear samples from the Portuguese National Pear Collection.

Conflicts of Interest

The authors declare no conflict of interest.

References

  1. EUROSTAT. 2017. Available online: https://ec.europa.eu/eurostat/statisticsexplained/index.php/Agricultural_production_-_orchards (accessed on 1 April 2019).
  2. Bettencourt, E. Status of Malus/Pyrus germplasm collections in Portugal. In Report of a Working Group on Malus/Pyrus, Second Meeting, Dresden-Pillnitz, Germany, 2–4 May 2002; Maggioni, L., Fischer, M., Lateur, M., Lamont, E.J., Lipman, E., Eds.; International Plant Genetic Resources Institute: Rome, Italy, 2004; pp. 46–50. ISBN 92-9043-611-5. [Google Scholar]
  3. Mata, G.J. A Pereira Rocha. Subsídio para o estudo das variedades de pereiras portuguesas. In Actas do 2º Congresso Nacional de Pomologia; Ministério da Agricultura: Lisboa, Portugal, 1932; Volume I. [Google Scholar]
  4. Soares, J.; Silva, A.; Alexandre, J. O Livro da Pereira Rocha, 1st ed.; Associação Nacional dos Produtores de Pereira Rocha: Cadaval, Portugal, 2001; p. 184. [Google Scholar]
  5. Amaral, J.D. As Pomóideas. Manual Enciclopédico do AgricultorPortuguês, 1st ed.; Gazeta das Aldeias: Porto, Portugal, 1959. [Google Scholar]
  6. Associação Nacional dos Produtores de Pera Rocha. Available online: http://perarocha.pt/ (accessed on 1 April 2019).
  7. Laurentin, H. Data analysis for molecular characterization of plant genetic resources. Genet. Resour. Crop Evol. 2009, 56, 277–292. [Google Scholar] [CrossRef]
  8. van Treuren, R.; Kemp, H.; Ernsting, G.; Jongejans, B.; Houtman, H.; Visser, L. Microsatellite genotyping of apple (Malus×domestica Borkh.) genetic resources in the Netherlands: Application in collection management and variety identification. Genet. Resour. Crop Evol. 2010, 57, 853–865. [Google Scholar] [CrossRef]
  9. Urrestarazu, J.; Denancé, C.; Ravon, E.; Guyader, A.; Guisnel, R.; Feugey, L.; Poncet, C.; Lateur, M.; Houben, P.; Ordidge, M.; et al. Analysis of the genetic diversity and structure across a wide range of germplasm reveals prominent gene flow in apple at the European level. BMC Plant Biol. 2016, 16, 130. [Google Scholar] [CrossRef] [PubMed]
  10. Teng, Y.; Tanabe, K. Reconsideration on the origin of cultivated pears native to East Asia. Acta Hortic. 2004, 634, 175–182. [Google Scholar] [CrossRef]
  11. Zheng, X.; Cai, D.; Potter, D.; Postman, J.; Liu, J.; Teng, Y. Phylogeny and evolutionary histories of Pyrus, L. revealed by phylogenetic trees and networks based on data from multiple DNA sequences. Mol. Phylogenet. Evol. 2014, 80, 54–65. [Google Scholar] [CrossRef] [PubMed]
  12. Urrestarazu, J.; Royo, J.B.; Santesteban, L.G.; Miranda, C. Evaluating the influence of the microsatellite marker set on the genetic structure inferred in Pyrus communis L. PLoS ONE 2015, 10, e0138417. [Google Scholar] [CrossRef] [PubMed]
  13. Oliveira, C.M.; Mota, M.; Monte-Corvo, L.; Goulão, L.; Silva, D.M. Molecular typing of Pyrus based on RAPD markers. Sci. Hortic. 1999, 79, 163–174. [Google Scholar] [CrossRef]
  14. Monte-Corvo, L.; Cabrita, L.; Oliveira, C.; Leitão, J. Assessment of genetic relationships among Pyrus species and cultivars using AFLP and RAPD markers. Genet. Resour. Crop Evol. 2000, 47, 257–265. [Google Scholar] [CrossRef]
  15. Queiroz, A.; Assunção, A.; Ramadas, I.; Viegas, W.; Veloso, M.M. Molecular characterization of Portuguese pear landraces (Pyrus communis L.) using SSR markers. Sci. Hortic. 2015, 183, 72–76. [Google Scholar] [CrossRef]
  16. Almandanim, M.C.; Baleiras-Couto, M.M.; Pereira, H.S.; Carneiro, L.C.; Fevereiro, P.; Eiras-Dias, J.E.; Morais-Cecílio, L.; Viegas, W.; Veloso, M.M. Genetic diversity of the grapevine (Vitis vinifera L.) cultivars most utilized for wine production in Portugal. Vitis 2007, 46, 116–119. [Google Scholar]
  17. Kalia, R.K.; Rai, M.K.; Kalia, S.; Singh, R.; Dhawan, A.K. Microsatellite markers: An overview of the recent progress in plants. Euphytica 2011, 177, 309–334. [Google Scholar] [CrossRef]
  18. Santos, A.R.F.; Ramos-Cabrer, A.M.; Díaz-Hernandez, M.B.; Pereira-Lorenzo, S. Genetic variability and diversification process in local pear cultivars from northwestern Spain using microsatellites. Tree Genet. Genomes 2011, 7, 1041–1056. [Google Scholar] [CrossRef]
  19. Zhang, Y.; Zhong, C.; Liu, Y.; Zhang, Q.; Sun, X.; Li, D. Agronomic trait variations and ploidy differentiation of kiwiberries in Northwest China: Implication for breeding. Front. Plant Sci. 2017, 8, 711. [Google Scholar] [CrossRef] [PubMed]
  20. Evans, K.M.; Fernández-Fernández, F.; Govan, C. Harmonising fingerprinting protocols to allow comparisons between germplasm collections–Pyrus. In Acta Horticulturae, Proceedings of the XIIthEucarpia Symposium on Fruit Breeding and Genetics, Zaragoza, Spain, 16–20 September 2007; International Society for Horticultural Science: Leuven, Belgium, 2009; Volume 814, pp. 103–106. [Google Scholar] [CrossRef]
  21. Liebhard, R.; Gianfranceschi, L.; Koller, B.; Ryder, C.D.; Tarchini, R.; van de Weg, E.; Gessler, C. Development and characterization of 140 microsatellites in apple (Malus×domestica Borkh.). Mol. Breed. 2002, 10, 217–241. [Google Scholar] [CrossRef]
  22. Peakall, R.; Smouse, P.E. GENALEX 6: Genetic analysis in Excel. Population genetic software for teaching and research. Mol. Ecol. Notes 2006, 6, 288–295. [Google Scholar] [CrossRef]
  23. Nei, M.; Li, W.H. Mathematical model for studying genetic variation in terms of restriction endonucleases. Proc. Natl. Acad. Sci. USA 1979, 76, 5269–5273. [Google Scholar] [CrossRef] [PubMed]
  24. Perrier, X.; Jacquemoud-Collet, J.P.D. DARwin Software. 2006. Available online: http://darwin.cirad.fr/ (accessed on 20 June 2016).
  25. Pritchard, J.K.; Stephens, M.; Donnelly, P. Inference of population structure using multilocus genotype data. Genetics 2000, 155, 945–959. [Google Scholar] [PubMed]
  26. Evanno, G.; Regnaut, S.; Goudet, J. Detecting the number of clusters of individuals using the software STRUCTURE: A simulation study. Mol. Ecol. 2005, 14, 2611–2620. [Google Scholar] [CrossRef] [PubMed]
  27. Sehic, J.; Garkava-Gustavsson, L.; Fernández-Fernández, F.; Nyboma, H. Genetic diversity in a collection of European pear (Pyrus communis) cultivars determined with SSR markers chosen by ECPGR. Sci. Hortic. 2012, 145, 39–45. [Google Scholar] [CrossRef]
  28. Bassil, N.; Hummer, K.E.; Postman, J.D.; Fazio, G.; Baldo, A.; Armas, I.; Williams, R. Nomenclature and genetic relationships of apples and pears from Terceira Island. Genet. Resour. Crop Evol. 2009, 56, 339–352. [Google Scholar] [CrossRef]
  29. Miranda, C.; Urrestarazu, J.; Santesteban, L.G.; Royo, J.B.; Urbina, V. Genetic diversity and structure in a collection of ancient Spanish pear cultivars assessed by microsatellite markers. J. Am. Soc. Hortic. Sci. 2010, 135, 428–437. [Google Scholar] [CrossRef]
  30. Bennici, S.; Las Casas, G.; Distefano, G.; Di Guardo, M.; Continella, A.; Ferlito, F.; Gentile, A.; La Malfa, S. Elucidating the contribution of wild related species on autochthonous pear germplasm: A case study from Mount Etna. PLoS ONE 2018, 13, e0198512. [Google Scholar] [CrossRef] [PubMed]
  31. Claessen, H.; Keulemans, W.; Poel, B.V.; Storme, M. Finding a compatible partner: Self-incompatibility in European pear (Pyrus communis); molecular control, genetic determination, and impact on fertilization and fruit set. Front. Plant Sci. 2019, 10, 407. [Google Scholar] [CrossRef] [PubMed]
  32. Ghosh, A.K.; Hunter, D.M.; Lukens, L.; Strommer, J.N. European and Asian Pears: Simple Sequence Repeat-Polyacrylamide Gel Electrophoresis-base analysis of commercially important North-American cultivars. Hortscience 2006, 41, 304–309. [Google Scholar] [CrossRef]
  33. Hokanson, S.C.; Lamboy, W.F.; Szewc-McFadden, A.K.; McFerson, J.R. Microsatellite (SSR) variation in a collection of Malus (apple) species and hybrids. Euphytica 2001, 118, 281–294. [Google Scholar] [CrossRef]
  34. Godinho, C.; Lampreia, F. Caracterização de Variedades Regionais Portuguesas, 1st ed.; Direcção-Geral de Protecção das Culturas: Lisboa, Portugal, 2006; pp. IV1–IV89.
  35. Pelsy, F. Molecular and cellular mechanisms of diversity within grapevine varieties. Heredity 2010, 104, 331–340. [Google Scholar] [CrossRef] [PubMed]
  36. Meneghetti, S.; Bavaresco, L.; Calò, A.; Costacurta, A. Inter- and intra-varietal genetic variability in Vitis vinifera L. In The Mediterranean Genetic Code–Grapevine and Olive; IntechOpen Publishers: Rijeka, Croatia, 2013; pp. 73–95. [Google Scholar] [CrossRef]
  37. Meneghetti, S.; Poljuha, D.; Frare, E.; Costacurta, A.; Morreale, G.; Bavaresco, L.; Calò, A. Inter- and Intra-varietal genetic variability in Malvasia cultivars. Mol. Biotechnol. 2012, 50, 189–199. [Google Scholar] [CrossRef] [PubMed]
  38. Gonçalves, E.; Carrasquinho, I.; St. Aubyn, A.; Martins, A. Broad-sense heritability in mixed models for grapevine initial selection trials. Euphytica 2013, 189, 379–391. [Google Scholar] [CrossRef]
  39. Breton, C.; Pinatel, C.; Médail, F.; Bonhomme, F.; Bervillé, A. Comparison between classical and Bayesian methods to investigate the history of olive cultivars using SSR-polymorphisms. Plant Sci. 2008, 175, 524–532. [Google Scholar] [CrossRef]
  40. Belaj, A.; Rallo, L.; Trujillo, I.; Baldoni, L. Using RAPD and AFLP markers to distinguish individuals obtained by clonal selection of “Arbequina” and “Manzanilla de Sevilla” olive. Hortscience 2004, 39, 1566–1570. [Google Scholar] [CrossRef]
  41. Sarri, V.; Baldoni, L.; Porceddu, A.; Cultrera, N.G.M.; Contento, A.; Frediani, M.; Belaj, A.; Trujillo, I.; Cionini, P.G. Microsatellite markers are powerful tools for discriminating among olive cultivars and assigning them to geographically defined populations. Genome 2006, 49, 1606–1615. [Google Scholar] [CrossRef] [PubMed] [Green Version]
  42. Ferradini, N.; Lancioni, H.; Torricelli, R.; Russi, L.; Dalla Ragione, I.; Cardinali, I.; Marconi, G.; Gramaccia, M.; Concezzi, L.; Achill, I.A.; et al. Characterization and phylogenetic analysis of ancient Italian landraces of pear. Front. Plant Sci. 2017, 8, 751. [Google Scholar] [CrossRef] [PubMed]
  43. Dickson, E.E.; Arumuganathan, K.; Krosovich, S.; Doyle, J.J. Nuclear DNA content variation within the Rosaceae. Am. J. Bot. 1992, 79, 1081–1086. [Google Scholar] [CrossRef]
Figure 1. Neighbor joining dendrogram of P. communis genotypes identified by the eleven SSR markers used. (A)—Including triploid: “Baguim” (V39), “PérolaAmarela 1” (V66), “PeraCabaça” (V26), “CoradaParda” (V07), “Marquesinha” (S18); (B)—Not including the triploids but the bootstrap values (%) out of 1000 replications are indicated at the branches.
Sustainability 11 05340 g001
Figure 2. Principal co-ordinate analysis (PCoA) based on genetic distances showing two clustered populations. The groups are depicted using the color codes: Green—“Rocha” clones; Red—All the other pear landraces.
Sustainability 11 05340 g002
Figure 3. Graphical display of the results of the STRUCTURE analysis, inferred at K = 2 (A) and K = 9 (B). Each accession is represented by a vertical line segmented into a number of colors identical to the K number. The groups inferred at K = 2 are depicted in green (“Rocha” clones) and in red (all the other pear local cultivars). At K = 9 “Rocha” clones are depicted in red.
Sustainability 11 05340 g003
Table 1. Pyrus communis accessions characterized in the present study.
ReferenceLocal DesignationField Collection
A1ÁguaouAguinhaINIAV-Alcobaça
A2AmendoaINIAV-Alcobaça
V21AmendoaQuinta da Sobreira, Vidago
V04Amendoa IIQuinta da Sobreira, Vidago
V12Amendoa IQuinta da Sobreira, Vidago
S15AmorimQuinta de Sergude, Felgueiras
V48Amorim BrancoQuinta da Sobreira, Vidago
V39BaguimQuinta da Sobreira, Vidago
S05Bela de JunhoQuinta de Sergude, Felgueiras
S11Bela Feia 1Quinta de Sergude, Felgueiras
V57Bela Feia 2Quinta da Sobreira, Vidago
S07BojardaQuinta de Sergude, Felgueiras
V79CabacinhaPrecoceQuinta da Sobreira, Vidago
A3CabeçaPequenaINIAV-Alcobaça
V115CarapinheiraQuinta da Sobreira, Vidago
S12CarapinheiraBrancaQuinta de Sergude, Felgueiras
A4CarvalhalINIAV-Alcobaça
V07CoradaPardaQuinta da Sobreira, Vidago
V41CoradinhaQuinta da Sobreira, Vidago
S14Coxa de FreiraQuinta de Sergude, Felgueiras
A7CristoINIAV-Alcobaça
V19D. JoaquinaQuinta da Sobreira, Vidago
V80Fim de SéculoQuinta da Sobreira, Vidago
V28FormigaQuinta da Sobreira, Vidago
V97LambeosDedosQuinta da Sobreira, Vidago
A8MarcelinaINIAV-Alcobaça
A9MarmelaINIAV-Alcobaça
V13Marmela 1Quinta da Sobreira, Vidago
V89Marmela 2Quinta da Sobreira, Vidago
S18MarquesinhaQuinta de Sergude, Felgueiras
V14NacionalQuinta da Sobreira, Vidago
A10Pera BonitaINIAV-Alcobaça
V26PeraCabaçaQuinta da Sobreira, Vidago
V06Pera de InvernoQuinta da Sobreira, Vidago
A11PeraMelãoINIAV-Alcobaça
A12PerolaINIAV-Alcobaça
V16PerolaAmarelaQuinta da Sobreira, Vidago
V66PerolaAmarela 1Quinta da Sobreira, Vidago
V75PerolaAmarela 2Quinta da Sobreira, Vidago
V63PerolaBrancaQuinta da Sobreira, Vidago
V10PigarçaQuinta da Sobreira, Vidago
V95RabiçaQuinta da Sobreira, Vidago
V22RaboTortoQuinta da Sobreira, Vidago
V102Rosa de SoureQuinta da Sobreira, Vidago
V72RugosaQuinta da Sobreira, Vidago
A14S. BartolomeuINIAV-Alcobaça
V43S. Bento de ChavesQuinta da Sobreira, Vidago
A15S. CrispimINIAV-Alcobaça
V82S. João de SilgueirosQuinta da Sobreira, Vidago
V11Tipo CabaçaQuinta da Sobreira, Vidago
AFAbbé FételQuinta da Sobreira, Vidago
S19ConferenceQuinta de Sergude, Felgueiras
Rocha1—Rocha8 Pera RochaINIAV-Alcobaça
Rocha9—Rocha79Pera RochaQuinta de S. João, Caldas da Rainha
Table 2. Genetic diversity of 132 P. communis accessions as assessed using eleven SSRs loci. Na—number of alleles; Ne—effective number of alleles; Ho—observed heterozygosity; He—expected heterozygosity; PIC—polymorphism information content.
LocusNaNeHoHePIC
CH01d0884.1140.7660.7570.657
CH01f07a136.7860.8940.8530.654
CH05c06113.0340.7870.6700.301
CH03g07138.8010.8940.8860.714
EMPc11117.4250.8720.8650.553
EMPc117144.4360.7020.7750.582
CH01d09168.1660.9790.8780.728
CH02b10117.0580.9150.8580.744
GD9684.5661.0000.7810.642
CH03d12137.4770.8480.8660.537
CH04e03111.8460.4570.4580.337
Average11.725.790.830.790.59
Table 3. Synonymies identified by SSR genotyping.
Synonymies (Name and Ref.)
“Amendoa I” (V12) = “RaboTorto” (V22)
“Amorim” (S15) = “Amorim Branco” (V48)
“Carapinheira” (V115) = “CarapinheiraBranca” (S12)
Table 4. Homonymies identified by SSR genotyping.
Homonymies (Name and Ref.)
“Amendoa” (A2); “Amendoa” (V21); “Amendoa II” (V04)
“Bela Feia 1” (S11); “Bela Feia 2” (V57)
“Marmela” (A9); “Marmela 1” (V13); “Marmela 2” (V89)
“PerolaAmarela” (V16); “PerolaAmarela1”(V66); “PerolaAmarela 2” (V75)
Table 5. Percentage of variation explained by the first three axes as a result of a principal co-ordinate analysis (PCoA).
Axes123
%33.517.345.09
Cum %33.5140.8545.94

