1. Introduction
The study of the development and change of urban areas has a long history and is gaining more importance due to the acceleration of urbanization in the 20th century [
1,
2,
3,
4]. The way that cities are built and designed influences our societal lifestyles and resource consumption [
5,
6,
7]. Moreover, the consumption-driven exploitation of arable land is leading to sometimes even higher biodiversity in diverse urban areas than in agriculturally dominated landscapes [
8]. The relatively new research fields of urban ecology and urban ecosystems deal with ecological elements in human-dominated habitats, and specifically, with the benefits from ecosystems to humans in cities [
9,
10]. In terms of surface texture, urban areas are the most complex and heterogeneous landscapes on earth—a mosaic and patchy composite of artificial and natural surface under dynamic change [
11,
12,
13]. For the benefits of humans, e.g., recreation or local climate regulation, very small ecological patches can be important [
12]. Therefore, a detailed analysis of heterogeneous urban areas is only possible with information of high spatial resolution [
4]. This analysis is necessary to identify unsustainable urbanization processes, e.g., of environmental degradation, and to guide the sustainable development of urban areas.
Remote sensing imagery is commonly used to identify and classify urban areas [
7,
14,
15]. In order to distinguish them from other surrounding areas, a spatial resolution of 30 m is often enough. A spatial resolution of 10–20 m allows distinction between residential and industrial areas (intra-urban analysis) [
11]. Typical rectangular urban objects, such as buildings, can be detected at a spatial resolution of 2–3 m. Elementary linear objects (e.g., roads or smaller rivers) require a spatial resolution of at least 2 m. Trees or other individual objects are detectable at a resolution between 0.7 m and 1 m. Above these resolutions, these objects are no longer identifiable because they belong to a heterogeneous area due to the increased number of pixels. As a result, individual objects are integrated into their environment [
11].
Most land use/land cover (LULC) classifications use satellite images from the NASA/USGS Landsat missions with a spatial resolution of 30 m (15 m for the panchromatic band) or from the European Space Agency Sentinel missions with up to 10 m (5 m for Synthetic Aperture Radar data) spatial resolution. These resolutions allow good results when distinguishing between residential and industrial areas (intra-urban analysis), but they are not sufficient for an inner-urban analysis of building structures, trees, and heterogeneous green spaces [
16]. Higher spatial resolutions are needed, especially in developing countries, where urban structures and construction patterns are usually of smaller scales and higher in complexity than in developed countries [
11]. Moreover, (informal) urbanization and LULC dynamics are extraordinarily high in developing countries and the deterioration of urban ecosystems, e.g., rivers and their riparian areas, is rapidly advancing [
17,
18,
19,
20]. A detailed analysis and assessment of these dynamics would be very helpful to better understand the problem and to develop local solutions for a more sustainable urban development. However, so-called very high spatial resolution (VHSR) images (1 to 5 m) [
21,
22] are usually not free of cost, representing popular commercial products. An alternative is the use of freely available, VHSR true-color satellite imagery provided by Google Earth Pro. The cost-free use of the Google Earth software has led, among others, to the discovery of archeological sites and the impact craters of meteoroids [
23,
24,
25,
26]. However, the use of true color images provided by Google Earth for detailed urban LULC classification has not been documented so far. A Web of Science Core Collection search (17 September 2019) using the search string ALL FIELDS: (“Google Earth” AND “LULC” AND “Urban”) resulted in a total of 10 results. Another search using the search sting ALL FIELDS: (“Google Earth” AND “land use” AND “classification” AND “Urban”) resulted in a total of 26 results. From this total of 36 scientifically index publications, only one publication uses Google Earth imagery for LULC classification, but for a national scale (Maldives) and not specifically for urban areas. So far, the use of Google Earth imagery in published scientific research has been limited to checking land use classification results based on other image sources with coarser spatial resolution (historically Landsat imagery, but more recently Sentinel imagery as well). For many urban areas, worldwide images of spatial resolution below 1 m are provided by Google Earth free of cost for non-commercial uses. These images are exportable as GeoTIFF raster images for further processing in a geographic information system (GIS). As true-color images, they contain the RGB full-color values per raster cell.
Contrary to other freely available satellite imagery products, the images provided by Google Earth do not contain layers of different wavelengths of the same image, thus no multi-spectral resolution. Therefore, the possibilities of image analysis are limited to raster cell values of RGB color alone. We are aware that this is a significant limitation to image classification, as different land cover may have very similar colors, and now non-visible bands, such as infrared or near-infrared can be used to distinguish, e.g., between green vegetation and green roofs. However, we believe that the advantage of a very high spatial resolution of images provided by Google Earth Pro can compensate for this disadvantage compared to other freely available and commonly used imagery (e.g., from the Sentinel or Landsat missions). To reveal and discuss the possible advantages and disadvantages for LULC classification was exactly the objective of this study. For that reason, the quality and occurrence of misclassification was specifically addressed and a newly developed post-processing procedure was tested to deal with the disadvantage of having no multispectral resolution of the images.
Therefore, a methodology to use Google Earth images for high spatial resolution urban LULC classification for data scare regions is presented. Furthermore, a classification correction procedure (post-processing) is introduced in order to reduce classification errors from clouds, shadows, or temporal features. Finally, the classification accuracy before and after applying the newly developed correction procedure is assessed and compared.
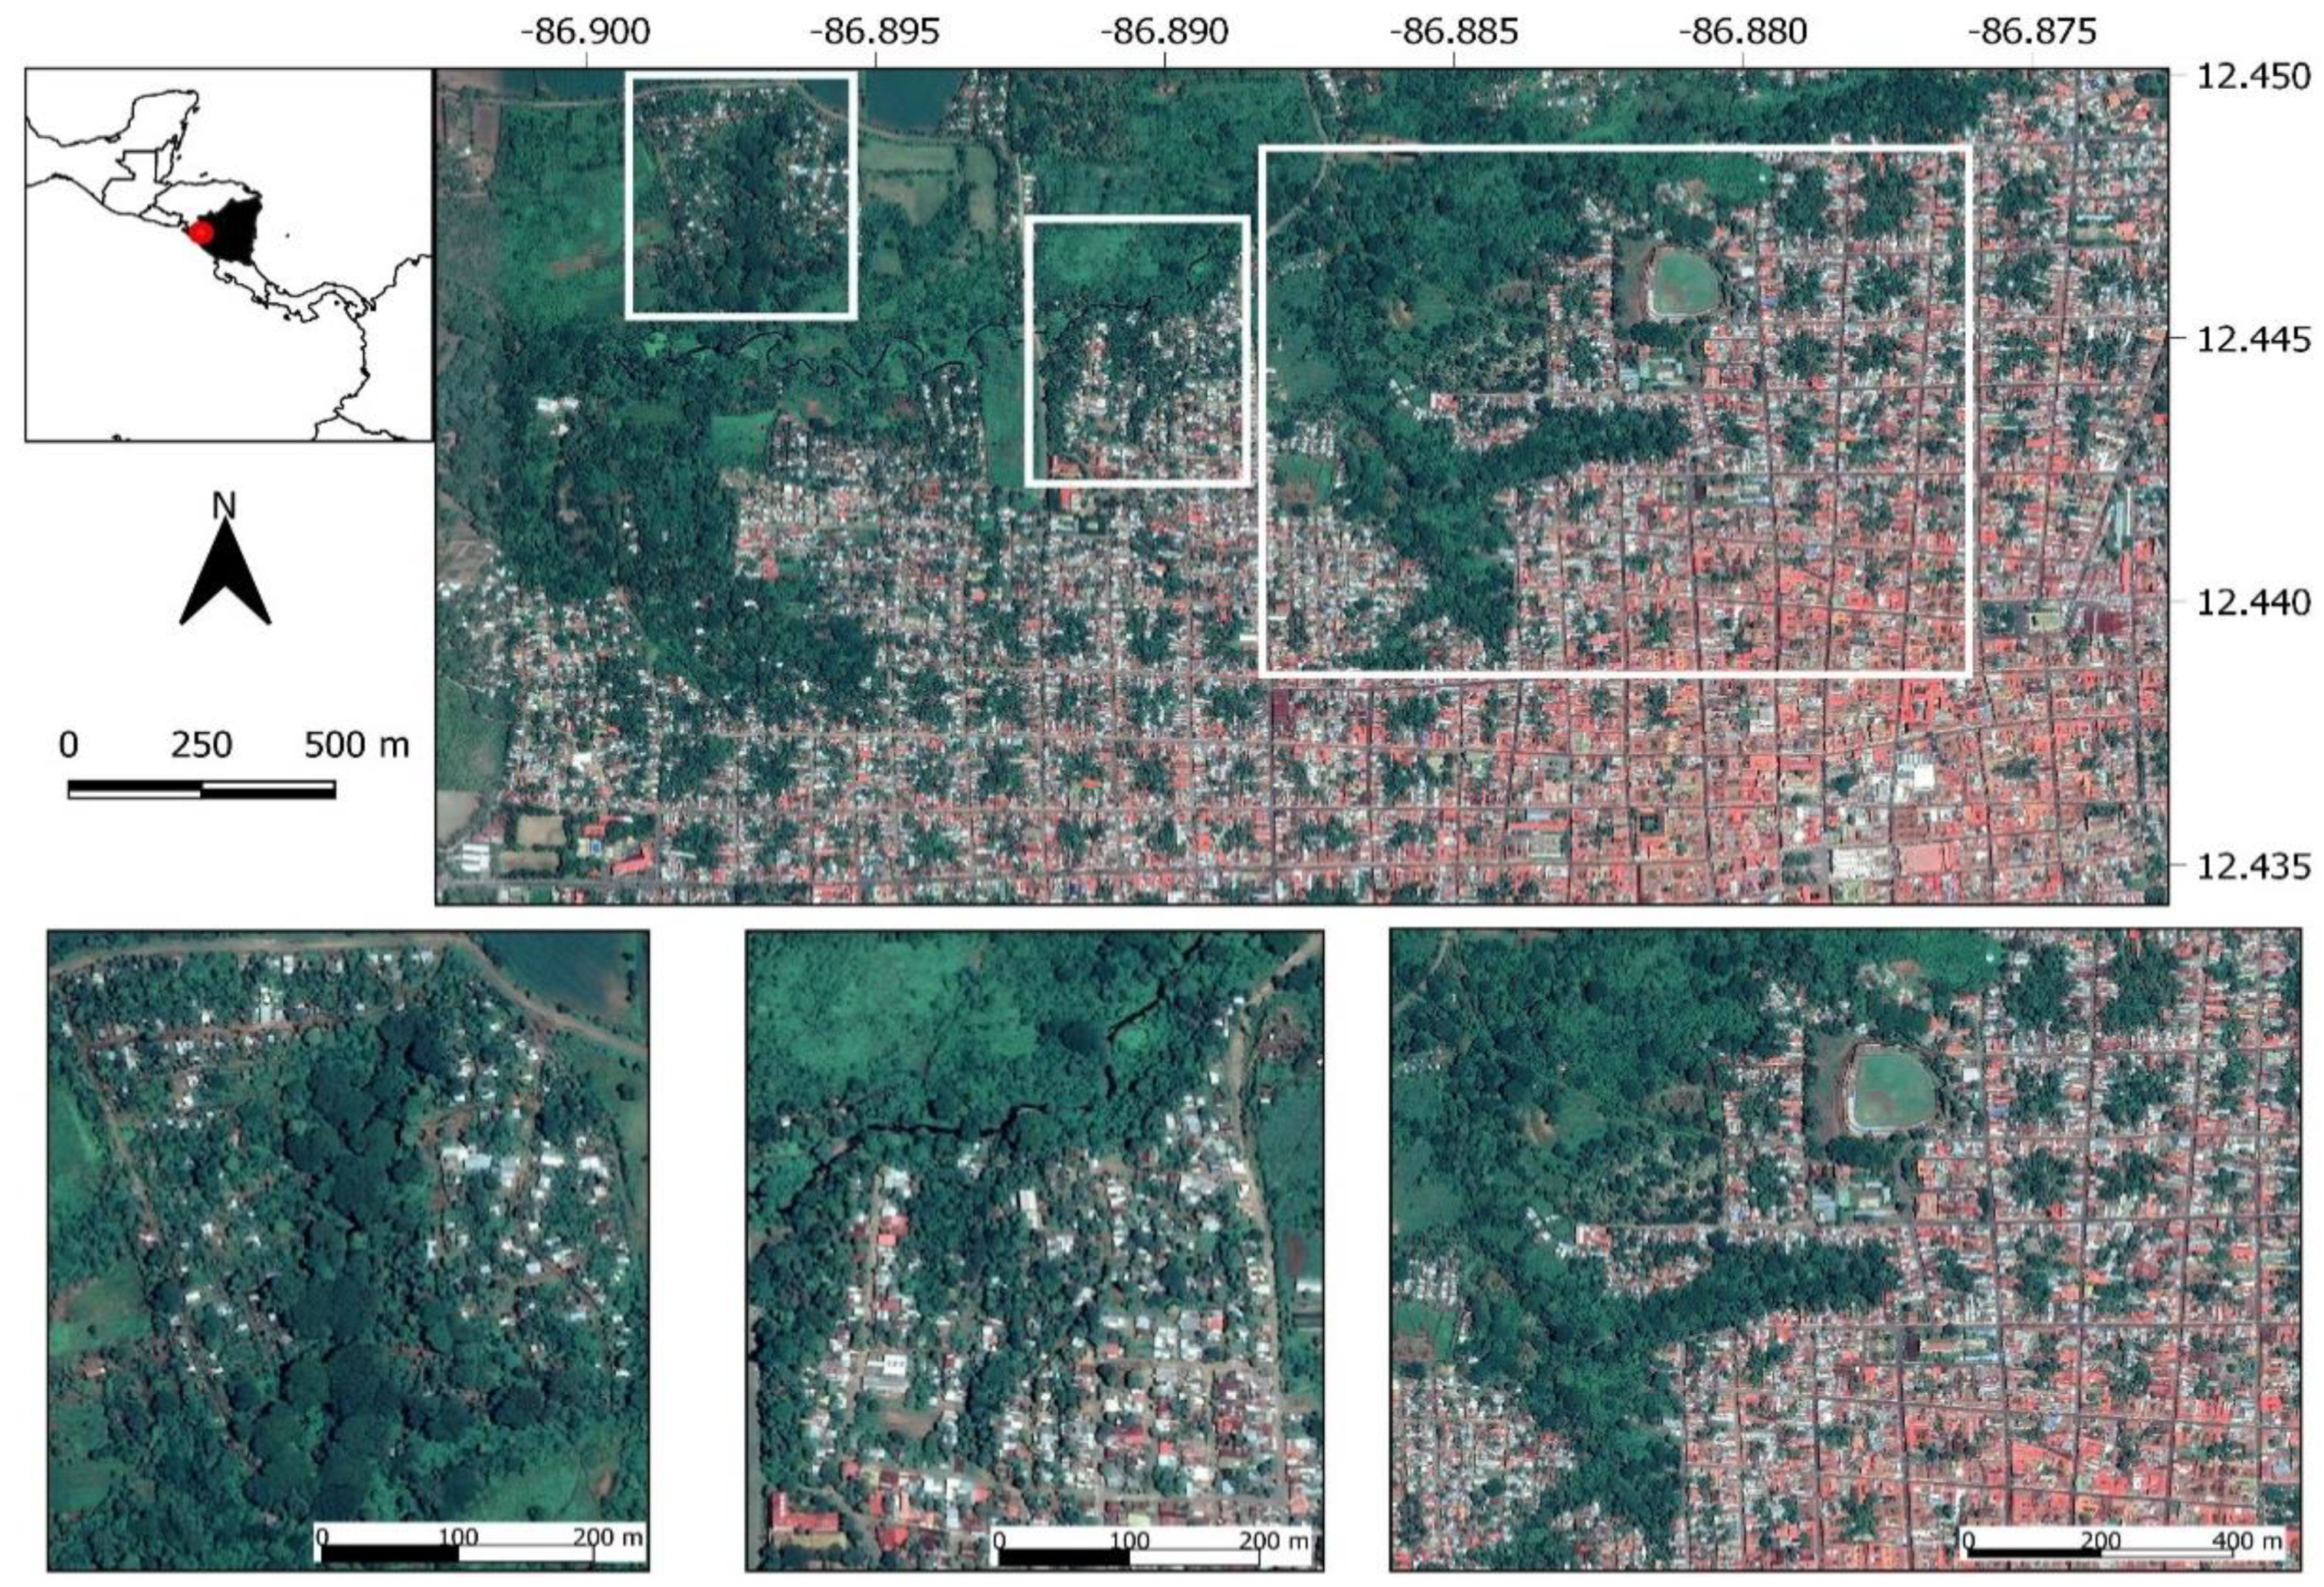
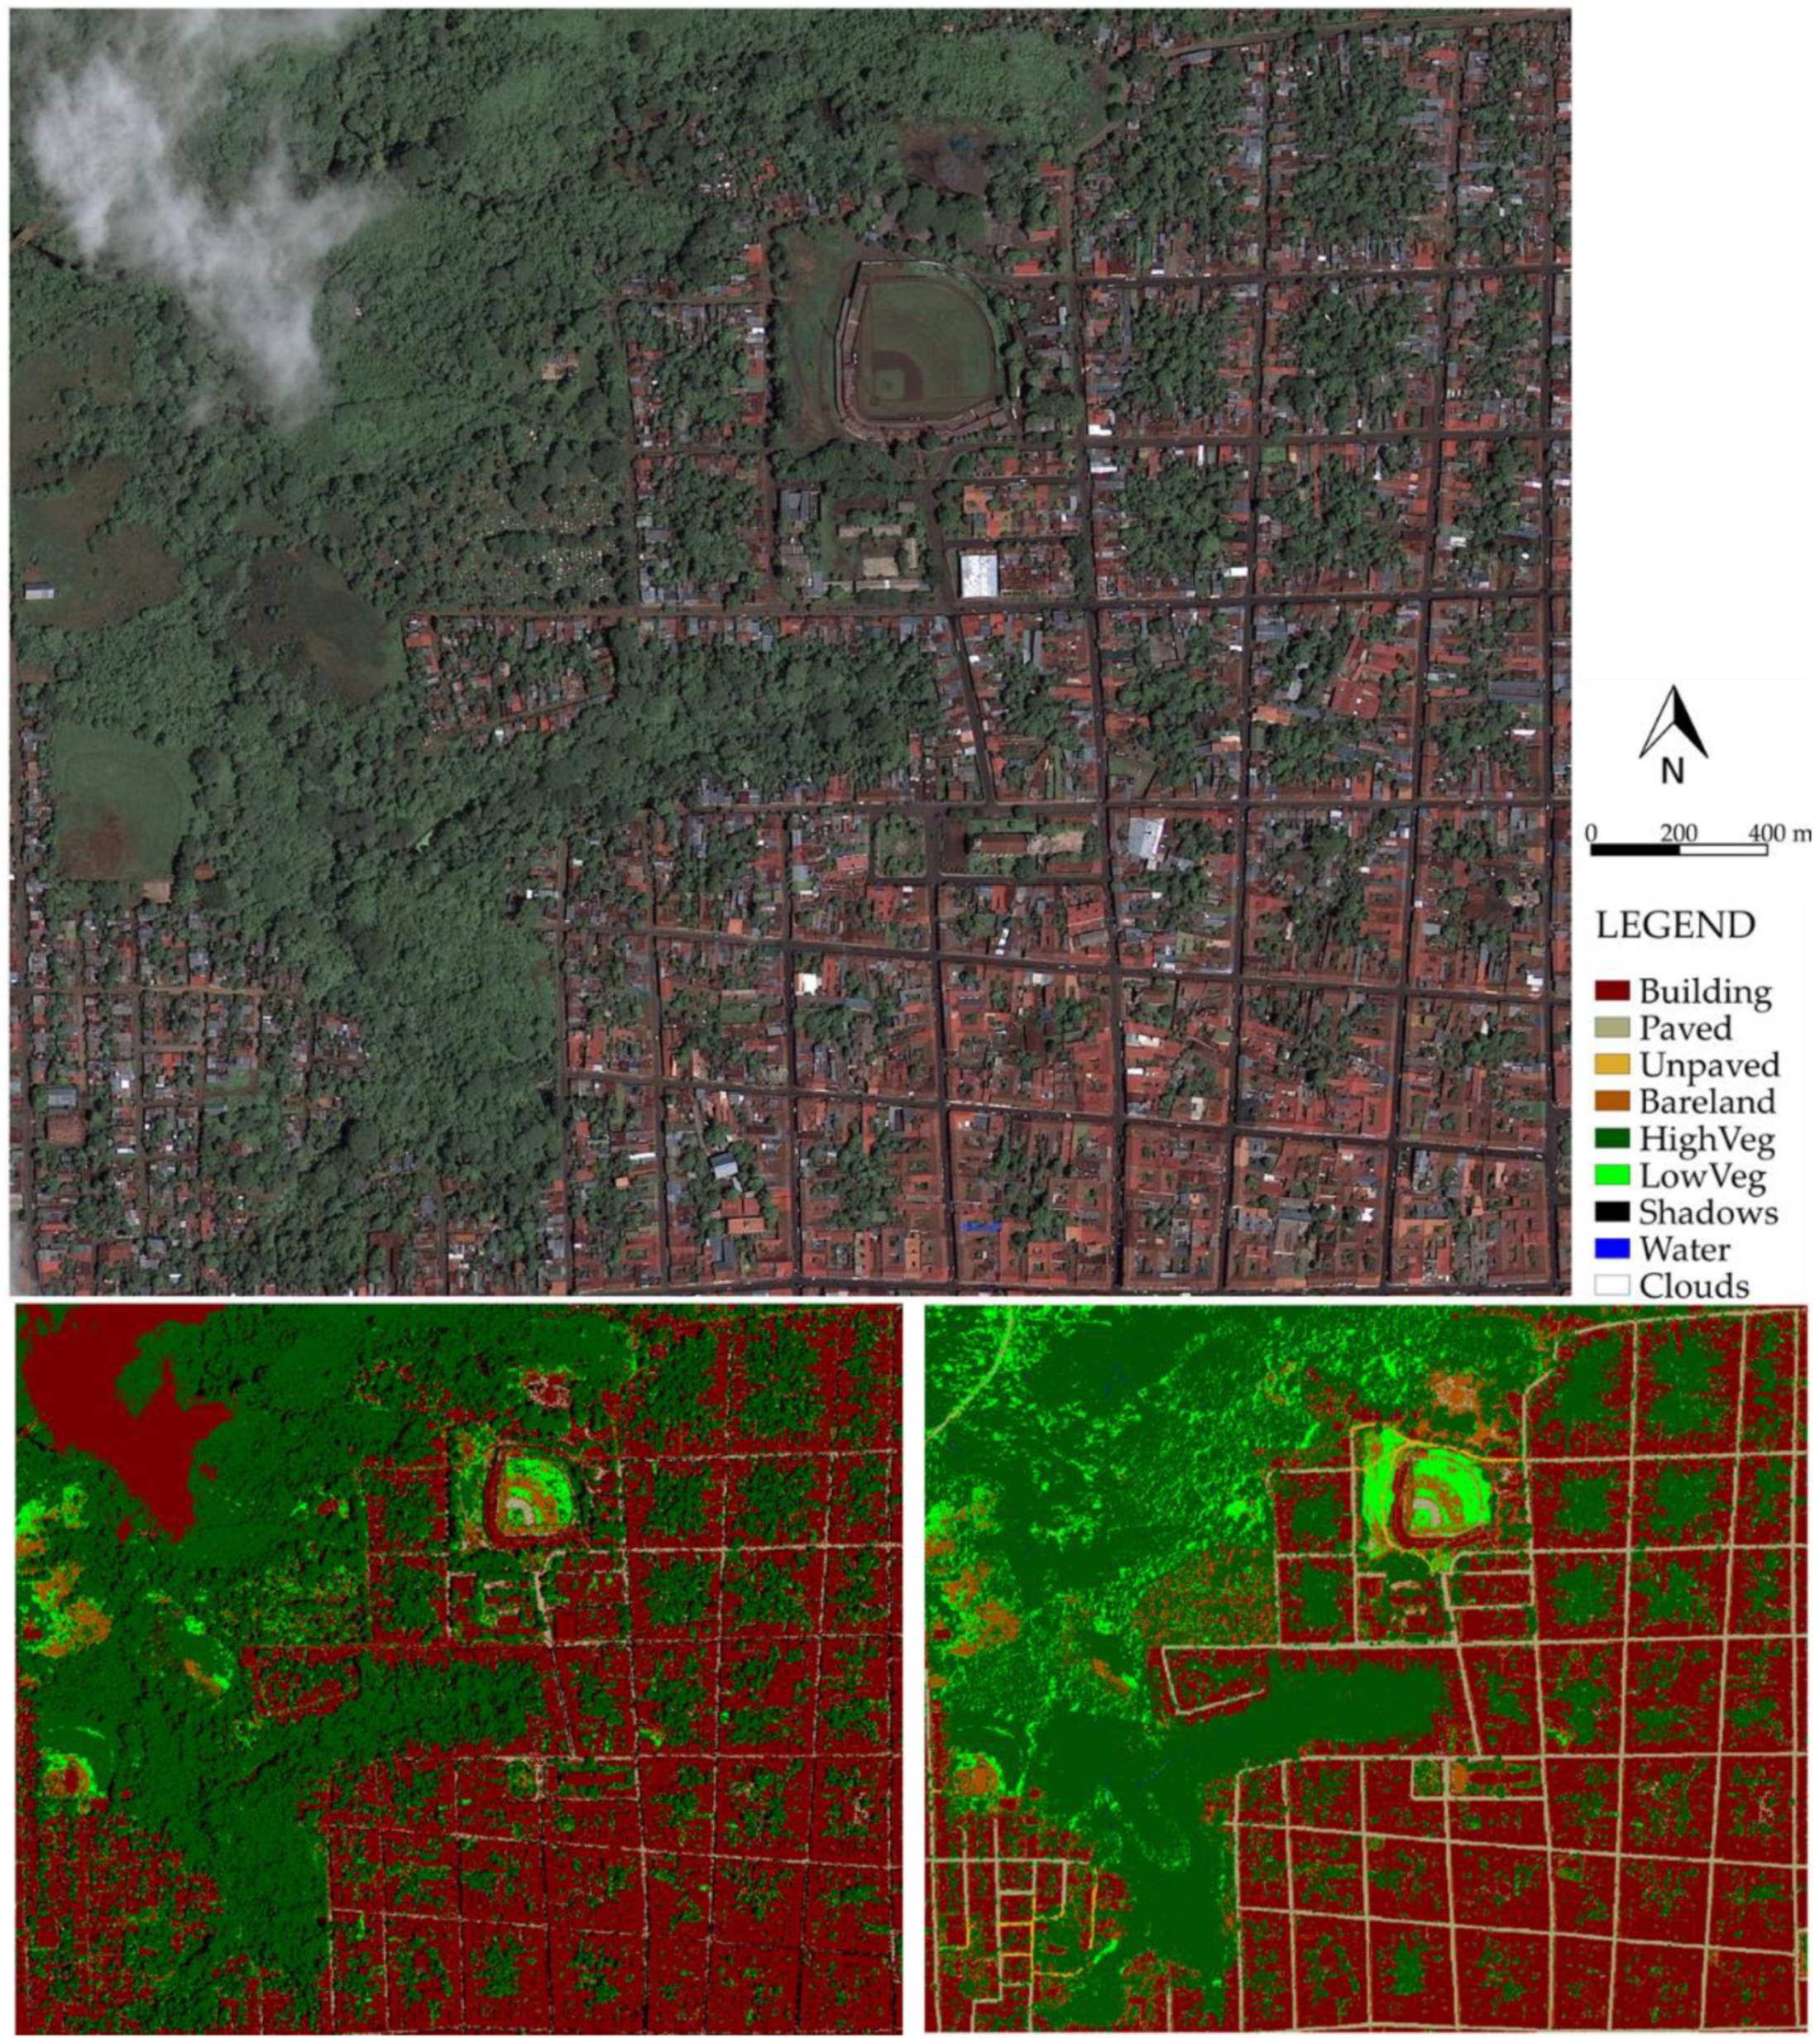
The classification was carried out for three neighborhoods of the city of León in Nicaragua in order to assess an ongoing urbanization and environmental degradation process. Each neighborhood has unique land cover and urbanization characteristics representing: (images at the bottom of
Figure 1, from right to left) (1) a historically grown part of the city, (2) a neighborhood in the transition from urban to rural status, and (3) a developing sub-urban settlement. These classification areas differ in degree of urbanization (building density, i.e., percentage of sealed surface by streets and houses), vegetation cover (diversity and arrangement of green spaces), and proximity to urban rivers. A specific subject of assessment was the accuracy of the classification of those different land use mosaics in order to prove the applicability of the presented method to analyze the spatial and temporal dynamics of environmental degradation and urbanization processes in detail. The resulting LULC classification imagery can be a valuable input to determine urbanization processes, for assessments of ecological status and to estimate the ecological potential of urban areas and urban rivers [
27]. Additionally, the high level of spatial details acquired may serve as a basis for the development of nature-based solutions and the design of green infrastructure at the neighborhood level. Because the data and software used are freely available without cost, the proposed methodology is especially relevant for local governments with limited financial resources.
3. Results and Discussion
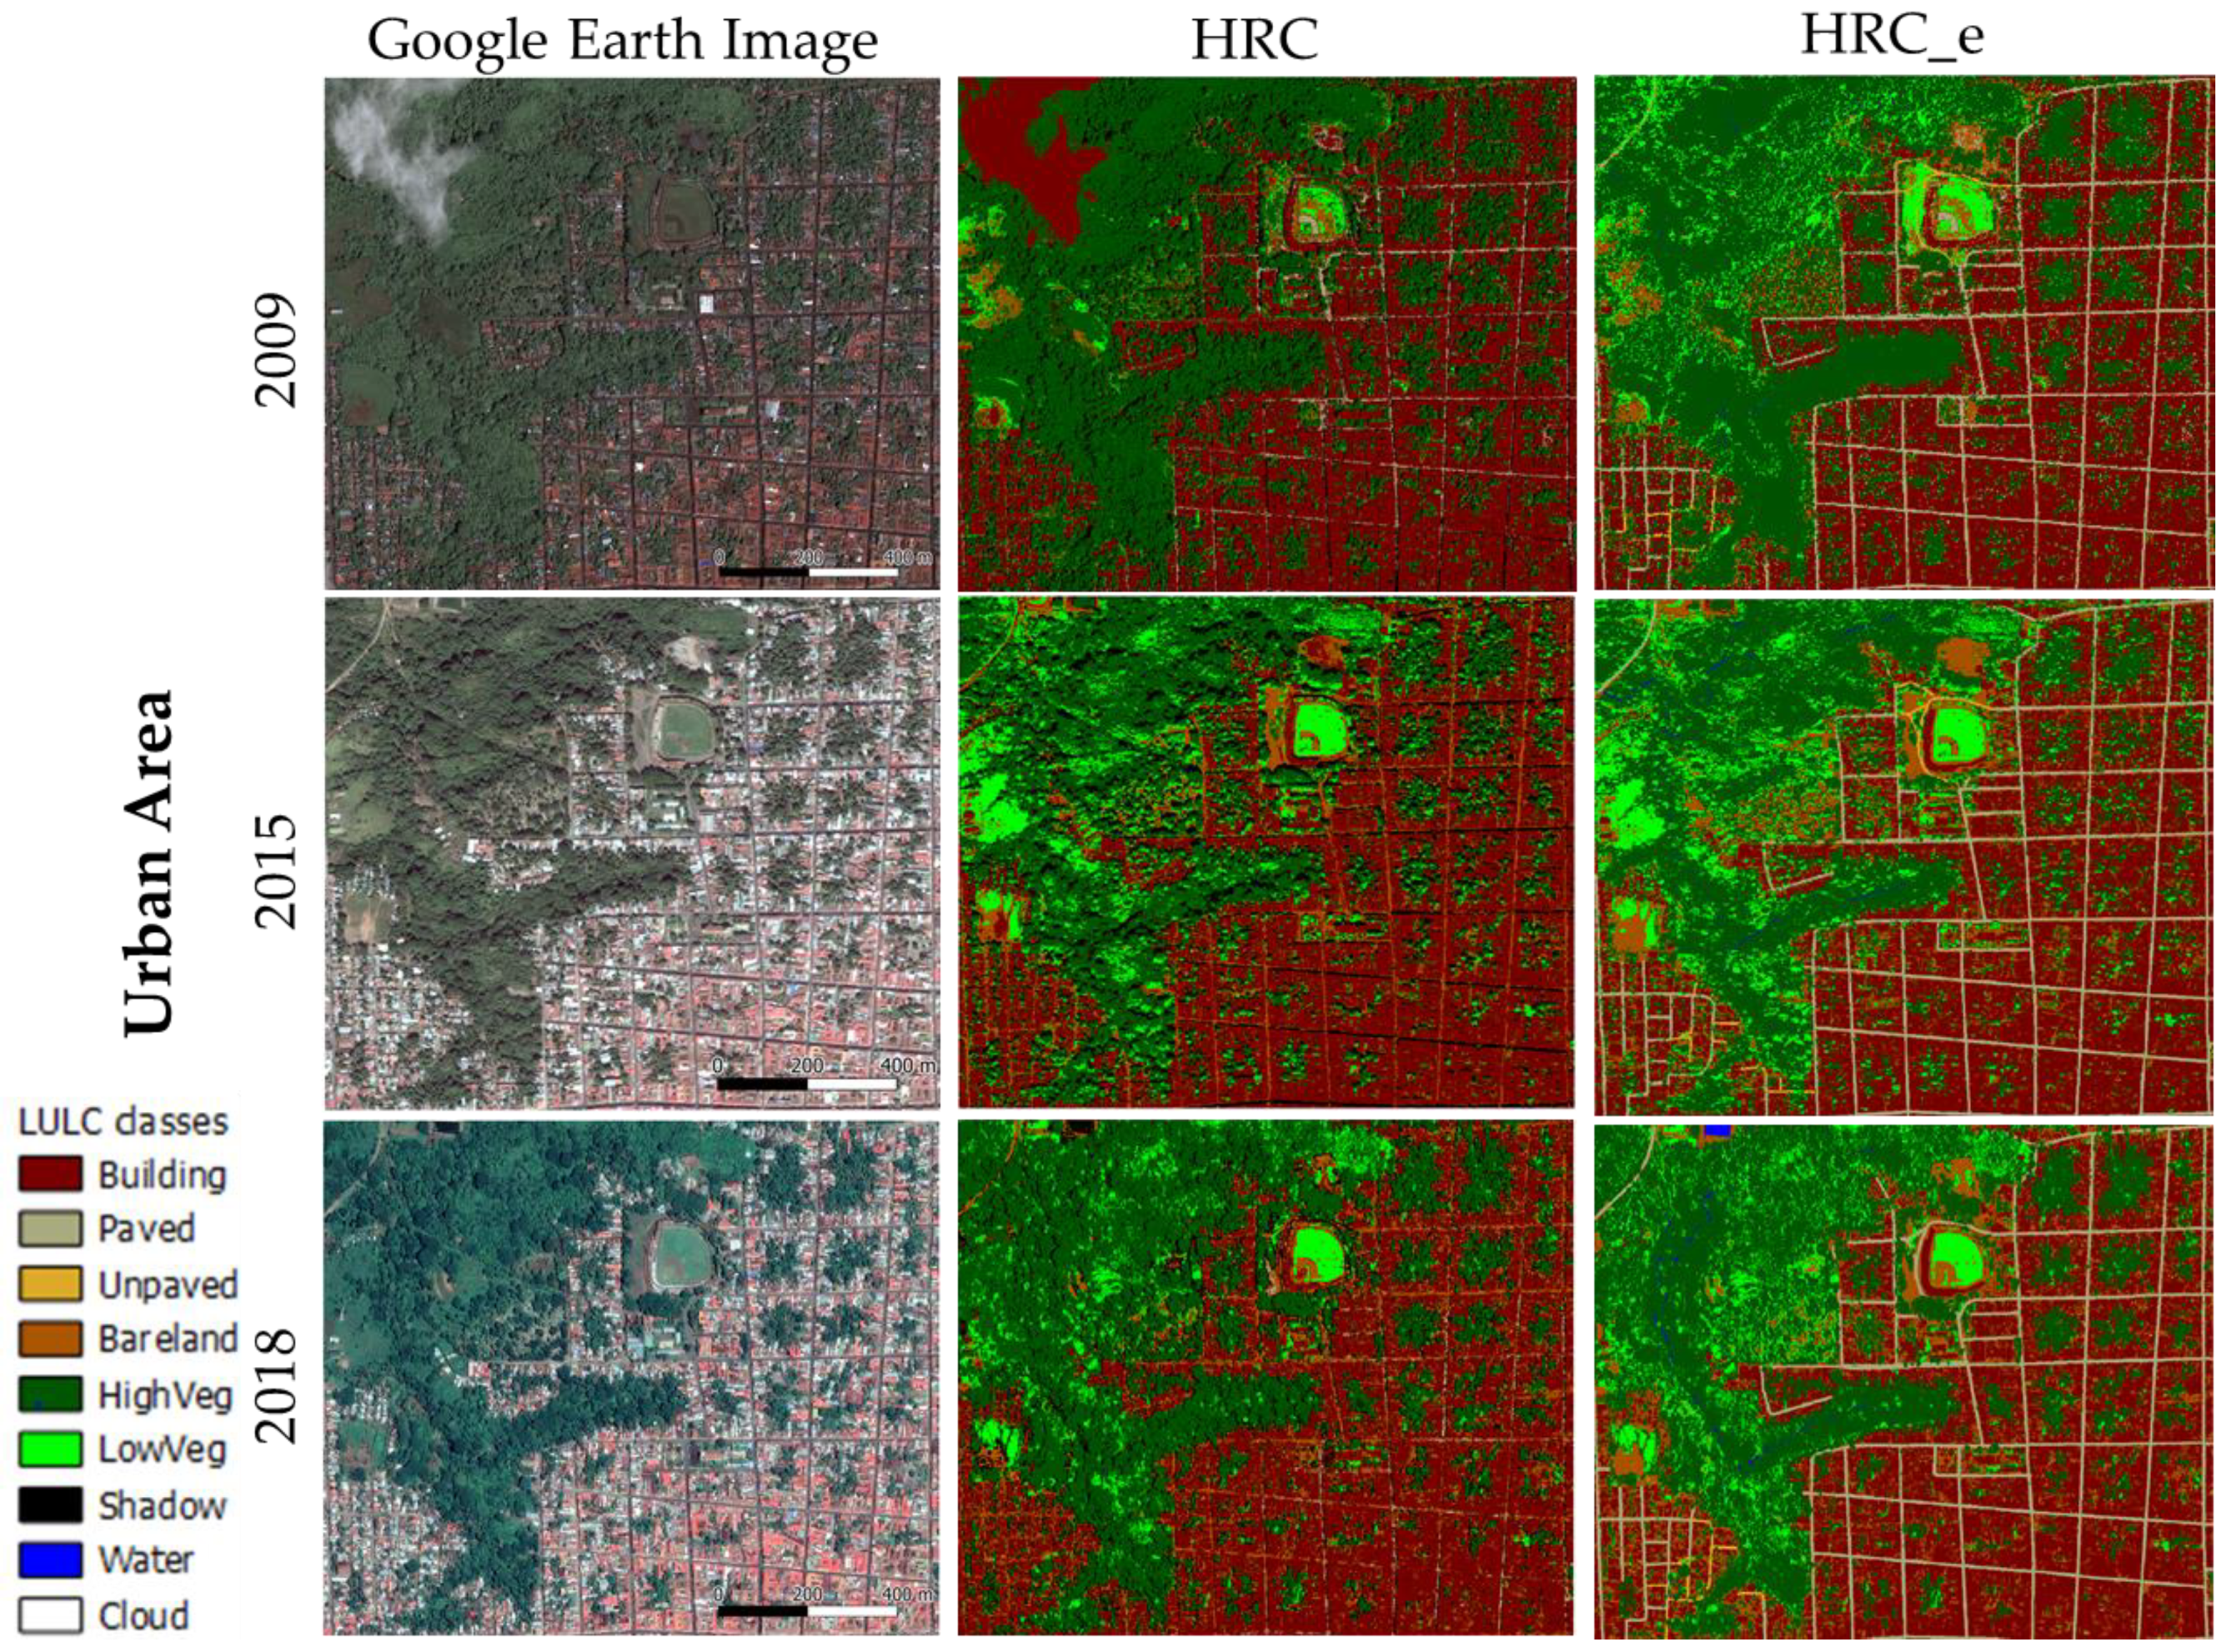
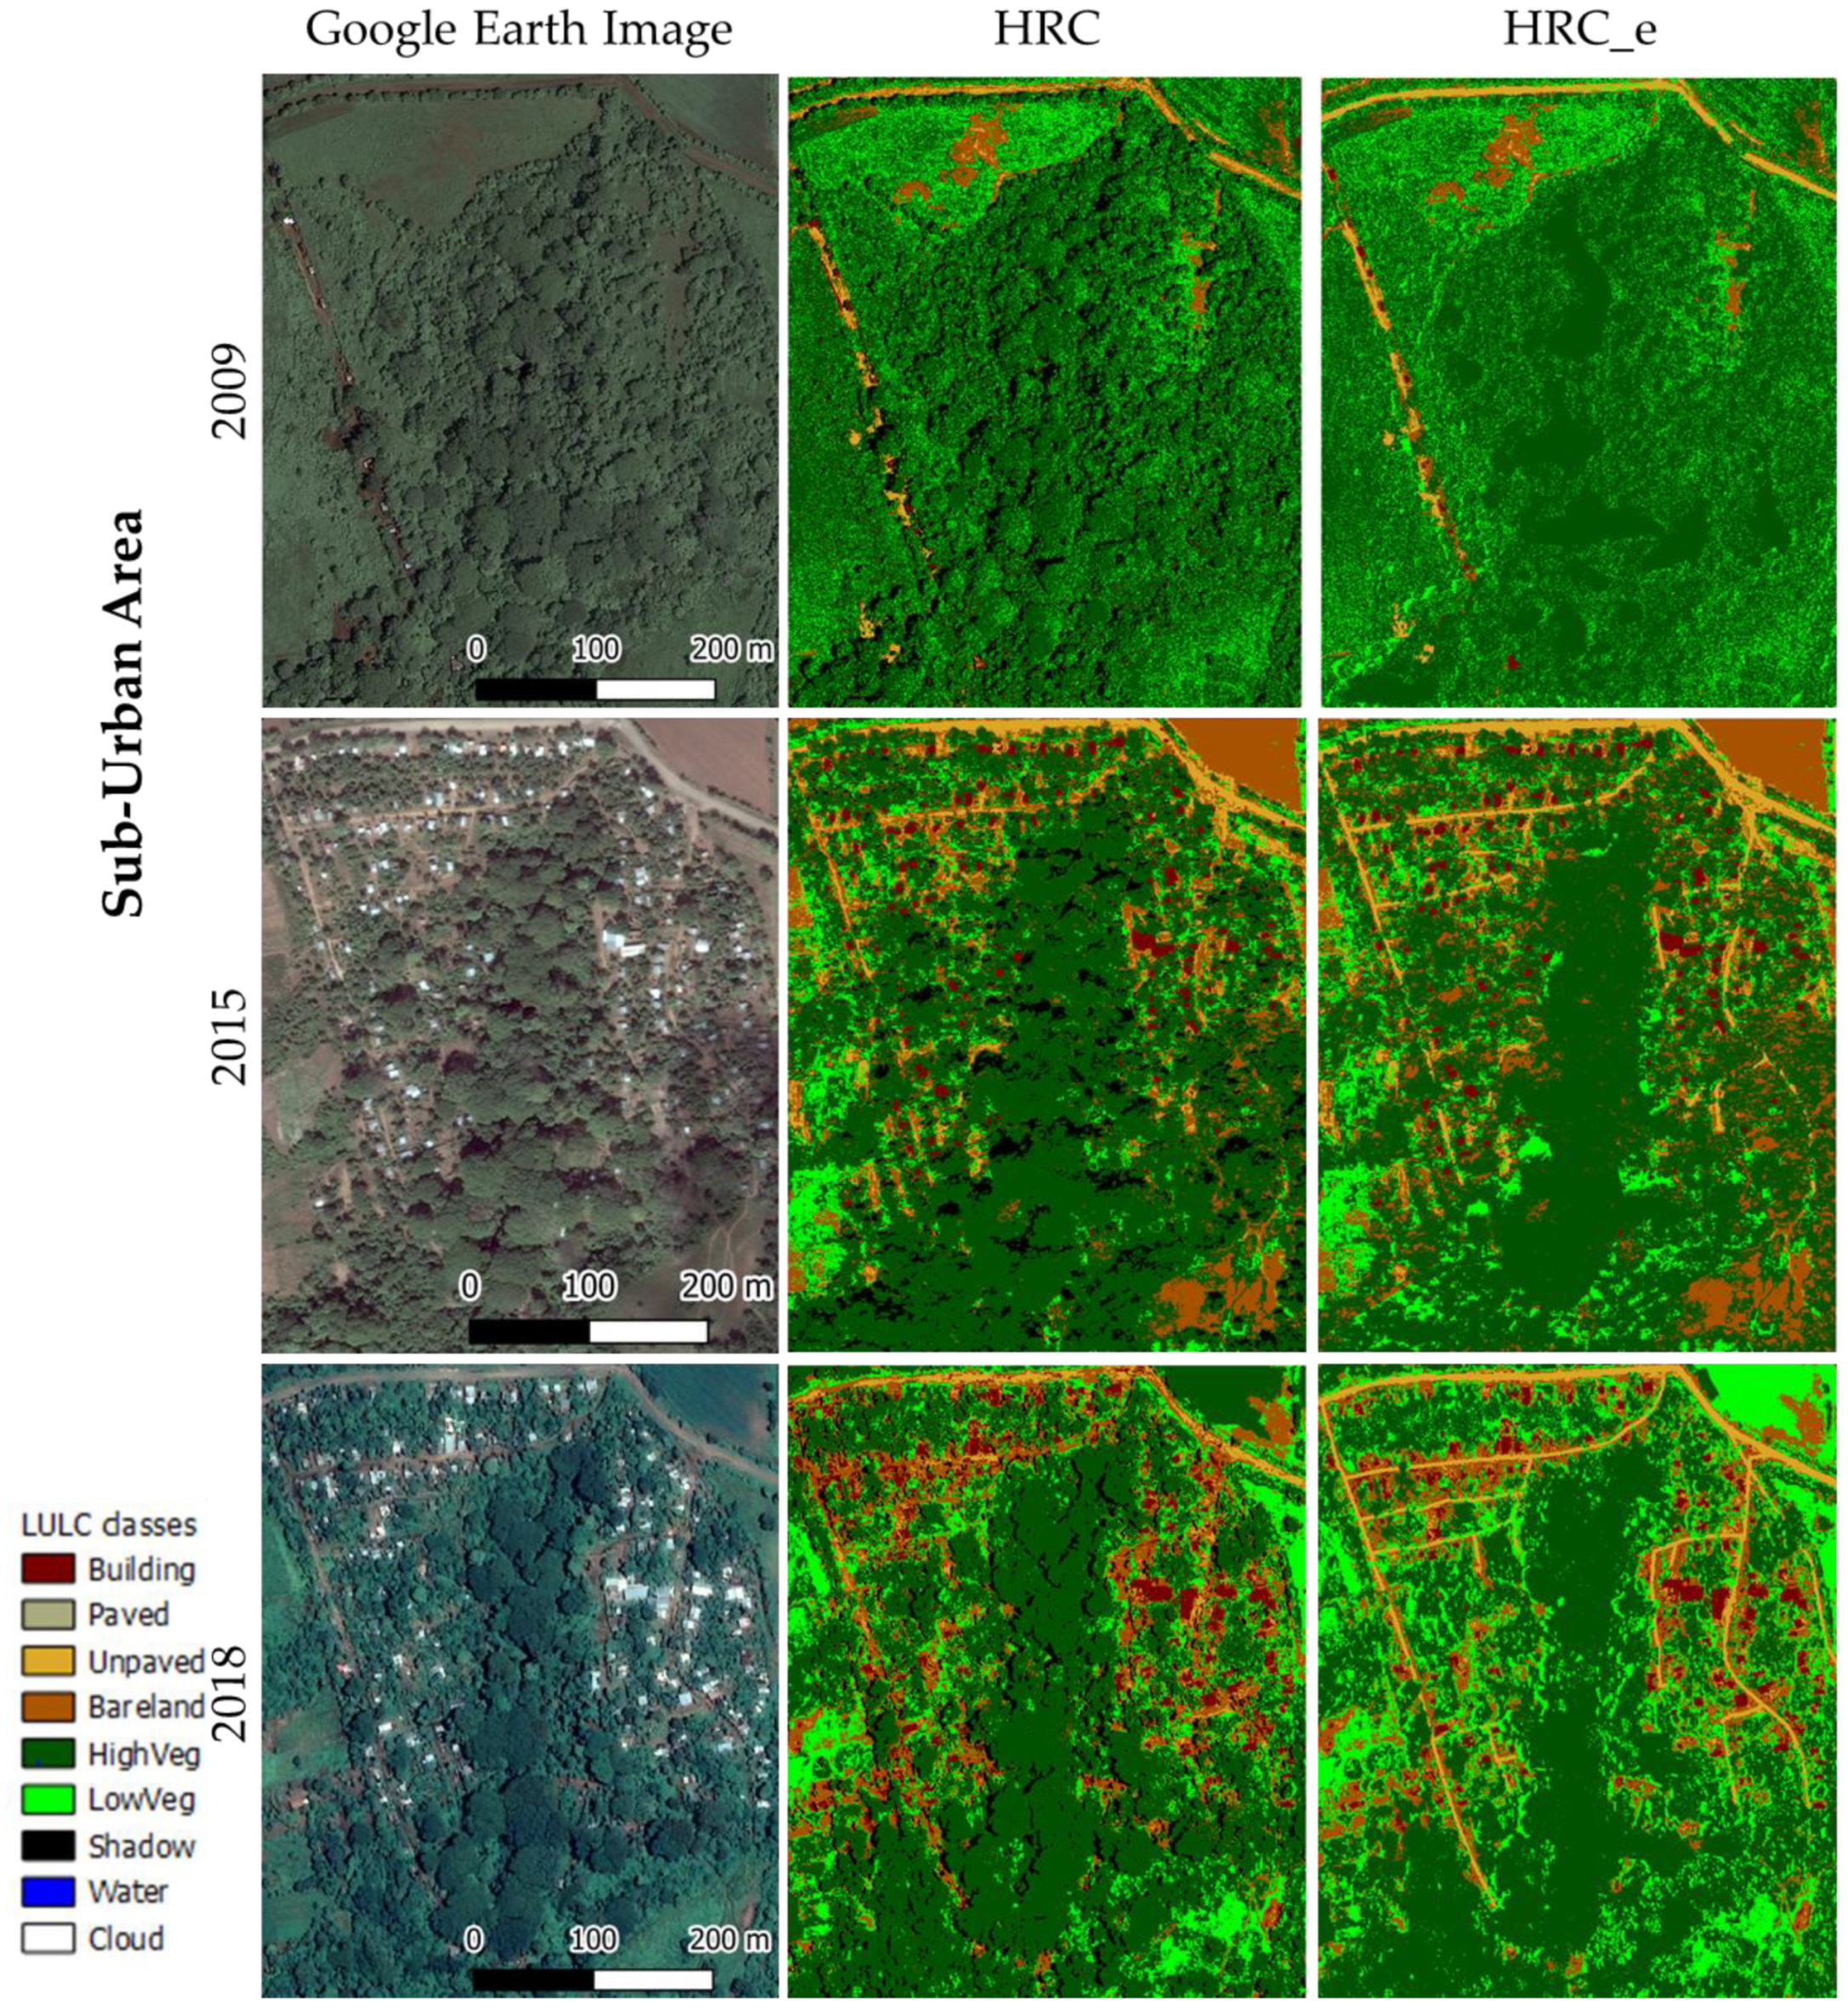
The LULC classification results of the initial (HRC) and the improved classification (HRC_e) for the three study areas and the three years are presented in
Appendix A (
Figure A1,
Figure A2 and
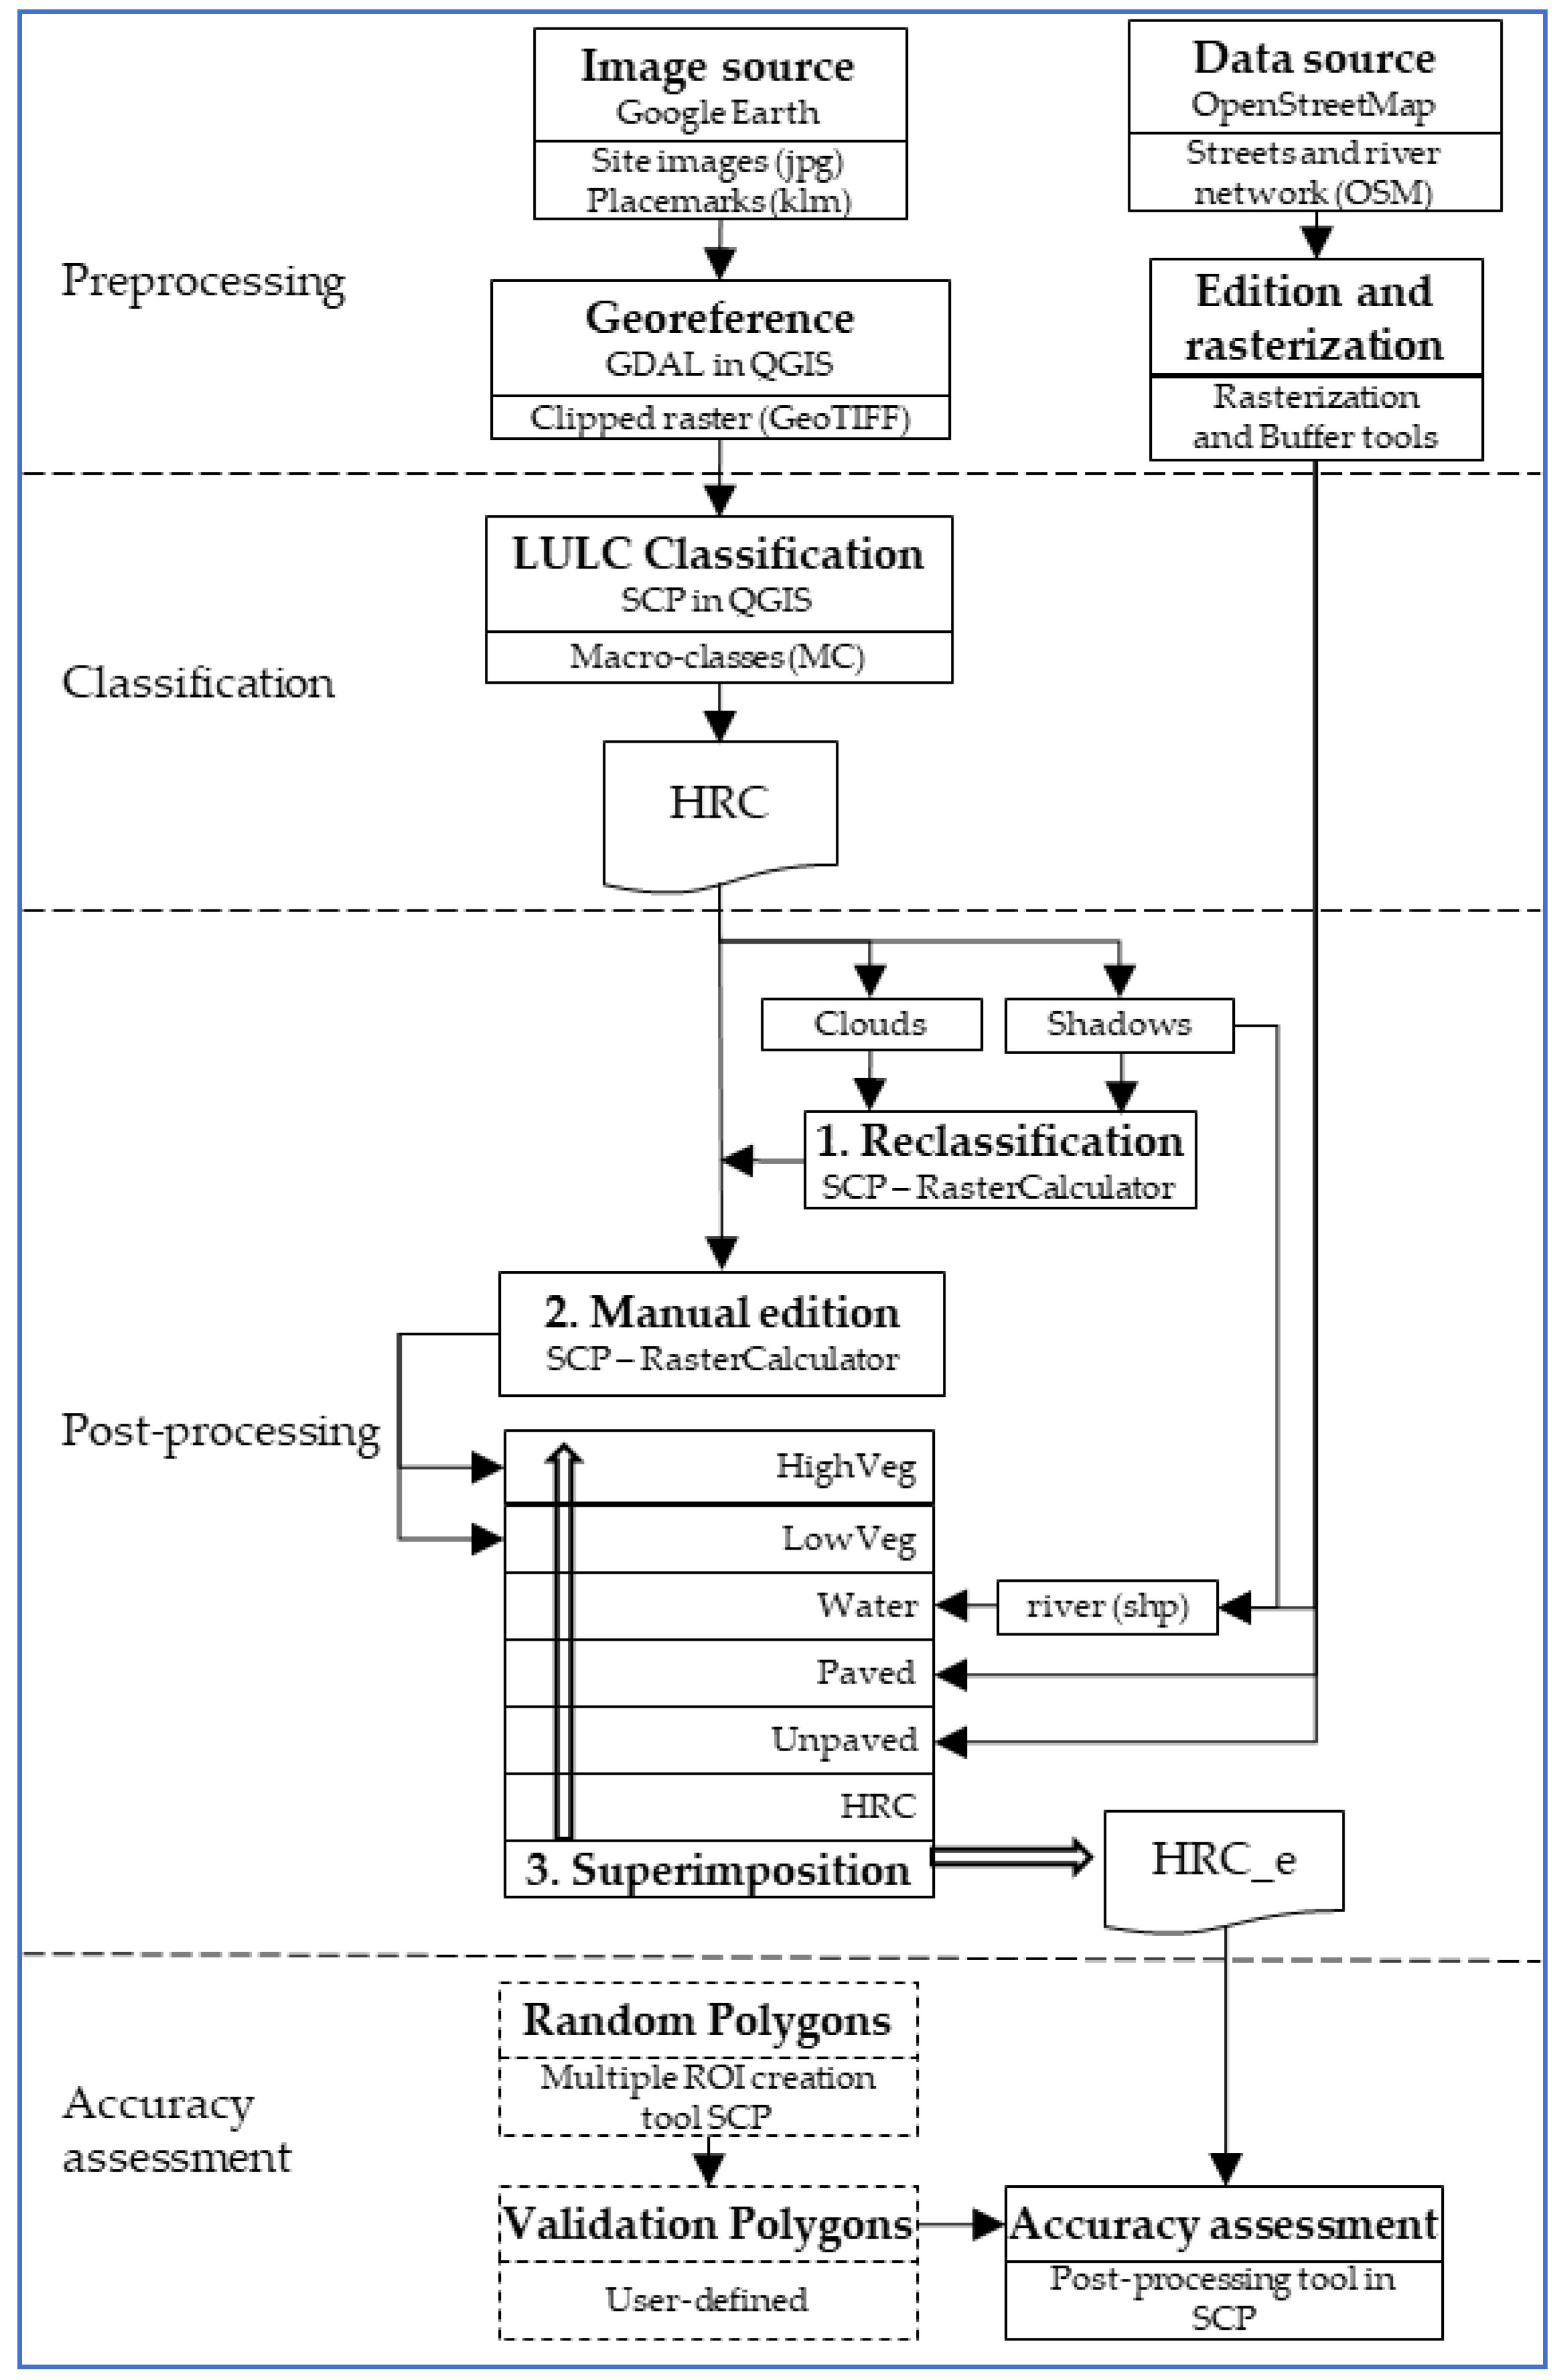
Figure A3). Both classifications show satisfactory results. However, as can be noticed, the accuracy of each classification (e.g., the elimination of shadows and the representation of the street network) was significantly improved by applying the post-processing methodology described in
Section 2.2.3. (see
Section 3.2 for detailed assessment of the classification results as part of the validation of results).
As a summary of results,
Table 2 presents the distribution of percentages for each LULC class in each image.
The highest percentages of the classes ‘Buildings’ and ‘Paved’ came from the ‘Urban’ area; a significant percentage of the classes ‘Buildings’ and ‘HighVeg’ were from the ‘Transitional’ area; and the lowest percentage of the class ‘Buildings,’ the absence of the class ‘Paved,’ and the highest percentage of the class ‘HighVeg’ for the ‘Suburban’ area, were correctly indicated by the classification results. Moreover, the characteristic temporal dynamics for all three areas—a steady-state of urbanization in the ‘Urban’ area; a significant urban growth between 2009 and 2015 for the ‘Transitional’ area (+58% in ‘Building’); and between 2009 and 2018, an even more pronounced urban growth for the ‘Suburban’ area (+320% in ‘Building’) are reflected as well.
As expected, the urbanization rate in ‘Urban Area’ does not show significant variation during the last years in HRC_e, most probably due to the lack of available space to build new houses close to the streets. In that zone, a decrease of high vegetation seems to be related to an increase of both low vegetation and bare land. The last feature can be interpreted as soil degradation, since most of this vegetation is located near the river where only few buildings are present, and no local interest in settling new houses exists. On the other hand, ‘Transitional’ and ‘Sub-Urban’ areas have presented a constant increase of built-areas in the past decade. Although this tendency is locally related to the more available space and flatter topography, those changes in the LULC do not follow the same pattern. In the case of the ‘Transitional’ area, the increment of buildings is not directly related to a reduction of high, but instead low vegetation and bare land. The increase of trees in this zone suggests a spatial variation of deforestation along the river, m possible that reforestation campaigns in this zone have supported the protection of trees close to the buildings and riparian zones. The ‘Sub-Urban’ area shows a constant decrease in high vegetation. This reduction is proportional to the increase of buildings, low vegetation, and bare land. That result suggests the area is facing an accelerated process of both soil degradation and urbanization.
A specific example of classification is shown in
Figure 3, corresponding to the ‘Urban’ area in the year 2009. Results were satisfactory in the HRC, with a significant improvement in the HRC_e. The expected LULC classification is consistent with the characteristics previously described for the three study sites. A visual examination indicates that small patches of vegetation or even single trees can be distinguished from man-made infrastructures. It demonstrates the potential of the classification methodology to define and analyze, from a spatial perspective, the distribution of different spaces in urban areas.
An initial approach for the quantification of urbanized and vegetated areas can be done based on the HRC. The resulting percentages indicate the most prominent LULC classes for each year and study site. In contrast, these values are not sufficient to interpret certain aspects. For example, the area covered by paved streets is not congruent with the reality, but was, only after obtaining the HRC_e. The diversity of elements, and therefore, the color pixels of houses and streets tend to be classified in several LULC classes, in some cases mixing them. Another issue is observed in the temporal variation of a specific class.
In the ‘Urban’ area, the buildings seem to have been reduced in number during the last decade, but in fact, this result is a consequence of the training input set by the user. As observed in
Figure 3, the user initially classified clouds as buildings, provided that a post-edition is created. This was due to the similar colors of white roofs and clouds, which led to an inevitable misclassification. As a result, the values given in
Table 2 do not show the real area covered by clouds, but increase the buildings’ area intentionally. That subject influences the analysis of a land use change from the HRC. Therefore, only a general distribution of LULC can be derived from HRC, making post-processing necessary, in order to obtain correct interpretations.
The HRC_e provides more reliable results. This is a consequence of the manual editing done in each image at different levels. A significant improvement is obtained after superimposing layers. The areas classified as paved, unpaved, or rivers are visually consistent with the images, since the user had control over superimposing them. Furthermore, reclassifying shadows and clouds support the reduction in the uncertainty of the LULC in those areas. This suggests the imperative need to edit such layers when working with satellite images, since clouds and shadows are a common features of the images. Employing these results contribute to more precise interpretations of spatial and temporal variations in the study areas, although a more detailed analysis could be done by considering more images.
To summarize, both the HRC and HRC_e satisfactorily address the LULC classification. For the case of HRC, undesired features, such as clouds or shadows, may influence a more detailed interpretation of the results. In contrast, the edition which was subject to the HRC_e allows the identification of said misclassifications, and improves the results by a user-control process. In any case, the level of accuracy desired in the results depends on the purpose of the information. The following sections explain the main issues we identified during the procedure and how they were overcome. In addition, the potential applications of this methodology and the results obtained are addressed.
3.1. Factors Influencing the Quality of Classification Results
3.1.1. The Presence and Influence of Shadows
Table 2 indicates that shadows represent in average 13% of the whole area, increasing up to 23% in one case (‘Transitional,’ 2015). The reclassification of this feature depended on the urban configuration at each site. Shadows were generally reclassified as ‘Buildings’ and ‘HighVeg’ in the ‘Urban’ area. In the other two areas, shadows were mostly changed to ‘HighVeg,’ ‘LowVeg,’ and ‘Bare land’ due to the low building density. Although shadows from clouds were observed in two images, the classification algorithm did not recognize them, but classified the pixels as other LULC classes found on the surface. Shadows lying on streets were not reassigned to the respective layers, since they were subsequently superimposed. That reduced the effort of manual editing. The percentage transformed to ‘Water’ was near zero, with a maximum value of 0.7% from only one case. Nevertheless, that transformation allowed us to define the location of the river in the raster. In summary, the percentage of shadows went down to zero in all cases, improving, theoretically, the results.
3.1.2. The Misclassification and Confusion of Classes
The variation in the percentage of the area edited as buildings did not follow a specific tendency. The difference of the percentage between HRC and HRC_e for this category varied in a range between −3.6% and +1.6% due to a combination of different factors. On the one hand, the percentage increased after converting ‘Shadows’ or ‘Clouds,’ and after the manual editing. However, the latter can also lead to reducing its percentage if temporal elements, such as vehicles, which were falsely classified as buildings but later corrected. On the other hand, a decrease of areas classified as ‘Buildings’ is likely to occur after superimposing street layers. In fact, the classes ‘Paved’ and ‘Unpaved’ increased to up to 6% in the images where they were defined. This suggests that sections of streets tend to be classified erroneously as buildings, among others, showing overrated initial values for this category. This misclassification was observed in some street sections of several images. In general, the small range of variation after edition corresponding to the land cover ‘Buildings’ cannot be interpreted as a satisfactory initial classification but as a result of the post-processing phase.
Another common misclassification was observed between the class ‘Bare land’ and both ‘Unpaved’ and ‘Paved.’ Due to the similitude of their pixel colors, these classes were falsely classified at the initial stage and only corrected in the post-processing. As a consequence, the selection of ROIs was preferred for ‘Bare land,’ since the superimposition redefines the streets.
A similar conflict was observed between ‘HighVeg’ and ‘LowVeg.’ Although it is visually possible to discern these areas, the diversity of green color tones for several species of vegetation made it complicated, in certain cases, to differentiate them after running the classification algorithm. Nevertheless, their percentages increased after editing in all the cases, as a result of reassigning shadows, also because an erroneous classification with other features happened in a few cases. One of these cases occurred when green roofs were present on the image, which was solved by editing the buildings.
In conclusion, the misclassification of LULC classes is inevitable when following our methodology, because the procedure is based on pixel colors, and some features share very similar colors despite belonging to different classes. To overcome this, manual editing can be applied to reassign specific features, such as rivers or temporal elements. The editing proposed in the post-processing stage consists of a set of tools which are useful to redefine misclassified pixels. In any case, the effort incurred in the editing will depend, among others, on the image quality, the classification algorithm, and the training input.
3.1.3. ROI and LULC Class Definitions
Factors such as the ROI creation, image quality, or pixel resolution influence, directly the initial classification (i.e., HRC). The variations of any LULC classification are also subject to the contrast of colors between different land cover classes. Since we are considering true-color images, the LULC classes and the ROIs selected to define them on the image may produce different results if the contrast or brightness of an image is modified. Especially in the case of roofs, where different materials, such as metal sheets, tiles, asphalt shingle, or concrete are used, the creation of ROIs may lead to a trade-off in terms of initial results obtained in the HRC. For example, common misclassifications were observed between clouds and white colored roofs; vegetation and green color roofs, streets; and grey color roofs, or rusty roofs and land undergoing an erosion process. This leads us to suggest that a pre-processing of the image quality could improve results.
The initial approach which defined the LULC classes was based on the observation of the most prominent areas. As a consequence, unpaved streets and bare land were classified separately. Although this differentiation is necessary for specific topics dealing with the urban LULC, we suggest not to separate them in the MC used in the SCP plugin. Superimposing the street network in the post-edition not only adjusts the geometry of these areas in the image but also contributes to differentiating between paved and unpaved zones.
Additional factors influencing the results are linked to the algorithm employed for the classification. In this study, the maximum likelihood algorithm was preferred, due to the better definition of the outcomes observed after each run of the plugin in comparison with the minimum distance algorithm. The yielding of better results using the maximum likelihood algorithm is supported by other studies based on Sentinel-2A images [
38]. The fundaments behind this topic are not discussed here, since the theoretical background of these algorithms has been already considered by some authors [
36,
39].
3.2. The Validation of Results
Table 3 shows the overall percentage of pixels for both the HRC and HRC_e raster that were correctly classified when compared to the validation polygons. On average, an improvement of 10% was achieved in the images, with an increase of up to 25% in one case. After editing, a mean value of 74% of correctly classified pixels with a standard deviation of 10% was accomplished in our study areas, although the lowest classification rate was about 58%. That value was observed in the oldest images of each study site. This suggests that image quality plays an important role, since newer images present better sharpness. The best classification result (85.2% accuracy) was achieved for the ‘Urban’ area in 2018. Contrary to our expectations, two images corresponding to the ‘Sub-Urban’ area show an improvement lower than 2% in the HRC_e. The last could not only be related to the image quality but also to the main characteristic of the study area.
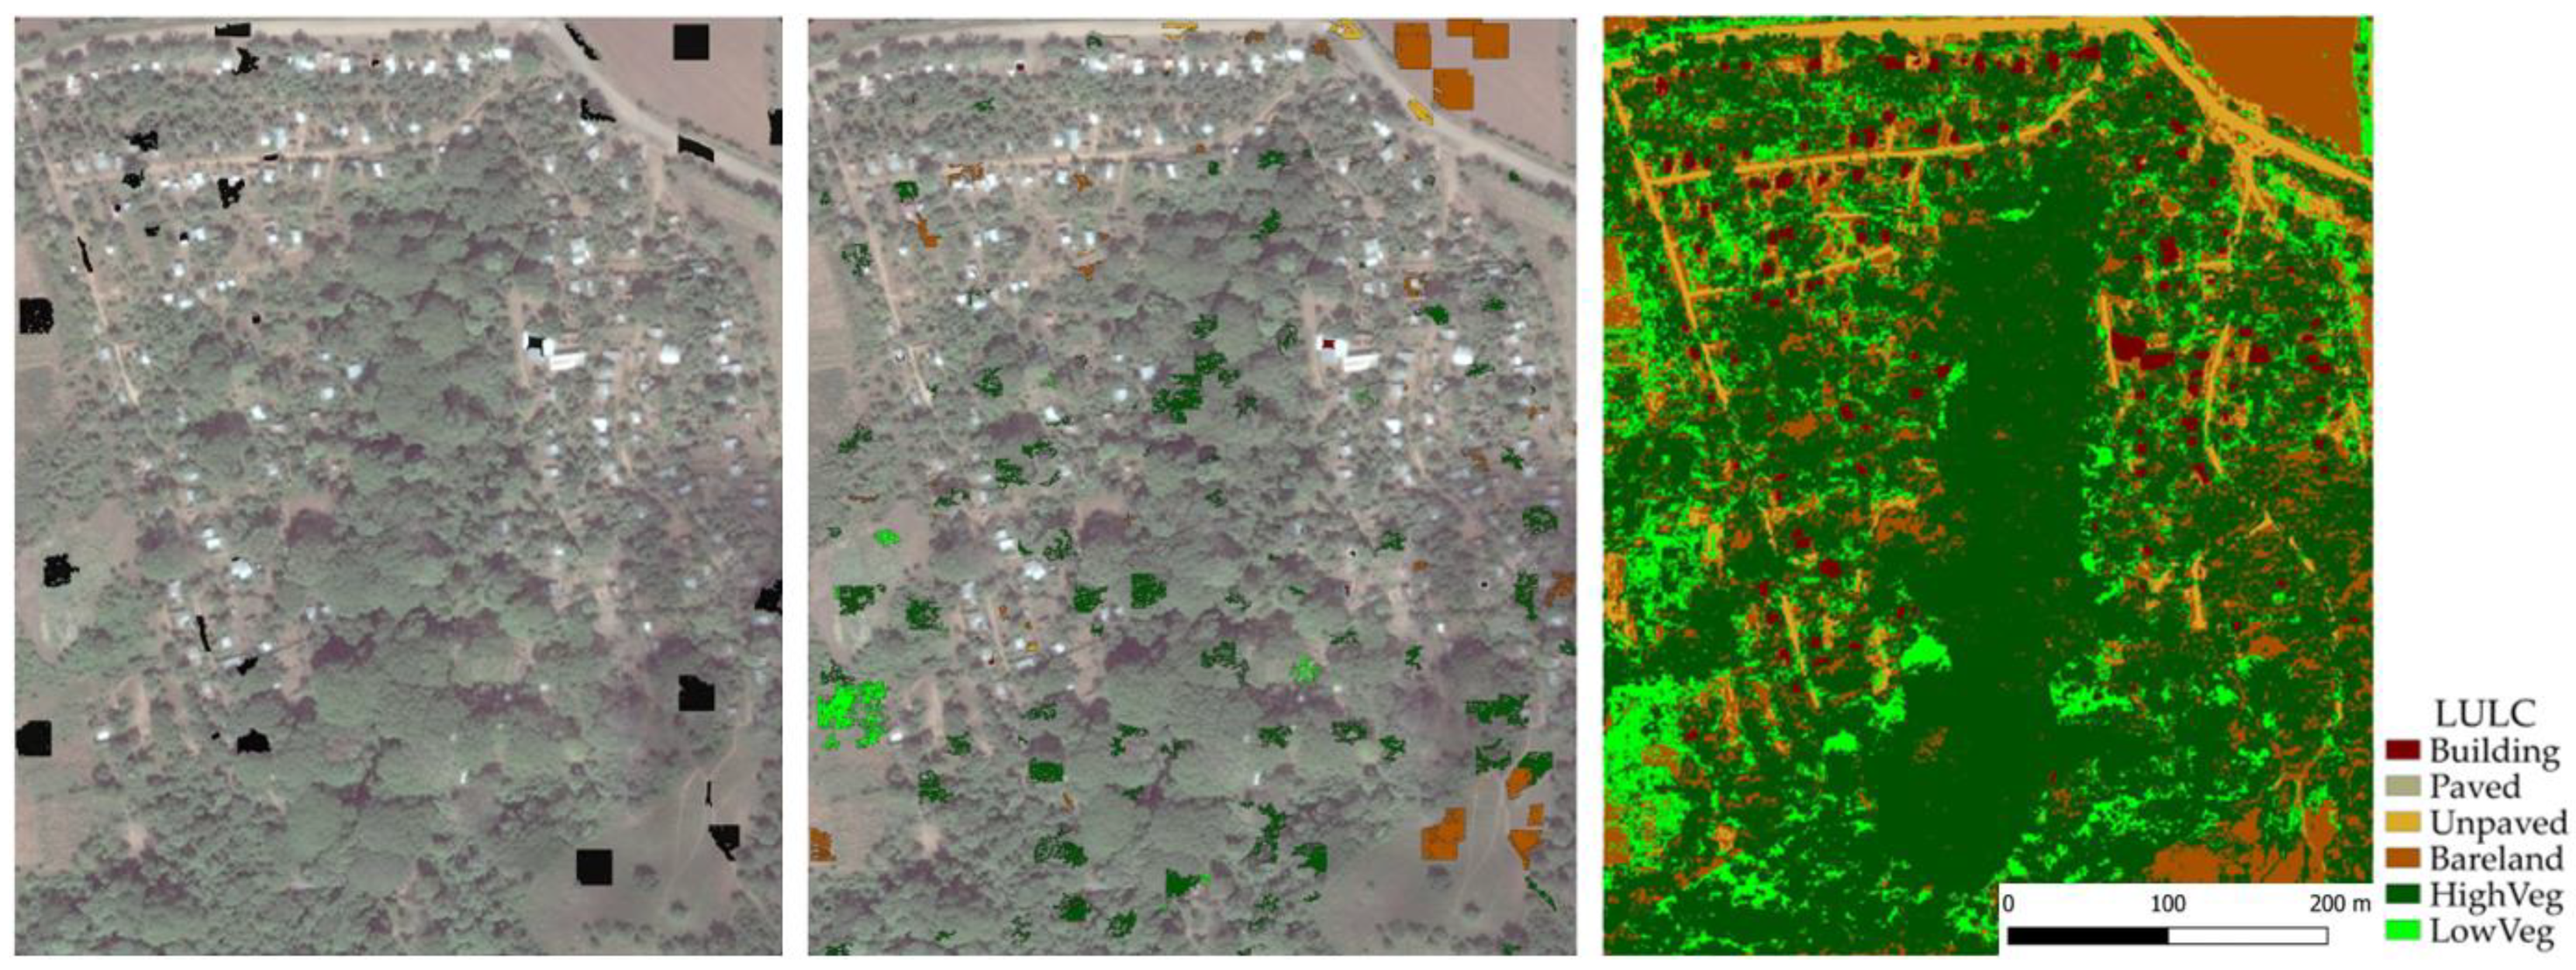
As can be seen in
Figure 4, the ‘Sub-Urban’ area is mainly covered by high and low vegetation, followed by areas in process of erosion. The presences of streets, waterbodies, and buildings are scarce. This subject is related to the number of pixels defined as ROIs in both the training input and the validation polygons for the accuracy assessment. Due to the similarity of green color tones, the overall percentage of green areas, and the capacity of the algorithm to discern between vegetation classes, the results tended to misinterpret between ‘HighVeg’ and ‘LowVeg.’ In other words, the overall percentage of accuracy in this area was highly influenced by a misclassification of these two classes. In consequence, it is necessary to interpret not only the general accuracy of the results in comparison with manual randomly verification polygons but also to verify which LULC classes are mixed with each other. By doing so, it is possible to make clear if an inaccurate classification is distributed on other classes or tends to be misinterpreted with only one specific class.
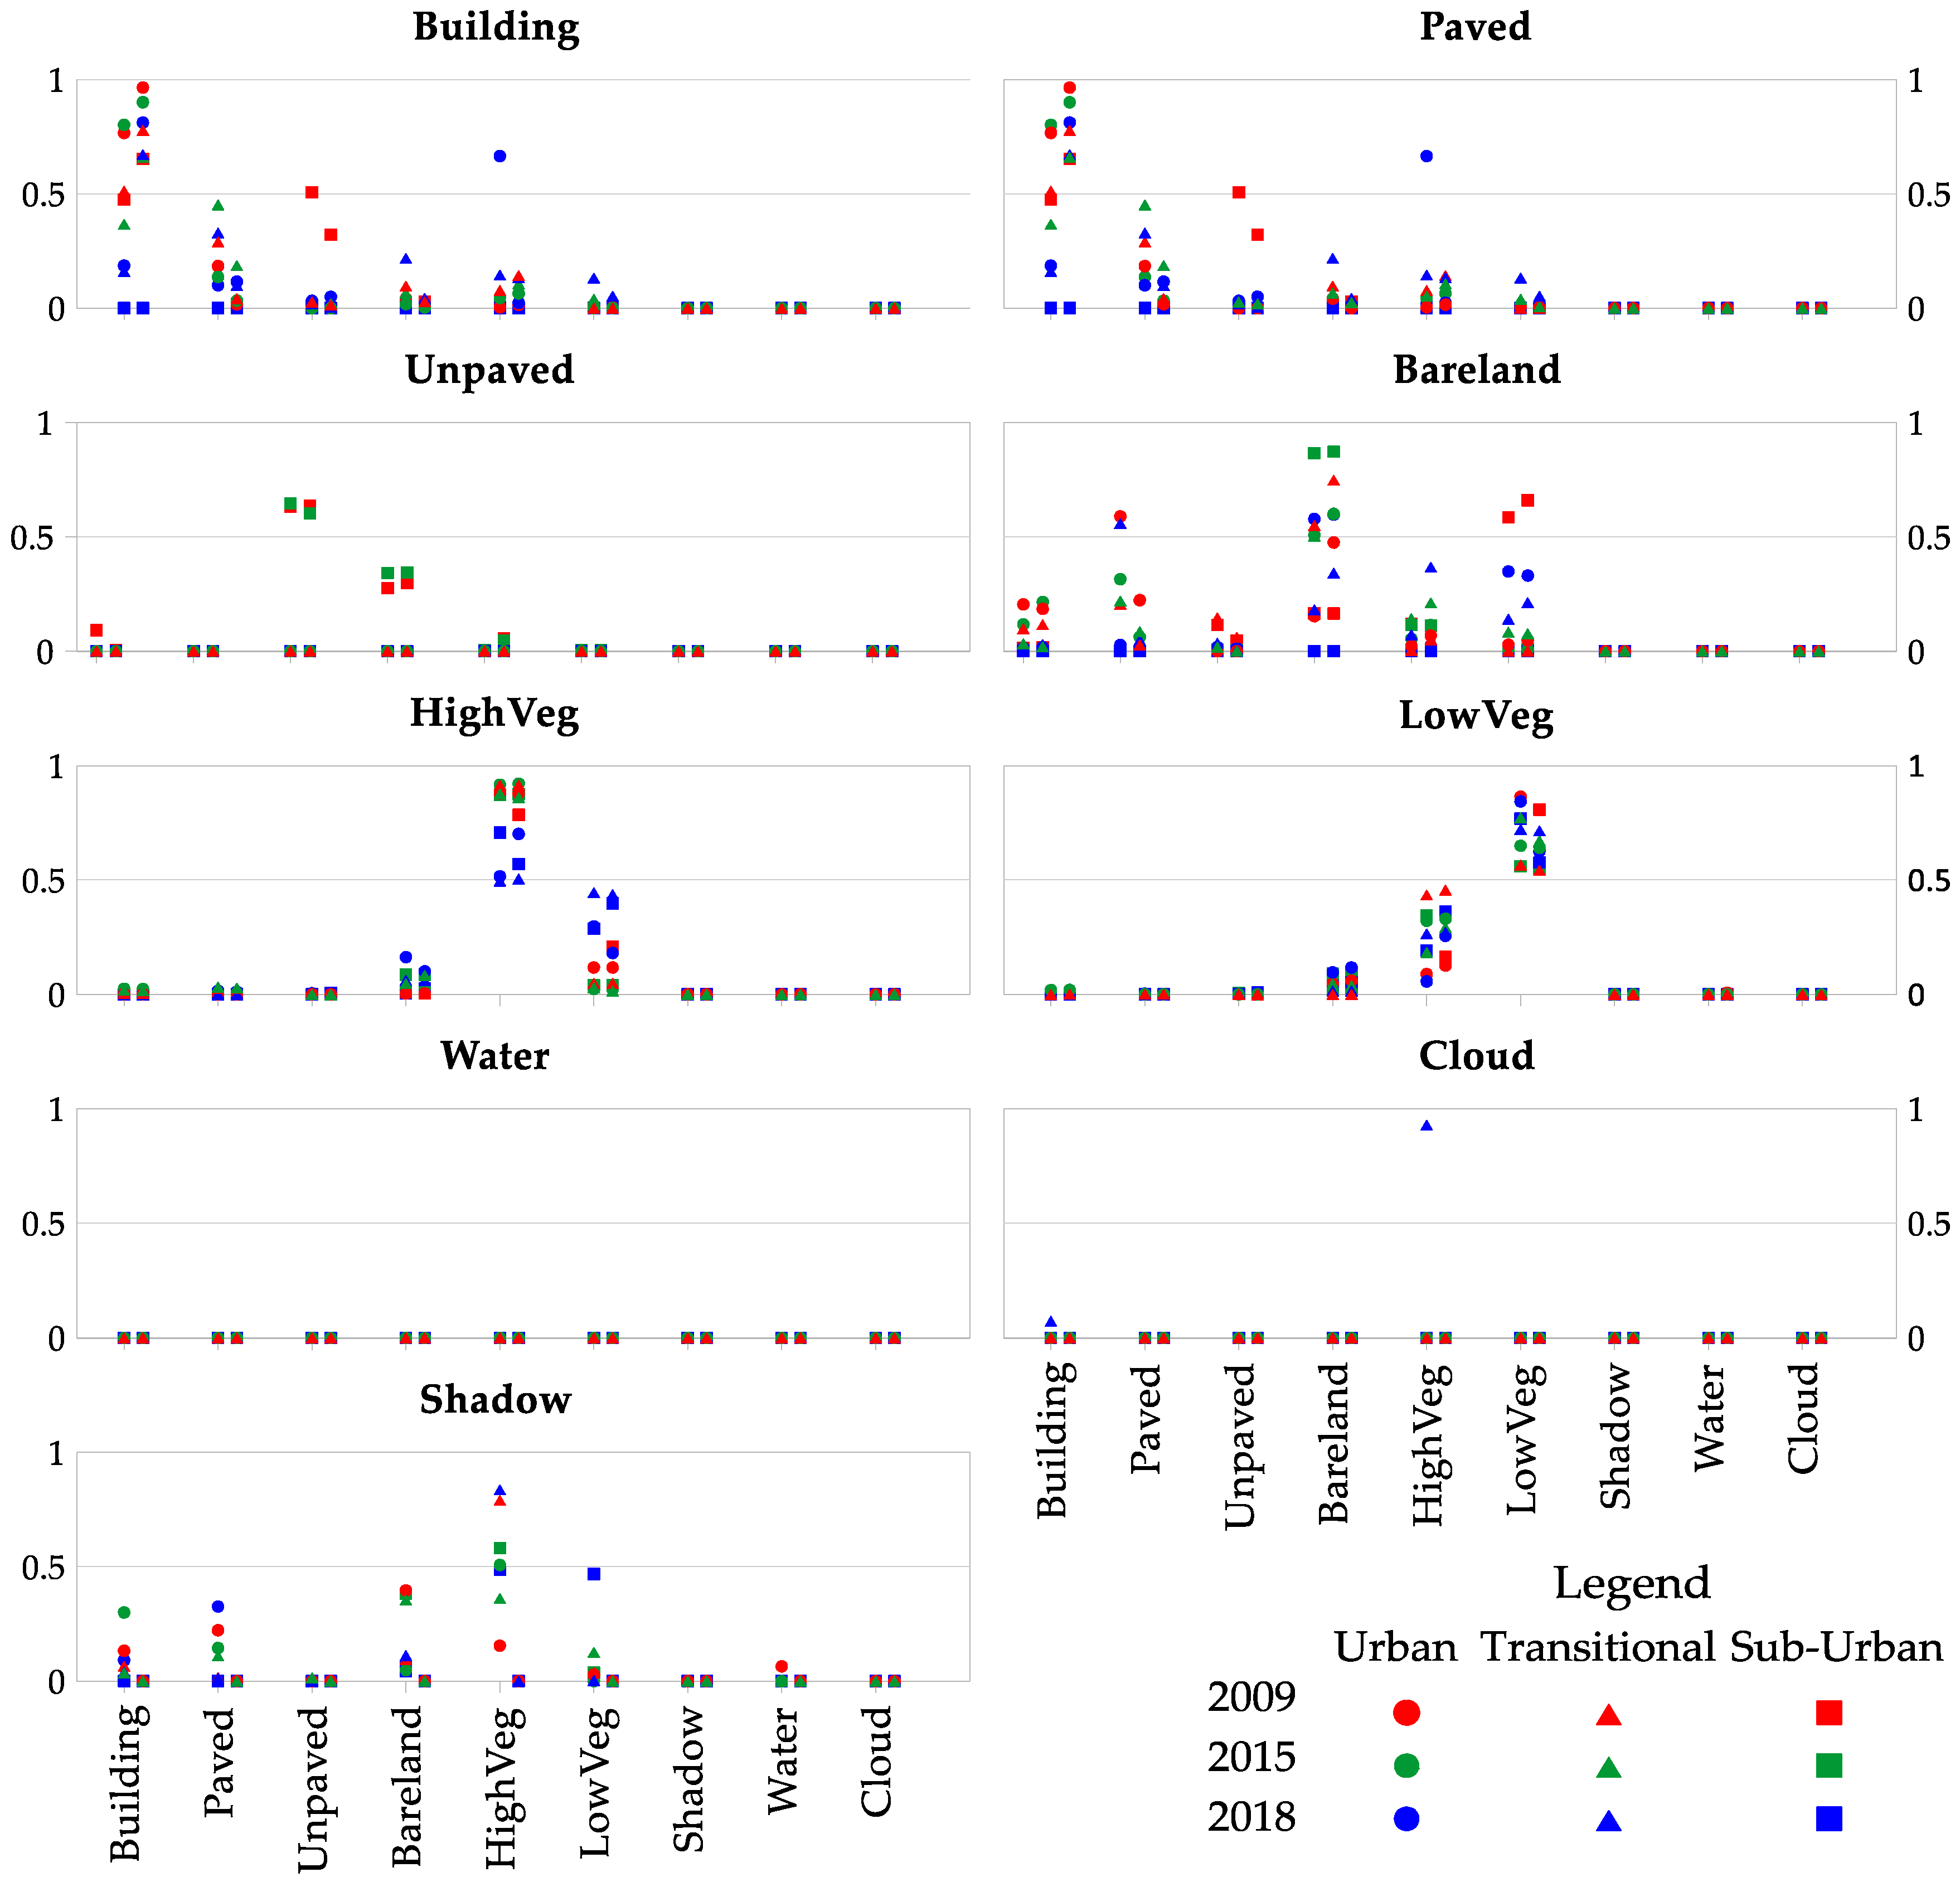
The point charts in
Figure 5 display how a specific LULC class was categorized into any of the nine classes previously defined. Each point is associated with an image (corresponding to one of the three study areas and one year). The y-axis represents the matching ratio of a land cover class in regard to the validation polygons. For a specific chart, the numerator in the ratio indicates the number of pixels of an image within the boundaries of the validation polygons, which were classified as the land cover classes represented in the chart. The denominator is the total number of pixels of the validation polygons defined as one of the classes on the X-axis for each image. Two columns are shown in each category of this axis to designate the coefficients obtained for the HRC (left) and HRC_e (right) raster.
For example, a point located in the chart ‘Building,’ column HRC of the ‘Paved’ class has a coefficient equal to 0.48 (green triangle symbol in the left column). The point indicates that, from all the pixels in the validation polygons of HRC corresponding to ‘Transitional’ area in 2015 classified as buildings, 48% were classified as paved streets. Thus, the tendency of a specific land cover class to be classed as another one can be inferred.
Some points were not displayed in
Figure 5, since they were considered irrelevant and could lead to false conclusions due to the nature of the diagram. A value was discarded if the ratio between the correspondent percentage of the land class and the percentage of the maximum land class of its image was lower than a threshold. This threshold was assumed as 0.05 which represents a relative percentage in reference to the largest land cover class of an image. A specific point representing only a small portion of the validation pixels in comparison with other categories was rejected if that ratio was lower than the minimum threshold. The formula employed to define this ratio can be observed in Equation (1), where the subscripts
i and
j represent each
m land classes and
n HRC_e rasters, respectively. Nevertheless, this boundary was employed only for illustration purposes of depicting
Figure 5 without any change on the HRC or HRC_e results.
The charts presented in
Figure 5 illustrate how the results improved after post-processing. Clouds and shadows were reduced to zero as a result of replacing them by other LULC classes. For ‘Water,’ no variation is indicated because the random validation polygons did not lay in any of these areas, so no comparison was possible for this layer.
The most relevant variation which tended to be erroneously classified in the HRC was found between buildings and paved streets. In the case of buildings, this land cover class was mostly classified as ‘Buildings’ and ‘Paved’ in the ranges of 20–80% and 0–45%, respectively. Those results improved after editing, achieving accuracy values higher than 60% for the first case and reducing the error to values lower than 20% in comparison with other classes (See
Figure 5, ‘Building’ chart).
Similar results can be observed for the validation areas corresponding to paved streets. In this case, the percentage of accuracy rose above 80% for ‘Streets’ while misclassified buildings in those areas were reduced to less than 5%, most likely due to the overlapping process. However, in the same layer, ‘Bare land’ showed an error on the accuracy of up to 16% in one case, which suggests that the misclassification between these two classes is higher in paved zones. This result was expected, since some sites, such as sidewalks, are still irregular unsealed areas among paved streets, which leads to an erroneous classification if the superimposing method is applied.
The chart corresponding to ‘Bare land’ shows how it tends to be the least accurately classified. These areas are subject to misclassification with any of the other classes, except shadows, clouds, or waterbodies. Even after editing, these values did not decrease but actually rose for the classes ‘HighVeg’ and ‘LowVeg.’ The latter could be due to the random generation of areas which considered two land classes in the same polygon and were classified as just one class. Another factor for this increase could be related to the ambiguity of visually defining zones with soil degradation. Thus, if an area is considered as ‘LowVeg’ or ‘Bare land’ depends highly on the manual definition of ROIs driven by the user.
There is no significant variation after editing in the areas classified as ‘HighVeg’ and ‘LowVeg.’ The charts associated with those two classes show that the ranges of accuracy improved only in certain cases. Furthermore, percentages up to 40% can be reported incorrectly between the two categories as a consequence of the heterogeneity of colors representing different types of vegetation. However, if vegetation is classified as a unique class, the accuracy increases considerably. Similar to ‘Bare land,’ any area in degradation tends to be erroneously classified, for the vegetation zones as well, supporting the interpretation done previously for this land class. In general, these results show that the HRC_e has high accuracy when differentiating man-made infrastructure from natural elements, but higher accuracy requires further effort when discerning between high and low vegetation.
In conclusion, an inaccurate classification cannot be interpreted only in terms of a general average as stated in, but as the relation between specific classes and the tendency to be misclassified with each other. We observed that ‘HighVeg’ and ‘LowVeg,’ and ‘Building’ and ‘Paved,’ have a strong connection, which is different in comparison with other classes. Discerning between them could be hard and a time-consuming activity if an editing process is required. However, the quality of the results increases considerably if the main goal of the LULC classification is differentiating between man-made structures and green areas.
A high-resolution LULC study, also based on commercially provided images but using a different methodology [
40], achieved similar accuracy results.
3.3. The Advantages, Disadvantages, and Potential Applications of High Resolution LULC Classification
The high-resolution raster obtained as a result of the LULC classification provides quantitative information about the distribution of the different small-scale elements integrating an urban area. These results can be easily modified and transformed by the user within the presented methodology, reducing classification errors substantially. In that regard, a raster is a tool and source of information of easy adaptation for function of specific research purposes. This study’s spatially distributed data could be used as the basis for different studies, including not only urban planning and spatial distribution but also subjects related to urban ecology, hydrology, water management, sociology, and local policy.
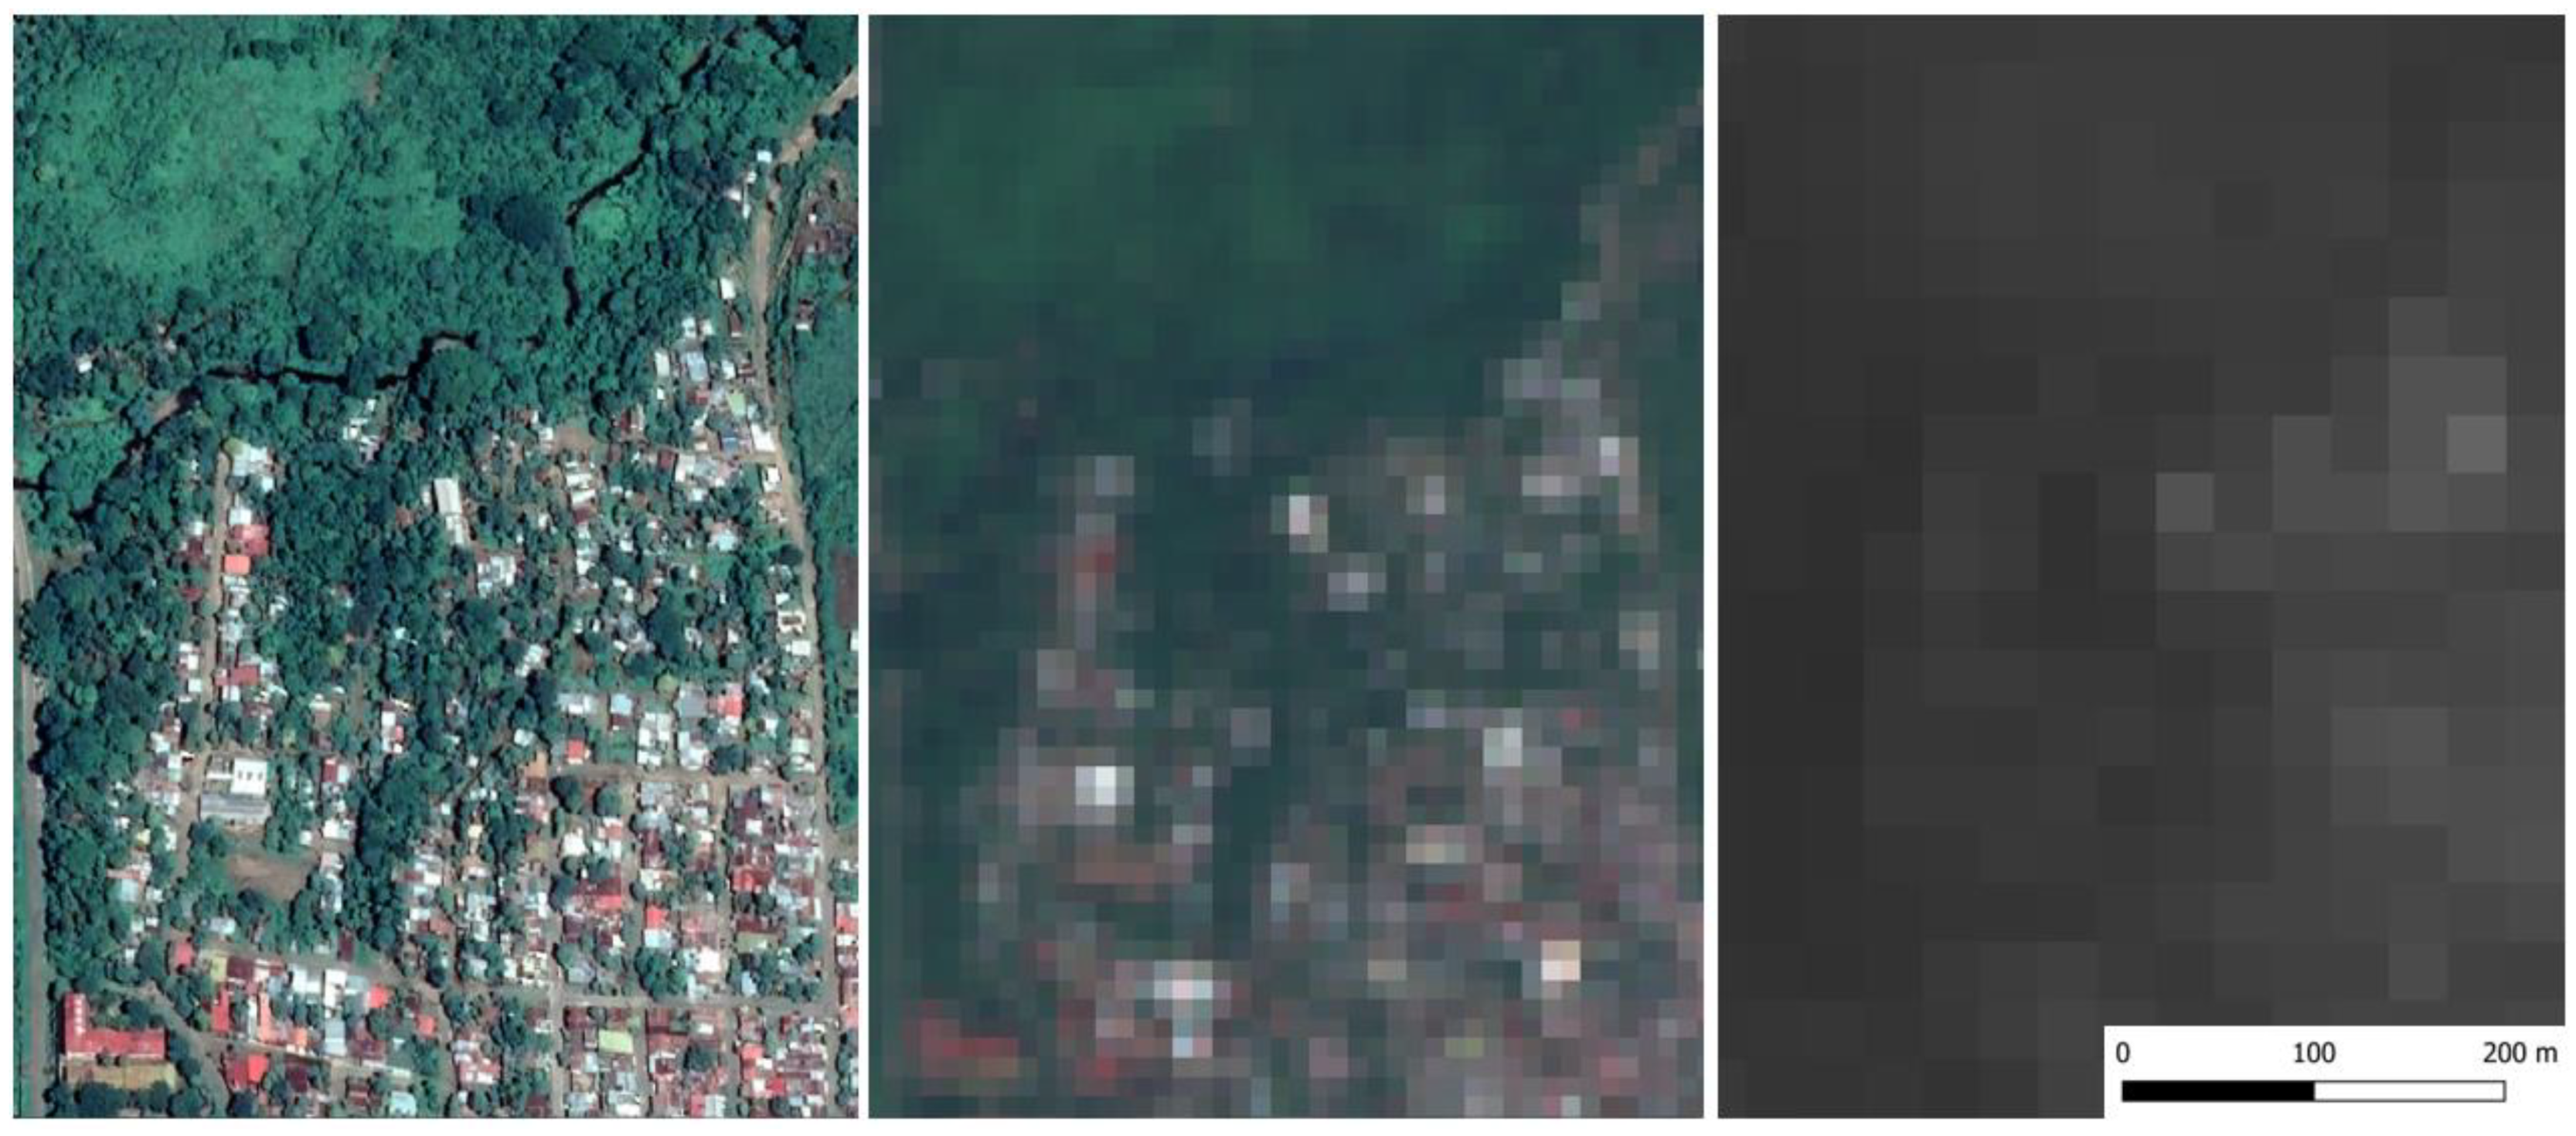
Figure 6 shows an image employed in our study and two images derived from Sentinel-2 and Landsat 8 satellite data for the same date. These images show that true color images derived from Google Earth have a much higher spatial resolution in comparison with most common sources for LULC classification. Although high resolution Google Earth imagery can only be obtained as true color images (for example, by applying the procedure presented in this publication) at the moment, they allow one to identify, in a simple but reliable way, specific urban features in a LULC classification. A summary of the main advantages and disadvantages that we have detected for our methodology is listed in
Table 4.
LULC classifications at high resolution are indispensable inputs to assess the urban water cycle at different spatial scales. In general, a hydrological analysis at the watershed level is based on an average classification of the land use distribution. At the urban scale, nevertheless, the processes of runoff, infiltration, and evapotranspiration are more complex, and the level of detail (spatial resolution) required for their study has increased. That involves, for instance, the need to define more detailed runoff coefficients for micro urban watersheds and the definition of the artificial urban drainage network. The results obtained from our methodology can support these endeavors. In addition, a high resolution of runoff coefficients supports the implementation of pilot projects aiming to determine the impacts of modifying the current urban stormwater management.
Identifying potential patches for urban ecological improvements can also be derived from our methodology. Green spaces, considered shelters which trigger urban biodiversity, can be located and their spatial distribution also analyzed. This provides insights in order to define their connection and the potential for new spaces developed in the urban mosaic. Thus, not only parks, riparian zones, and other large green areas can be included in the analysis of interconnected networks supporting urban ecology, but also elements commonly neglected due to their smaller size.
Furthermore, the spatial distribution of patches can be linked to the public or private domain. An analysis of a study site from above assists to define the level of accessibility to green areas. In that manner, ecosystem services provided by urban vegetation can be analyzed by their function in their location and the associated property rights. For example, public vegetation (e.g., street trees) not only improves air quality but also provides shade to pedestrians, and reduces the local temperature and the heat island effect. Their canopy reduces runoff directly connected to the public sewer system and can be conceived as an element supporting runoff infiltration. This contrasts to the more disconnected trees found in the backyards of houses. An approach to such analysis using the methodology employed in this study could be based on defining and separating layers, similar to what was done in the post-editing stage.
Regarding the satellite images, the access to historical imagery permits a temporal analysis of LULC changes. Thereby, tendencies and correlations of urban modifications during a specific period can be identified. External factors influencing this transformation, such as urbanization or deforestation, can be quantified using the high-resolution classification procedure. In addition, historical images can be employed to define seasonal variations of the LULC, and consequently, perennial and temporal vegetation. By doing so, significant inputs can be provided to support stakeholders, local authorities, and other actors involved in the planning and management of urban areas and decision-making processes. A limitation for realizing temporal analysis represents the presence of clouds in the images resulting from the optical (passive) satellite imagery. Images generated by active satellite imagery, such as synthetic aperture radar (SAR) satellites are not affected by clouds, and have, therefore, advantages. However, manual analysis of SAR satellite images to classify land cover is difficult [
43] and high-resolution SAR images are yet not available without cost.
Those examples of potential applications are linked to the methodology presented in this study. Although different methods could be available, the main advantages of the method employed in our research are the uses of free and open access software and high-resolution data. Hence, it was our aim to help overcome the limitations of some areas, especially in developing countries, regarding lack of accessibility to skills, instruments, and data.
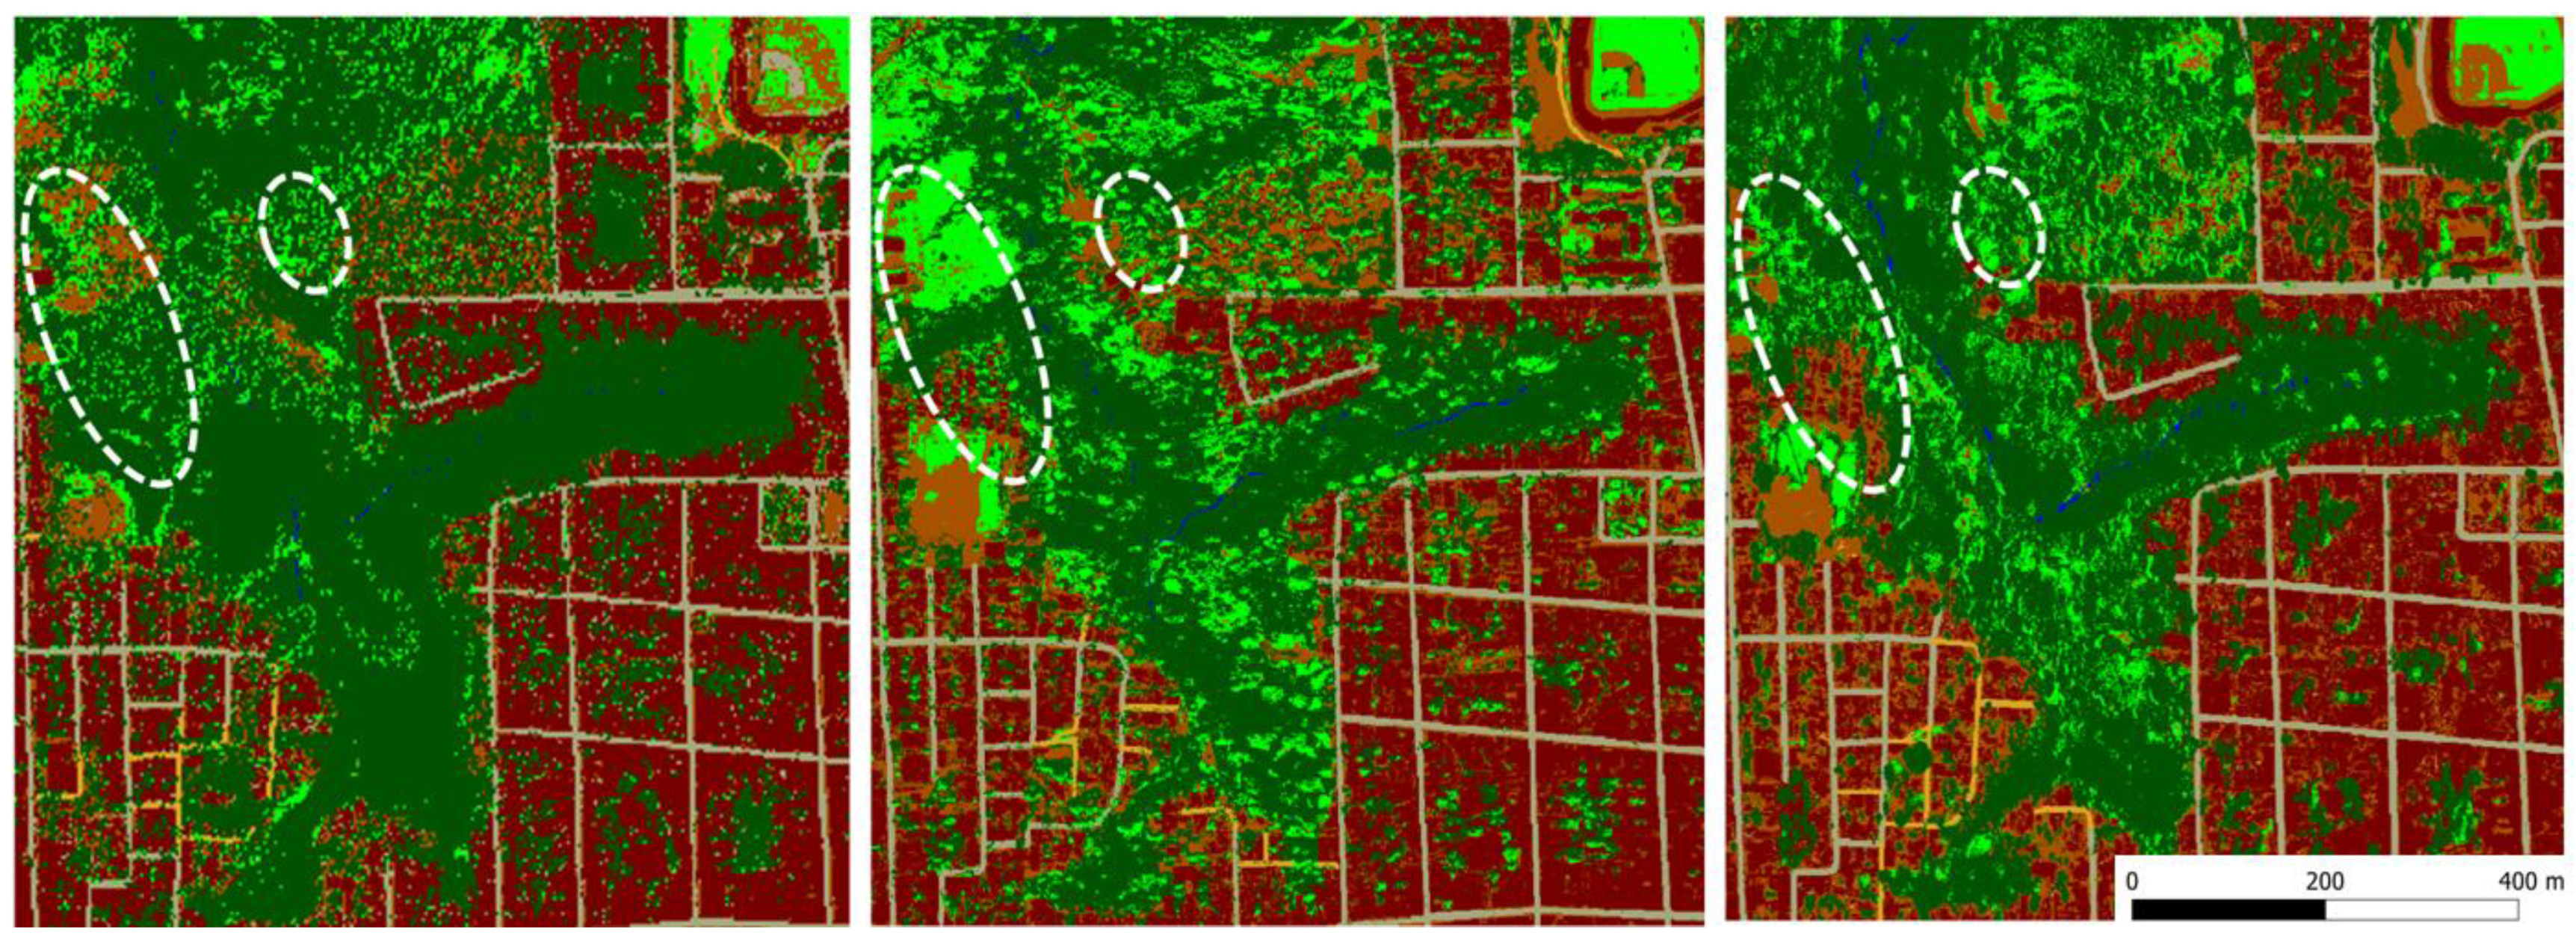
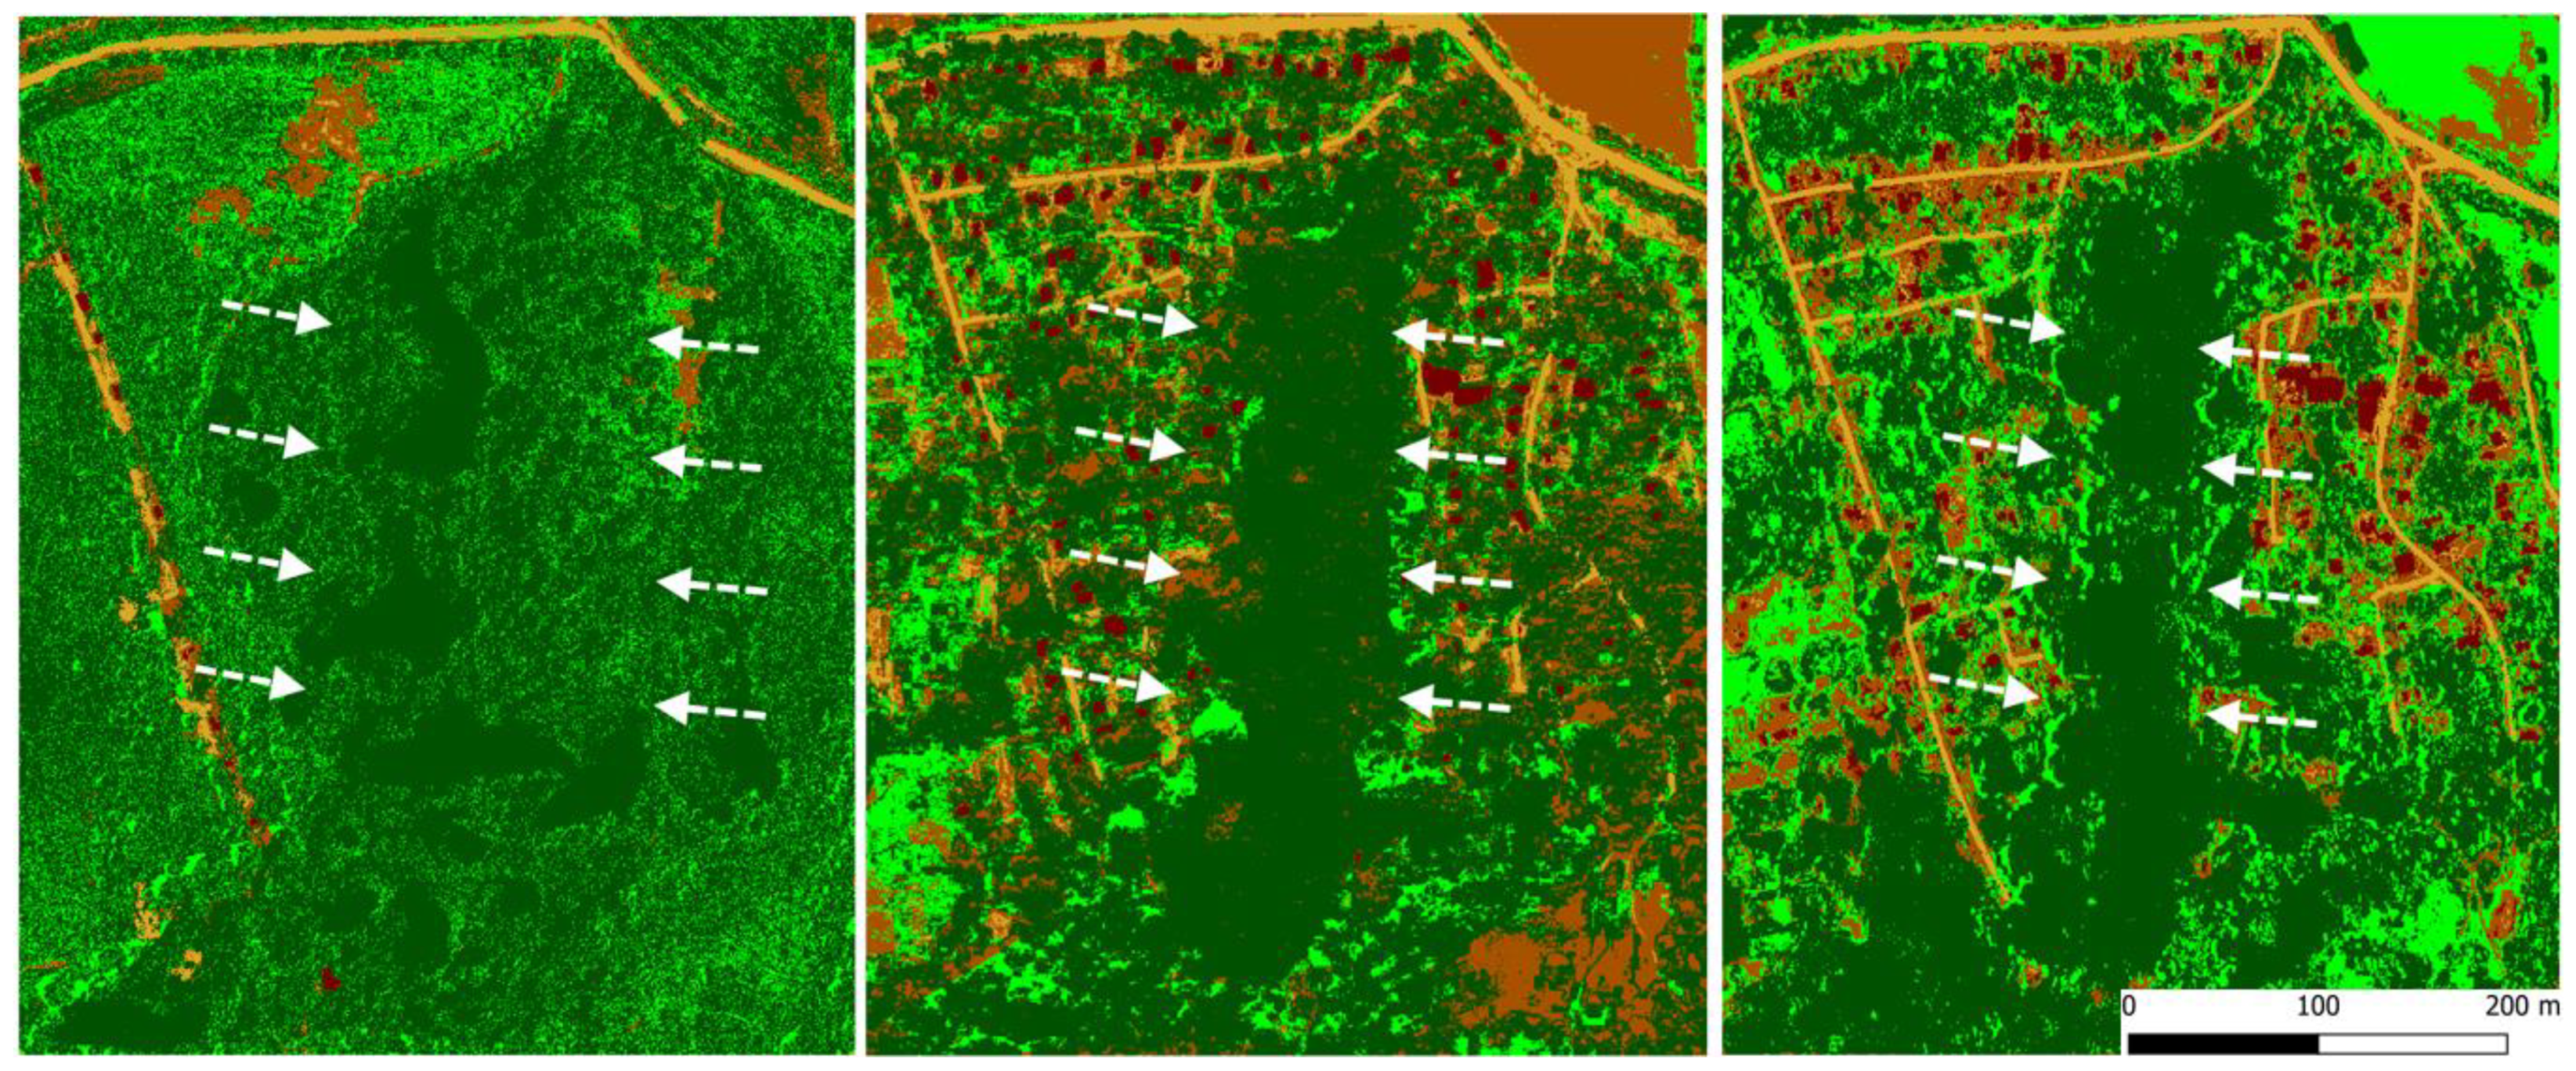
The high-resolution LULC classification at different times allows the identification of particular, small-scale processes and temporal dynamics too. Two small-scale processes are exemplarily described in the following: (1) The urban encroachment into the river source area and only remaining urban recreational space of high ecological value in
Figure 7. The construction of a group of buildings on both sides is approximately through the remaining vegetation separating the urban areas. (2) A forest (high vegetation) surrounding an important tributary of the Pochote river is disappearing due to increasing urban development east and west of it (
Figure 8).
These two examples show how the developed LULC classification can serve to identify dynamic and detailed processes of environmental degradation in order to plan tailor-made counteractions. The classification results allow not only a qualitative but also a quantitative assessment of these processes. The detailed high-resolution quantification can also be the basis for the quantification of population densities (based on building densities), degrees of surface sealing, and abundance of green spaces of different quality (high or low vegetation). This information is essential for sustainable urban development.
4. Conclusions and Recommendations
The methodology to classify high-resolution true color images provided by Google Earth Pro, and the proposed methodology to improve the classification qualifies for a detailed analysis and assessment of urbanization and environmental degradation processes in space and time, as well as for land use/land cover changes occurring in any other place. The increasing availability of satellite imagery allows one to detect and analyze even temporarily and spatially, very dynamic changes. Such high-resolution LULC classifications are necessary to take informed actions in order to reduce the detrimental impact of urbanization on the environment and human well-being. The described post-processing yields significant accuracy improvements and may compensate the disadvantage of having no multi-spectral information. Although some potential misclassifications may remain, e.g., between low and high vegetation, the dynamic and drastic changes in land use/land cover driven by today’s urbanization result in significant impacts on the environment. That could be shown with this study by comparing the three classification results of different times. For the study areas in Nicaragua, the results clearly identify advancing urbanization, the loss of vegetation, and threats to urban ecosystems. Hence, the lack of detailed information on the composition, structure, extent, and temporal change of urban areas in many parts of the world could be overcome with the presented classification system. This information can help to plan, design, and coordinate interactions for sustainable urban development without additional software or data costs.
For future applications, it should be evaluated whether a classification starting with generic macro classes of built-up area, vegetation, and bare land, followed by a classification of more specific classes (e.g., high vegetation and low vegetation, and bare land and unpaved) within macro class distinctions yields better results in terms of classification accuracy. The final superimposition with the methodology presented here could still be performed. We recommend the use of images from very similar dates when realizing interannual comparisons, because vegetation status and light ratios (presence and geometry of shadows) at different times of the year may differ significantly. Furthermore, image pre-processing, e.g., increasing brightness or contrasting images and reducing the color spectrum, can reduce misclassifications and misinterpretations of the LULC classes of different images.
