Article

Experimental Study on the Performance of an Innovative Tide-Induced Device for Artificial Downwelling

1
Ocean College, Zhejiang University, Zhoushan 316000, China
2
The State Key Lab of Fluid Power and Mechatronic System, Zhejiang University, Hangzhou 310027, China
*
Author to whom correspondence should be addressed.
Sustainability 2019, 11(19), 5268; https://doi.org/10.3390/su11195268
Submission received: 31 July 2019 / Revised: 16 September 2019 / Accepted: 24 September 2019 / Published: 25 September 2019

Abstract

:
Hypoxia has been increasingly observed in estuaries and coastal marine ecosystems around the world. In this paper, a tide-powered artificial downwelling device is proposed to potentially alleviate hypoxia in bottom waters. The downwelling device mainly consists of a vertical square tube, a 90° bend sitting on the top of the tube, two symmetrical-guide plates which installed alongside the vertical tube, a static mixer, and an artificial reef. Scale model experiments are performed with respect to different density difference heads, horizontal current velocities, and tube geometries. The results show that the downwelling flow rate is dependent on horizontal current velocity, tube geometry parameters, and the density profile of ambient water. In addition, increasing the equivalent diameter and bend radius of the device can decrease the total loss coefficient in the tube, which in turns enhance the downwelling efficiency. The two symmetrical-guide plates also generate obvious downwelling of surface water which further improves the whole performance of the device. Further work will need to determine the influence of the other parts of the device, such as the static mixer and artificial reef, on the downwelling efficiency.

1. Introduction

A lack of dissolved oxygen (DO) in water leads to a loss of aquatic biomass and a decrease in biodiversity, posing a threat to coastal ecosystems [1,2]. Various factors contribute to coastal hypoxia, mainly involving global climate change, eutrophication, water-column stratification and hydro geomorphology [2,3,4]. More than 400 persistently or seasonally hypoxic regions have been reported in the coastal waters of the world, covering an area of 245,000 km2, including the Baltic Sea, Black Sea, Changjiang Estuary, Gulf of Mexico, etc. [5].
Artificial downwelling is considered a promising way to mitigate bottom hypoxia. This practice can pump oxygen-rich surface waters into the oxygen-deficient bottom waters, strengthen the below-pycnocline ventilation, increase the dissolved oxygen concentration in the bottom waters and consequently mitigate bottom hypoxia. Artificial downwelling devices include thermal energy-powered devices, electric-powered devices, wave-powered and tide-induced devices [6,7,8,9] (Table 1). A density current generator (DCG) powered by solar energy and fossil fuel, with the aim of improving water quality in Gokasho Bay, was proposed by the University of Tokyo, Japan, in 2006 [6,10]. This device mixes surface and bottom waters and then discharges the mixture to a neutral-buoyancy depth at a flow rate of 120,000 m3/day. Long-term observations confirm the positive effects of the DCG in increasing the abundance and biomass of benthos and reducing the volume of hypoxic bottom water [11]. The Baltic deepwater oxygenation (BOX) project, using devices driven by the power from grid, takes By Fjord as an application site for implementing artificial downwelling engineering. A 2.5-year field test on a wind pump system with a downwelling flow rate of 2 m3/s resulted in great reductions in hydrogen sulfide, ammonia and heavy metal pollutants [7]. Moreover, ideas of using wave-powered downwelling have been experimentally proved to be effective to counteract deepwater hypoxia [8,12]. The Wave-Energized Baltic Aeration Pump (WEBAP), which collected overtopping water temporarily stored in a reservoir, was shown to pump oxygenated water to a depth of 80 m below the Baltic Sea level [12]. Besides, it was estimated that 750,000 m3 of surface water, corresponding to 5200 kg of DO, could be brought down to the bottom water of the Northern Adriatic Sea coast by using a wave-induced downwelling device entitled OXYFLUX [13]. Subsequently, a numerical analysis on the device using Computational Fluid Dynamics (CFD) was proposed to predict the pumping performance, the findings of which showed consistently accurate predictions with experimental results [14]. A tidal pump could pump surface oxygen-rich water to a depth of 15.36 m below the pycnocline at a flow rate of 0.4 m3/s in the Changjiang Estuary [9]. The device, named a tidal pump and consisting of a 90° bend and a vertical downwelling pipe, was designed to mitigate hypoxia in the Changjiang Estuary, China, where hypoxia frequently occurs below the pycnocline during late summer. The surface oxygen-rich water could be pumped in a depth of 15.36 m below the pycnocline at a flow rate of 0.4 m3/s for a 1.2 m pipe diameter.
Marine ranching is a new and upcoming activity in the marine environment and is of great significance to the development of the modern marine economy. Hypoxia of bottom waters, which threatens the ecological environment and economy in coastal zones, often happens in marine ranching in China. However, few engineering techniques have been reported so far to change the current situation. Fortunately, there are ample tidal energy resources in coastal hypoxia areas, which can be utilized to strengthen vertical water exchange in aquaculture zones. The authors have published one paper on a tidal pump for artificial downwelling, and the reader is referred to these for detailed information on the general principles of construction and the factors which affect it [9]. In this study, based on the theories of Xiao et al. (2018), we further optimized the structure of the tube, added the concrete base and mixer, thus enhancing the efficiency of the downwelling device and its applicability in marine ranching. Compared with the DCG and BOX engineering downwelling devices, the tide-induced downwelling device is simple in structure, convenient in processing, low in cost, and easy to implement, and which has the potential to be widely deployed and applied in marine ranching. This study mainly focusses on the presentation of a new conceptual design and the performance of the tide-induced device for artificial downwelling. Compared with other devices, the simplicity, lack of moving mechanical parts, cheap cost, and reliability are the important advantages that make the tide-induced device useful for applications where semi-diurnal tidal current widely exists.
This paper is organized as follows. First, the concept and design of the tide-induced device for artificial downwelling is proposed and theoretically studied, and then, we describe scale model experiments for different conditions of tidal current and stratification. Next, the experimental results and analysis are given, respectively. Finally, some conclusions are summarized.

2. Design of the Tide-Induced Device and Proof of the Concept

2.1. Design of the Tide-Induced Device for Artificial Downwelling
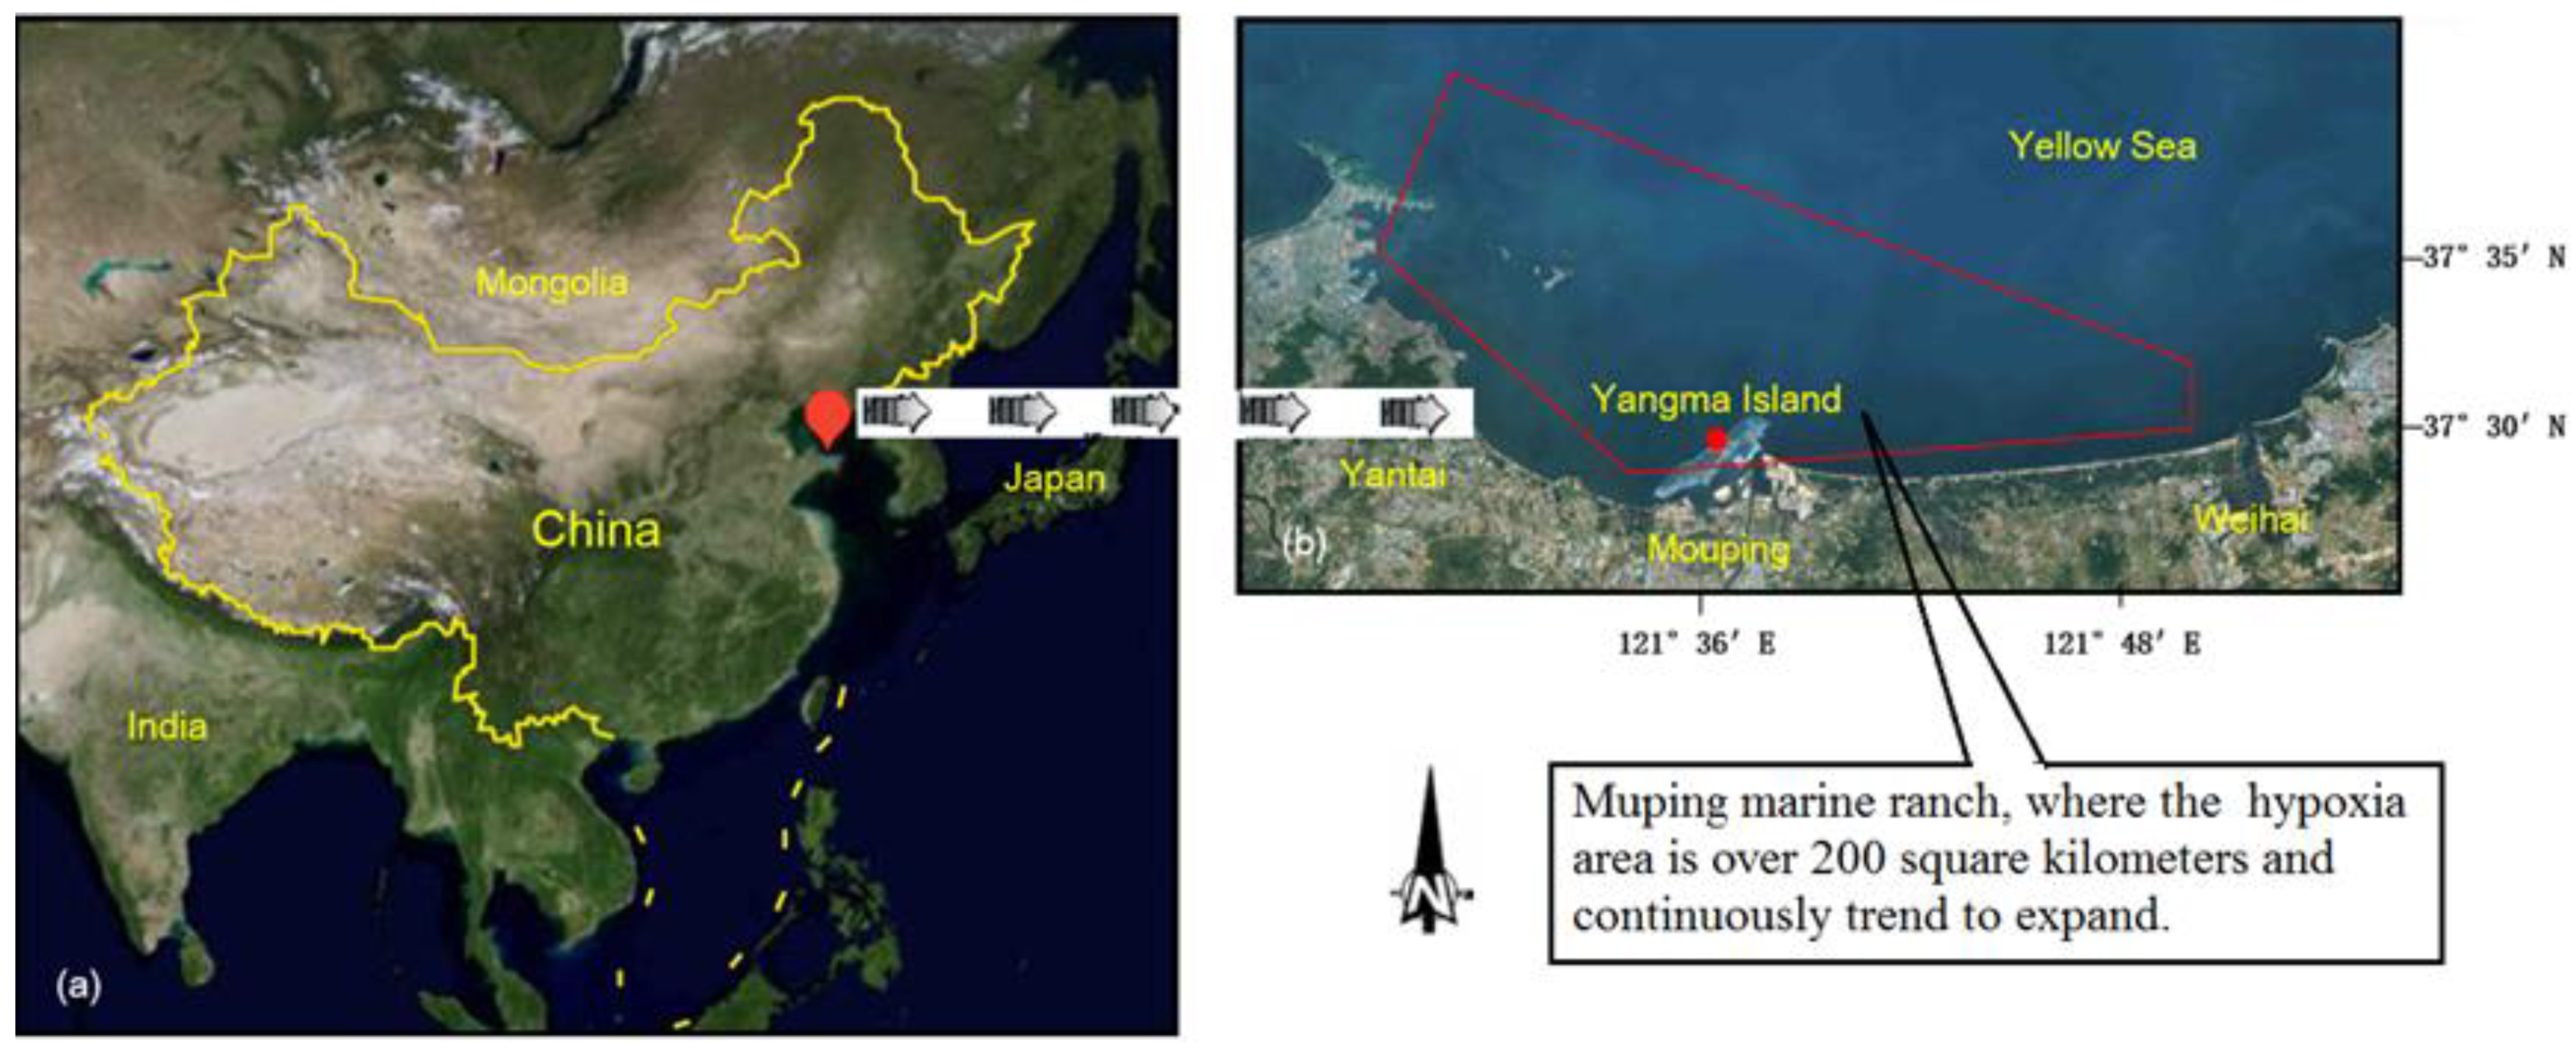
A less costly, reliable, and the easy-to-use device is badly needed to enhance the dissolved oxygen concentration in bottom waters of marine ranching. A novel tide-induced device has been designed for mitigating bottom hypoxia which often happens in marine ranching in China. Compared with the one previously proposed by Xiao et al. (2018), we found by experiments that the pump with rectangular section and auxiliary parts is more efficient in generating downwelling flow. Moreover, the current device has a concrete base, which is suitable for the shallow water system like Muping marine ranch, while the tidal pump given by Xiao et al. (2018) aims at deeper coastal oceans [9].
A sketch of the tide-induced device is presented in Figure 1. It consists of a 90° bend and a vertical square tube, a static mixer, an artificial reef and a buoy. The vertical square tube is made of PVC, a kind of polyvinyl chloride material, which is of antifouling property. Compared with the circular pipe, the square tube has a larger flow cross-section with the same equivalent diameter, and it is easy to install the two symmetrical-guide plates, which will greatly improve the efficiency of downwelling. Two symmetrical-guide plates are symmetrically fixed on both sides of the front wall of the vertical tubes, like wings, and they are aimed at alleviating the problem of flow around the downwelling flow outside of the tube. The upper end of the vertical tube is located above the thermocline and 5–10 meters below the sea surface. Although the device will not threaten shipping, it is not suitable for sea areas with ships. When passing over the 90° bend and the vertical square tube of the device, horizontal current decelerates because of the blocking effect. According to the Bernoulli principle, this deceleration increases static pressure at the entrance which, if large enough to overcome stratification, will drive downwelling flow in the device. There is a rear wing on the back of the vertical tube so that the tube is always facing the direction of the horizontal current. The end of the tube is connected with the venturi accelerator through a bearing that can rotate freely undercurrent force. The venturi accelerator is used to increase the flow velocity of the bottom current when passing through it. In the case where the current speed near the lower end of the tube is greater than that at the upper end of the tube, low pressure is generated near the bottom of the tube, resulting in adsorption. The water volume flow rate will be increased because of the pressure difference between the two ends of the tube.
One of the major obstacles limiting the development of artificial downwelling is the difficulty of trapping the oxygen-rich surface water at the bottom for quite a time. When the downwelled surface water is discharged through the tube outlet, mixing should be strengthened so as to increase the mixing with the hypoxic bottom water and raise the oxygen-transfer rate. In the Baltic deepwater oxygenation (BOX) project, Stigebrandt et al. (2015) proposed that the initial mixing at the outlet of the pipe was considered very important and it was performed by horizontal jets with the speed 2 m/s [7]. In this study, the static mixer is proposed with hope of increasing surface water/bottom water mixing and of preventing the warm, light, oxygen-rich surface water released near the bottom from simply rising again to the upper thermocline and the mixed layer. In doing so, the buoyant plume tends to be more turbulent because of the detouring of streamlines around the mixer. Different types of static mixer can be considered to improve the transfer of oxygen to the bottom water. Additional work will consider the effect of each mixer such as pressure drop, surface water residence time, and uniform distribution of surface water which should be investigated by experiments and CFD. This design concept, however, remains unconfirmed and deserves further study. It is efficient mixing equipment without moving parts that work by fixed mixing units to change the flow state of fluids in order to achieve good dispersion and full mixing between different fluids. However, the efficiency of the mixing by the static mixer is not investigated in the experiment. Since the mixing is very important for the transfer of oxygen to the deepwater, further work will have to determine the influence of the static mixer on the downwelling efficiency. The artificial reef is a submerged structure placed on the seabed deliberately to mimic some characteristics of a natural reef. In this design, it is not only considered an extra shelter for restoring habitats and a method for protecting seabed environments by preventing trawling, but also the base and anchor of the device. Concrete cubes are selected for the artificial reef construction because they are durable, low in cost, and allow ease of fabrication, handling, and mass production. The buoy is not strictly necessary, but it can be used for observation and data acquisition.

2.2. Study Site

The Muping marine ranch is located in the eastern end of the Shandong Peninsula, which is one of the most important mariculture regions in China (Figure 2). Many potential impacts of hypoxia on the sustainability of fishing and the economy in the Shandong Peninsula, China, have been reported. The marine ranch may be typical of severely stressed ecosystems there is currently burdened with severe seasonal hypoxia. Occurring in the bottom waters of the Muping marine ranch, hypoxia is associated with the high density of aquaculture and pollution and with the serious land-based pollution in summer. The ecosystems in the marine ranch have experienced drastic reductions in bottom fisheries due to hypoxia. Since the 2000s, increasing hypoxia has been blamed for the high mortality of the highly valued sea cucumber and huge economic losses [15].
Figure 3 shows the vertical distribution of temperature and salinity on 21 August 2016. There was a thermocline at 12–18 m in the ocean, which is sandwiched between the upper mixed layer of warmer water and the lower, colder layer of water. The interannual variation in the thickness of the summer pycnocline is 4–8 m. It is worth mentioning that the inlet of the fixed-length tube should be above the pycnocline. Setting the minimum length of the tube in this way ensures its inlet in the surface mixed layer, which will pump oxygen-rich surface waters into deeper layers and not threaten shipping. The temperature of the seawater ranges from 22.2 to 27.8 °C and the density of the seawater has a range from 1019.6 to 1021.7 kg/m3. Hence, as shown in Figure 3, the maximum temperature difference is 5.6 °C, which contributes significantly to the vertical density stratification (the maximum density difference is 2.1 kg/m3). Figure 4 presents the time series of the observed oxygen concentrations and temperatures of the upper mixed layer, middle layer and bottom layer in summer 2016, respectively. As can be seen from Figure 4, 27 August is an important time point. The stratification of temperature and DO concentration is more obvious in the days before this time point, which leads to hypoxia. This is attributed to the weakening of seawater mixing as the wind fades. After this time point, the mixture of seawater is stronger with the enhancement of wind power, which increases the vertical exchange of water, so that the seawater is balanced and the hypoxia is resolved. The vertical density stratification, low water exchange rate and suitable water temperature and salinity in the aquaculture area are important physical conditions for the dramatic decrease in DO in Muping marine ranch. The DO decreased rapidly from 3.0 mg/L on 15 August to reach a minimum value of 0.1 mg/L on 21 August 2016. Then, anoxia occurred, and the highly valued sea cucumbers that were cultured in the bottom seawater of the Muping marine ranch were killed on a large scale due to oxygen deficiency.
Tidal currents, which are distributed widely in the offshore area of China, are caused by the gravitational pull of the moon and the sun. They carry an enormous amount of energy, which is sustainable, widely distributed, and highly predictable. The Muping marine ranch has over 900 km of shorelines and a very rich tidal resource [16]. It is estimated that the average power available from the tidal currents in the Muping marine ranch exceeds 704 MW [17]. The power density in most of the water area is 3–9 kW/m2, and thus this area is very suitable for tidal current energy exploitation and the implementation of artificial downwelling. The kinetic energy originated from tidal current could be utilized to overcome stratification by downwelling in order to alleviate seasonal oxygen depletion in the bottom water.

2.3. Theoretical Analysis

The principle of energy balance (Equation (1)) has been successfully applied to the artificial vertical disturbance of the marine environment [13,18]. This principle can be formulated as the kinetic energy head is equal to the sum of the density difference head and all the local losses. It has been extended for artificial downwelling to analyze the turbulent flows without regarding the explicit structure of the flow distribution [9]. The energy balance equation can be written as follows.
m a x ( h k h ρ , 0 ) = h f
where h k is the kinetic head of horizontal current, h ρ is the density difference head, which can be calculated by integrating the relative density difference of the density profile along the length of the vertical tube [19], and h f is the total head loss of fluid motion.
h k can be calculated by v h 2 2 g , where v h is the horizontal current velocity through the upper bend inlet to the vertical tube, and g is the gravity acceleration.
h ρ is the required head to overcome the density difference between the inlet and outlet of the tube. The density difference head along the downwelling tube can be expressed by the following integral equation:
h ρ = z i z o ( ρ ( z ) ρ i ) ρ i d z
where the subscript “i” and “o” denotes the inlet and outlet of the vertical tube, respectively, and z i and z o are the water depths at the inlet and outlet of the vertical tube, respectively. ρ i is the density of water at depth   z i , and ρ ( z ) is the water density at the variable water depth z, which is a vertical density profile function.
h f is defined as the total head loss produced by devices and blocking effects such as enlargement, contraction, the tube bend and marine organisms attached to the downwelling tube, which hinder the flow in the tube [18].
h f = ( λ L D e + ξ c + ξ i n + ξ o u t ) h d
where h d can be given by v d 2 2 g , which is the downwelling kinetic head, and v d is the average velocity of downwelling flow inside the vertical tube. L and D e are the length and equivalent diameter of the tube, where D e can be defined by the following expression [20,21].
D e = 4 A c χ = 4 R s
where A c is the cross-sectional area of the overflow, χ is the wetted perimeter, and   R s is the hydraulic radius. For rectangular sectional tubes filled with fluid, when the length of the rectangle is less than or equal to 8 times the width, the equivalent diameter can be written in a new form [20].
D e = 4 a b 2 ( a + b ) = 2 a b a + b
where a and b are the length and width of the rectangular section, respectively.
λ is the Darcy–Weisbach friction factor along the tube, related to Reynolds number and relative roughness. For the hydraulic rough tube of the turbulent process, it can be derived from the Colebrook–White equation.
  1 λ = 2.0 l g ( 2.51 R e λ + Δ 3.7 D e )
where Δ is the absolute roughness of the inner wall of the tube, which is related to the material of the tube and the state of the inner wall. Re is the criterion for determining fluid flow state given by
R e = ρ i v d D e η
where η is the dynamic viscosity of water, mainly related to temperature, and can be approximated by the following empirical formula [22,23].
η = η 0 1 + 0.0337 t + 0.000221 t 2
where η 0 is the dynamic viscosity of water at 0 °C and t is the temperature of the water.
The Reynolds number of the downwelling flow in the prototype ranges from 5 × 10 4 to 6 × 10 5 , so most of the water flow in the downwelling tube is typically turbulent flow. ξ c is the local loss coefficient produced by the tube bend [18].
ξ c = 0.217 R e 0.17 [ 0.95 ( 2 R D e ) 0.84 + 17.2 ( 2 R D e ) 1.12 ]
where R is the radius of the centerline of the bend. ξ i n is the entrance frictional loss coefficient, which is ignored because there is no tendency to distort the flow line or lead into turbulent vortices into the upper inlet. In this study, because the tube has a certain thickness, the flow cross-section inside the tube is smaller than the actual external cross-section of the tube, so the flow velocity will increase as the flow cross-section area decreases. Therefore, due to the sudden contraction effect at the entrance, it is necessary to correct the horizontal velocity. ξ o u t is the exit frictional loss coefficient of stationary bottom water equal to 1. So far, Equation (10) can be developed by substituting all terms into Equation (1).
m a x ( h k h ρ , 0 ) = h d ( λ L D e + ξ c + 1 ) = ξ t h d
where ξ t is the total loss coefficient associated with the Reynolds number and tube geometry. Assuming that the material of the vertical tube is PVC, the relative roughness of the inner wall of the vertical tube is 0.0003. The relationship between Reynolds number and total loss coefficient is shown in Figure 5. As the Reynolds number increases, the dynamic viscosity decreases, which means that the viscous force is weakened, thereby mitigating the degree of reduction of the loss coefficient. Therefore, when the Reynolds number increases by 12 times, the overall loss coefficient only reduces by 8.5% due to the weakening of the viscosity force.

3. Experimental Setup and Methods

3.1. Facility and Setup

In order to investigate the performance of the novel tide-induced device for artificial downwelling, scale model experiments were carried out in a two-layer stratified flume, 12 m long, 0.6 m wide and 1.8 m deep, at the Hydraulics Laboratory at Zhejiang University, China. Figure 6 is a schematic diagram of the experimental setup. As shown in the schematic, the experimental apparatus consists of the flume, a downwelling device, different kinds of measuring facilities, and other auxiliary facilities. The flume is capable of generating constant horizontal currents for different velocities by changing the inlet water flow rate and the opening degree of the outlet water valve. The upper layer and lower layer of the flume are separated with a stainless steel plate, each layer is equipped with a flow pump driven by an electrical motor with a maximum flow rate of 1300 m3/h. The horizontal current velocity of the simulated tidal current generated by the flow pump ranges from 0.01 m/s to 1.0 m/s. Due to the vibration characteristics of the pump, it is necessary to install a set of honeycomb tubes with a height exceeding the water level to suppress fluctuation and smooth turbulence of the inflow water. The two-layer model of the flume simulates the basic features of natural stratification. The model of the downwelling device is scaled according to Froude’s Law on a scale ratio of 1:10. It consists of three main parts, which are made of transparent PVC plates: (i) a vertical square tube, (ii) a 90° bend sitting on top of the tube, and (iii) two symmetrical-guide plates, which are installed alongside the vertical tube (Figure 7).
Two-layer fluids were generated by salinity differences using the two-tank method of Oster [24]. The salty water was prepared by mixing industrial salt and freshwater. The industrial salt was weighed by an electronic scale in ± 0.1 g accuracy, a tool for determining the mass of objects by using Hooke’s law or the principle of lever balance of force. Due to the large size of the flume, this procedure took a period of 2 h for each filling of the flume.

3.2. Flow Measurements

For measuring the horizontal flow velocity at the tube inlet with portable flow velocity, a measuring instrument was used (LS300-A, Nanjing Zhuoma Electrical and Mechanical Co., Ltd., China), which is designed according to the principle of velocity area method for measuring flow in an open channel. Its measuring range is between 0.01 m/s and 4 m/s, and the measuring error is less than or equal to 1.5%. It can be used to measure the time-average velocity of predetermined measuring points in the flowing water in hydraulic investigations and experiments. Due to the existence of the thickness of the tube, there will be a velocity difference at the inlet of the tube. According to the flow continuity equation, the flow rate on any flow cross-section in the tube is equal, so we can modify the horizontal current velocity according to the flow area and actual area of the cross-section, and then obtain the final result. Table 1 lists the average and modified values of the horizontal current velocity. The modified velocity is derived from the following equation.
v h = A a A c × v a = ( a + 2 e ) ( b + 2 e ) a b × v a = ξ r v a
where A a is the actual area of the section, A c is the flow area of the cross-section, e is the thickness of the tube, v a is the average horizontal flow velocity measured by the velocity measuring instrument, and ξ r is the modified coefficient of horizontal current velocity. The cross-sectional dimensions of the tube are marked in Figure 7b.
By slowly releasing black ink about 15 cm in front of the entrance of the tube, the downwelling process can be traced. The ink is released from a 30-ml syringe that has a needle perpendicular to the incident flow, dying the downwelling flow in the tube. Since the trajectory of the ink head can be easily captured by a camera, a fine definition camera (Sony, HDR-PJ675, China, 2015) is installed on the side of the tank to record the video sequence of the ink head in the tube. The camera uses a 1/5.8 inch Exmor R CMOS image sensor with a total of 2.51 million pixels and a sampling rate of 25 fps and has the characteristics of low dispersion, high contract and background virtualization. In order to enhance the color contrast between the ink and the background, an LED flat light source is used at the top. The average rate of decline of the flow can be calculated by the moving distance divided by the time interval of the ink head. We can obtain the average velocity of the downwelling by dividing the distance of the ink head by the time interval.
Images are captured of the ink head just reaching the exit of the bend and the lower end of the tube. The time interval between the two images is obtained by video processing software, and the distance from the bend outlet to the lower end of the tube is measured, so the downwelling flow rate is finally obtained. In order to reduce the experimental error, four experiments were conducted to obtain the average value. The descending process of ink in the tube is shown in Figure 8a. The needle is moved down and the ink is released about 15 cm in front of the guide plate. Figure 8b shows the downwelling outside the tube, which indicates the effectiveness of downwelling induced by the guide-plates. The guide-plates symmetrically installed on the front wall of the tube may also induce downward flow. The horizontal current decelerates because of the blocking effect. According to Bernoulli principle, this deceleration increases static pressure at the guide-plates and the tube which, if large enough to overcome stratification, will drive downwelling flow outside the tube. The experimental results show that this will approximately double the downwelling flow rate of the device. Further work will focus on the optimal designs of the guide-plates which will make further efforts to increase the downwelling flow rate of the device.

3.3. Similitude Design

The purpose of the flume experiments is to investigate the performance of the tide-induced device for artificial downwelling in a real sea area, so the similitude between the scaled model and prototype has to be considered. Similar theories and methods, including geometric, kinematic and dynamic similarity, need to be achieved. Geometric similarity requires the ratios of all corresponding dimensions in both the model and the prototype to be equal. Dimensions of tubes are designed according to environmental conditions such as the thickness of hypoxia water body and depth of the thermocline. The scaled dimensions include the lengths h 0 , h 1 , h 2 , and L and the diameters D e , and R.
D r = D e p D e m = R p R m = L p L m = h 0 p h 0 m = h 1 p h 1 m = h 2 p h 2 m
where h 0 is the mean water level, h 1 is the immersed length of the tube below the pycnocline, h 2 is the depth below the pycnocline. Among them, subscripts m and p represent models and prototypes, respectively. D r is the conversion ratio of the prototype to the model, which is designed to be 10:1 considering the size and velocity range of the flume. The subscript r represents the ratio from prototype to model.
In the situation of tide-induced artificial downwelling, gravity and inertia forces are dominant and the effect of remaining forces such as kinematic viscosity is comparatively small. In order to capture this dynamic characteristic, dynamic similitude needs to keep the Richardson number, one of the dimensionless numbers in fluid mechanics, equal in both the model and the prototype, which is given by [25]. It is a similarity criterion number that must be considered in the flow in which gravity and inertial force play an important role to ensure the similarity of the two flows.
R i = Δ ρ g H ρ U 2
where Ri is the non-dimensional Richardson number, U is the typical velocity of the horizontal current, Δ ρ ρ is the relative density difference and H is the thickness of the dense bottom water, while g is the gravitational acceleration.
Ri can also be expressed as half of the density difference head and the kinetic energy head of horizontal current is h ρ 2 h k . The dynamic similarity can be represented by the equivalence of the Richardson numbers of the prototype and the model.
R i m = ( ρ o m ρ i m ) g h 2 m ρ i m v h m 2 = ( ρ o p ρ i p ) g h 2 p ρ i p v h p 2 = R i p
The ratios of relative density and horizontal velocity between the prototype and the model are designed as 1:1 and 10 :1 respectively. All variables related to the downwelling flow can be converted between the model and the prototype. Therefore, the downwelling flow rates in the prototype can be obtained by multiplying the measured downwelling flow rates in the model by the following coefficients.
Q d r = v h r D r 2
where Q d is the downwelling flow rate in the tube. The prototype and model parameter values are summarized in Table 2. A summary of the experimental parameters is listed in Table 3.

3.4. Experimental Procedure

A set of experiments was carried out in the flume at different density differences and horizontal current velocities with models of different sizes. The test procedure for the experimental study on the performance of the tide-induced device for artificial downwelling is as follows:
  • The salted water is configured by mixing industrial salt and freshwater, and then the water temperature and salinity are measured with a thermo-salinity meter. The measured value can be used to determine the density of seawater from the equation of state for seawater.
  • Turn on the water tap and pour fresh water into the flume to maintain the water level at a depth of 180 cm.
  • Start up the pumping system and open the camera to record the process of the downwelling flow inside and outside the tube. During this phase, the horizontal flow velocities are set from 0.05 to 0.15 m/s. Ink can not be injected in front of the inlet of the device until the flow is stable, and the ink head should be on the same horizontal line as the inlet.
  • Repeat steps 1–3 for the three different density difference heads of 0.02001 cm, 0.04004 cm and 0.06005 cm in the experiment.

4. Results and Discussion

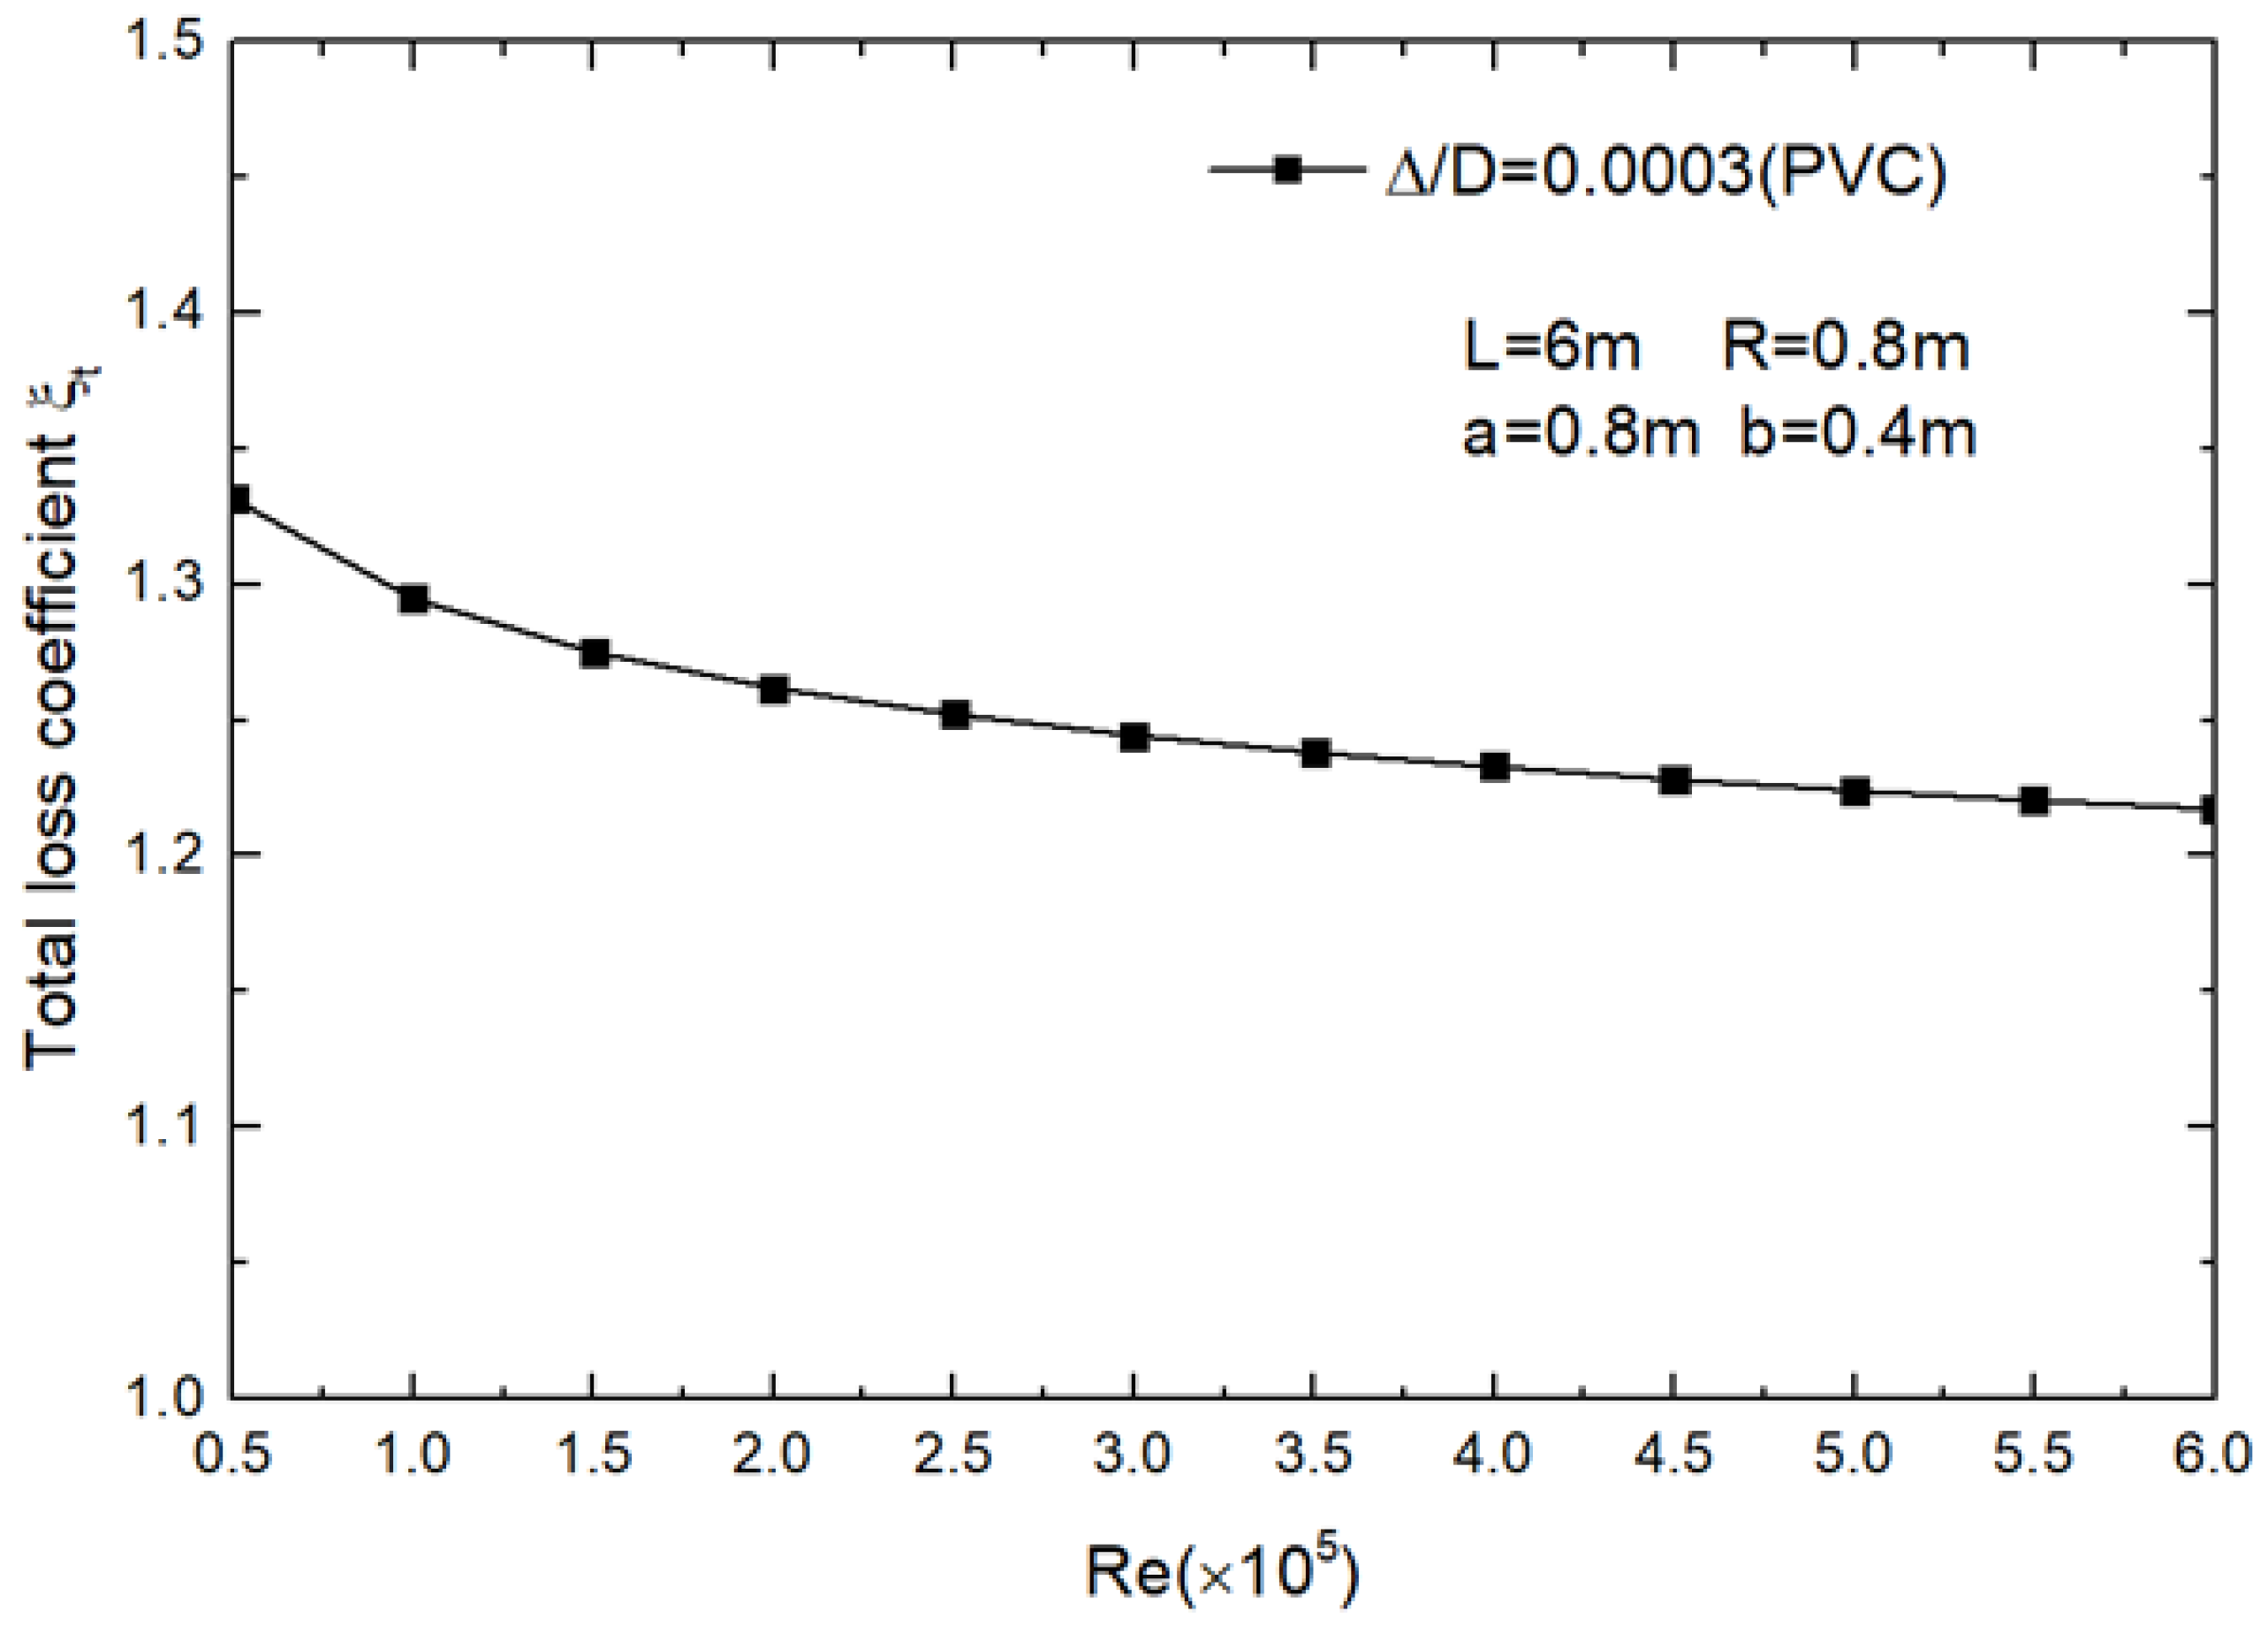
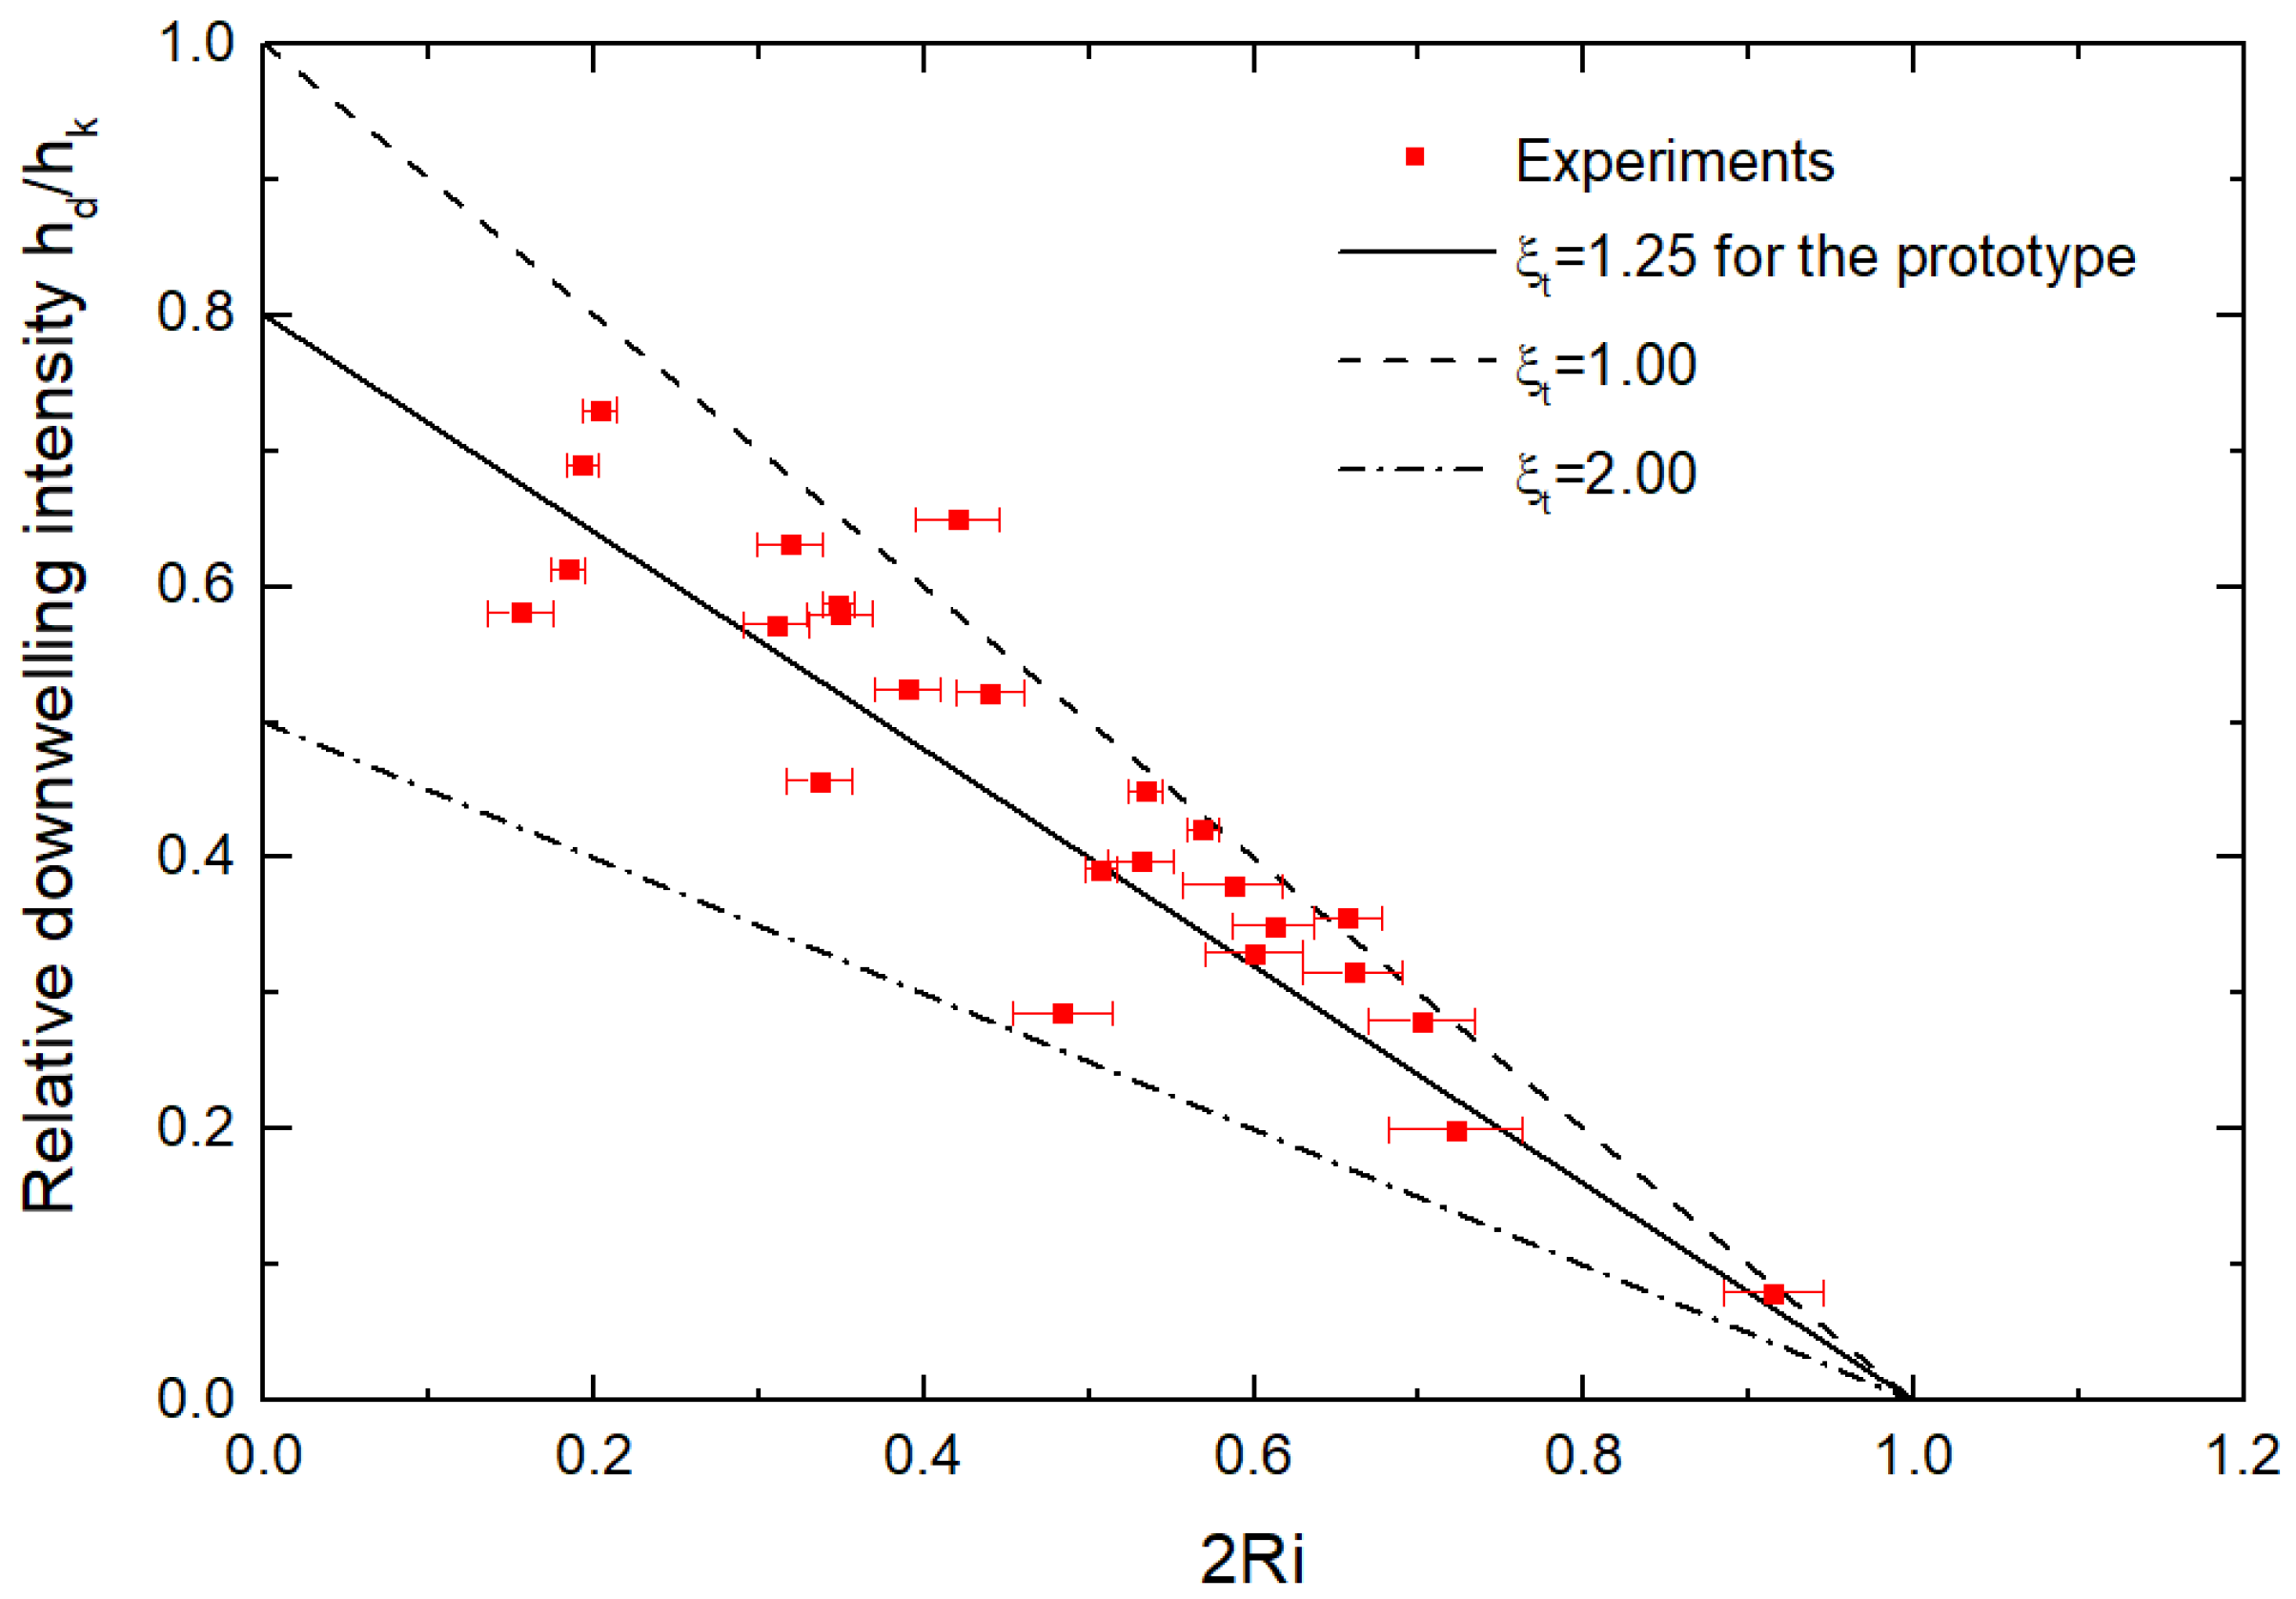
4.1. Validation of the Theoretical Model

The ratio between the downwelling kinetic head and the horizontal current kinetic head indicates the intensity of downwelling flow. It is strongly dependent on the dimensionless Richardson number Ri = h ρ 2 h k as follows, which is dynamically critical for current-induced downwelling [9].
h d h k = 1 ξ t max ( 1 2 R i , 0 )
Here, h d and h k are the downwelling kinetic head and horizontal current kinetic head, respectively, ξ t is the total loss coefficient, near a constant value of 1.25, as read from Figure 5. The validation of the theoretical model can be verified by comparing the experiments with theoretical results. Figure 9 suggests that the experimental results are basically consistent with the theory, confirming the validation of the physical model in predicting the current-induced downwelling flow. As Ri increases, the effect of stratification becomes more obvious, and the intensity of the downwelling flow decreases proportionally (Figure 10). The downwelling flow disappears once Ri is greater than 0.5.
The majority of positive deviations are probably attributable to the diffusion of the ink head and the scale effect of dimensionless characteristics. In each set of experiments, because the brine is continuously diluted by the water exchange between the upper and lower layers of the tank, the density difference decreases, and this, in turn, reduces the stratification resistance and leads to a stronger downwelling flow. The higher the horizontal current velocity, the faster the water exchange rate between the upper and lower layers, resulting in more serious dilution.
The influence of the scale effect on the experimental results may be properly illustrated by the results for the total loss coefficient and Reynolds number shown in Figure 10. The experimental results in Figure 10 show that with the increase in the Reynolds number, the total loss coefficient still has an obvious decreasing trend, and in most case, the Reynolds number is larger than the assumed constant coefficient in the prototype, indicating the positive deviation between the experimental results and the theory. It is then plausible to have positive deviations between the experimental and theoretical results.
To better understand the performance of the tidal tube, the downwelling flow rate is discussed in the next few sections with respect to the horizontal current velocity, relative density difference, immersed length, and tube geometrical dimensions. With this in mind, Equation (16) can be rewritten as the following equation to better understand the downwelling flow rate.
Q d = a b v d = a b ξ t v h 2 2 g h ρ
where v d is the average downwelling flow velocity in the tube and h ρ can be further expressed as the relative density difference and the immersed length of the tube below the pycnocline.
h ρ = ( ρ o ρ i ) ρ i h 1

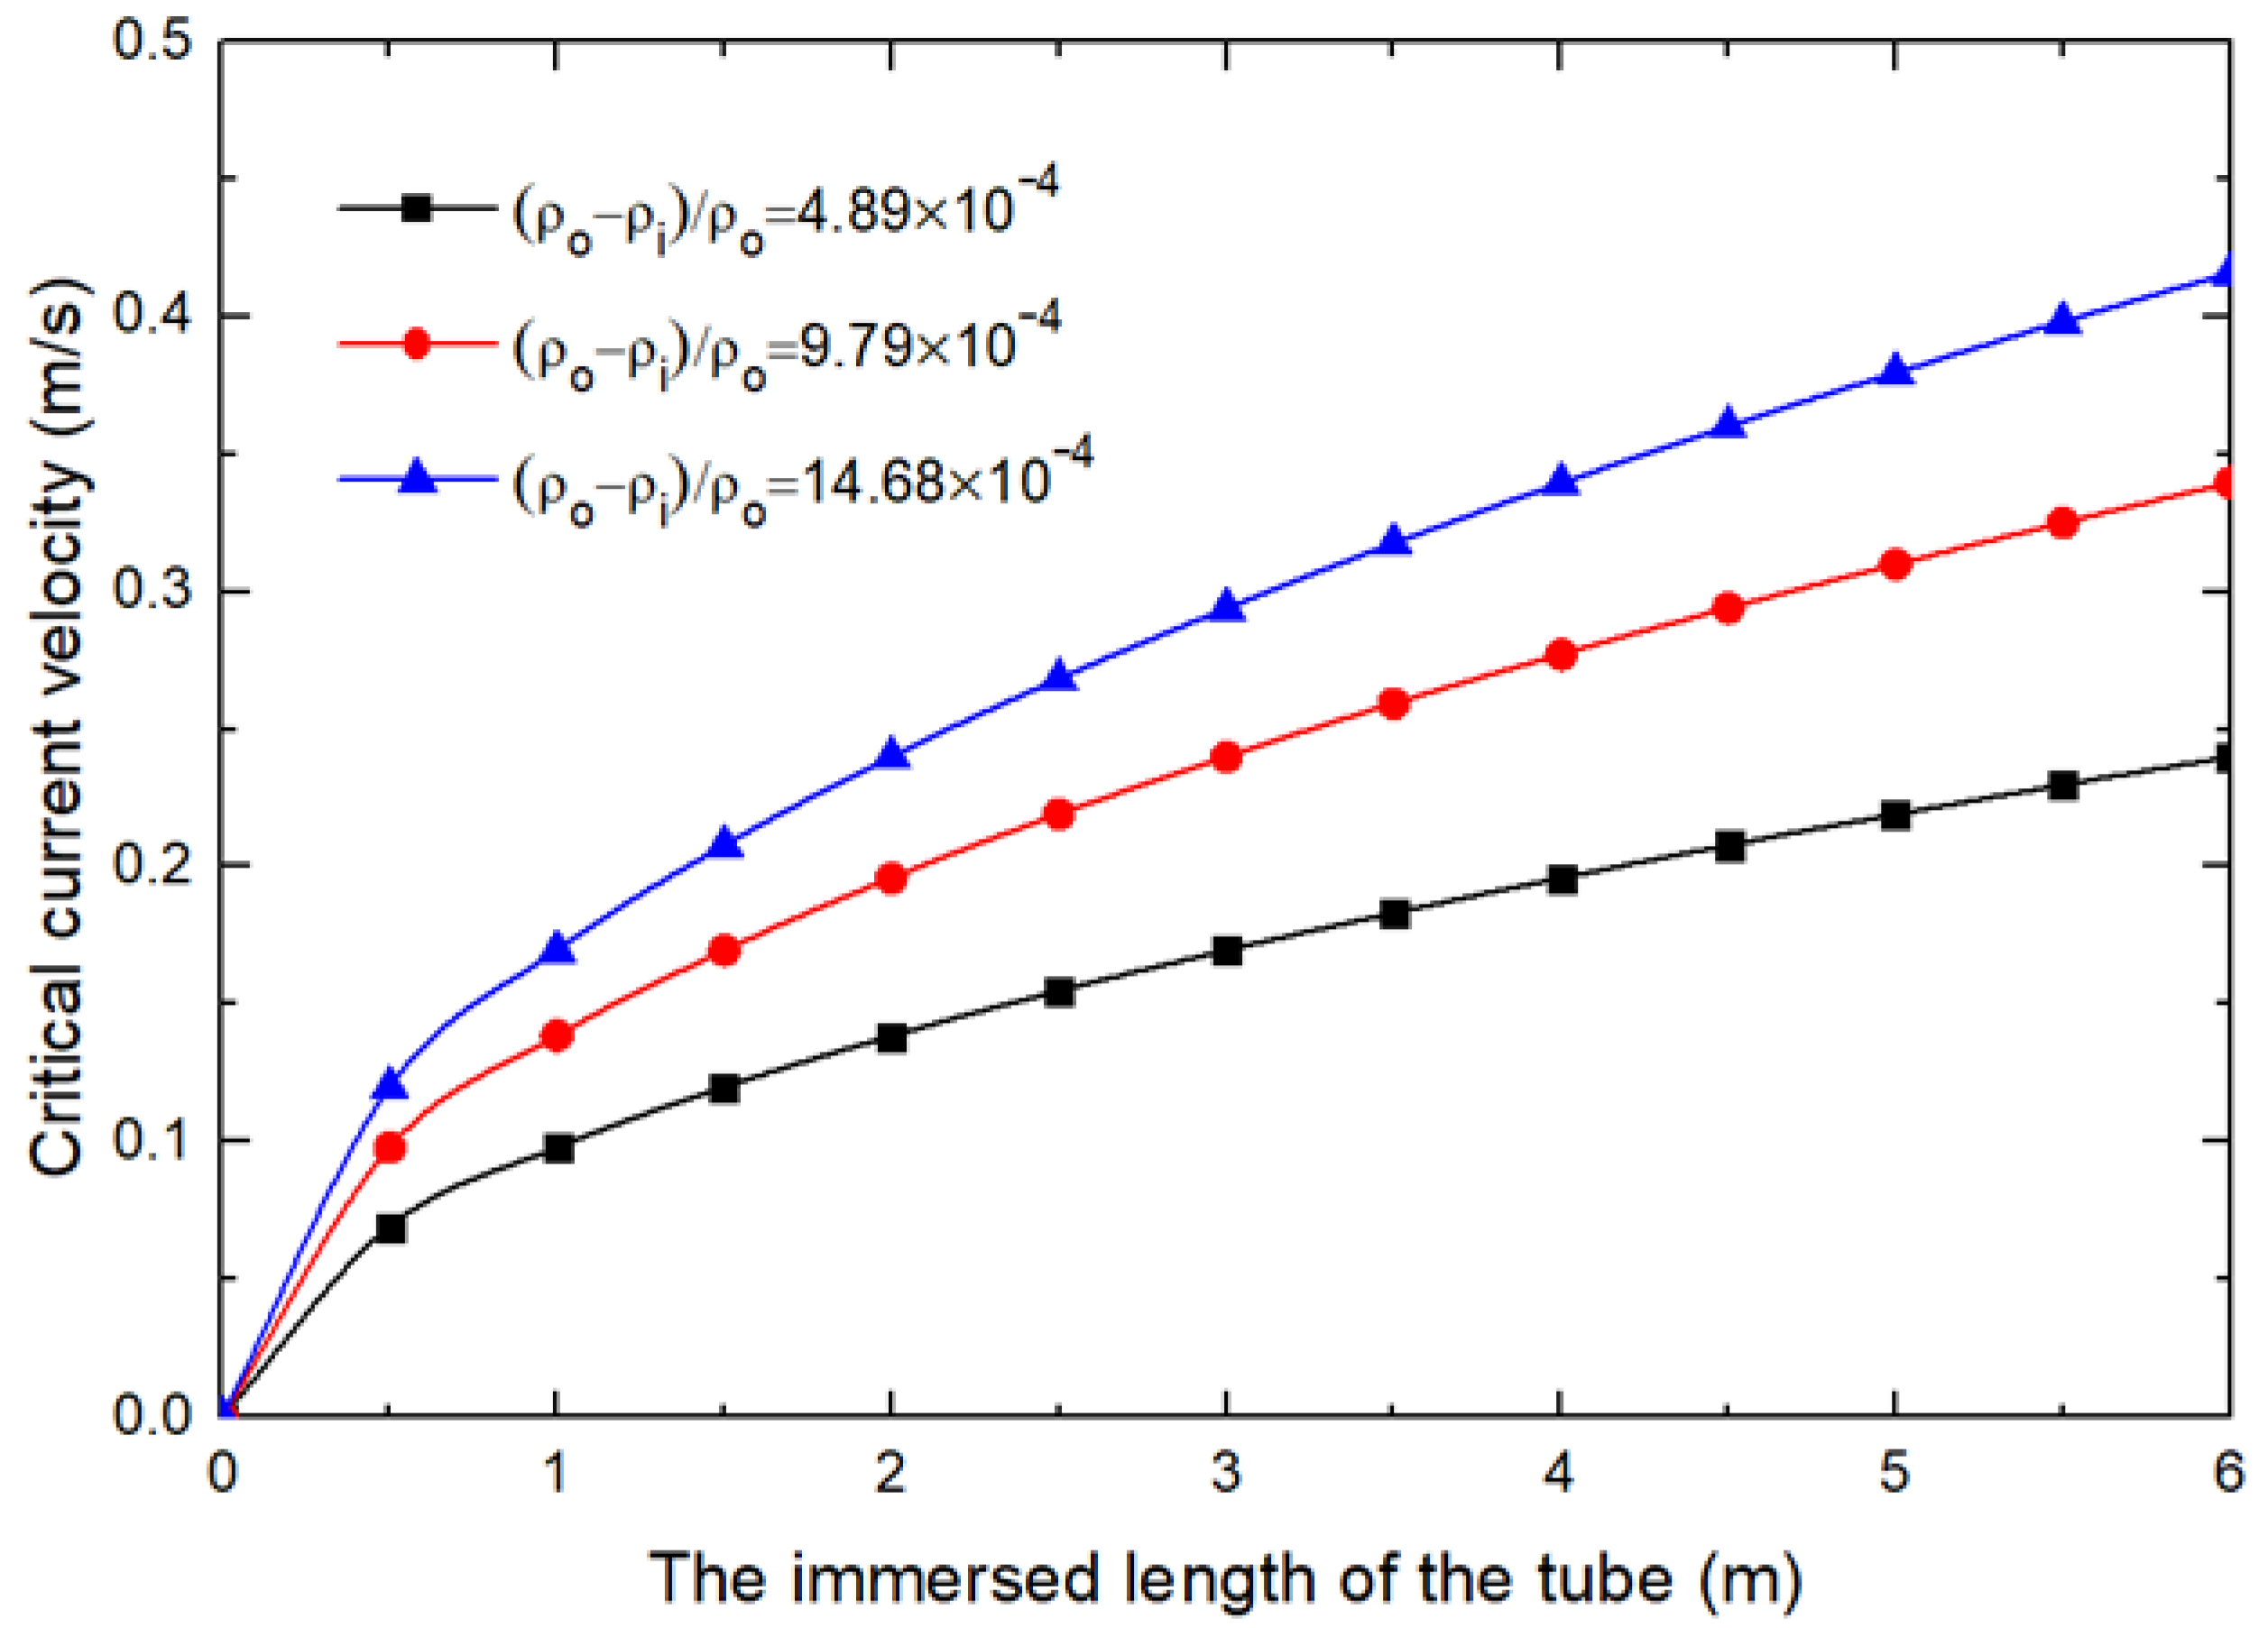
4.2. Effects of Immersed Length below the Pycnocline on Critical Current Velocity

To ensure the downwelling flow in the tube, we introduce the concept of critical current velocity, which can also be called minimum horizontal velocity. It is the minimum horizontal current velocity, which overcomes the stratification resistance and generates downwelling flow, with the variation of the density difference of surrounding water and the length of the tube immersed below the pycnocline. The immersed length of the tube below the pycnocline is an adjustable engineering parameter that is not determined by the environment. With an invariable density difference, the immersed length of the tube mainly affects the critical current velocity. The critical current velocity v c to generate downwelling flow can be expressed as the following equation, which originates from Equation (1).
v c = 2 g h 1 ( ρ o ρ i ) ρ i
The critical current velocity increases with the increase of density difference and immersed length of the tube. The length of immersion also affects the development of the buoyancy plume formed by the downwelling flow into the bottom, the main obstacle being the strong dilution of the surrounding water and the buoyancy plume re-entering the surface water. A smaller immersion induces a greater downwelling flow due to the smaller stratification resistance. As the application is a marine ranch where hypoxia often occurs, the tidal current velocity in most waters is about 0.2–0.4 m/s. If available, the current velocity is maintained for only a short period of time during the summer. However, it is anticipated that a sustained downwelling flow will be required to inject into hypoxia waters. In an attempt to solve this problem, a feasible method is to reduce the immersed length by raising the tube, otherwise auxiliary power supply is needed to overcome the stratification. As can be seen from Figure 11, the critical current velocity decreases with the decrease in the immersed length and eventually becomes zero when the bottom of the tube reaches the pycnocline. Therefore, continuous downwelling flow is viable to implement as long as the tube layout is reasonable.

4.3. Effects of Horizontal Current Velocity on Downwelling Flow Rate

Figure 12 shows the relationship between downwelling flow rate and horizontal tidal current velocity for different relative density differences and different tube geometries. The curves in each panel show a similar increasing tendency of downwelling flow rate with horizontal current velocity. Relatively small horizontal current velocity is unable to generate downwelling flow since it fails to overcome the stratification and there exists internal loss in the tube. As current velocity increases, the downwelling flow rate initially gains a sharp increase and then levels off. Increasing relative density difference raises the critical velocity for the horizontal current to generate downwelling flow. However, the critical velocity is barely sensitive to the tube size, which in contrast dramatically changes the downwelling flow rate. In practical engineering, the size of the tube should be designed according to the limitations of the environmental conditions.

4.4. Effects of Relative Density Difference on Downwelling Flow Rate

In Figure 13, the relationship between the downwelling flow rate and the relative density difference in the prototype is plotted. The downwelling flow rate drops down with the increase in the relative density difference because part of the kinetic energy of the horizontal flow is used to overcome stratification. Each horizontal current velocity corresponds to an effective range of relative velocities that allow downwelling flow to be created. This range is namely between zero and the point at which the curve outcrops the transverse axis. As the relative density difference varies from 0 to 0.0022, the downwelling flow rate ranges from 1200 to 0 m3/h for various tube sizes.

4.5. Effects of Tube Geometrical Dimensions on Downwelling Flow Rate and Efficiency

Figure 14 shows the effect of tube geometrical dimensions on downwelling flow rate and total loss coefficient when the sum of the tube length and bend radius is 6 m. The downwelling flow rate increases almost linearly with the increase in tube diameter, while the total loss coefficient decreases because of less frictional loss. Under vigorous tidal current conditions, however, a tube with a large diameter may be susceptible to distortion or deformation. Combining the two above factors, the tube diameter should be selected to be as large as possible within a safe limit.
A bend radius that is too small causes a greater pressure drop at the bend. This increases the total loss coefficient and reduces the downwelling flow rate, which is unsatisfactory. As the bend radius changes from 0.1 to 1.9, the total loss coefficient increases by 61%, resulting in an increase of 62.5% in the downwelling flow rate. Similar to the way the tube diameter is determined, the bend radius of the tube should be reasonably large such that safety is guaranteed.

4.6. Evaluation of Engineering Effect in Muping Marine Ranch

Field data from Figure 3 and Figure 4 indicate that the concentration of dissolved oxygen at the bottom is around 1 mg/L while 5 mg/L at the surface, temperature difference between the upper and lower layers is up to 2 °C, i.e., a density difference of 1.4 kg/m3, and the hypoxic layer thickness is 4 m. It is then able to calculate the minimum requirement for dissolved oxygen, O n (unit: kg), within a hypoxic area of 2 km2, if the concentration of dissolved oxygen at the bottom is expected to increase to 2 mg/L. This gives
O n = A × H × q 0 = 2,000,000 m 2 × 4 m × 1   g / m 3 = 8000 kg
where A and H are the area and thickness of the hypoxic zone, respectively, and q 0 is the lack of dissolved oxygen per unit volume. For the proposed downwelling device with an equivalent diameter of 0.8 m and a height of 6 m, it is estimated from Equation (17) that 40 devices can generate a downwelling volumetric flux at 3.7 m3/s in the case of a current speed of 0.2 m/s. Combined with the difference of 4 mg/L of dissolved oxygen mentioned above, the resulting downward oxygen flux is 14.8 g/s or 53.28 kg/h. Here, we assume for simplicity that tidal current works effectively 2 h per day. Therefore, at least 75 days are needed prior to the occurrence of hypoxia when tide-induced downwelling devices are placed.
Figure 15 shows the schematic of deployment of downwelling devices in the Muping marine ranch. The engineering effect of these 40 downwelling devices is further shown in Table 4. It is feasible to alleviate hypoxia of Muping marine ranch by using the tide-induced downwelling device to drive downwelling flow. Noted that released from the pump outlet, the surface water immediately rises with its own buoyancy, entraining the ambient water. One would expect as much entrainment as it could be, otherwise, a great portion of dissolved oxygen comes back to the surface, which is unsatisfactory. The authors have published one paper on this issue and claim that the ratio between the total entrained flow rate and the source discharge depends on the ambient current speed, the relative density difference and the pump geometry [26]. For the scenario of Muping marine ranch, assuming a constant ratio between the pipe length immersed below the pycnocline and the pipe diameter, incident current speed is relatively small and indicative of a high entrainment ratio [26]. It is thus reasonable to argue that the dissolved oxygen is effectively delivered to the hypoxia bottom water.
Since the consequences of artificial downwelling flow to combat eutrophication and anoxia are uncertain, it is necessary to conduct field experiments on the device to understand the evolution of ecosystems and related biochemical variables. In the actual sea conditions, the problem may be quite complex, in which case, the flow velocity at the pump outlet will also affect the performance, but the current research has not addressed this issue. Moreover, the buoyancy plume is of great significance for the optimization of dissolved oxygen concentration field under pycnocline. Therefore, further work will focus on how the buoyant plume evolved from the downwelling flow develops.

5. Conclusions

In the present work, the performance of a tide-induced device for artificial downwelling was investigated theoretically and experimentally. The results show that the proposed device can transport oxygen-rich surface water to the bottom water effectively by using the vertical square tube and two symmetrical-guide plates. The device capacity is a function of the horizontal current velocity, the relative density difference, the immersed length of the tube below the pycnocline, and the tube geometry. The water volume flow rate of the downwelling increases with increasing horizontal current velocity and decreasing relative density difference. The performance of the tide-induced device for artificial downwelling was shown to be strongly dependent on the geometrical parameters of the vertical tube and the bend radius of the tube. Decreasing the length of the vertical tube or increasing the equivalent diameter or bend radius of the tube will also obviously increase the water flow rate of the device. When the density difference is 0.5 kg/m3 and the horizontal current velocity is 0.4 m/s, the corresponding downwelling flow rate is about 200.0 m3/h.
For the downwelling in the vertical square tube, the critical Richardson number to induce the downwelling was also investigated. In the cases where the critical Richardson number is less than 0.5, the horizontal incident flow is strong enough to overcome the buoyancy of the water column in the vertical tube to induce a downwelling flow. The downwelling flow was also generated by the two symmetrical-guide plates, which are installed alongside the vertical tube.
As a preliminary study on the performance of the novel tide-induced downwelling, further improvement and perfection is still required. Further work will need to determine the influence of the static mixer and artificial reef on the downwelling efficiency. Moreover, the two symmetrical-guide plates have a considerable effect on the downwelling efficiency as well as on the whole performance of the tide-induced device for artificial downwelling. The optimal design of the guide plates may enhance the performance of the device and should be investigated. The tide-induced device for artificial downwelling has the advantage that it can also be used in applications such as water quality improvement, nuclear and chemical engineering and agriculture.

Author Contributions

Conceptualization, W.F. and Y.C.; methodology, data curation, validation and writing—original draft preparation, W.F. and D.P.; investigation, D.P. and T.L.; writing—review and editing, C.X. and W.F.; supervision, W.F., Y.P. and Y.C.

Acknowledgments

This research is supported by the Strategic Priority Research Program of the Chinese Academy of Sciences (XDA23050303) and the National Natural Science Funds of China (No. 41976199).

Conflicts of Interest

The authors declare no conflict of interest.

Nomenclature

a length of the rectangular section (m)
b width of the rectangular section (m)
A a actual area of the section (m2)
A c cross-sectional area of the overflow (m2)
D e equivalent diameter of the tube (m)
e thickness of the tube (m)
g gravity acceleration, 9.81 m/s2
L thickness of the dense bottom water (m)
h 0 mean water level (m)
h 1 immersed length of the tube below the pycnocline (m)
h 2 depth below the pycnocline (m)
Ldownwelling tube length (m)
Q d downwelling flow rate in the tube (m3/s)
R radius of the center line of the bend (m)
R s hydraulic radius (m)
R e Reynolds number
R i Richardson number
u typical velocity of horizontal current (m/s)
v a average horizontal flow velocity (m/s)
v c critical flow velocity of induced downwelling flow (m/s)
v d average downwelling flow velocity in the tube (m/s)
v h horizontal current velocity through the upper bend inlet (m/s)
h d kinetic head of downwelling flow (m)
h ρ density difference head (m)
h f total head loss of fluid motion (m)
h k kinetic head of horizontal current (m)
z variable of water depth (m)
z i water depth at the tube inlet (m)
z o water depth at the tube outlet (m)
twater temperature (°C)
Greek symbols
Δ inner wall roughness of the tube (m)
Δ ρ ρ relative density difference
λ Darcy–Weisbach friction factor
η dynamic viscosity of water, 0.001 Pa · S
ρ ( z ) water density at the depth of z (kg/m3)
ρ i water density at the depth of z i (kg/m3)
ρ o water density at the depth of z o (kg/m3)
ξ t total loss coefficient
ξ c bend loss coefficient
ξ i n entrance frictional loss coefficient
ξ o u t exit frictional loss coefficient
ξ r modified coefficient
Subscripts
m refers to the physical model
p refers to the prototype
r refers to the ratio of the physical model to the prototype

References

  1. Conley, D.J. Ecology: Save the Baltic Sea. Nature 2012, 486, 463–464. [Google Scholar] [CrossRef] [PubMed]
  2. Diaz, R.J.; Rosenberg, R. Marine benthic hypoxia: A review of its ecological effects and the behavioural responses of benthic macrofauna. Oceanogr. Mar. Biol. 1995, 33, 245–303. [Google Scholar]
  3. Chen, C.C.; Gong, G.C.; Shiah, F.K. Hypoxia in the East China Sea: One of the largest coastal low-oxygen areas in the world. Mar. Environ. Res. 2007, 64, 399–408. [Google Scholar] [CrossRef] [PubMed] [Green Version]
  4. Rabalais, N.N.; Turner, R.E.; Díaz, R.J.; Justić, D. Global change and eutrophication of coastal waters. ICES J. Mar. Sci. 2009, 66, 1528–1537. [Google Scholar] [CrossRef]
  5. Diaz, R.J.; Rosenberg, R. Spreading dead zones and consequences for marine ecosystems. Science 2008, 321, 926–929. [Google Scholar] [CrossRef] [PubMed]
  6. Ouchi, K.; Nakahara, H. The deep ocean water upwelling machine using density current-creation of fishing ground and absorption of co/sub 2. In Proceedings of the Oceans’ 99, MTS/IEEE. Riding the Crest into the 21st Century, Conference and Exhibition, Conference Proceedings (IEEE Cat. No. 99CH37008), Seattle, WA, USA, 13–16 September 1999; IEEE: Piscataway, NJ, USA, 1999; pp. 1019–1024. [Google Scholar]
  7. Stigebrandt, A.; Liljebladh, B.; De Brabandere, L.; Forth, M.; Granmo, Å.; Hall, P.; Hammar, J.; Hansson, D.; Kononets, M.; Magnusson, M. An experiment with forced oxygenation of the deepwater of the anoxic by Fjord, western Sweden. Ambio 2015, 44, 42–54. [Google Scholar] [CrossRef] [PubMed]
  8. Antonini, A.; Gaeta, M.G.; Lamberti, A. Wave-induced devices for the oxygenation of deep layer: A physical investigation. Coast. Eng. Proc. 2012, 1, 56. [Google Scholar] [CrossRef]
  9. Xiao, C.; Fan, W.; Qiang, Y.; Xu, Z.; Pan, Y.; Chen, Y. A tidal pump for artificial downwelling: Theory and experiment. Ocean Eng. 2018, 151, 93–104. [Google Scholar] [CrossRef]
  10. Sato, T.; Tonoki, K.; Yoshikawa, T.; Tsuchiya, Y. Numerical and hydraulic simulations of the effect of Density Current Generator in a semi-enclosed tidal bay. Coast. Eng. 2006, 53, 49–64. [Google Scholar] [CrossRef]
  11. Ouchi, K.; Otsuka, K.; Nakatani, N.; Yamatogi, T.; Awashima, Y. Effects of density current generator in semi-enclosed bay. In Proceedings of the OCEANS 2008-MTS/IEEE Kobe Techno-Ocean, Kobe, Japan, 8–11 April 2008; pp. 1–5. [Google Scholar]
  12. Margheritini, L.; Claeson, L. An innovative way of utilizing wave energy to counteract eutrophication and hypoxia. In Proceedings of the 9th European Wave and Tidal Conference (EWTEC), Southampton, UK, 5–9 September 2011. [Google Scholar]
  13. Antonini, A.; Lamberti, A.; Archetti, R. Oxyflux, an innovative wave-driven device for the oxygenation of deep layers in coastal areas: A physical investigation. Coast. Eng. 2015, 104, 54–68. [Google Scholar] [CrossRef]
  14. Antonini, A.; Lamberti, A.; Archetti, R.; Miquel, A.M. CFD investigations of OXYFLUX device, an innovative wave pump technology for artificial downwelling of surface water. Appl. Ocean Res. 2016, 61, 16–31. [Google Scholar] [CrossRef] [Green Version]
  15. Yang, D.; Zhou, Z.Q.; Zhang, J.S.; Liu, T.T.; Li, X.-J.; Ai, B.-H.; Li, B.-Q.; Chen, L.L. Characteristics of macrobenthic communities at the Muping marine ranch of Yantai in summer. Mar. Sci. 2017, 41, 134–143. [Google Scholar]
  16. Chuankun, W.; Shi, W. The ocean resources and reserves evaluation in China. In Proceedings of the 1st National Symposium on Ocean Energy, Hangzhou, China, 12–14 June 2008; pp. 169–179. [Google Scholar]
  17. Liu, H.W.; Ma, S.; Wei, L.; Gu, H.G.; Lin, Y.G.; Sun, X.J. A review on the development of tidal current energy in China. Renew. Sustain. Energy Rev. 2011, 15, 1141–1146. [Google Scholar] [CrossRef]
  18. Fan, W.; Chen, J.; Pan, Y.; Huang, H.; Chen, C.-T.; Chen, Y. Experimental study on the performance of an air-lift pump for artificial upwelling. Ocean Eng. 2013, 59, 47–57. [Google Scholar] [CrossRef]
  19. Hsieh, C.; Huang, P.; Li, D.; Chu, L.; Wu, C.; Liang, N. Artificial upwelling induced by ocean currents—Theory and experiment. Ocean Eng. 1978, 5, 83–94. [Google Scholar] [CrossRef]
  20. Wang, J. Calculation of the Equivalent Diameter in the Pipeline. J. Liaoning Univ. Petro. Chem. Tech. 2005, 3, 69–70. [Google Scholar]
  21. Zhang, L. Rectangular Duct’s Equivalent Diameter. Environ. Eng. 2014, S1, 975–978. [Google Scholar]
  22. Korson, L.; Drost-Hansen, W.; Millero, F.J. Viscosity of water at various temperatures. J. Phys. Chem. 1969, 73, 34–39. [Google Scholar] [CrossRef]
  23. Coe, J.R., Jr.; Godfrey, T.B. Viscosity of Water. J. Appl. Phys. 1944, 15, 625–626. [Google Scholar] [CrossRef]
  24. Oster, G. Density gradients. Sci. Am. 1965, 213, 70–79. [Google Scholar] [CrossRef]
  25. Cushman-Roisin, B.; Beckers, J.-M. Introduction to Geophysical Fluid Dynamics: Physical and Numerical Aspects; Academic Press: Oxford, UK, 2011; Volume 101. [Google Scholar]
  26. Xiao, C.; Fan, W.; Yao, Z.; Qiang, Y.; Pan, Y.; Chen, Y. On the total entrained flow rate of artificial downwelling. Ocean Eng. 2019, 181, 13–28. [Google Scholar] [CrossRef]
Figure 1. Schematic of the tide-induced device. “M.W.L.” is the mean water level.
Sustainability 11 05268 g001
Figure 2. Map of the area. (a) Overview of the observation site, (b) experimental area around the Muping marine ranch (the red pentagon indicates the hypoxic zone).
Sustainability 11 05268 g002
Figure 3. Measured vertical distribution of temperature and density in the Muping marine ranch on 21 August 2016.
Sustainability 11 05268 g003
Figure 4. Time series of the observed oxygen concentrations and temperatures at three different depths (the upper layer, middle layer, and lower layer) in summer 2016.
Sustainability 11 05268 g004
Figure 5. Total loss coefficient vs. Reynolds number for the prototype studied.
Sustainability 11 05268 g005
Figure 6. Schematic diagram of the circulating flume facility used in this experiment, all dimensions are in cm. (1. Data acquisition system, 2. Velocimeter, 3. High-speed camera, 4. Electronic scale, 5. Water flume, 6. Tracer injector, 7. A set of honeycomb tubes, 8. Adjustable flow pump, 9. Deflector, 10. Partition, 11. Water level gauge, 12. Tidal tube, 13. Flange plate).
Sustainability 11 05268 g006
Figure 7. Details of the model of the tide-induced device for artificial downwelling.
Sustainability 11 05268 g007
Figure 8. The experimental phenomenon of the downwelling process.
Sustainability 11 05268 g008
Figure 9. Relative downwelling intensity vs. Richardson number.
Sustainability 11 05268 g009
Figure 10. Total loss coefficient vs. Reynolds number.
Sustainability 11 05268 g010
Figure 11. Variation of critical current velocity vs. the immersed length of the tube for different relative density differences.
Sustainability 11 05268 g011
Figure 12. Variation of downwelling flow rate vs. horizontal tidal current velocity for different relative density differences under different tube geometries. ( h 1   = 4 m).
Sustainability 11 05268 g012
Figure 13. Variation of downwelling flow rate vs. relative density difference for different tube geometries under different horizontal current velocities. ( h 1 = 4 m).
Sustainability 11 05268 g013
Figure 14. Variation of geometrical dimensions vs. downwelling flow rate and total loss coefficient ( v h   = 0.3 m/s and h ρ   = 0.1959 cm).
Sustainability 11 05268 g014
Figure 15. Schematic of deployment of downwelling devices in the Muping marine ranch.
Sustainability 11 05268 g015
Table 1. Different types of artificial downwelling devices.
Power SupplyEngineering TechniquesApplication SiteApplicable Sea ConditionAuthor
Thermal energyDensity current generator
(DCG)
Gokasho BayCoastal ocean with large water temperature difference
No vertical advection between the warm surface layer and the cold bottom water
Ouchi & Nakahara, 1999
Electric energyBaltic deepwater oxygenation
(BOX)
By FjordSea areas convenient for erecting electric gridStigebrandt et al., 2015
Wave energyOXYFLUXNorth Adriatic SeaSea areas with waves and fluctuations, even small waves of the mild seasonAntonini, Gaeta, & Lamberti, 2012
Tidal energyTidal pumpChangjiang EstuarySea areas with abundant tidal energyXiao et al., 2018
Table 2. Summary of parameters for the model and the prototype.
ModelPrototype
Tube length L (m)0.66
Section length of the tube a (m)0.06, 0.08, 0.10, 0.120.6, 0.8, 1.0, 1.2
Section width of the tube b (m)0.03, 0.04, 0.05, 0.060.3, 0.4, 0.5, 0.6
Equivalent diameter
of the tube D e   (m)
0.04, 0.0533, 0.0667, 0.080.4, 0.533, 0.667, 0.8
Bend radius of the tube R (m)0.06, 0.08 0.10, 0.120.6, 0.8, 1.0, 1.2
Roughness (mm)0.120.0015 (McGovern, 2011)
Mean water level h 0   (m)1.818
Depth below pycnocline h 2   (m)0.66
Immersed depth below pycnocline h 1   (m)0.44
Horizontal velocity of
currents v h   (m/s)
0.05–0.150.16–0.47
Water density at the tube
inlet ρ i   (kg/m3)
999.1 (T = 15 °C)1020.0, 1020.5, 1021.0
Water density at the tube
outlet ρ o   (kg/m3)
999.6, 1000.1, 1000.61021.5
Density difference head
h ρ = ρ o ρ i ρ i h 1   (cm)
0.02001, 0.04004, 0.060050.1959, 0.3920, 0.5882
Notes: D r = 10 , v h r = 10 .
Table 3. Summary of the experimental parameters.
Case D e m   ( cm ) h 0 m   ( cm ) v a   ( m / s ) v h m   ( m / s ) ρ i m   ( kg / m 3 ) ρ o m   ( kg / m 3 ) v h p   ( m / s ) ρ i p   ( kg / m 3 ) ρ o p   ( kg / m 3 )
1-140179.80.05660.0728999.1999.60.23021021.01021.5
1-240179.80.0810.1042999.1999.60.32951021.01021.5
1-340179.80.1060.1363999.1999.60.43101021.01021.5
1-440179.80.1500.1929999.1999.60.571021.01021.5
2-140180.20.05530.0711999.11000.10.22481020.51021.5
2-240180.20.0820.1055999.11000.10.33361020.51021.5
2-340180.20.1030.1325999.11000.10.41901020.51021.5
2-440180.20.1440.1852999.11000.10.551020.51021.5
3-140180.50.0570.0733999.11000.60.23181020.01021.5
3-240180.50.0850.1093999.11000.60.34561020.01021.5
3-340180.50.1070.1376999.11000.60.43511020.01021.5
3-440180.50.1470.1891999.11000.60.5881020.01021.5
4-153.3179.70.0580.0702999.1999.60.2221021.01021.5
4-253.3179.70.0880.1066999.1999.60.33711021.01021.5
4-353.3179.70.1110.1345999.1999.60.42531021.01021.5
4-453.3179.70.1460.1769999.1999.60.55941021.01021.5
5-153.3180.10.05630.0682999.11000.10.21571020.51021.5
5-253.3180.10.0860.1042999.11000.10.32951020.51021.5
5-353.3180.10.1090.1321999.11000.10.41771020.51021.5
5-453.3180.10.1420.1720999.11000.10.54391020.51021.5
6-153.3180.60.0570.0691999.11000.60.21851020.01021.5
6-253.3180.60.0880.1066999.11000.60.33711020.01021.5
6-353.3180.60.1060.1284999.11000.60.4061020.01021.5
6-453.3180.60.1440.1745999.11000.60.55181020.01021.5
7-166.7180.00.0600.0701999.1999.60.22171021.01021.5
7-266.7180.00.0890.1039999.1999.60.32861021.01021.5
7-366.7180.00.1100.1285999.1999.60.40641021.01021.5
7-466.7180.00.1480.1728999.1999.60.54641021.01021.5
8-166.7180.30.05630.0657999.11000.10.20781020.51021.5
8-266.7180.30.0860.1004999.11000.10.31751020.51021.5
8-366.7180.30.1090.1273999.11000.10.40261020.51021.5
8-466.7180.30.1420.1658999.11000.10.52431020.51021.5
9-166.7180.80.0570.0666999.11000.60.21061020.01021.5
9-266.7180.80.0880.1028999.11000.60.32511020.01021.5
9-366.7180.80.1060.1238999.11000.60.39151020.01021.5
9-466.7180.80.1440.1682999.11000.60.53191020.01021.5
10-180180.50.0600.0683999.1999.60.2161021.01021.5
10-280180.50.0870.0991999.1999.60.31341021.01021.5
10-380180.50.1130.1287999.1999.60.4071021.01021.5
10-480180.50.1480.1686999.1999.60.5331021.01021.5
11-180179.60.05630.0641999.11000.10.20271020.51021.5
11-280179.60.0860.0980999.11000.10.30991020.51021.5
11-380179.60.1110.1264999.11000.10.39971020.51021.5
11-480179.60.1420.1617999.11000.10.51131020.51021.5
12-180179.80.0570.0649999.11000.60.2051020.01021.5
12-280179.80.0880.1002999.11000.60.31691020.01021.5
12-380179.80.1090.1242999.11000.60.39281020.01021.5
12-480179.80.1460.1663999.11000.60.52591020.01021.5
Notes: T = 15 °C, L m   = 0.6 m.
Table 4. Summary of engineering effect data of 40 tide-induced downwelling devices.
Immersed Length of the Tube below Pycnocline
h 1   ( m )
Horizontal Current Velocity
v h   ( m / s )
Downwelling Flow Rate
Q d   ( m 3 / s )
Compensated Downwelling Flow Rate
Q c   ( m 3 / s )
Time to Complete a Water Exchange
T e   ( day )
DO Supplemental Flux (g/s)Time Needed to Increase Dissolved Oxygen by 1 mg/L
T i   ( day )
50.100------
50.22.417.56.66.318.2
50.36.647.92.417.36.7
50.49.884.41.426.44.4
40.100------
40.23.420.25.88.813.2
40.37.047.12.518.36.3
40.410.182.01.427.04.3
30.100------
30.24.221.05.510.511.0
30.37.445.92.519.26.0
30.410.479.41.527.74.2
Notes: L = 6 m, D e = 0.8 m, hypoxia water area = 2 km2, temperature difference = 2 °C, salinity difference = 0.2 psu.

