Article

Entrepreneurial Innovation Impact on Recycling Municipal Waste. A Panel Data Analysis at the EU Level

1
Faculty of Management, The Bucharest University of Economic Studies, 6 Piata Romana, 1st district, 010374 Bucharest, Romania
2
Faculty of Business Administration in Foreign Languages, The Bucharest University of Economic Studies, 6 Piata Romana, 1st district, 010374 Bucharest, Romania
3
Faculty of Agrifood and Environmental Economics, The Bucharest University of Economic Studies, 6 Piata Romana, 1st district, 010374 Bucharest, Romania
*
Author to whom correspondence should be addressed.
Sustainability 2019, 11(18), 5125; https://doi.org/10.3390/su11185125
Submission received: 26 August 2019 / Revised: 13 September 2019 / Accepted: 15 September 2019 / Published: 19 September 2019
(This article belongs to the Collection Trends in Municipal Solid Waste Management)

Abstract

:
Based on recent findings of the economic literature on the implications of entrepreneurial innovation for recycling municipal waste, this paper aims to examine the main factors of recycling municipal waste at the European Union (EU) level. In this study, the authors developed a linear regression model to analyze the relationship between business expenditure on research and development (R&D), private investments, gross domestic product (GDP) expenditures on R&D, resource productivity, and environmental taxes on the recycling rate of municipal waste (RRMW). In our analyses, we used data from the Statistical Office of the European Union (EUROSTAT) and five statistical hypotheses were validated through a multiple regression model with panel data using the statistical software EViews 11. The study was conducted in 27 European Union countries between 2010 and 2017. Our results indicate that business expenditure on R&D, private investments, GDP expenditures on R&D, and resource productivity have a direct and significant impact on the RRMW, while environmental taxes have a significant and inverse impact on the RRMW. These findings underline that public policies should be focused on increasing the use of private and public investments on R&D for recycling municipal waste.

1. Introduction

The purpose of the paper is to examine what the main factors of recycling municipal waste at the European level are, using a linear regression model in order to discover and analyze the relationship between several economic factors and the recycling rate of municipal waste (RRMW). The question of the research is what is the entrepreneurial innovation impact on the RRMW?
Previous studies proved several impacts and answered in different modes to this specific question. Still, the study intended to demonstrate the impact of entrepreneurial innovation interpreted as business expenditure on R&D, resource productivity, and environmental taxes on the RRMW.
The motivation for this approach is given by the fact that entrepreneurial innovation is no longer a desiderate, but rather a constant key activity of our society. Both public policy and business environment have an interest in all of the innovative solutions for the improvement of their activity, as well as in the positive impact of the innovation on the return of business. Constant improvement of the activity is due to the implementation of the innovation results.
Entrepreneurship is being recognized as the main solution for economic development and social welfare [1,2]. Still, the economic growth may be determined by many other responsible factors, and some of them are quite unexpected [3], especially those in the Asian development model. Nevertheless, entrepreneurial manifestation has the government’s or local public authorities’ support [4], and business environments sustenance, too. Starting with Schumpeter’s complex definition [5] on entrepreneurship, there were many conceptual approaches regarding the role of an entrepreneur, from the person who bears the uncertainty, to that person who allocates resources with multiple uses [6]. Therefore, entrepreneurship seems to be the foundation of recycling activities even in the municipal waste field.
The link between innovation and entrepreneurship [7] crossed from the historical perspective to economic growth and innovation entrepreneurship, with two directions: innovation in product-market and technology innovation. Precursor studies already have demonstrated that innovation and entrepreneurship are positively related to each other [8] and together will have an impact on economic growth. Plus, the question still remains: Do they have an impact on the RRMW?
Innovation nowadays becomes important in waste management, too, as it is needed in order to resolve the issue of the huge annual quantities of municipal waste all over the world and to maintain urban and rural areas as clear as possible. Taking into consideration that current environment policy is based on sustainability [9], waste management has at least three dimensions: economic, ecological, and social [10], especially in highly-urbanized centers. From this perspective, it is very important to see what would be the solutions for better recycling the municipal waste. The municipalities and public policy makers try to identify which would be the most effective solution [11,12] for urban waste, no matter the type—domestic or waste from municipal services, solid, e-waste, dust, food, or any debris from cleaning activities. Obviously, there are studies that demonstrate an important difference between urban and rural areas in managing waste [13,14], while taking into consideration the higher number of solutions in waste management for rural households, legal or less legal, such as burning, composing, using them as fertilizers for vegetable cultivation, etc.
In this regard, innovation was used and, for example, even green channels were proposed for e-waste [15] in order for the countries to reach green economy principles. The conclusions of different other studies demonstrate that even e-waste management is not as developed and as well prepared as the high-tech industry is and produces [16].
The approach might be slightly different and more effective for the food industry [17], as the innovation brought to light very effective recycling solutions to this sector. This is the place where entrepreneurs may intervene in an innovative way [18] and boost the link between entrepreneurship and innovation in order to generate better and more functional recycling solutions.
Therefore, conceptual and empirical studies were run in order to better demonstrate how much entrepreneurship determines economic growth [19,20], concludes towards a circular economy [21], boosts innovation or vice-versa [22,23,24], and even show the link between these three concepts: innovation, entrepreneurship, and economic growth [25]. Moreover, empirical studies were run in order to find out innovative solutions for smart partnerships [26] and sustainable development [27]. Considering all these issues, in order to understand the impact of entrepreneurial innovation on the RRMW, it is important to determine what the business expenditure on R&D and the GDP expenditures on R&D (as main supportive factors for innovation) are, then private investments in general as key factors for entrepreneurship and recycling rates.
The connection between entrepreneurial innovation and recycling municipal waste has been studied by many economists. It was proved that there is a close entrepreneurial link between innovation and recycling of municipal waste [28]. Other authors [29,30,31] concluded that business expenditure on R&D have a positive impact on the RRMW.
Moreover, while some researchers [32,33] underline that private investments have a significant impact on the RRMW, other scientists [34,35] argue that GDP expenditures on R&D by the business enterprise sector have a positive impact on the RRMW in EU member states. Nevertheless, da Cruz et al. [36] and Busu [37] conclude that the environmental taxes and productivity of the resources have a direct and significant impact on the RRMW. Resource productivity is the gross domestic product (GDP) divided by domestic material consumption (DMC), where DMC measures the total amount of materials directly used by an economy. It is defined as the annual quantity of raw materials extracted from the domestic territory of the focal economy, plus all physical imports minus all physical exports.
Starting from the above-mentioned empirical results, we state our research question: “What is the entrepreneurial innovation impact on the RRMW?” Besides what is already known in this area, we will try to make an estimation on which of the five independent factors (i.e., business expenditure on R&D, private investments, GDP expenditures on R&D, resource productivity, and environmental taxes) has the greatest impact on the dependent variable of the quantitative model.
Nowadays, EU has 28 member states which joined the Union at different times. In the past 20 years, there were three moments when new countries joined EU: In 2004, when 10 new member states joined EU; in 2007, two new states adhered to EU; and in 2013, when a new state joined EU. Due to data availability, our analysis covers the period between 2010 and 2017.
This paper has the following structure. Firstly, we make a descriptive analysis of the macroeconomic key indicators of the RRMW at the EU level. RRMW measures the share of recycled municipal waste in the total municipal waste generation and the ratio is expressed in percentage points. Secondly, the relationship between entrepreneurial innovation and RRMW is analyzed. Research hypotheses are formulated and then tested through the regression analysis. Further research, limitations, and conclusions are summarized in the last section of the article.

2. Materials and Methods

2.1. Research Methodology

Before starting the quantitative analyses, we have formulated five statistical hypotheses (see Table 1).
These five hypotheses were tested with a multiple linear regression analysis, by the statistical software Eviews 11.0. A description of the analysis is provided in Section 3.

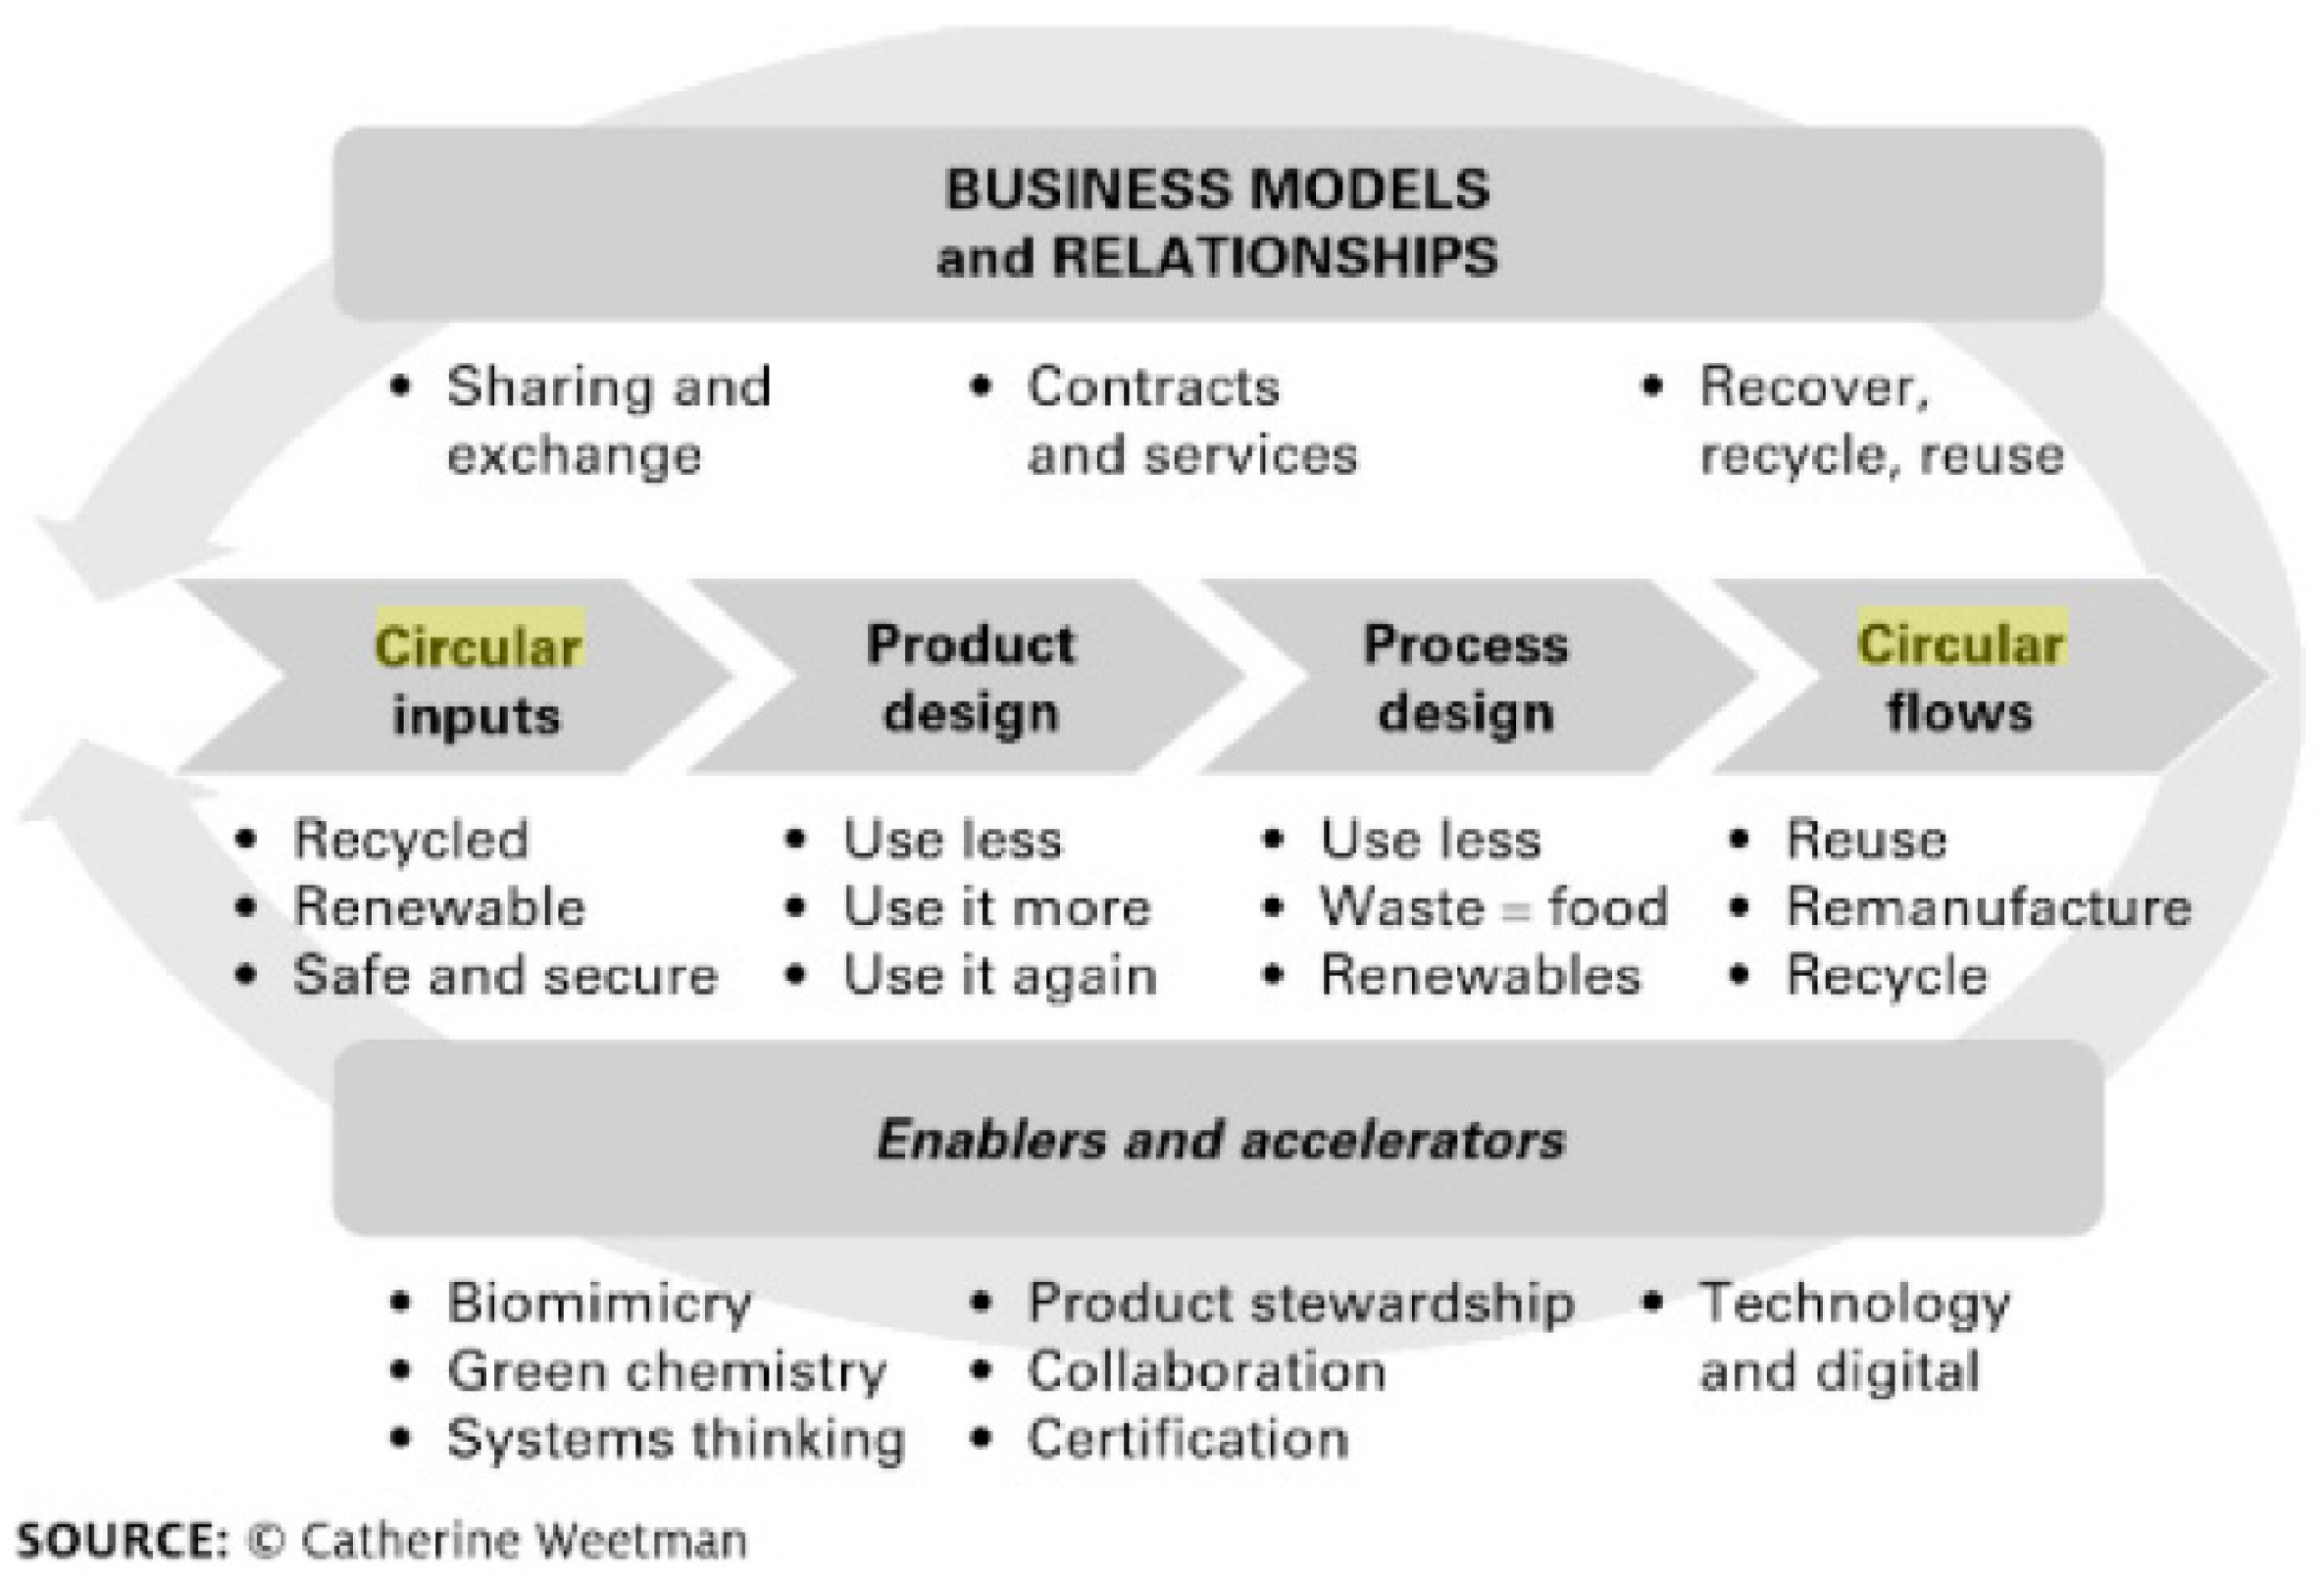
2.2. Description of the Entrepreneurial Innovation and Recycling at the EU Level

Several approaches to recycling businesses and economy models have different emphasis on the main components [38]. They share several useful principles, aiming to:
  • Use of the “waste = food” approach to help recover waste materials, to make sure that biological materials could be reused at the end of their life;
  • Extend the life of product and materials, if possible, over multiple “cycles”;
  • Conserve or regenerate living systems and nature;
  • Retain the water, the embedded energy, and other inputs in the material and product for as long as possible;
  • Push for taxes, market mechanisms, and policies that encourage “polluter pays” regulations.
A business model and relationship based on a recycling model were given by Weetman [38] (see Figure 1). The framework was made of six blocks: circular inputs, product design, process design and circular flows, business models and relationships, and, eventually, enablers and accelerators.
As can be seen in Figure 1, this definition underlines the need to minimize waste by repairing, reusing, and innovating the concept of recycling.
In our study, five macroeconomic indicators describing entrepreneurship innovation with significant impact on the RRMW were used. They will be the independent variables of the linear regression model in our study.
Figure 2, Figure 3, Figure 4, Figure 5 and Figure 6 give us a recent picture of entrepreneurship innovation in the recycling sector.
An important indicator is “business expenditure on R&D for recycling”. Business expenditure on R&D (million euros) between 2010 and 2017 at the EU level can be seen in Figure 2.
From Figure 2 we can see that, in 2017, the countries with the most business expenditure on R&D for recycling were Germany (68.4 million), followed by France (32.5 million), and the United Kingdom (UK) (26.2 billion). At the same time, in the last rankings were Cyprus (0.04 million), Malta (0.038 million), and Latvia (0.038 million).
Another important indicator is “private investments, jobs, and gross value added related to the recycling sector”. The indicator includes the gross investment in tangible goods, the value added at factor costs, and the number of persons employed in the recycling sector.
As we can see in Figure 3, in 2017, the top countries in the private investment on the recycling sector rankings were Germany (31.2 billion), UK (29 billion), and France (19.5 billion), while the last ranking countries were Slovenia (0.4 billion), Latvia (0.3 billion), and Cyprus (0.2 billion).
Another useful indicator in our study is gross domestic expenditure on R&D (GERD) for recycling by the business enterprise sector. The indicator measures GERD as a percentage of the GDP.
From Figure 4 we can see that the EU countries which spended the most on R&D as a percentage of their GDP were Sweden (2.42%), followed by Austria (2.22%) and Germany (2.09%). On the opposite side, the countries which spended the least on R&D as a percentage of their GDP are Romania (0.29%), Cyprus (0.2%), and Latvia (0.14%).
Resource productivity is another indicator in our analysis. Resource productivity is computed as the quotient between gross domestic product (GDP) and domestic material consumption (DMC). DMC is commensurate with the total amount of materials used directly by the economy of a country. According to EUROSTAT [39], DMC is defined as the annual load of raw materials extracted from the internal territory of the selected economy, plus all physical imports, minus all physical exports. In Figure 5, we can see the resource productivity in the EU countries.
Figure 5 shows us that in the resource productivity ranking, from 2017, Netherlands ranked first (4.4 euro/kg), followed by the UK (3.8 euro/kg) and Luxembourg (3.4 euro/kg). In the last places on productivity rankings were Estonia (0.5 euro/kg), Romania (0.4 euro/kg), and Bulgaria (0.3 (euro/kg).
Another useful indicator in our research is environmental taxes. Environmental tax revenue series display total tax revenue by category of environmental taxes: energy taxes, transport taxes, pollution taxes, resource taxes, and the sum of pollution and resource taxes. The series is presented in billions of euro. In Figure 6 we can see the amounts (in billion euros) collected by the EU member states in 2017.
From Figure 6 we can see that the EU member states with the highest revenues from environmental tax collection were, in 2017, Germany (59.3 billion euros), followed by Italy (57.4 billion euros) and the UK (55.8 billion euros). In this ranking, in the last places were Estonia (0.7 billion euros), Cyprus (0.6 billion euros), and Malta (0.3 billion euros).
Hence, the description of the above macroeconomic indicators of innovation and recycling indicates that the Western and Northern EU countries were the top-ranking countries, with the highest degree of entrepreneurship innovation implementation, while the Eastern and Southern EU countries were at the bottom of these rankings. This could be explained by the well-developed environmental policies in the Northern and Western EU states.

3. Results

For the quantitative analysis, RRMW was set as the endogenous variable (Y), determined by five exogenous variables. They were: Business expenditures on R&D (X1); private investments, jobs, and the added value related to the recycling sector (X2); GDP expenditure on R&D (GERD) by the business enterprise sector (X3); resource productivity (X4); and environmental taxes (X5). Linear regression analysis was made through the following steps: performing the quantitative analysis, estimating the model parameters, and checking the results.
A description of the statistical indicators used in our study (min, max, median, mean, and standard deviation) is given in Table 2. The values of median and mean are useful indicators of how close the data is to normal distribution. If the median and the mean approximate each other, we could assume that the data has a normal distribution [40].
In Table 2 we can see that the median and mean values are close to each other; therefore, we could conclude that the variables in our model are normally distributed.
The multicollinearity test among the independent variables (X1, X2, X3, X4, and X5) used in our model was performed by the Pearson correlation analysis. In Table 3 we can see the values of the pairwise correlation coefficients. Since these values are smaller than ±0.30, we could assume that there are no multicollinearity issues among the exogenous variables [41].
Now we will perform the Lagrange multiplier (LM) Breusch–Pagan test and the F-test to determine whether the research model we used in our analysis, given by Equation (1), was pooled data, fixed effects, or random effects.
The F-test was used for testing the validity of the pooled model against the fixed effects model [42]. In order to perform this test, we will consider the unrestricted and restricted models.
(i)
Restricted model:
Y i = X β + ε i , i = 1 , N ¯ .
(ii)
Unrestricted model: Y i = X i β i + u .
The fixed effects estimator or within estimator of the slope coefficient β estimates the within model by ordinary least square (OLS) analysis:
β ^ = ( X T X ) 1 X T Y .
The null and alternative hypotheses are:
  • H 0 : β i = β ;
  • H 1 : β i β .
If the null hypothesis is accepted, then the restricted model is accepted. Otherwise, the fixed effect model would be suitable for our analysis.
The F-test results can be seen in Table 4.
Since the probability p-value (probability = 0.190) is greater than the 0.05 threshold, we will accept the Null Hypothesis and conclude that random effect model should be used in our study.
Now, in order to make a choice between random models and pooled data we will use the LM Breusch–Pagan test [43].
By means of this test, we analyzed the existence of the kth order autocorrelation of residual values. We assumed that the errors regression model is given by the following equation:
u t = ρ 1 u t 1 + ρ 2 u t 2 + + ρ k u t k + ν t ,   for   t = k , n ¯   and   ν t ~ N ( 0 , σ ν 2 ) .
In order to assess the presence of the kth order autocorrelation, we tested the following null and alterative hypothesis:
  • H0: σ u 2 = 0 ;
  • H1: σ u 2 0 ;
If the null hypothesis is accepted, then the pooled model will be suitable for our analysis. The results of the LM Breusch–Pagan test can be seen in Table 5.
Upon analyzing the results of the random effect test in Table 5, we accepted the null hypothesis, since the probability p-value (probability = 0.091) was greater than the threshold 0.05. Hence, we concluded that the pooling of the model in Equation (1) was suitable for our analysis.
The five statistical hypotheses formulated in the previous section were tested with a multiple regression equation using the pooled least square (PLS) method. We used this approach in order to analyze the impact of the entrepreneurial innovation on the RRMW at the EU level between 2010 and 2017.
The evolution of the RRMW between 2010 and 2017 in EU countries was analyzed with a regression model and we obtained the following results (see Table 6):
According to the table above, the regression equation is:
Y = −2.237 + 0.658X1 + 0.764X2 + 0.385X3 + 0.276X4 −0.187X5,
where:
  • Y = recycling rate of municipal waste;
  • X1 = business expenditures on R&D;
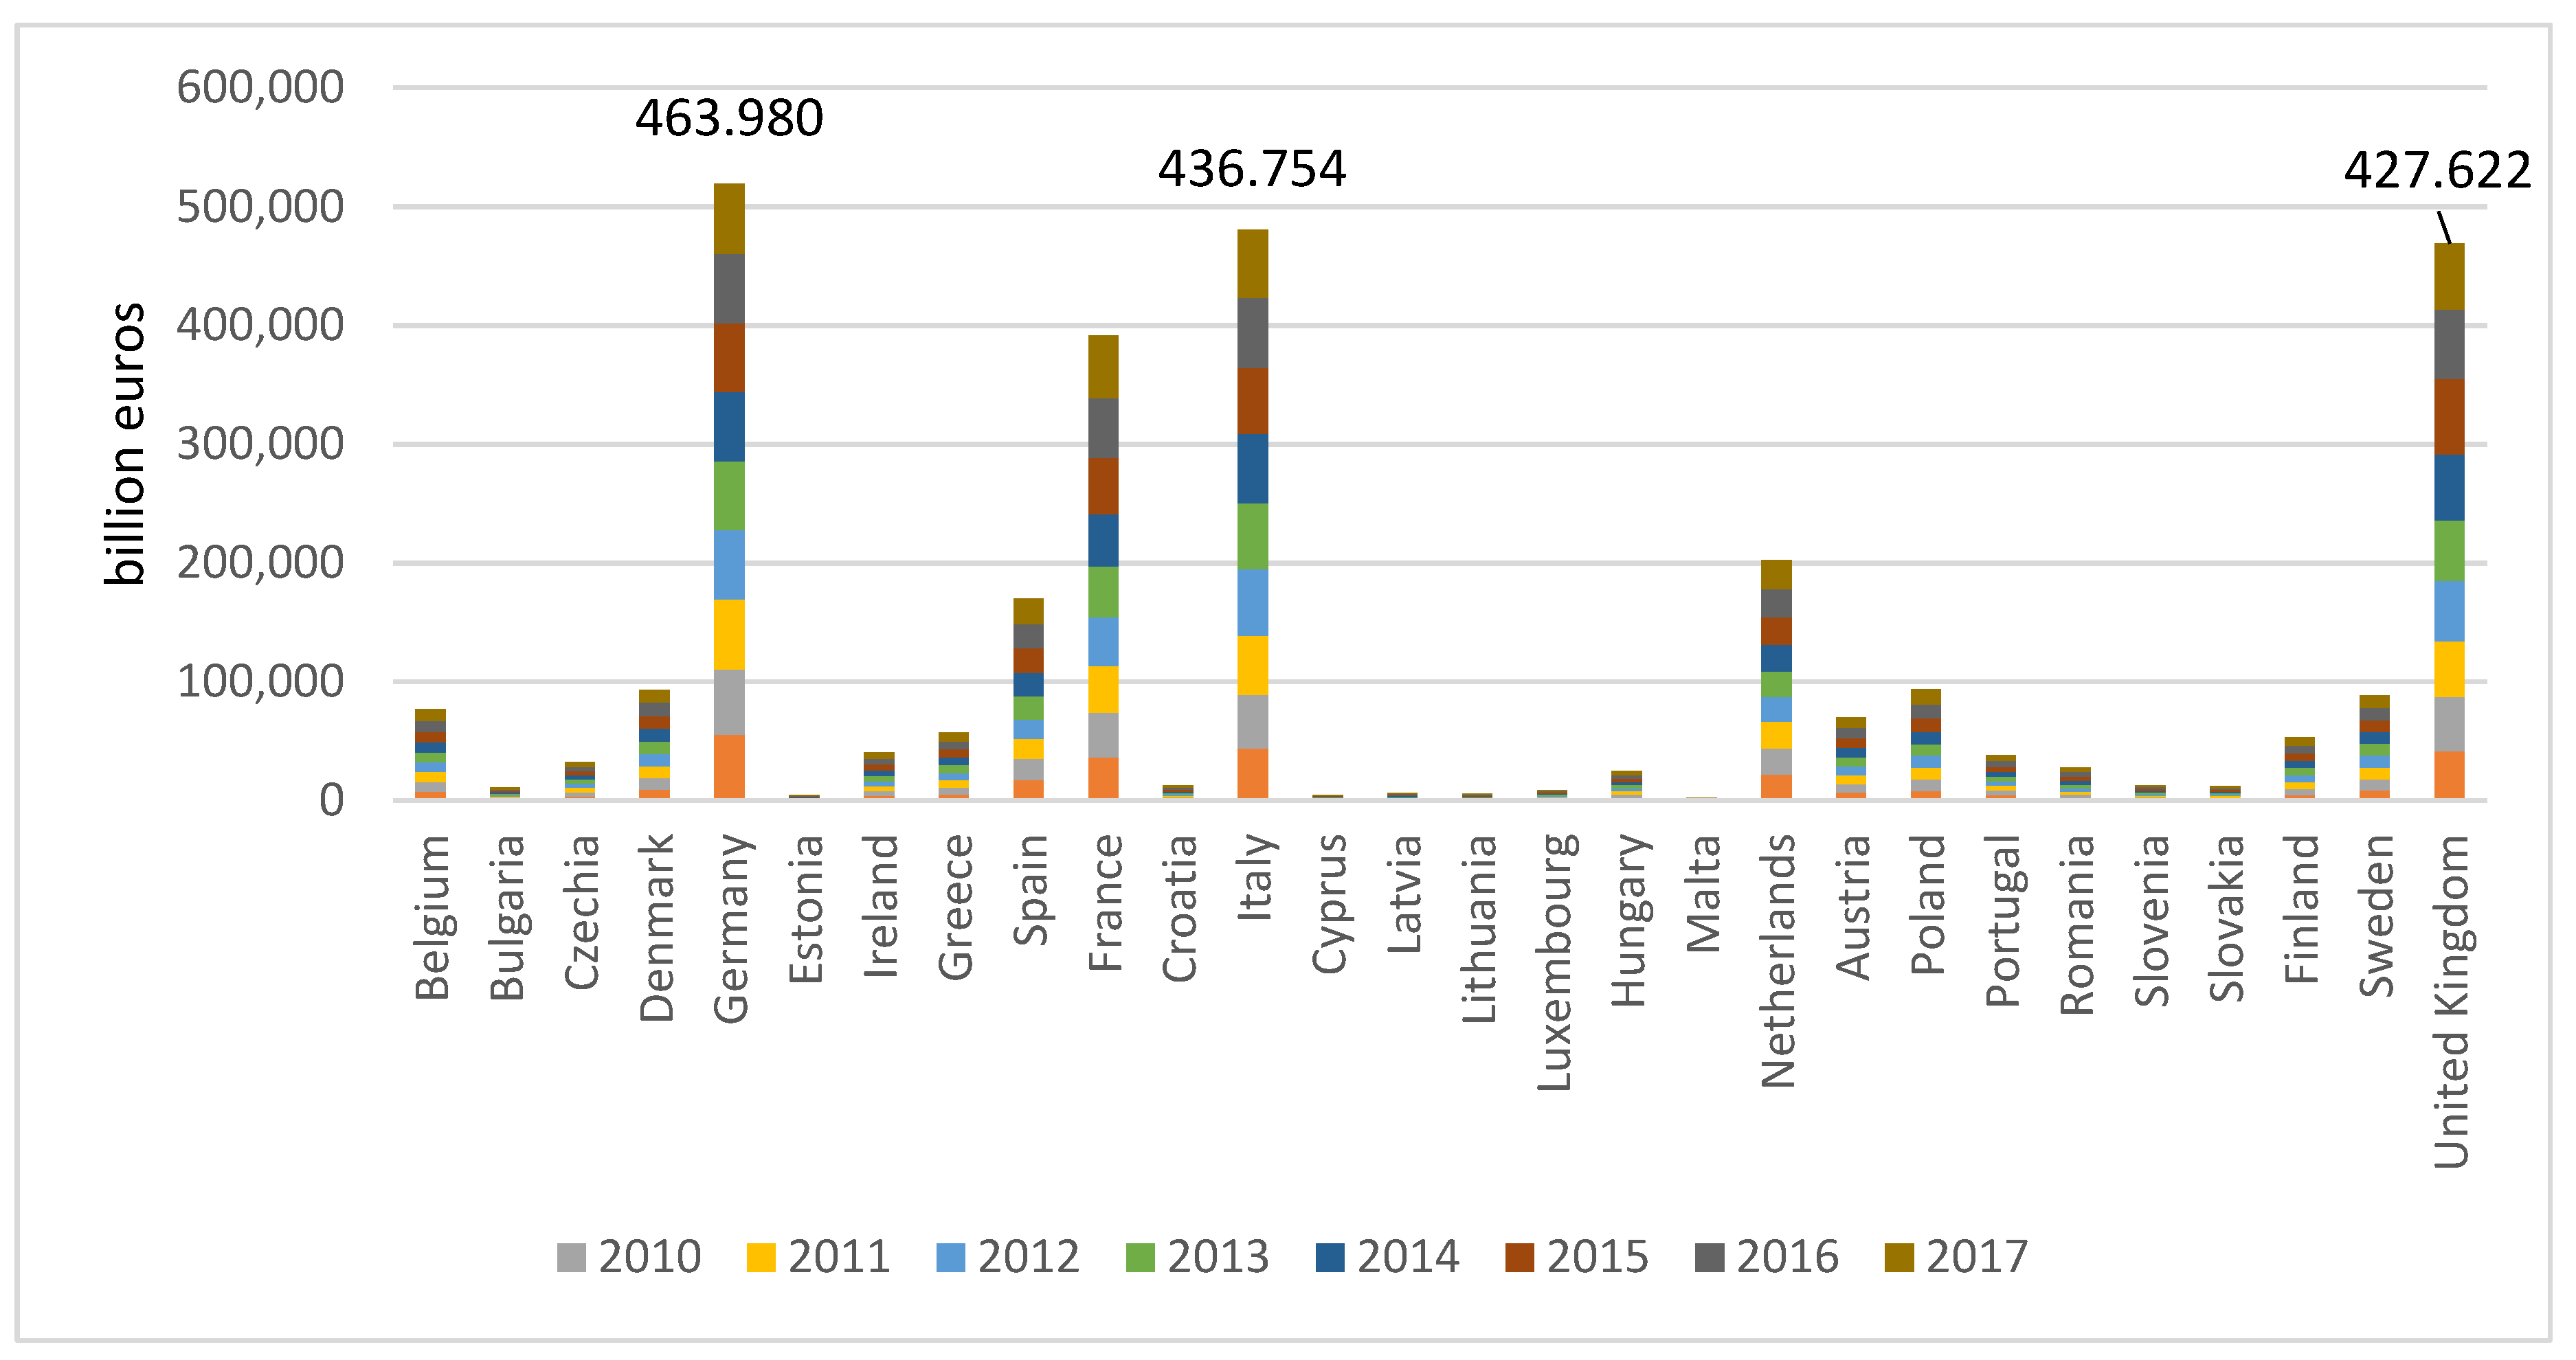
  • X2 = private investments, jobs, and gross added value related to the recycling sector;
  • X3 = GDP on R&D by the business enterprise sector;
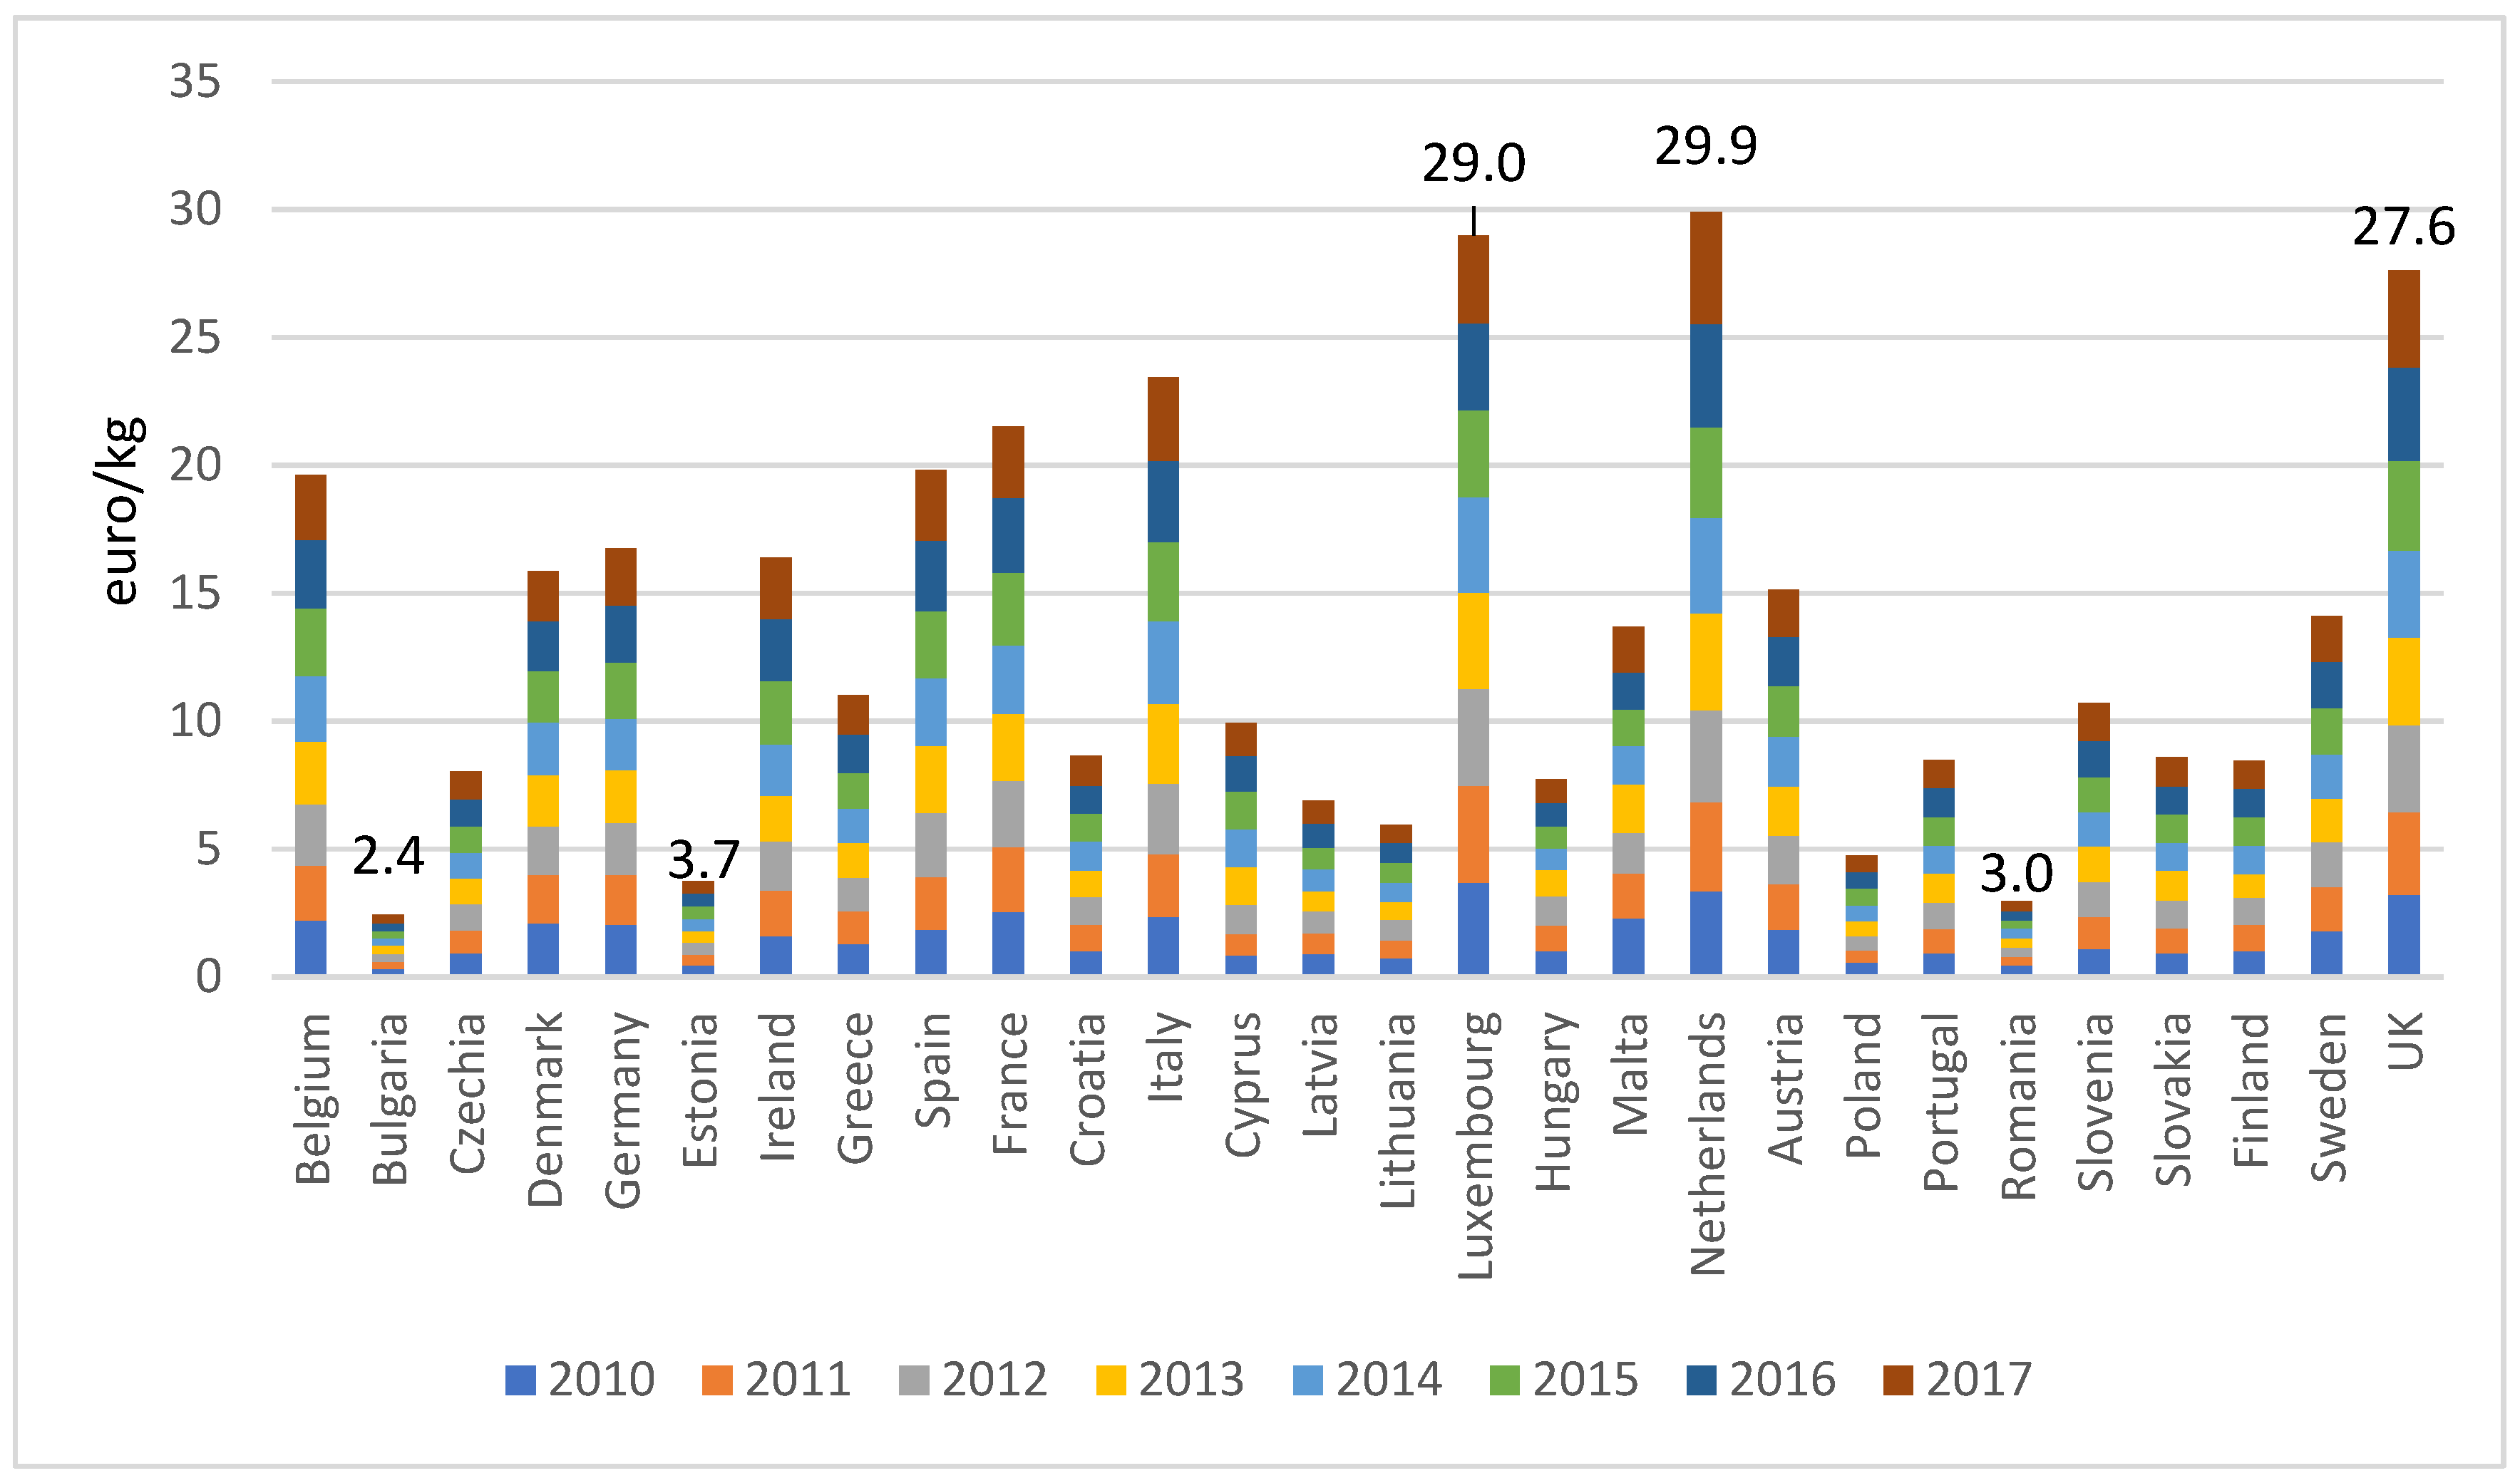
  • X4 = resource productivity;
  • X5 = environmental taxes.
Therefore, we could conclude that all independent variables in our model had a significant impact on the dependent variable and, hence, all five hypotheses were validated.

4. Discussion

In this section we discuss the results of the multiple linear regression analyzed by the PLS method. The method was used by the authors to estimate the impact of entrepreneurial innovation on recycling municipal waste.
Analyzing the RRMW evolution in the 27 EU countries, from 2010 to 2017 through independent variables (business expenditures on R&D, private investments, jobs, and value added related to recycling sector, GDP on R&D by business enterprise sector, resource productivity, and environmental taxes), through the multifactorial linear regression analysis, we obtained the following equation (see Table 6): Y = −2.237 + 0.658X1 + 0.764X2 + 0.385X3 + 0.276X4 − 0.187X5, with the standard error coefficients (1.235), (1.414), (1.152), (1.667), and (1.162). Moreover, since the value of R-squared was 0.729, we could conclude that 72.9% of the variability of the endogenous variable is explained by the variability of the exogenous variables. Additionally, the value of the Durbin–Watson statistic (DW = 2.06) is close to 2 and; therefore, we could affirm that the regression errors are not autocorrelated.
The positive coefficients of X1, X2, X3, and X4 in the PLS model reveal the fact that business expenditures on R&D, private investments, jobs, and added value related to the recycling sector, GDP expenditure on R&D by the business enterprise sector, and resource productivity have a positive impact on the RRMW, while the negative coefficient of X5 leads to the conclusion that any increase in environmental taxes would lead to a decrease in RRMW. The regulatory framework plays an essential role in modeling RRMW. This explains the fact that an increase of the expenses related to the environmental taxes could be an impediment for potential investors in ecological projects. No matter how peculiar this conclusion may appear at a first glance, there are situations when the increase of the environmental taxes in the field of the waste can lead to the decrease of RRMW. First of all, a unitary environmental tax in the field of waste does not lead directly to the increase of the RRMW, but a differentiated tax system is required depending on the category of waste for which it is applied. Then, there is the entrepreneurs’ perspective: Decreasing the economic facilities of waste generators and increasing their contributions will just demotivate them to get involved in recycling actions. Moreover, the opportunistic behavior of entrepreneurs may be developing, as they will look for other ways to elude the law and to be able to strengthen their profit. Additionally, the p-values associated with the independent variables in Table 6 (prob.), compared to the 0.05 threshold, give us the conclusion that all independent variables of the regression model were significant in their relationship with the endogenous variable, the RRMW.
The quantitative analysis concluded that the model was valid and the independent variables were significant for RRMW in all 27 EU countries, since the values of the estimated coefficients of the regression model were statistically significant. The results of the paper confirm recent studies of entrepreneurship innovation for recycling municipal waste [44,45].

5. Conclusions

The conclusions of our study were in line with the work of Bell et al. [46], who developed a multiple linear regression analysis to determine the impact of entrepreneurial innovation on the recycling of municipal waste in EU countries, partially explained by business expenditure on R&D, private investments, jobs, and the added value with respect to recycling. The results are also connected to other studies [47,48], which underline that an important step of achieving a high rate of recycling municipal waste is to rise resource productivity. The authors underline that resource productivity, private investments on recycling, and business expenditure on R&D for recycling are significant factors of recycling management.
The regression analysis was based on a panel data retrieved from EUROSTAT over a timeframe of eight years, so one of the limitations of this study is related to the time length of the analysis. Hence, future studies should consider longer periods of time for their analyses, which may reveal a more accurate picture of the econometric model applied for the analyzed macroeconomic indicators.

Author Contributions

M.B. contributed to the gathering of the data and estimating the regression model; R.I. and C.L.T. provided general aspects for the conceptual and theoretical approach of the study; M.B. and C.S.B. contributed to putting together all the numerical results and to conclusions and recommendations, as well as to the limitations of the study and further research; R.I. and C.L.T. contributed to the literature review; M.B. was responsible for the overall writing process.

Funding

This research was funded by the Romanian government through the CERTRAN project—The Upgrade of the Research Capacity in Economics through Development of a Transdisciplinary Research Infrastructure.

Acknowledgments

The research published in this article has been supported by the Romanian government through the CERTRAN project—The Upgrade of the Research Capacity in Economics through Development of a Transdisciplinary Research Infrastructure.

Conflicts of Interest

The authors declare no conflicts of interest.

Abbreviations

EUEuropean Union
R&DResearch and development
GDPGross domestic product
RRMWRecycling rate of municipal waste
MSWMunicipal solid waste
EUROSTATStatistical Office of the European Union
DMCDomestic material consumption
PLSPooled least square
OLSOrdinal least square
GERDGross domestic expenditure on R&D
UKUnited Kingdom

References

  1. Amman, T.S.; Haffar, J.M.; Ghoneim, A.; Arabiyat, O. The influence of institutional and conductive aspects on entrepreneurial innovation Evidence from GEM data. J. Enterp. Inf. Manag. 2019, 32, 366–389. [Google Scholar]
  2. Ignat, R. Premises and challenges of entrepreneurship in Romanian rural areas. Econ. Ser. Manag. 2012, 15, 423–435. [Google Scholar]
  3. Błazejowski, M.; Kwiatkowski, J.; Gazda, J. Sources of economic growth: A global perspective. Sustainability 2019, 11, 275. [Google Scholar] [CrossRef]
  4. Roşca, V. Sustainable development of a city by using a football club. Theor. Empir. Res. Urban Manag. 2010, 5, 61–68. [Google Scholar]
  5. Schumpeter, J.A. The Theory of Economic Development; Harvard University Press: Cambridge, UK, 1934. [Google Scholar]
  6. Nooteboom, B.; Stam, E. Micro-Foundations for Innovation Policy, Chapter: Entrepreneurship and Innovation; Amsterdam University Press: Amsterdam, The Netherlands, 2008. [Google Scholar]
  7. Thurik, R.; Wennekers, S. Linking entrepreneurship and economic growth. Small Bus. Econ. 1999, 13, 27–56. [Google Scholar]
  8. Zhao, F. Exploring the synergy between entrepreneurship and innovation. Int. J. Entrep. Behav. Res. 2005, 11, 25–41. [Google Scholar] [CrossRef]
  9. Kralj, D. Innovative systemic approach for promoting sustainable innovation for zero construction waste. Kybernetes 2011, 40, 275–289. [Google Scholar] [CrossRef]
  10. Venkateswaran, S. Managing waste: Ecological, economic and social dimensions. Econ. Political Wkly. 1994, 29, 2907–2911. [Google Scholar]
  11. Callan, S.J.; Thomas, J.M. Economies of Scale and Scope: A Cost Analysis of Municipal Solid Waste Services; University of Wisconsin Press: Madison, WI, USA, 2001; Volume 77, pp. 548–560. [Google Scholar]
  12. Kang, J.; Lin, J.; Zhao, X.; Zhao, S.; Kou, L. Decomposition of the urban water footprint of food consumption: A case study of Xiamen City. Sustainability 2017, 9, 135. [Google Scholar] [CrossRef]
  13. Johnstone, N.; Labonne, J. Generation of Household Solid Waste in OECD Countries: An Empirical Analysis Using Macroeconomic Data; University of Wisconsin Press: Madison, WI, USA, 2004; Volume 80, pp. 529–538. [Google Scholar]
  14. Trica, C.L. Eco-Entrepreneurial Development in the Rural Environmental Area, Rural Communities in the Global Economy, Beyond the Classical Rural Economy Paradigms; Istudor, N., de Los Rios, I., Andrei, J.-V., Eds.; Nova Science Publishers: Hauppauge, NY, USA, 2017; ISBN 978-1-53610-255-0. [Google Scholar]
  15. Grant, R. E-waste challenges in Cape Town Opportunity for the green economy? In Urban and Spatial Challenges in South Africa: Continuing The Conversation; Izziv, U., Ed.; Urbanistični inštitut Republike Slovenije: Ljubljana, Slovenije, 2019; Volume 30, pp. 5–23. [Google Scholar]
  16. Rode, S. E-Waste Management in Mumbai Metropolitan Region: Constraints and Opportunities, Theoretical and Empirical Researches in Urban Management; Research Center in Public Administration and Public Services: Bucharest, Romania, 2012; Volume 7, pp. 89–103. [Google Scholar]
  17. Borrello, M.; Caracciolo, F.; Lombardi, A.; Pascucci, S.; Cembalo, L. Consumers’ perspective on circular economy strategy for reducing food waste. Sustainability 2017, 9, 141. [Google Scholar] [CrossRef]
  18. Zhai, Y.-M.; Sun, W.-Q.; Tsai, S.-B.; Wang, Z.; Zhao, Y.; Chen, Q. An empirical study on entrepreneurial orientation, absorptive capacity, and SMEs’ innovation performance: A sustainable perspective. Sustainability 2018, 10, 314. [Google Scholar] [CrossRef]
  19. Pargaru, I.; Dinu, M.; Teodor, C. Review and prospects of environmental problems in the city of Bucharest. Qual. Access Success 2017, 18, 302–306. [Google Scholar]
  20. Fletcher, M.; Loane, S.; Rahman, M.; Fatima, N. Entrepreneurship and urban growth: Dimensions and empirical models. J. Small Bus. Enterp. Dev. 2011, 18, 608–626. [Google Scholar]
  21. Ghura, H.; Li, X.; Harraf, A. Moderating relationship of institutions for opportunity entrepreneurship and economic development. World J. Entrep. Manag. Sustain. Dev. 2013, 13, 350–374. [Google Scholar] [CrossRef]
  22. Trica, C.L.; Banacu, C.S.; Busu, M. Environmental factors and sustainability of the circular economy model at the European Union level. Sustainability 2018, 11, 1114. [Google Scholar] [CrossRef]
  23. Weerawardena, J.; Coote, L. An empirical investigation into entrepreneurship and organizational innovation-based competitive strategy. J. Res. Mark. Entrep. 2001, 3, 51–70. [Google Scholar] [CrossRef]
  24. Mocanu, M.; Ciurea, C. Developing an index score for the internal auditor profile in Romania based on real data analysis. Econ. Comput. Econ. Cybern. Stud. Res. 2019, 53, 93–111. [Google Scholar] [CrossRef]
  25. Woodside, A.; Mir Bernal, P.; Coduras, A.; Woodside, A. Constructing cased-based macro models: Cultures’ consequences on entrepreneurship, innovation, and quality-of-life. In Case Study Research: Core Skill Sets in Using 15 Genres; Emerald Group Publishing Limited: Bingley, UK, 2016; pp. 433–488. [Google Scholar]
  26. Farinha, L.; Ferreira, J.; Nunes, S. Linking innovation and entrepreneurship to economic growth. Compet. Rev. 2018, 28, 451–475. [Google Scholar] [CrossRef]
  27. Dobrea, R.; Molănescu, G.; Buṣu, C. Food Sustainable Model Development: An ANP Approach to Prioritize Sustainable Factors in the Romanian Natural Soft Drinks Industry Context. Sustainability 2015, 7, 10007–10020. [Google Scholar] [CrossRef] [Green Version]
  28. Mourad, M. Recycling, recovering and preventing “food waste”: Competing solutions for food systems sustainability in the United States and France. J. Clean. Prod. 2016, 126, 461–477. [Google Scholar] [CrossRef]
  29. Yabar, H.; Uwasu, M.; Hara, K. Tracking environmental innovations and policy regulations in Japan: Case studies on dioxin emissions and electric home appliances recycling. J. Clean. Prod. 2013, 44, 152–158. [Google Scholar] [CrossRef]
  30. Nemat, B.; Razzaghi, M.; Bolton, K.; Rousta, K. The role of food packaging design in consumer recycling behavior—A literature review. Sustainability 2019, 11, 4350. [Google Scholar] [CrossRef]
  31. Jabłońska, B.; Kiełbasa, P.; Korenko, M.; Dróżdż, T. Physical and chemical properties of waste from PET bottles washing as a component of solid fuels. Energies 2019, 12, 2197. [Google Scholar] [CrossRef]
  32. Paunov, C. The global crisis and firms’ investments in innovation. Res. Policy 2012, 41, 24–35. [Google Scholar] [CrossRef]
  33. Caniato, F.; Caridi, M.; Crippa, L.; Moretto, A. Environmental sustainability in fashion supply chains: An exploratory case-based research. Int. J. Prod. Econ. 2012, 135, 659–670. [Google Scholar] [CrossRef]
  34. Dangelico, R.M.; Pujari, D. Mainstreaming green product innovation: Why and how companies integrate environmental sustainability. J. Bus. Ethics 2010, 95, 471–486. [Google Scholar] [CrossRef]
  35. Horbach, J.; Rennings, K. Environmental innovation and employment dynamics in different technology fields—An analysis based on the German Community Innovation Survey 2009. J. Clean. Prod. 2013, 57, 158–165. [Google Scholar] [CrossRef]
  36. da Cruz, N.F.; Simões, P.; Marques, R.C. Economic cost recovery in the recycling of packaging waste: The case of Portugal. J. Clean. Prod. 2012, 37, 8–18. [Google Scholar] [CrossRef]
  37. Busu, M. Adopting circular economy at the European Union Level and its impact on economic growth. Soc. Sci. 2019, 8, 159. [Google Scholar] [CrossRef]
  38. Weetman, C. A Circular Economy Handbook for Business and Supply Chains: Repair, Remake, Redesign, Rethink; Kogan Page Publishers: London, UK, 2016; ISBN 13 078-0749476755. [Google Scholar]
  39. Eurostat. Your Key to European Statistics. 2017. Available online: http://ec.europa.eu/eurostat (accessed on 24 June 2019).
  40. Hozo, S.P.; Djulbegovic, B.; Hozo, I. Estimating the mean and variance from the median, range, and the size of a sample. BMC Med Res. Methodol. 2005, 5, 13. [Google Scholar] [CrossRef]
  41. Dabholkar, P.A.; Shepherd, C.D.; Thorpe, D.I. A comprehensive framework for service quality: An investigation of critical conceptual and measurement issues through a longitudinal study. J. Retail. 2000, 76, 139–173. [Google Scholar] [CrossRef]
  42. Schmidheiny, K. Panel Data: Fixed and Random Effects. Basel Universität, 2016. Available online: http://www.schmidheiny.name/teaching/panel2up.pdf (accessed on 18 July 2019).
  43. Block, J. Long-Term Orientation of Family Firms: An Investigation of R&D Investments, Downsizing Practices, and Executive Pay; Gabler: Wiesbaden, Germany, 2009; Available online: https://link.springer.com/book/10.1007/978-3-8349-8412-8 (accessed on 18 August 2019).
  44. Rada, E.C.; Zatelli, C.; Cioca, L.I.; Torretta, V. Selective collection quality index for municipal solid waste management. Sustainability 2018, 10, 257. [Google Scholar] [CrossRef]
  45. Rada, E.C.; Bresciani, C.; Girelli, E.; Ragazzi, M.; Schiavon, M.; Torretta, V. Analysis and measures to improve waste management in schools. Sustainability 2016, 8, 840. [Google Scholar] [CrossRef]
  46. Bell, J.; Paula, L.; Dodd, T.; Nemeth, S.; Nanou, C.; Mega, V.; Campos, P. EU ambition to build the world’s leading bioeconomy—Uncertain times demand innovative and sustainable solutions. New Biotechnol. 2018, 40, 25–30. [Google Scholar] [CrossRef] [PubMed]
  47. Silva, A.; Rosano, M.; Stocker, L.; Gorissen, L. From waste to sustainable materials management: Three case studies of the transition journey. Waste Manag. 2017, 61, 547–557. [Google Scholar] [CrossRef] [PubMed]
  48. Troschinetz, A.M.; Mihelcic, J.R. Sustainable recycling of municipal solid waste in developing countries. Waste Manag. 2009, 29, 915–923. [Google Scholar] [CrossRef] [PubMed]
Figure 1. Business models and relationships framework for recycling. Source: Weetman [38].
Sustainability 11 05125 g001
Figure 2. Business expenditure on R&D (million euros) for recycling between 2010 and 2017, at the EU level. Source: Eurostat [39].
Sustainability 11 05125 g002
Figure 3. Private investments, jobs, and gross value added related to the recycling sector (billion euros) 2017 at the EU level. Source: Eurostat [39].
Sustainability 11 05125 g003
Figure 4. Gross domestic expenditure on research and development (GERD) by the business enterprise sector as a percentage of GDP between 2010 and 2017, at the EU level. Source: Eurostat [39].
Sustainability 11 05125 g004
Figure 5. Resource productivity in the EU countries between 2010 and 2017 (euro/kg).
Sustainability 11 05125 g005
Figure 6. Environmental taxes (billion euros) between 2010 and 2017 at the EU level. Source: Eurostat [39].
Sustainability 11 05125 g006
Table 1. Statistical hypotheses.
H1Business expenditures on R&D at the EU level have a positive impact on the RRMW.
H2Private investments are strongly correlated with RRMW at the EU level.
H3GDP expenditures on R&D by the business enterprise sector have a positive impact on the RRMW in EU member states
H4Resource productivity has a positive impact on the RRMW in EU countries
H5Environmental taxes have a significant impact on the RRMW at the EU level
R&D = research and development; RRMW = recycling rate of municipal waste; GDP = gross domestic product; EU = European Union.
Table 2. Descriptive statistics of the variables in the model.
VariableUnitMinMeanMedianMaxSt. Dev.N
RRMW (Y)%6.40037.17834.80067.60014.88227
Business expend. (X1)Mill. euros387.7417.80068.64412.34027
Private (X2)Bill. euros0.2006.2006.40031.2004.32627
GERD (X3)%0.140.7860.7102.420.12327
Res_prod (X4)Euro/kg0.3002.1232.1004.4000.78927
Environ tax(X5)Bill. euros0.3038.1717.89559.2598.93027
Source: EViews 11.0 output. RRMW = recycling rate of municipal waste; Business expendit. = business expenditures; GERD = Gross domestic expenditure on research and development; Res_prod = resource productivity.
Table 3. Pearson correlation matrix between explanatory variables.
VariableX1X2X3X4X5
X11
X20.1131
X30.1250.1371
X40.2070.2050.1491
X50.1980.2780.0980.1011
Source: EViews 11.0 output.
Table 4. Fixed effect test.
F-Statistic3.48
Probability0.190
Table 5. The Lagrange Multiplier Breusch–Pagan test.
Cross SectionTimeBoth
Coeff.29.1352.2882.48
Prob.0.0910.5830.036
Table 6. Impact of independent variables on the RRMW in the EU countries during 2010 to 2017.
Dependent Variable: RRMW
Method: Pooled Least Square
Sample: 2010–2017
Total panel observations: 216
RRMW = B(0) + B(1) × BUSINESS_EXPEND + B(2) × PRIVATE + B(3) × GERD + B(4) × RES_PROD + B(5) × ENVIRON_TAX
CoefficientStd. Errort-StatisticProb.
C−2.237861.1654.2987500.0009
BUSINESS_EXPEND0.6589461.2353.6743970.0023
PRIVATE0.7649871.4144.0967850.0019
GERD0.3856841.1522.6730980.0175
RES_PROD0.2768561.1671.9876580.0210
ENVIRON_TAX−0.1879121.7251.6789340.0421
R-squared0.729867Mean dependent var7.6882
Adjusted R-squared0.684598S.D. dependent var0.9876
S.E. of regression0.198763Akaike info criterion1.9287
Sum squared resid.1.765487Schwarz criterion1.8035
Log likelihood112.7623Hannan–Quinn criter.1.7036
Durbin–Watson stat2.060983

