1. Introduction
Water resources are indispensable to socio-economic existence and development. Keeping pace with rapid economic and societal development, the global demand for water resources has been growing at an annual rate of 1% [
1]. This leads to increasingly significant socio-economic constraints. In addition, as a result of climate change, environmental degradation, and mismanagement of water resources, identifying effective sustainability indicators has become essential for water resource management and governance [
2].
China has a large population but scarce water supply [
3]. Influenced by a continental monsoon climate, water resources are unevenly distributed in the north and south and vary greatly during the year. The natural water distribution does not match the social and economic distribution across the country [
4]. The southwest and southeast areas account for 81% of China’s water resources, while the northern part accounts for only 19% of its national water resources but 60% of its cultivated land. In addition, industrial development and urbanization have made over-exploitation of water resources and water pollution increasingly serious problems [
5]. The lack of a consistent water supply has become a bottleneck in ecological construction and societal development. Identifying water resources at risk and improving water management are key to the sustainable development of resources and the economy in China.
To evaluate how human production and consumption affect natural resources, water footprint analysis was developed to assess the use of water resources throughout the whole life cycle of a product—covering production, transportation, marketing, consumption, and reuse—from the perspective of the evaluation system boundary [
6]. It provides an important scientific basis to measure water resource security and to improve regional water use efficiency. It is a key element in water resource management and environmental research [
7]. The water footprint accounts for the use of water resources in products or services and evaluates water pollution in production or service processes. As a comprehensive index to calculate the real occupancy of water resources by human activities [
8], water footprint closely correlates human consumption with water resource utilization. Water footprint research has expanded rapidly and has become one of the predominant topics in the international water resource management literature.
To promote and recognize water footprint theory, an international Water Footprint Network was established, and the Water Footprint Assessment Manual was published to introduce methods for water footprint accounting and impact assessment [
9]. Concurrently, the International Organization for Standardization (ISO) proposed an international water footprint standard to complement the life cycle assessment [
10]. Scholars in various countries have used the water footprint to quantify the water hidden in products [
11], companies [
12], and countries [
13,
14], as well as the water flows embodied in economic trade [
15]. In addition, it is used to evaluate the regional water resource carrying capacity, external dependence, and environmental sustainability [
16]. Through a literature review, Yang and Zehnder [
17] concluded that virtual water research mainly focused on food and many studies only quantified the virtual water flow associated with food trade. Zhang et al. [
14] carried out a bibliometric analysis of water footprint research from 2006 to 2015 by mapping research countries, institutions, journals, keywords, and hot issues. Paterson et al. [
18] identified and discussed priorities for urban water footprint research in the future. Despite the growing use of water footprint in research, some scholars began to question its practicability [
19]. This was due to a lack of comparisons of measured water footprint values in different studies and in different regions. In fact, research articles not only carry authors’ research ideas and results, but also have significance in terms of scientific and cultural knowledge accumulation. Through mathematical and statistical methods, bibliometrics provides quantitative analysis to assess the characteristics of publications [
20]. It is a useful method for in-depth comparison and analysis of water footprint research.
China is one of the most active and productive countries in water footprint research. The number of articles on China’s water footprint published in the
Web of Science database accounts for about one-fifth of the world’s total [
14]. China’s water footprint research has developed sharply in recent years. However, most of the results are published in Chinese journals. Previous studies in English published in the
Web of Science could not reflect all characteristics and implications of water footprint research in China. To quantitatively summarize and compare the development process of water footprint research in the country, this paper uses bibliometrics to analyze the characteristics and key points of Chinese water footprint research from 2003 to 2018. The earliest article that can be found was published in 2003, and thus, this is the beginning of our sample. All key information in Chinese research published in Chinese and English in either the
China National Knowledge Infrastructure (CNKI) or
Web of Science (WoS) database are collected. The research fields, research areas, methods, and tools are analyzed based on the articles’ titles, keywords, and abstracts. The water footprints measured are extracted from the main text of each article. This review shows the focus and trend of water footprint research in China and provides a useful reference for future research.
3. Analysis of Research Trends
3.1. Publication Trends
The results of the keyword search show that water footprint research in China began in 2003. Long and Xu [
30] from the Cold and Arid Regions Environmental and Engineering Research Institute of the Chinese Academy of Sciences first applied the theory of water footprint and virtual water—the hidden flow of water in trade of goods from one place to another—to the northwest of China. Subsequently, Chinese scholars soon began to pay attention to the water footprint and used this method to analyze regional water consumption within a certain space-time range.
As stated before, 1564 articles on the water footprint in Chinese and English were retrieved from the CNKI and WoS from 2003 to 2018. To analyze the trend of water footprint research, the research period was divided into four equal intervals: 2003–2006, 2007–2010, 2011–2014, and 2015–2018. The number of articles published in CNKI and WoS as well as the research trends and research fields are shown in
Figure 1.
As shown by
Figure 1a, the research outcomes exemplify a significant increasing trend. At the very initial stage from 2003 to 2006, only 104 articles were published. From 2007 to 2010, 287 articles were published. Among them, 268 articles were published in Chinese journals in the CNKI. Only 19 articles were published in English journals in the WoS, accounting for only 6.6% of the total articles published in this period. Water footprint research was still in its infancy at this stage. In terms of the research field, 34.8% of the articles (100) discussed water footprint research methods, reviews, and comments, 32.1% (92) analyzed regional water footprints, and 32.1% (92) focused on agricultural water footprints.
Due to the public’s increasing awareness of water resources and environmental protection, water footprint research developed rapidly [
14]. From 2011 to 2014, 437 articles were published in journals in the CNKI and WoS. This represented an increase of 52.3% from the previous period (2007–2010). The proportion of articles in the WoS database also increased to 17.4% (76 articles). According to the Journal Citation Reports (JCRs) provided by Thomson Reuters, 38 articles from the WoS were published in journals ranked in the top 50% at the time of writing. The analysis results show that the research field expanded slowly from the agricultural focus, with some researchers beginning to examine the water footprint in industrial and service sectors.
Over the past four years, water footprint research has developed steadily. The total number of articles published during 2015–2018 increased by 68.4% compared with 2011–2014. The number of articles published in Chinese remained stable, adding up to 443. However, the proportion of articles from WoS reached 39.8% (293) and has more than doubled compared with the previous period (2011–2014). Meanwhile, with maturity and innovation in research methods, articles published in high-level journals available in the WoS increased significantly. According to the JCRs, more than half of the English articles (154) were published in the top 50% of journals in this period. The water footprint research field has also expanded. As shown in
Figure 1b, 37.5% of the articles (276) studied the agricultural water footprint, 37.4% (275) studied the regional water footprint, and 12.9% (95) studied the industrial water footprint; with articles on the service sector water footprint accounting for 1.2% (9). The proportion of articles on research methods, reviews, and commentary decreased significantly to 11.0% (81).
3.2. Research Regions
Water resources are unevenly distributed spatially and temporally in China [
15]. The spatial distribution of water resources and the stage of socio-economic development affect the way water is used, thereby affecting the regional water footprint. The spatial scale of water footprint research comprises national, provincial, municipal, and county levels. A provincial-level statistical analysis was conducted to identify the spatial scale and regional characteristics of research. The research area information was obtained from the article title, keywords, and abstract. Here, research at county and municipal levels was converted and added to provincial-level research. Some studies focus on regions such as Northeast China or the North China Plain, and the study areas were counted for all the related provinces or provincial-level municipalities. Review and discussion articles that do not have a specific study area were excluded (388 articles). Eventually, a total of 1176 articles were used for the analysis of the research region.
The research results show that 36.7% of the articles (432) are on the national scale, including a direct study of national water footprint using national-level economic data and an upscaling study using provincial data. With economic development, the dependence on water is increasing and the conflict between water supply and demand is intensifying. More research examining the regional characteristics and objectives of water basin management has been conducted at regional and river basin scales, accounting for 15.1% of the articles (177). The north, northwest, northeast, Yellow River Basin, and Yangtze River Basin are the focal points for regional water footprint research.
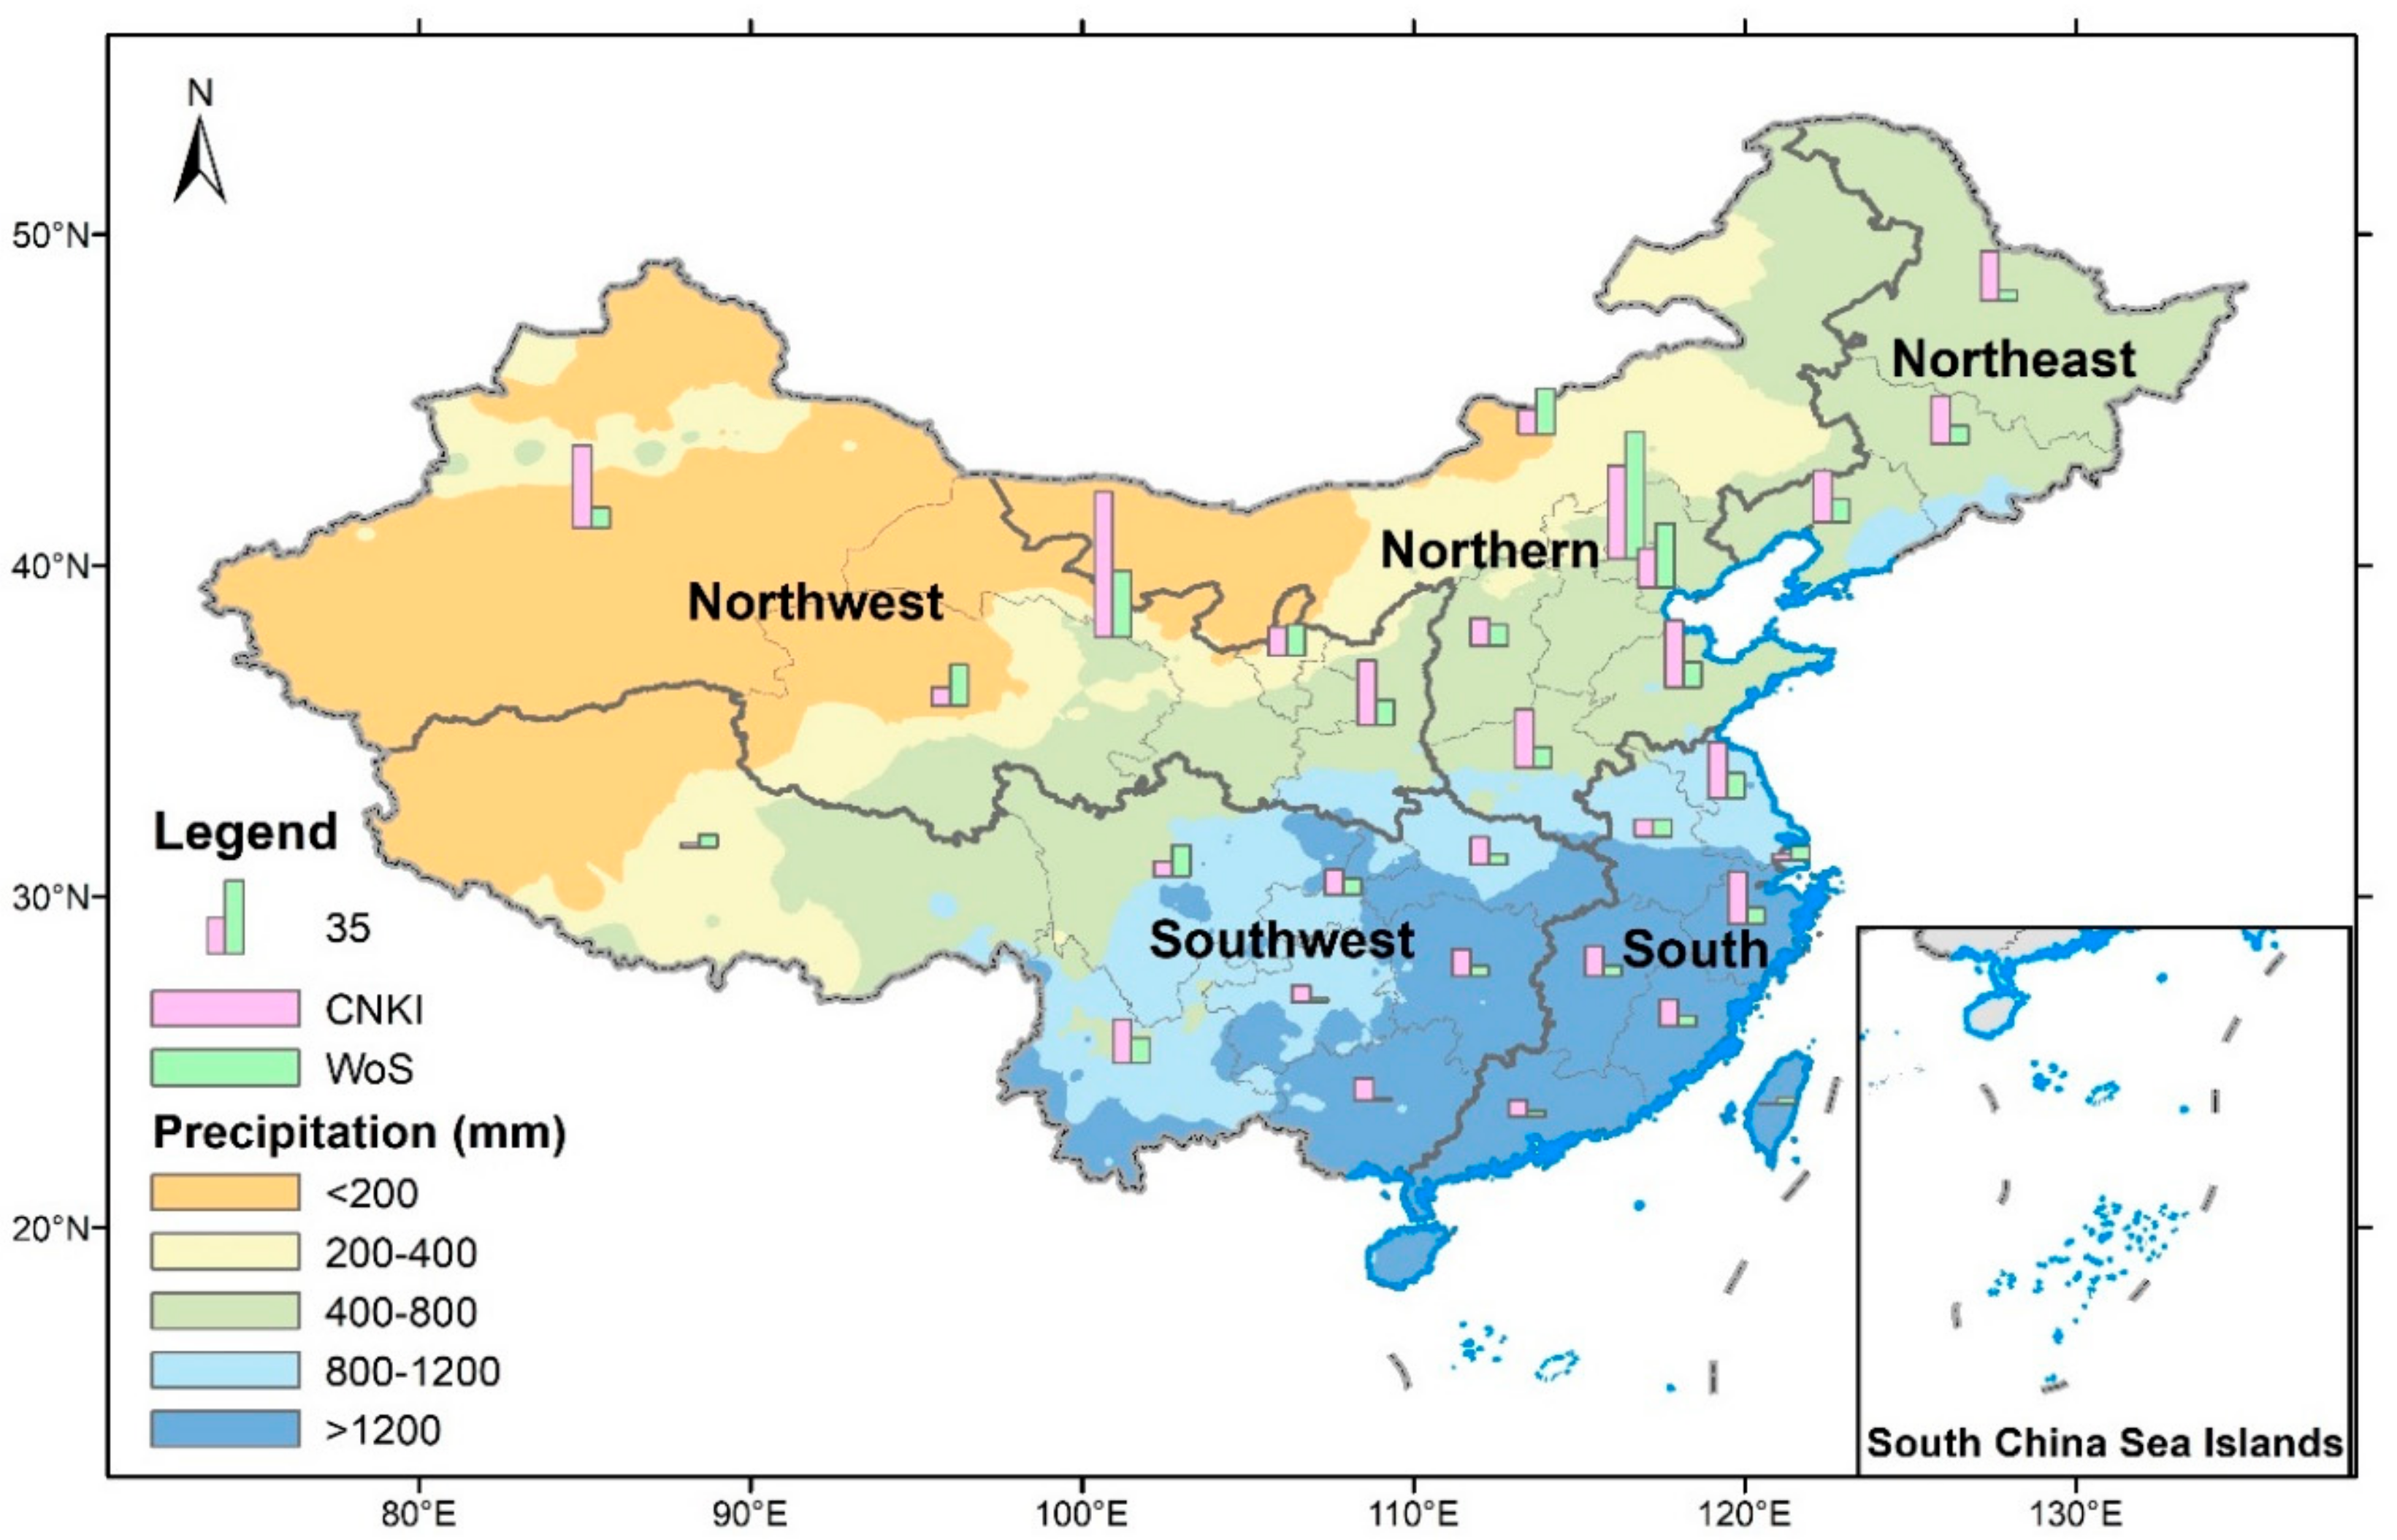
There are 567 articles on water research at the provincial, city, and county levels, accounting for 48.2% of all papers. As some articles involve multiple provincial administrative areas, a total of 1003 research areas were included in this study. The analysis results show that research articles focusing on northern China are far more numerous than those on southern China (
Figure 2).
The northern region is not only densely populated but is also a major grain-producing area, with obvious competition for water resources [
5]. The northwest is the most studied area with Gansu Province being a key research area. The inland river basins in northwest China, such as the Heihe River Basin and Shiyang River Basin in Gansu, have little precipitation. Water resources are fundamental for regional socio-economic development and oasis and ecosystem maintenance. The scale and technology of water resource utilization may affect the survival of the region, and accordingly, has drawn significant academic attention—with 10.2% of total regional research on the water footprint on the Gansu Inland River Basin. The agricultural water footprints in Xinjiang and Inner Mongolia are also research hotspots.
Human activities have the greatest impact on the water cycle in cities [
31]. As a result of accelerated urbanization, large cities in China have developed rapidly over the past two decades [
32]. Important features of urbanization are not only the rapid increase in the number of large cities but also the emergence of supercities, megacities, and metropolitan areas. According to the United Nations Population Division [
33], in 2011, there were only 30 megacities in the world with a population of more than 10 million, including six cities in China (Beijing, Chongqing, Wuhan, Shanghai, Shenzhen, and Guangzhou). By 2017, this number had increased to 13 [
34]. With the increase in urban population and expansion of the economy, water pollution and ecological problems have become increasingly significant and have led to intense research on the water footprint in Beijing, Tianjin, Qingdao in Shandong Province, Zhengzhou in Henan Province, and Dalian in Liaoning {rovince.
Scarce water resources and their high-intensity usage in northern cities have created a series of problems including aquifer depletion, river dry-up, lake shrinkage, and land subsidence, all of which seriously threaten sustainable development in the region. Water problems in urban development have become a focus of international attention. There are more than 150 articles on the water footprint in Beijing and Tianjin alone. The water footprint in Beijing accounts for 10.5% (105) of the total articles, among which 61 are from the WoS.
Compared with the arid areas and cities of northern China (676 articles), fewer articles (327) have focused on the south, where the climate is mild and rainy [
35,
36]. Though the water resource crisis in the southern region may not be obvious, water pollution problems deserve more attention, especially in rural areas [
37].
3.3. Water Footprint Comparisons
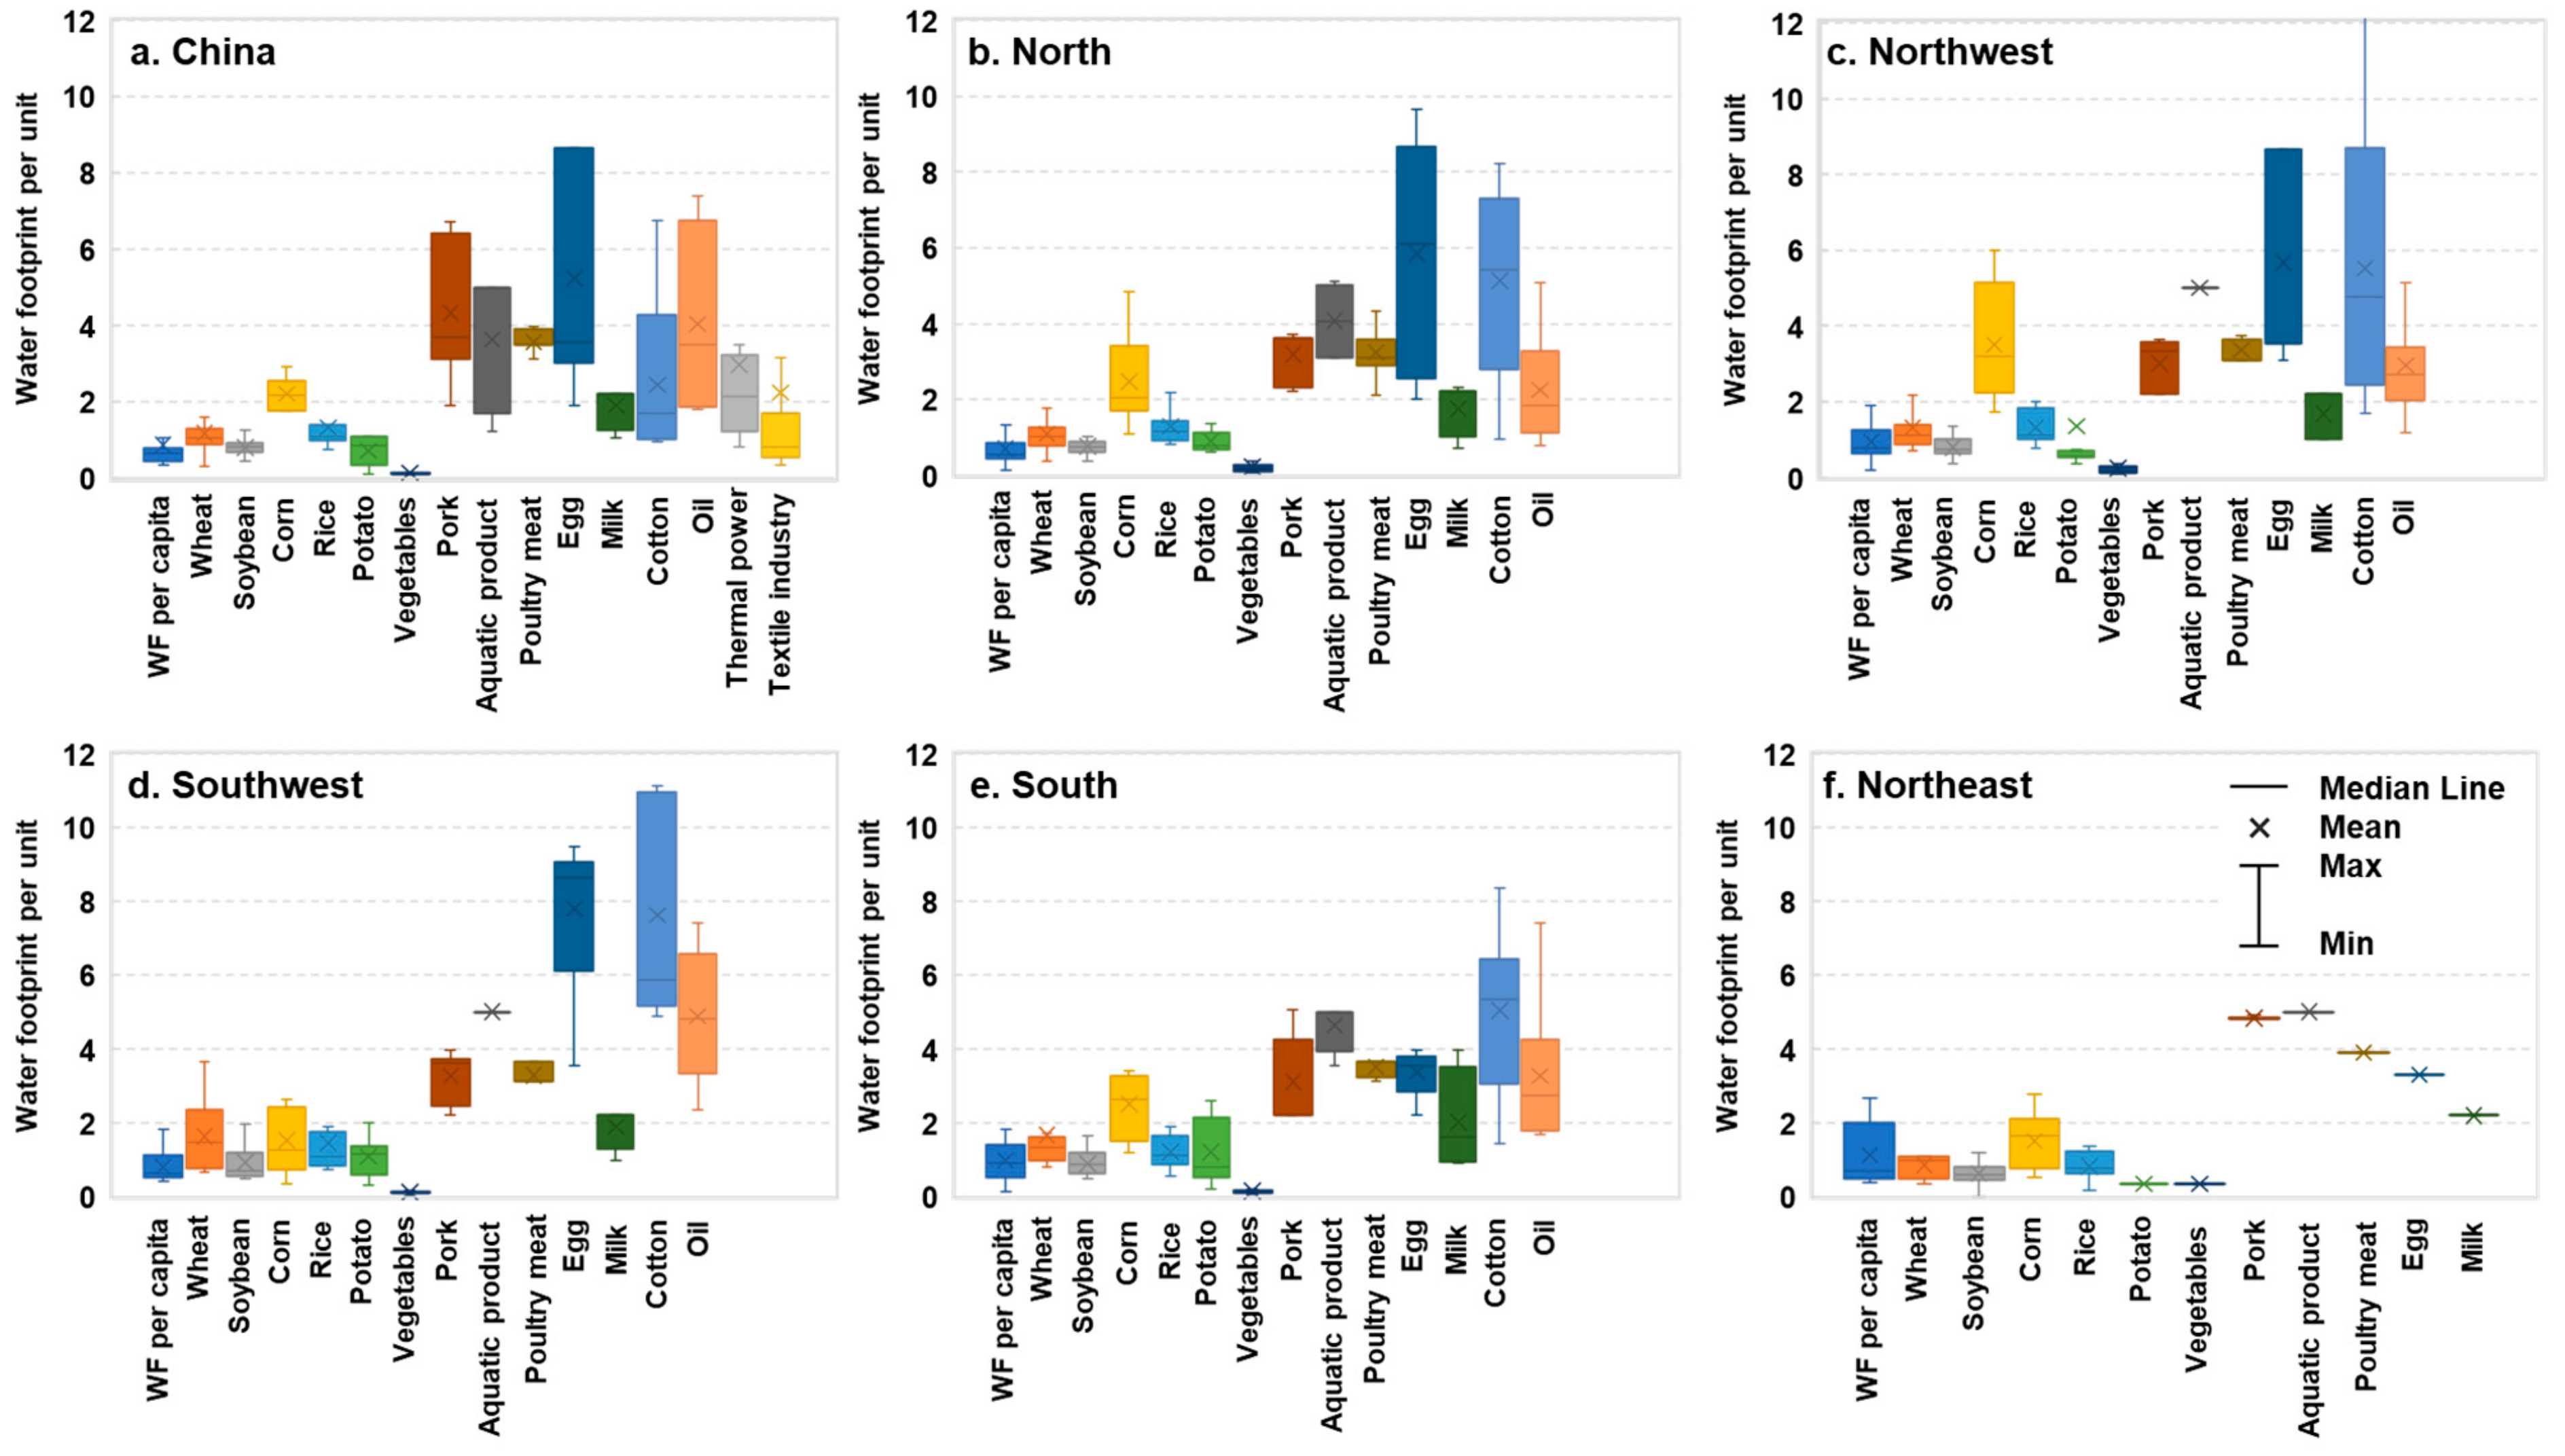
To compare the results of different water footprint studies, the measured water footprint values in all the articles are extracted. Based on the main focus of the sampled water footprint articles, principal crop products, livestock products, energy, and textile industries were selected as the key objects of analysis. To ensure the comparability of data, only the unit water footprint of the product was extracted. Per capita water footprint was also extracted and compared as an indicator of regional water footprint. To analyze the differences among regions, China was divided into five regions (
Figure 2) based on geographical features—Northern, Northeast, Northwest, South, and Southwest. In total, 1159 values were extracted, and the results of the water footprint comparison are shown in
Figure 3.
From all the articles, 947 data points of measured water footprint values for agriculture products were extracted. This accounts for 80% of all the extracted data. It shows that quantitative study of the agricultural water footprint was the main focus in the past 16 years. As can be seen from the national-level research results (
Figure 3a), the water footprints of wheat, soybean, corn, rice, potato, and vegetables are relatively small, while that of meat, aquatic products, cotton, and oil are relatively large. The latter list reflects water-intensive agricultural products. The agricultural water footprint is a function of local water resources, climatic locations, and cultivation habits. The water footprint research results were biased towards high-productivity arid locations, which are in the Northern part of China. As shown by
Figure 3, the average water footprints of corn (0.67 m
3/kg), rice (0.83 m
3/kg), wheat (0.86 m
3/kg), and soybean (1.52 m
3/kg) in the Northeast are much lower than in the South, where the average water footprints are 0.90 m
3/kg, 1.21 m
3/kg, 1.66 m
3/kg, and 2.51 m
3/kg, respectively. In addition, the range of measured water footprint values for livestock products varies significantly more than those for crop products. Heterogeneities exist in every step of livestock production [
38]. The sources of livestock’s feed, their growth cycle, and production quality have a significant impact on the results of the water footprint measurement. Contrary to the results for grain, the water footprint for pork (4.82 m
3/kg) and poultry (3.9 m
3/kg) in the Northeast is slightly larger than in the South (3.11 m
3/kg and 3.52 m
3/kg, respectively).
Personal water footprint is the amount of water a person consumes in their daily life over a certain period. In this study, data on water footprints per capita was obtained from 184 articles. The results show that average water footprint per capita in the Northeast is 1127.2 m
3/person/year, which is much higher than the national average (879.1 m
3/person/year). Apart from indicting personal water use habits, personal water footprint also reflects people’s living habits and living standards [
32]. The North is the region with the most intensive social activities and area with the highest level of water scarcity [
5]. Thus, people’s water use efficiency is higher than in other areas. Compared with other regions, Northern China has the lowest water footprint per capita (696.7 m
3/person/year).
Water footprint of thermal power generation and the textile industry have been selected for comparison because they are water-intensive industries [
39,
40]. In total, 16 and 14 blue water footprint data points were collected for thermal power generation and the textile industry. Due to huge differences in production methods and processes, the water footprint values are quite different. The blue water footprint of thermal power generation varies from 0.84 [
41] to 10.15 m
3/MWh [
42]. The research boundary, method, and data source also affects the uncertainty of research results. The grey water footprint is widely used to evaluate the impact of the industry on the water environment. However, the pollutants considered in different studies may differ [
43,
44]. Therefore, the measured grey water footprint was not compared in this study.
3.4. Keyword Trends
Keywords express the main idea and thematic concept of an article. Keyword research of a large number of articles may summarize the overall content characteristics of the research, uncover the internal relationship between research contents, and reveal the general direction of academic research. Thus, the frequency of keywords in the 1170 Chinese articles and 394 English articles were examined. Among them, two Chinese articles and 30 English articles had no keywords, leaving a total of 2043 Chinese and 1125 English keywords listed by authors. Of these, 76.5% appeared only once, meaning there were 1504 Chinese and 920 English keywords reflecting the depth and breadth of the research. Of the keywords appearing more than 10 times, 61 were in Chinese and 14 were in English. The research focus and hotspots were derived based on the keywords. We translated the Chinese keywords into English and integrated the commonly used keywords and ranked them. Those used more than 15 times are shown in
Table 1.
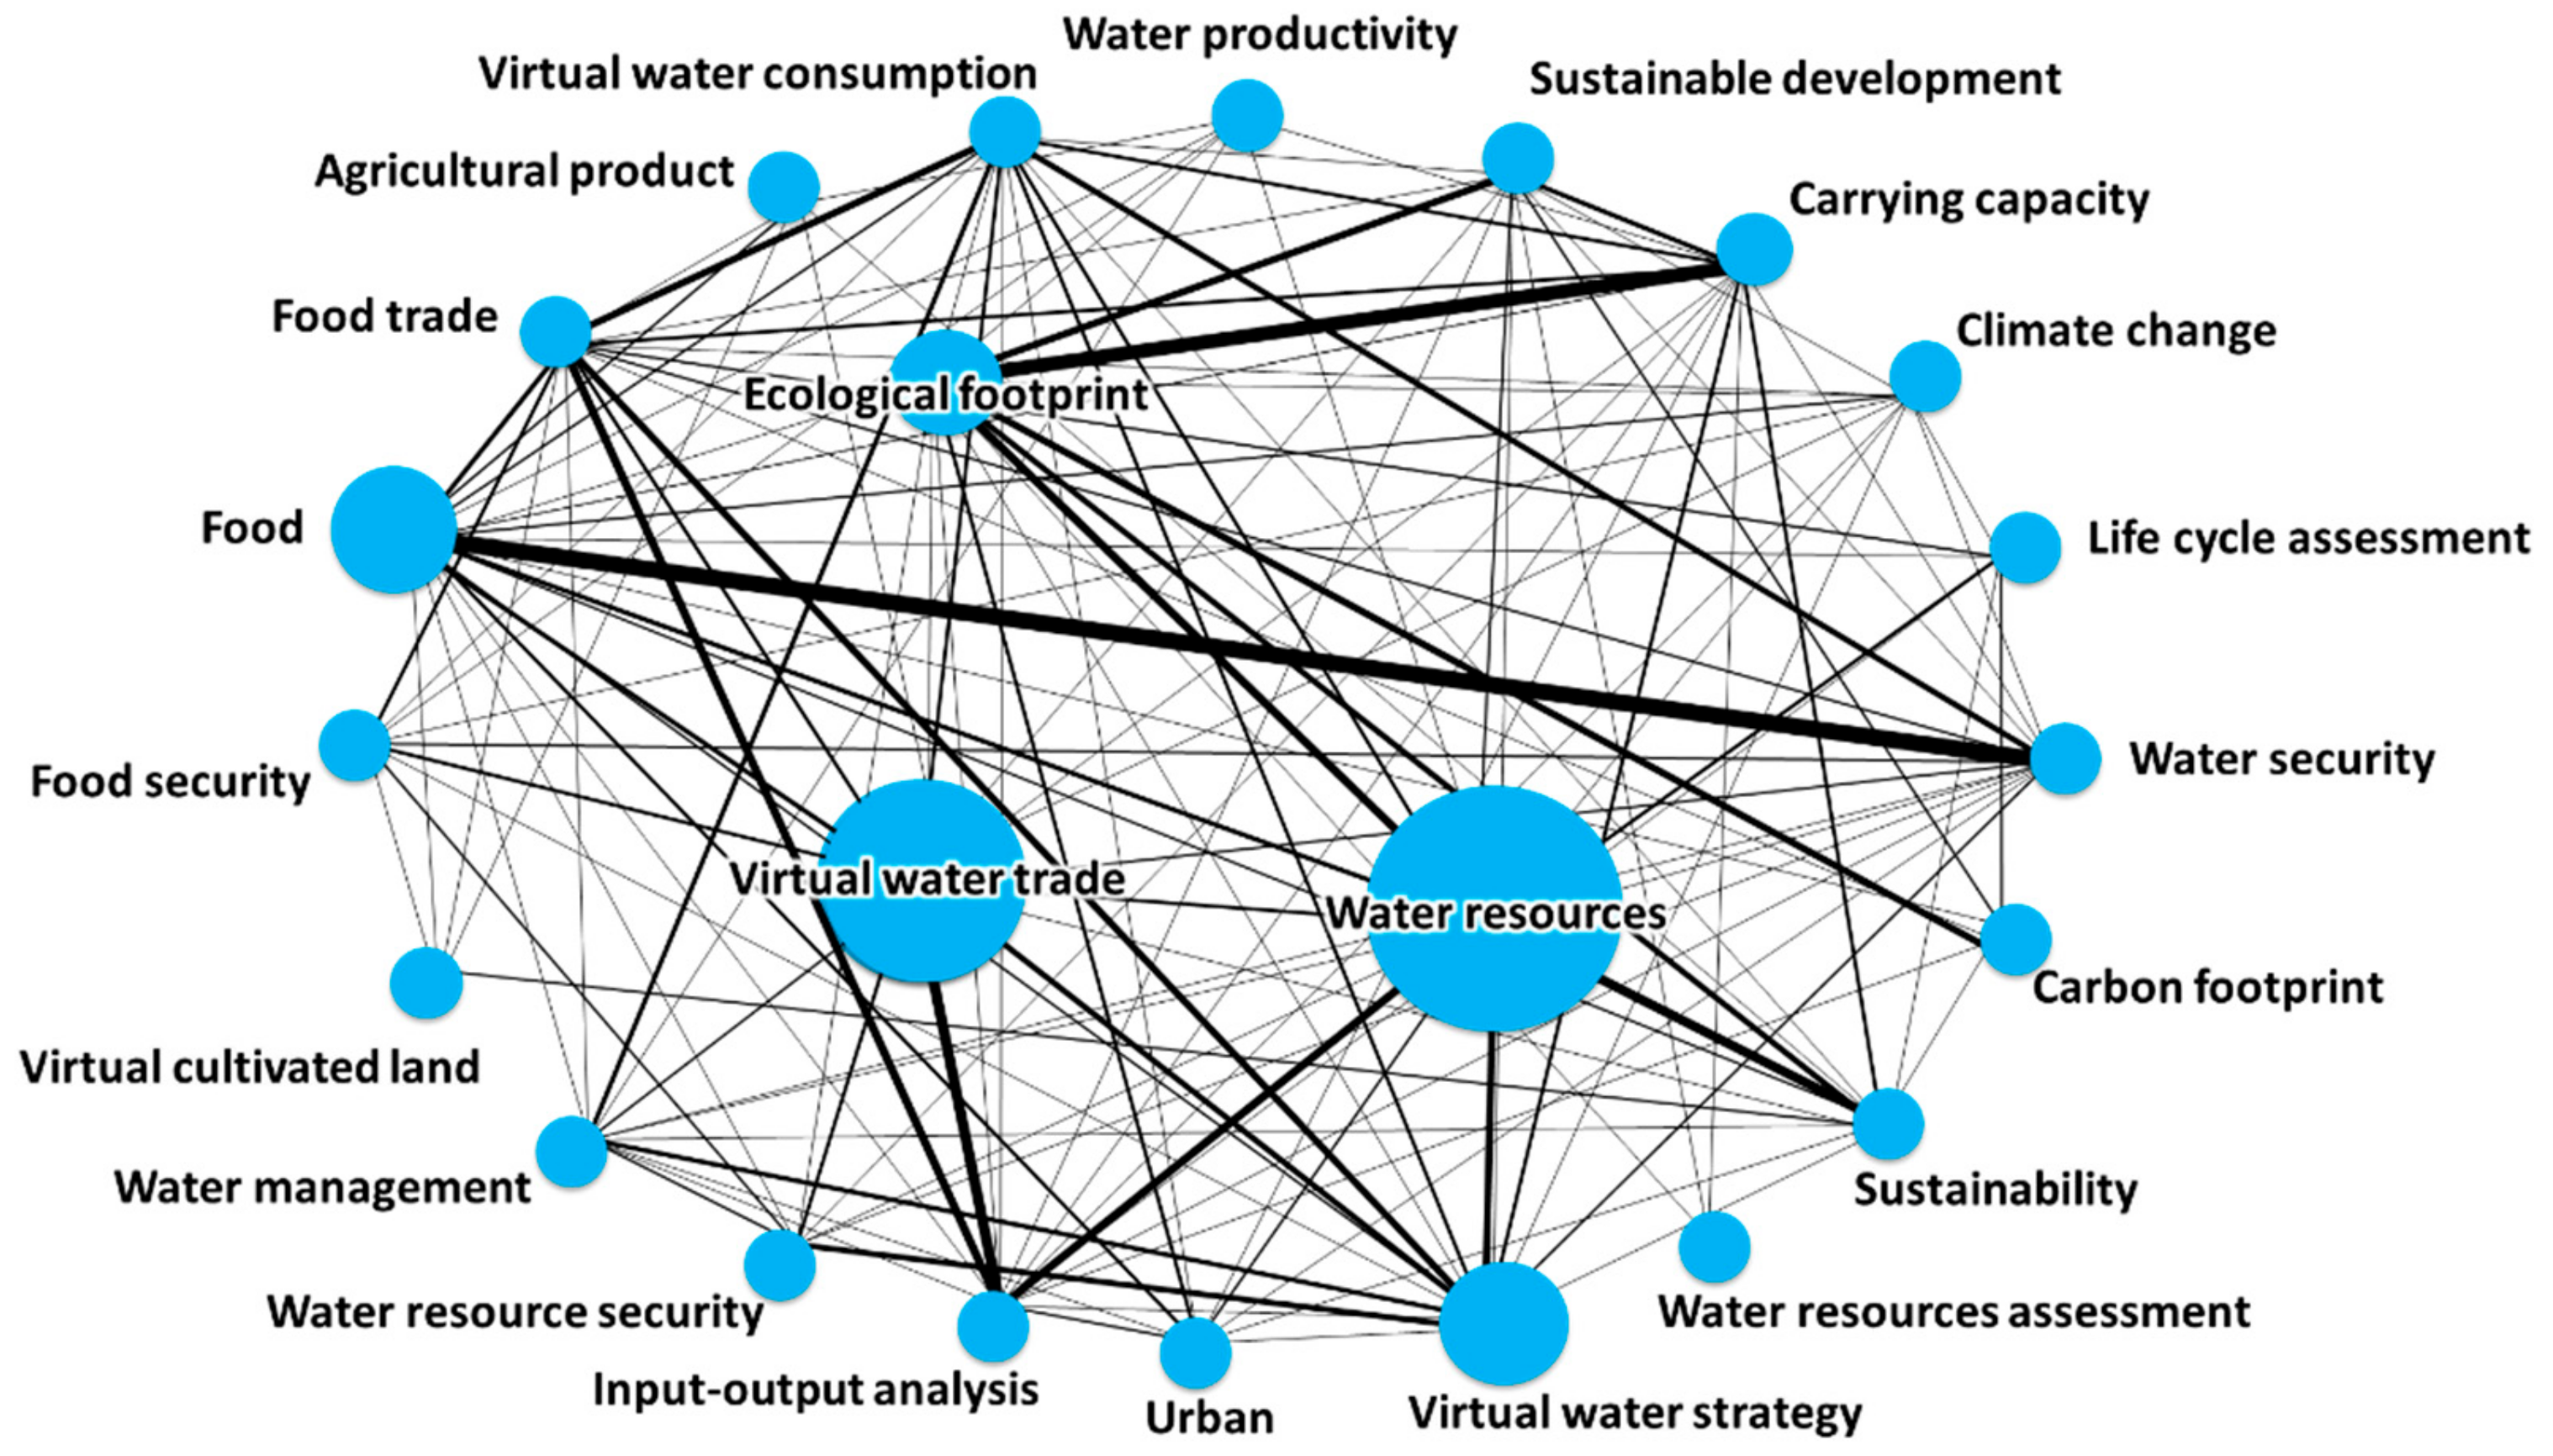
The most frequently used keywords are “virtual water” and “water footprint.” Authors of 487 and 435 articles chose “virtual water” and “water footprint” as keywords, respectively, which represent 31.8%. and 28.4% of all the articles in the keyword analysis, respectively. Besides “China” (88, 5.7%), which is the sixth most commonly used keyword, these keywords represent the main issues and areas of research.
Figure 4 shows the internal relationships among the most commonly used keywords. To avoid redundancy and reflect more details and trends of water footprint research in China, the keywords “virtual water,” “water footprint,” and “China” are excluded from the figure. Of the remaining keywords, “water resources” (172, 11.2%), “virtual water trade” (119, 7.8%), and “virtual water strategy” (97, 6.3%) are the most frequently used.
As shown in
Table 1, the research period is divided into four intervals: 2003–2006, 2007–2010, 2011–2014, and 2015–2018. “Virtual water,” “water footprint,” “water resources,” and “virtual water trade” are the most commonly used keywords for the study period. However, if the different research periods are considered, the ranking of “virtual water” and “virtual water trade” is declining. In fact, the proportion of use of these four keywords is also declining. Taking the most frequently occurring keyword as an example, among the articles with keywords published during the sample period, 61.5% (64 articles) used “virtual water” as a keyword in 2003–2007, but its use dropped to 35.7% in 2011–2014 and 19.1% in 2015–2018. The declining use of traditional keywords and the appearance of new ones indicates the gradual extension of the research scope.
The occurrence rate of “ecological footprint” was only 2.9% in 2003–2006, ranking 13th. In 2011–2014, the percentage increased to 4% and its ranking rose to 7th. Its ranking rose to 5th in 2015–2018, with an occurrence rate of 4.7%. “Agricultural,” “food security,” “food,” and “food trade” are commonly used keywords and their use has increased in recent years, indicating that water footprint research has gradually expanded to food security and the ecological environment.
In addition, “carrying capacity,” “sustainability,” and “carbon footprint” related issues have received increased attention in the past decades. It shows that rational and sustainable use of water resources and their management has become a key concern of sustainable development. The use of keywords indicating research methods and modeling tools is also rising. The keyword analysis shows that input-output analysis is the most commonly used research method, and its ranking rose from 16th in 2003–2006 to 7th in 2015–2018. Meanwhile, “life cycle assessment” first appeared as a keyword in water footprint research in 2013 [
45,
46] and has seen increasing use since then. This shows that new methods and tools in water footprint research are being developed, and they deserve in-depth investigation.
3.5. Research Methods and Tools
In terms of data processing and analysis, water footprint research approaches are classified into two types: bottom-up and top-down [
47]. The top-down method is based on the consumption balance theory, and the results can reflect the dependence of the study area on external water resources. The bottom-up method mostly uses the production tree method to calculate the water footprint of each process in the production system. Both methods have stringent requirements regarding data and research methods. The details and data integrity of the research methods directly affect the accuracy and reliability of results.
The results of the keyword analysis show that research methods are often chosen as keywords. Therefore, an in-depth analysis was carried out to represent changes in water footprint research methodology and tools. Paterson et al. [
18] highlighted the water footprint assessment, environmentally extended input-output, and life cycle assessment models as the three main methodologies for regional or urban water footprint studies. Referring to the results of the analysis in
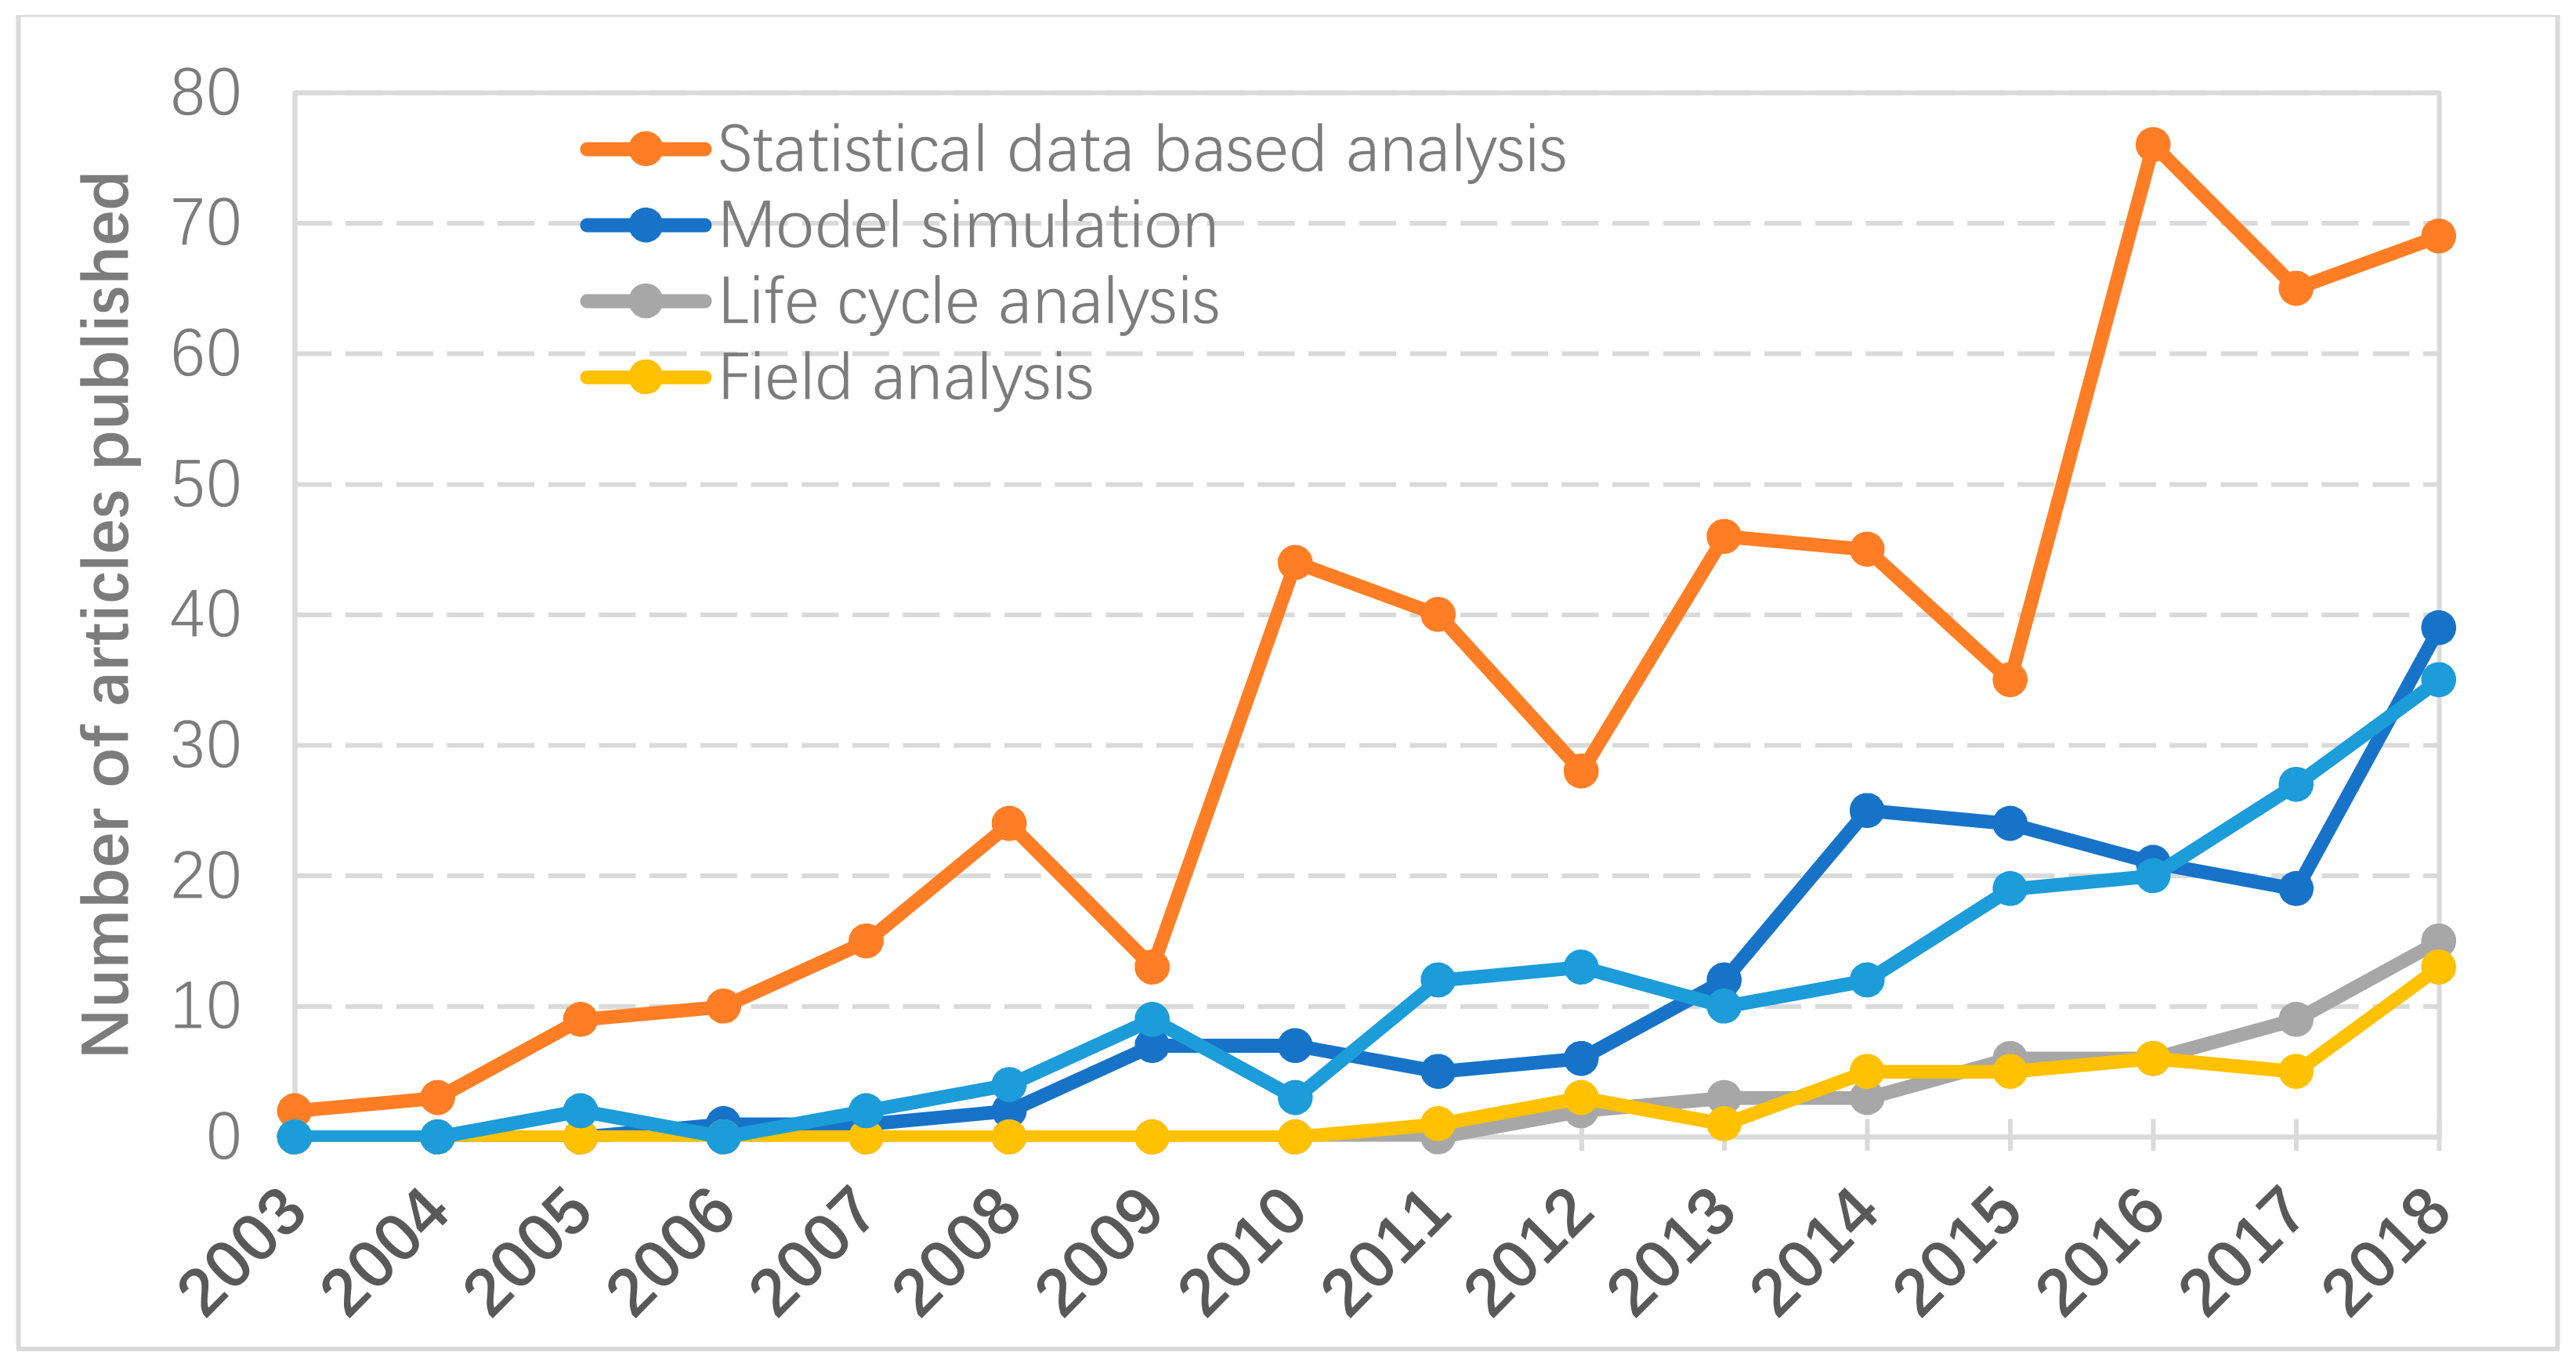
Section 3.4, this research focuses on the following five types of water footprint methods/tools: (1) statistical data-based analysis, (2) model simulation, (3) life cycle analysis, (4) field analysis, and (5) input-output analysis.
As shown in
Figure 5, 524 articles (441 in Chinese and 83 in English), accounting for 33.5% of all articles, were based on statistics and trade data analysis, which is the most common research method. Input-output analysis has been widely used in research on the water footprint and virtual water trade. This method is based on the balanced relations of countries’ or regions’ economic and social development [
48]. Using input-output tables, water resource utilization could be calculated based on final consumption to estimate direct and indirect water consumption in economic activities [
49]. Input-output analysis accounted for only 1.9% (2) and 6.3% (18) of articles during 2003–2006 and 2007–2010, respectively. Its frequency of use has increased to 13.7% (101 articles) in 2015–2018. However, input-output data analysis has its shortcomings. Since economic input-output table data are often only published annually, it is impossible to study the water footprint of a specific product in a specific period or distinguish between the consumption of blue and green water.
To study the spatial virtual water flow for products, researchers are paying more attention to water footprint modeling. Only 5.9% of articles (17) during 2007–2010 focused on water footprint modeling, but the proportion rose to 11.0% (48 articles) during 2011–2014 and 14% (103 articles) during 2015–2018. The computer program for irrigation planning and management CROPWAT (FAO, Rome, Italy) [
50] of the Food and Agriculture Organization; Stochastic Impact by Regression on Population, Affluence and Technology (STIRPAT) [
51]; Logarithmic Mean Divisia Index (LMDI) decomposition model [
11]; computable general equilibrium (CGE) model [
52]; and ecological footprint model [
53] are commonly used in water footprint research. Among them, the CROPWAT model calculates the reference evapotranspiration and crop water and irrigation requirements and distinguishes between the use of blue water and green water. The model is widely used in agricultural water footprint research [
54,
55].
Recently, some researchers have used survey data to investigate the industrial tourism and domestic water footprints. Gu et al. [
56] carried out a study on the natural water environment in nine wastewater treatment plants in south China. Jiang et al. [
31] investigated the influence of household habits on the water footprint using questionnaires. Simultaneously, researchers have carried out field experiments to obtain more accurate data on agricultural water footprints. Compared with 2017, the number of published articles on water footprint field analysis doubled in 2018. Through experiments, the effects of temperature, precipitation, and growth environment on crops can be studied in detail, and these factors play a major role in crop yields and the water footprint [
57,
58]. Survey data and field experiments can also be used to compare the variability of water footprints in different regions, and they will play a significant role in reducing the uncertainties of water footprint research results.
4. Bibliometric Review and Further Enlightenment
4.1. Future Research Hotspots and Trends
An analysis of research hotspots and trends can be undertaken based on research fields, themes, keywords, article titles, and abstracts. Based on our analysis of water footprint research from 2003 to 2018 in China, we find that research on water footprints in China is growing rapidly. Water footprint and virtual water play increasingly important roles in water resource management and environmental protection. New focus areas are emerging, and the research field is expanding.
In the early stage of research, the main concern was the agricultural water footprint. In recent times, the focus has shifted from natural resources to the complex combination of resources, society, and economy. Water footprint research has expanded into industry, economy, trade, virtual water strategy, and many other fields. Although agriculture will continue to use the largest proportion of water, industrial and domestic demand has increased much more rapidly than agricultural demand [
1]. Moreover, water supply, food security, and energy have become the three major issues for sustainable development [
59]. In our opinion, further research is needed on the food-energy-water nexus and to provide support for strategic management decisions.
Evaluation methods in water footprint research have also gradually diversified. Research methods have developed from traditional statistical analysis to modeling, field experiments, and surveys. Diversification of research methods and comparison between data from different studies may help reduce the uncertainty of water footprint assessments. The water footprint, as a method to quantify the water resources needed for the production and consumption of products, provides an important decision-making basis for resource management. Therefore, as the data and research methods have led to uncertainty in all aspects of water footprint research, it is important to quantitatively identify the mechanism and transmission path of uncertainty in the process of water footprint evaluation, thus improving the reliability and accuracy of water footprint accounting. The result of this bibliometric analysis indicates that small-scale studies such as field experiments and surveys are becoming the focus of research. This development will enhance the comparability of the results of water footprint studies in different regions and reduce the uncertainty of research results.
4.2. Research Limitation
A bibliometric analysis based on the quantitative literature statistics method can highlight the trends and focus of scientific research. This manuscript uses the bibliometric technique to analyze and discuss the past, present, and future of water footprint research in China, thereby revealing the progress in research and possible future research hotspots. In addition, to compare the results of different water footprint studies, the measured water footprint values are extracted from each article. The water footprint comparison shows that there are significant differences in the results of current water footprint studies. Consequently, there is still a need for in-depth systematic analyses. For example, how are systematic boundaries defined in water footprint research? What are the differences among regions and the reasons for those differences? In particular, it is necessary to strengthen the horizontal analysis of research methods. Therefore, the application of bibliometric statistics in combination with other technologies is needed for in-depth analyses. Nevertheless, bibliometric analysis objectively reflects the development process and research focus of water footprint research in China. It shows the current tendencies, hotspots, and weaknesses of the research area and can provide reference for researchers and decision makers alike.
5. Conclusions
Based on the bibliometric analysis of 1564 water footprint articles in the CNKI and WoS from 2003 to 2018, this article analyzes the measured water footprint values as well as the current trends and hotspots of water footprint research in China. The literature associated with water footprint research has grown significantly in the past decade. The research field has also gradually expanded from agricultural water footprint to integrated and industrial water footprints. The results indicate that the water footprint in Northern China draws twice as much attention as that in Southern China (676 articles and 327 articles, respectively). Additionally, more attention should be paid to environmental problems associated with the water footprint. The analysis of keywords, research tools, and methods indicates that the breadth and depth of research is expanding. The study shows that water footprint research has gradually expanded from a focus on shortages to emphasis on economic trade, food security, and the environment.
By comparing water footprint per capita and those for agricultural products, thermo power, and the textile industry in different regions, we find that the water footprint in China has obvious regional characteristics. Northeast China has the lowest grain water footprint of 0.67 m3/kg, 0.83 m3/kg, 0.86 m3/kg, and 1.52 m3/kg for corn, rice, wheat, and soybean, respectively. Northern China has the lowest water footprint per capita (696.7 m3/person/year). Nonetheless, the uncertainty of results needs to be discussed further. Future studies and field experiments on water footprint modeling are needed to explore the water-ecological environment under complex systems. Additionally, more studies on innovative technologies linking micro-level water use efficiency with water resource development should be undertaken.

 ,
, 


