Article

Dynamics of Upwelling Annual Cycle in the Equatorial Pacific Ocean

Department of Atmospheric Sciences, National Central University, Taoyuan 32001, Taiwan
*
Author to whom correspondence should be addressed.
Sustainability 2019, 11(18), 5038; https://doi.org/10.3390/su11185038
Submission received: 30 July 2019 / Revised: 5 September 2019 / Accepted: 11 September 2019 / Published: 15 September 2019

Abstract

:
A recent work proposed a simple theory based on the framework of Zebiak–Cane (ZC) ocean model, and successfully characterized the equatorial Atlantic upwelling annual cycle as a combination of the local wind-driven Ekman upwelling and nonlocal wind-driven wave upwelling. In the present work, utilizing the same simple framework, we examined the fidelity of the upwelling Pacific annual cycle using observations and simulations from the Coupled Model Intercomparison Project Phase 5 (CMIP5). We demonstrated that the theoretical upwelling annual cycles generally match the original upwelling annual cycles in the equatorial Pacific in both observations and CMIP5 simulations. Therefore, this simple formulation can be used to represent the upwelling annual cycle in the equatorial Pacific. Observationally, the equatorial Pacific upwelling annual cycle is dominated by the local wind-driven Ekman upwelling, while the remote wave upwelling is confined near the eastern boundary with little contribution. In CMIP5 simulations, though the theoretical-reconstructed upwelling well-reproduces the original upwelling, the contribution is totally different compared to the observation. The wave upwelling serves as the main contributor instead of the Ekman upwelling. We further demonstrated that such discrepancy is attributable to the bias of the central to eastern equatorial thermocline depth patterns. This amplified, westward-shift wave upwelling weakened the impacts of the Ekman upwelling, and contributes to the entire Pacific equatorial upwelling annual cycle substantially. This implies that a realistic simulation of the equatorial Pacific upwelling annual cycle in models is very sensitive to the careful simulation of the equatorial thermocline depth annual evolutions.

Key points:

  • The linear framework of the Zebiak–Cane ocean model for upwelling annual cycle works well in the Pacific through observed and Coupled Model Intercomparison Project Phase 5 (CMIP5) results.
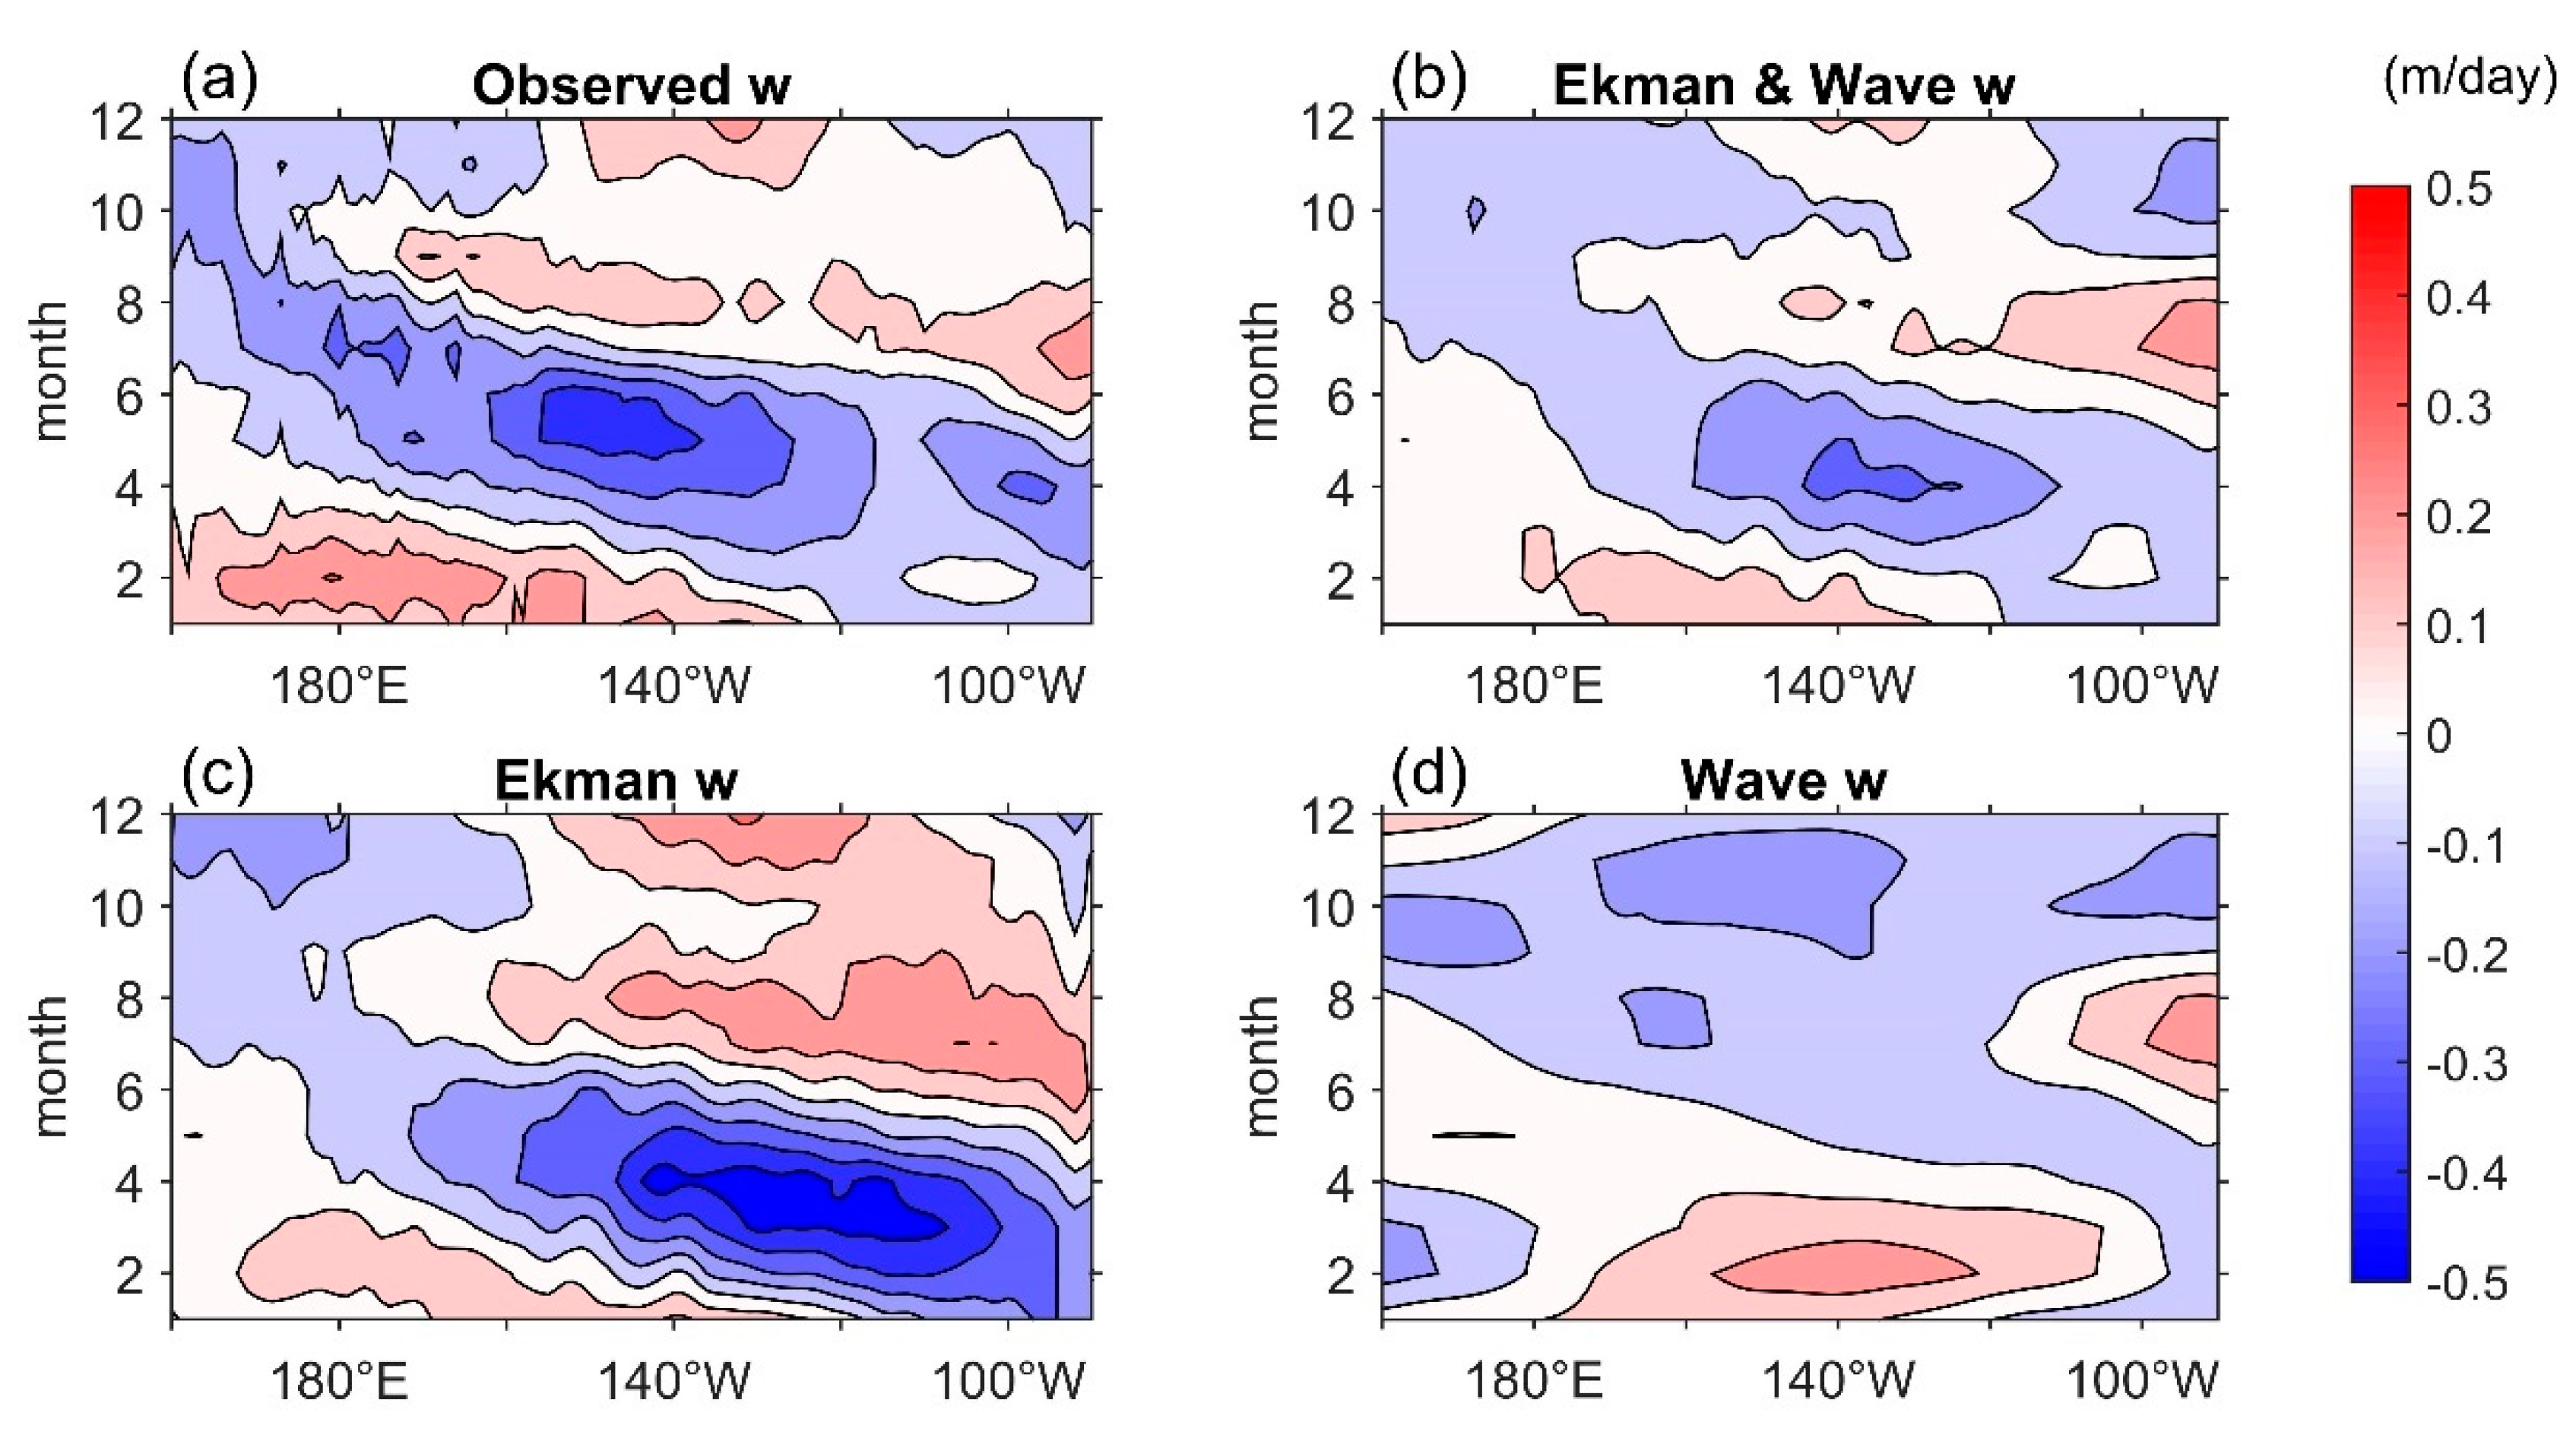
  • In observation, the equatorial Pacific upwelling annual cycle is dominated by local wind-driven Ekman effects.
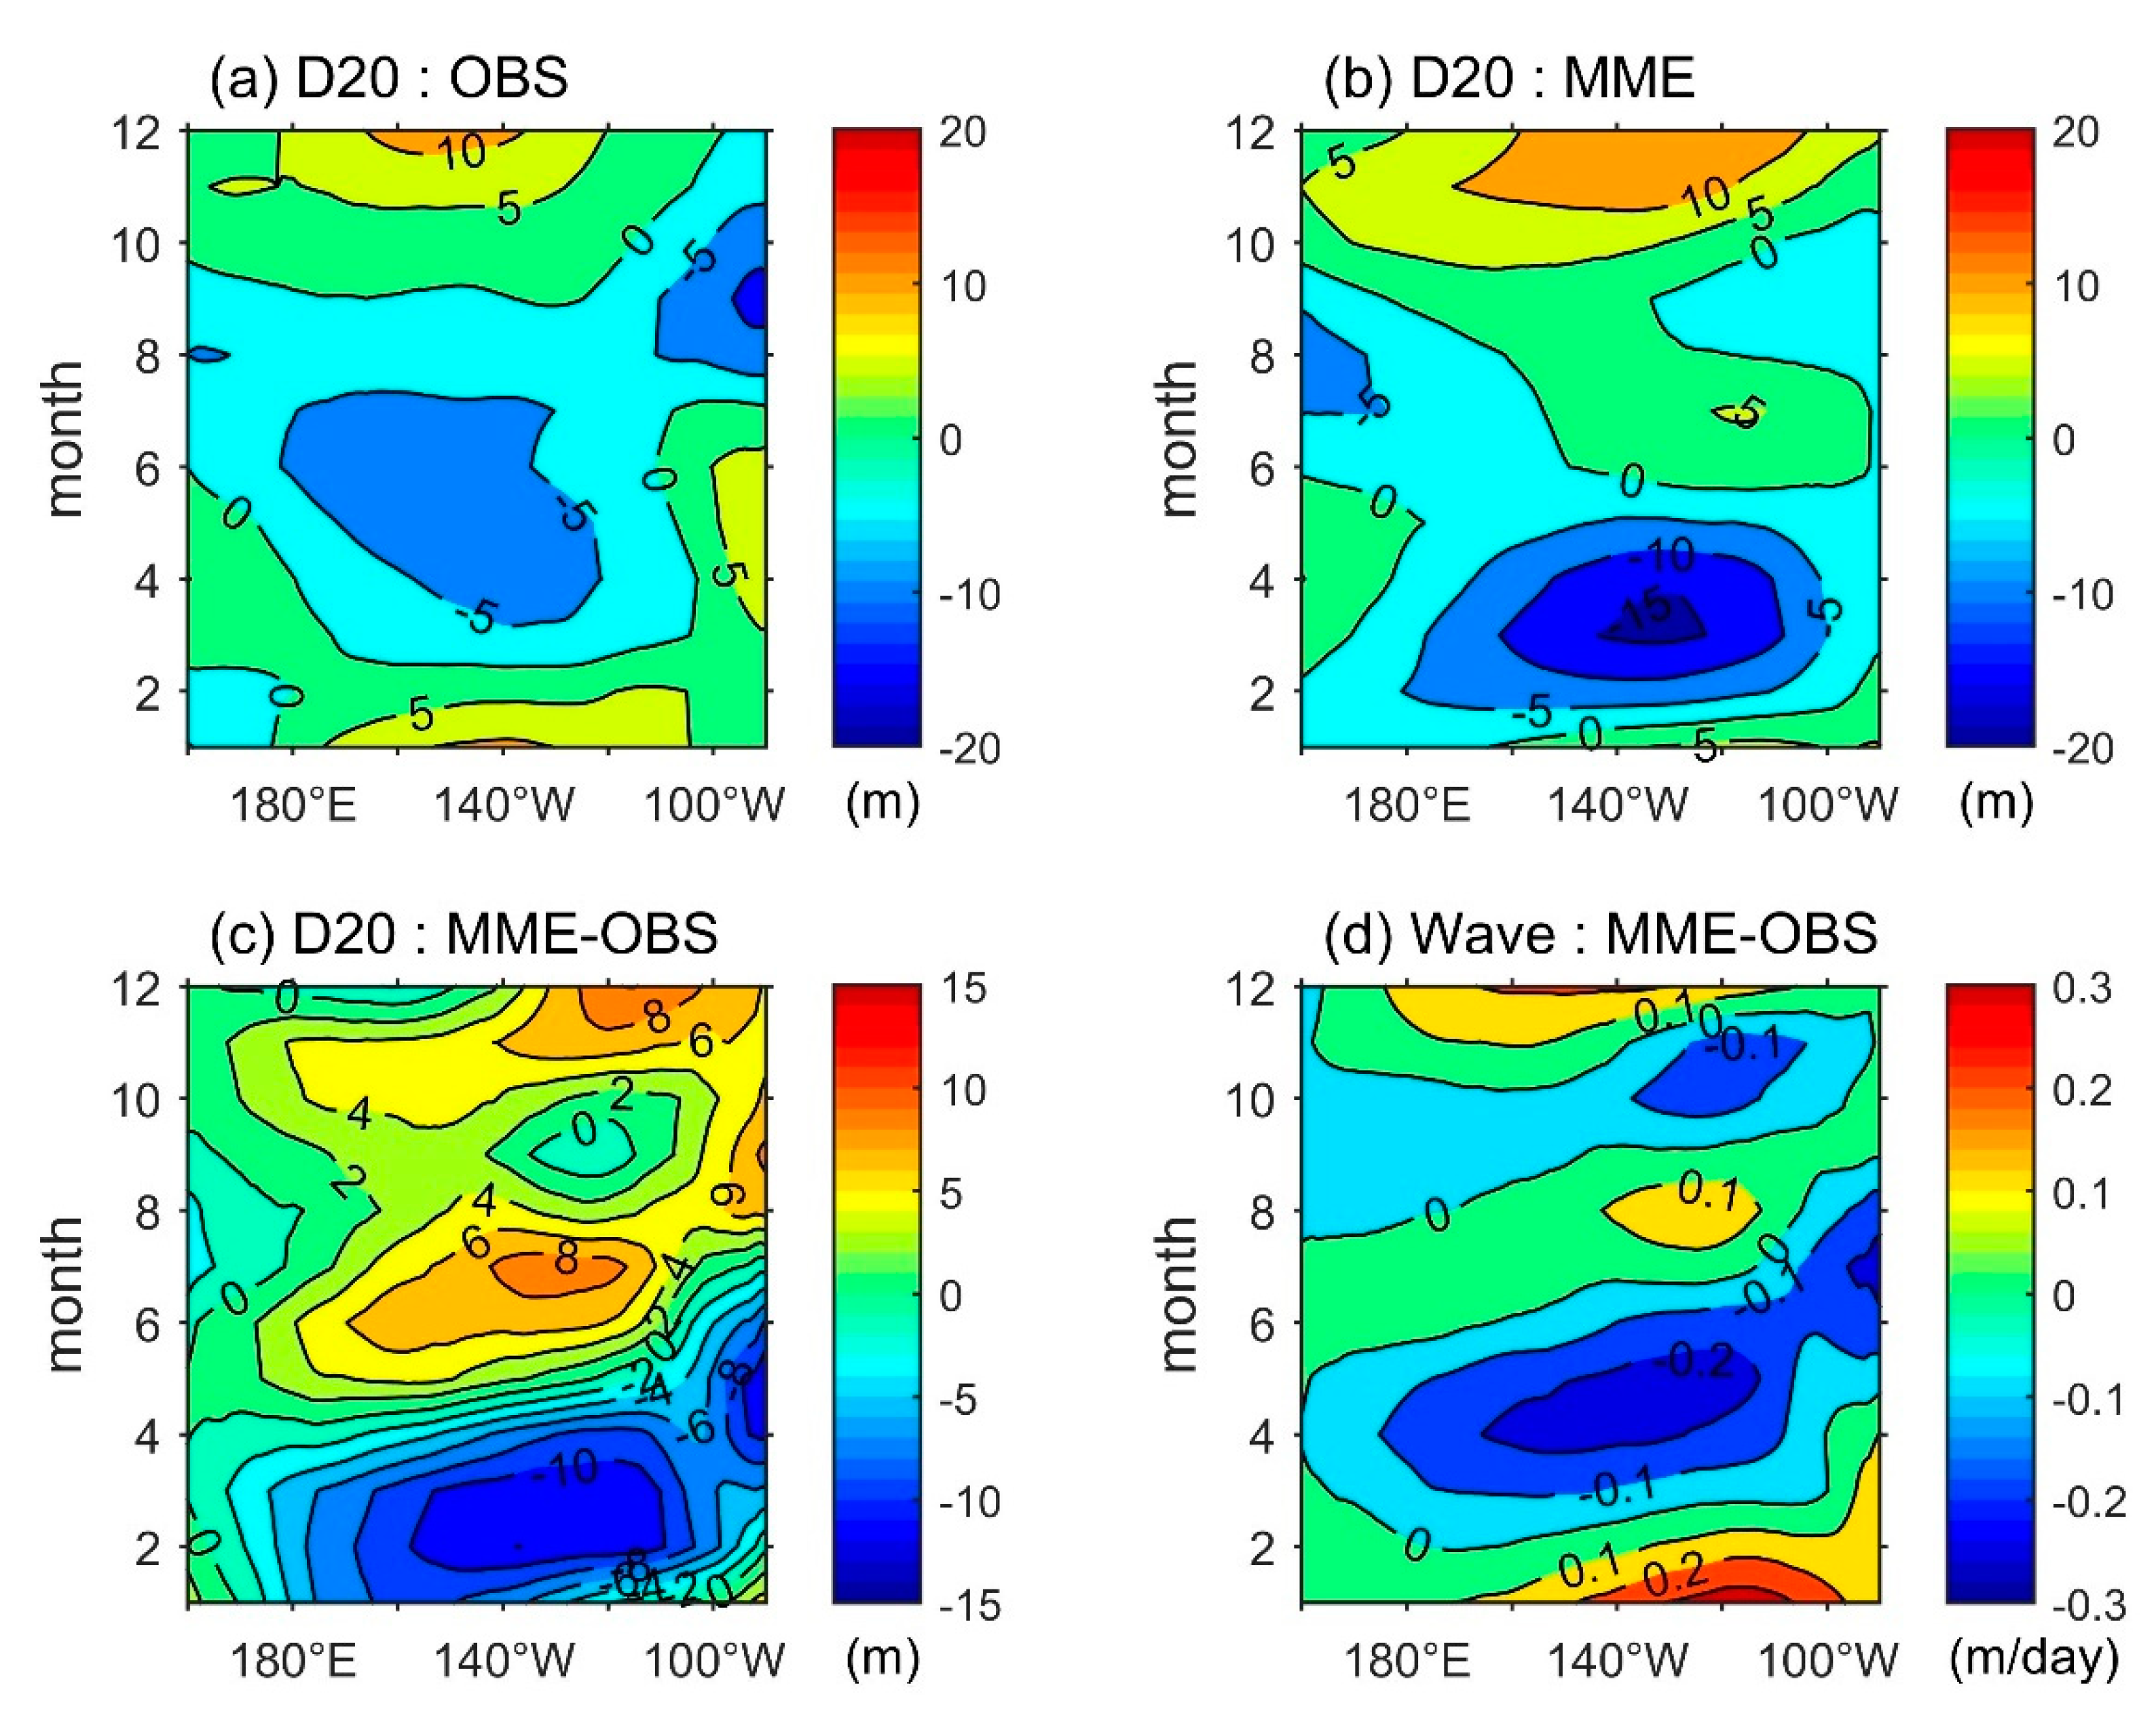
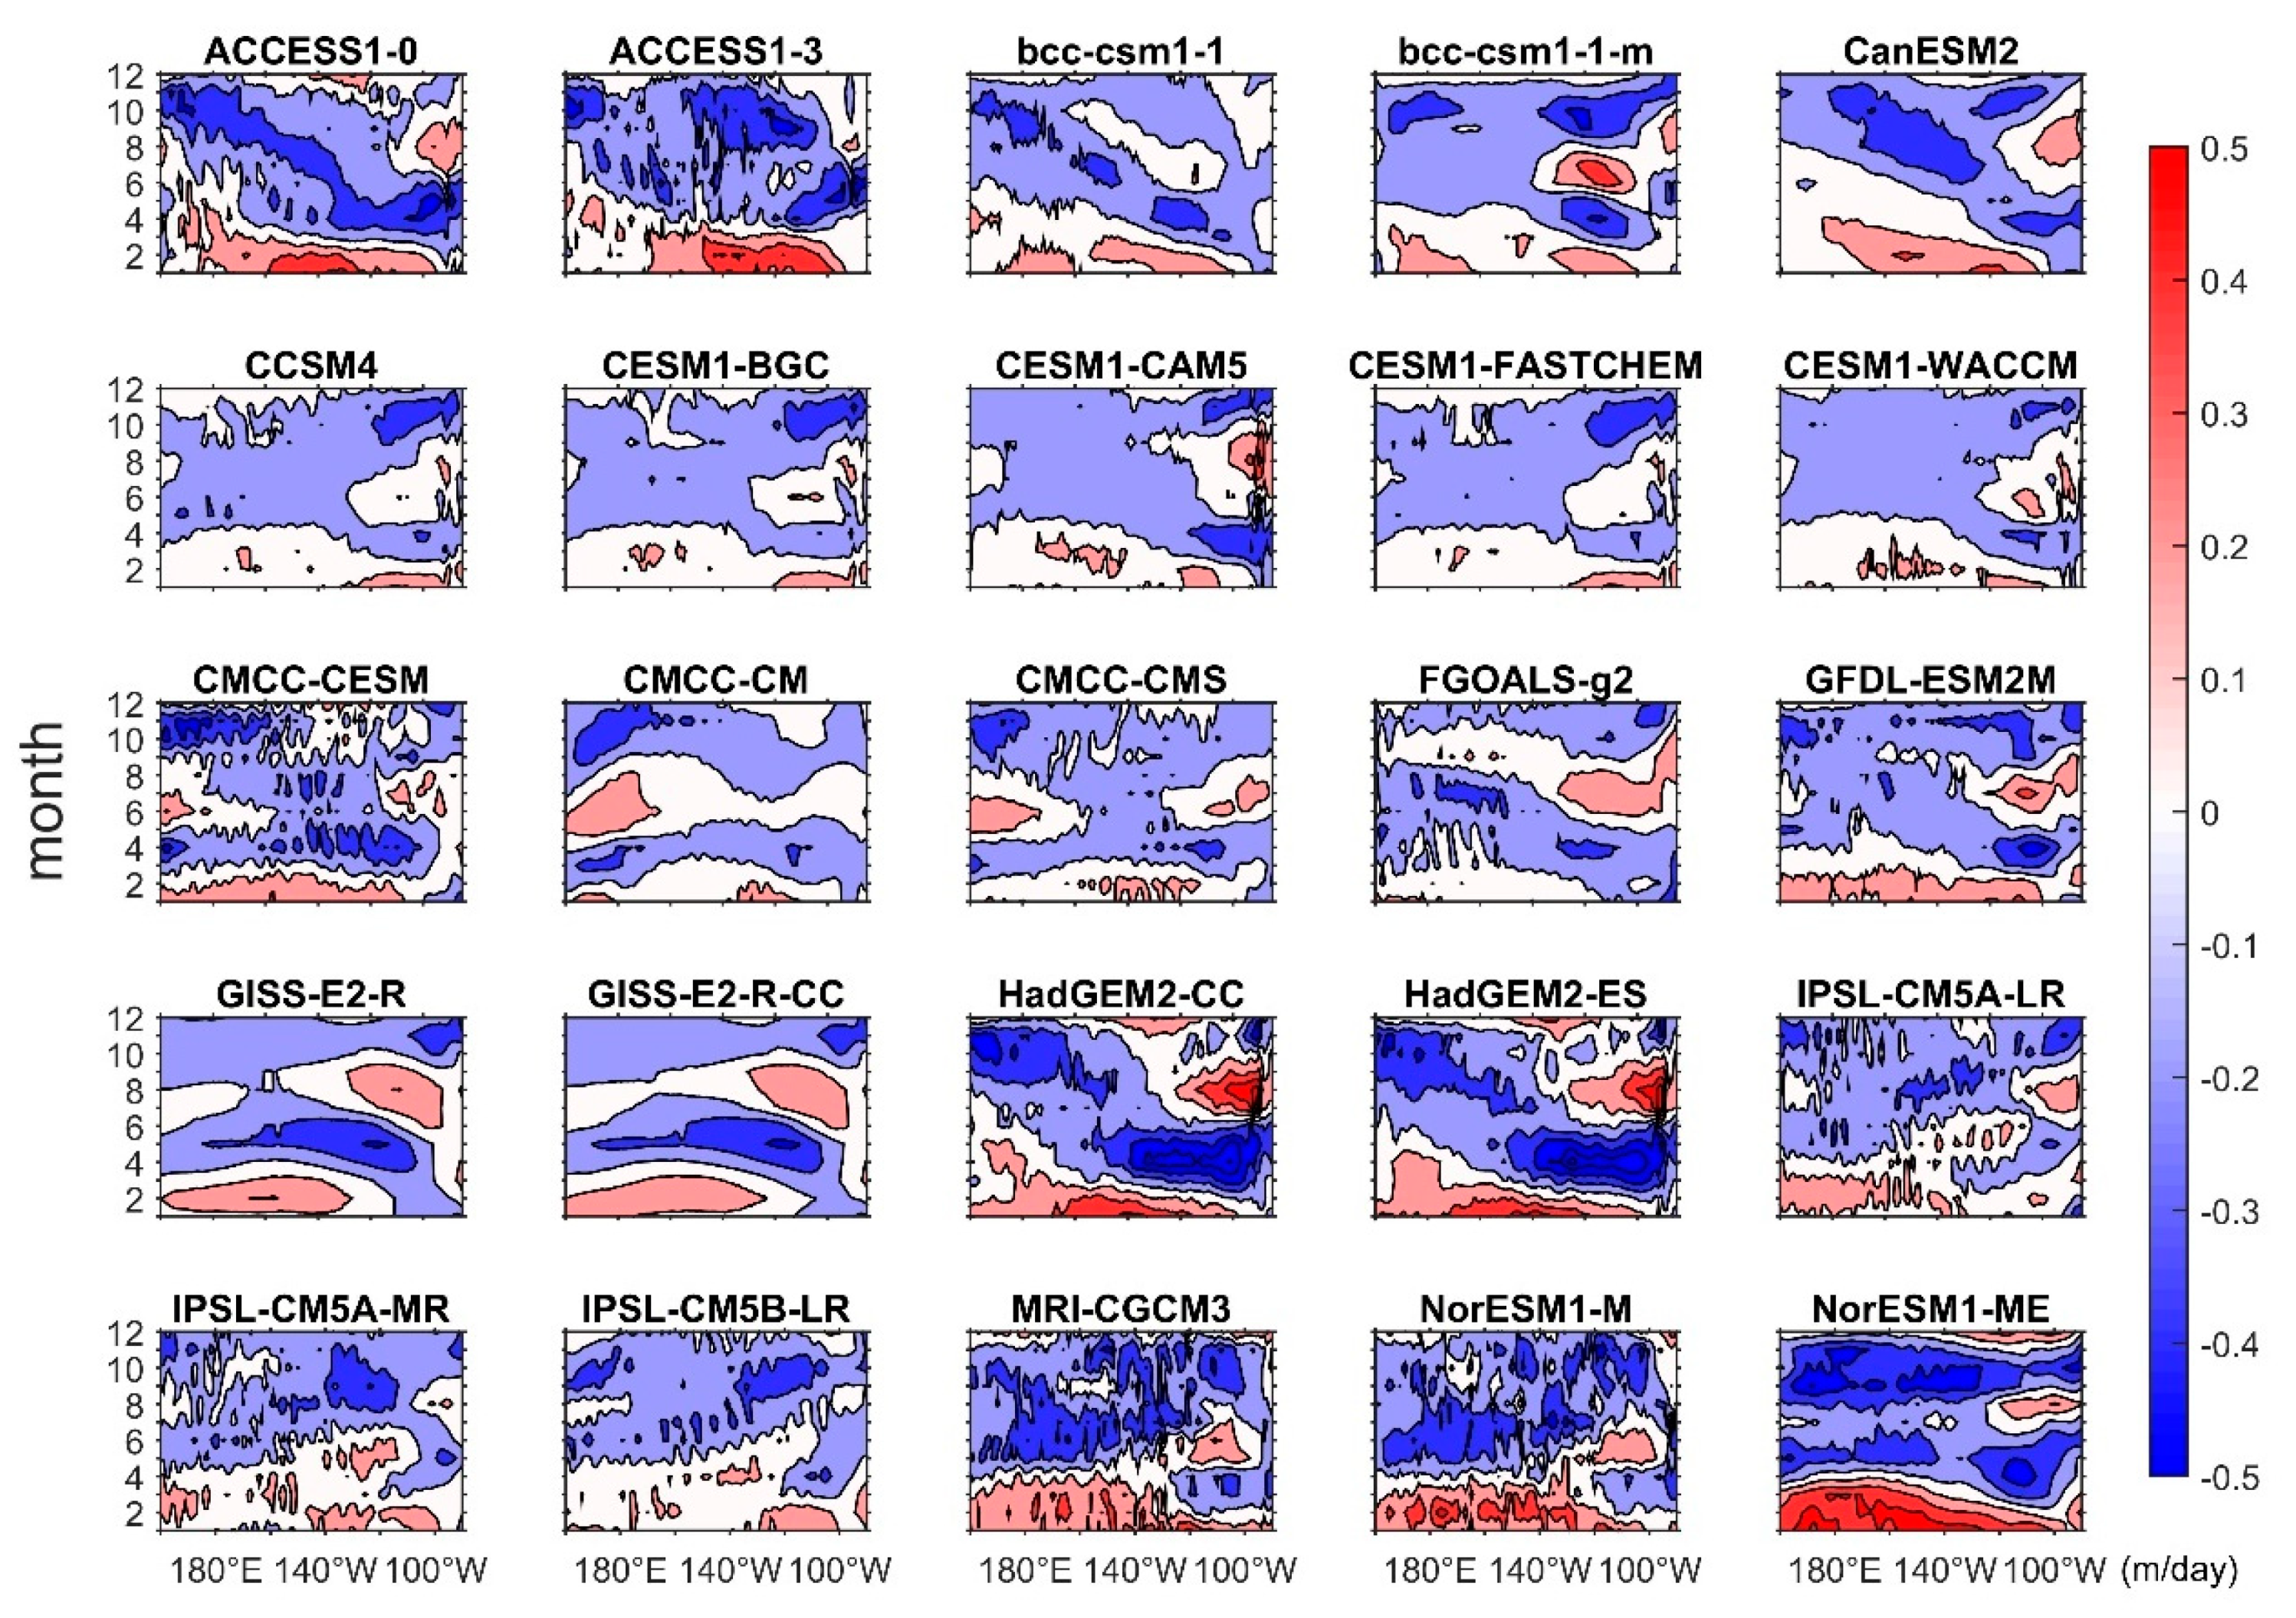
  • In CMIP5 simulations, the amplified westward-shift wave upwelling overtakes Ekman effects and plays a crucial role in the equatorial Pacific upwelling annual cycle.

1. Introduction

Equatorial upwelling and its annual cycle play a vitally important role in cold tongue development. It pumps the subsurface water up and forms a tongue-like cold water at the surface, stretching from the coast of South America to the central Pacific [1]. This band of cold water (so called cold tongue) restrains the atmospheric convection and severely impacts the entire tropical climatic system [2]. The equatorial upwelling generally peaks in early summer, and thereafter, the cold tongue sea surface temperature (SST) reaches a minimum immediately, revealing the important dynamic cooling effect in controlling the phasing of the equatorial cold tongue SST annual cycle [3,4]. The equatorial upwelling is also key to the marine ecosystem. The enhancing or weakening of the equatorial upwelling is tightly associated with nutrient concentration and primary productivities [5].
Great efforts have been made into investigating the variability of the equatorial upwelling. It is believed that the Ekman pumping driven by local winds is key to the variations of the equatorial upwelling [6,7,8]. A recent study pointed out that the turbulent momentum flux and the imbalance between circulation and pressure fields may be the main contributor of the equatorial upwelling [9]. However, the detailed fundamental dynamics of the equatorial upwelling annual cycle has not yet been completely refined.
Recently, a linear framework for the equatorial upwelling annual cycle was developed by Wang et al. [10], based on the Zebiak–Cane (ZC) ocean model [[11], hereafter ZC87]. It is a linear combination of two processes: The local wind-driven Ekman upwelling and the non-local wind-driven wave upwelling. They also demonstrated in the observation that the Ekman upwelling plays a key role in the western equatorial Atlantic, whereas wave upwelling dominates the eastern equatorial Atlantic. Wang et al. [12] further explored the validity of the simple upwelling framework of the Coupled Model Intercomparison Phase 5 (CMIP5) simulations, and confirmed that this framework can be used to successfully characterize equatorial Atlantic upwelling annual cycles in CMIP5 simulations as well. However, this framework has not been verified in the Pacific. In the present work, we investigated the validity of the simple upwelling framework in the equatorial Pacific through observation and CMIP5 simulations. What is required to allow CMIP5 models to afford realistic simulations are also discussed in this work.
The remainder of this paper is organized as follows. Section 2 describes the dataset we used. In Section 3, the theoretical-reconstructed equatorial Pacific upwelling annual cycles in observation and CMIP5 simulations are analyzed, and the dynamic reasons for the introduction of systematic bias into model simulations are explored. A conclusion (Section 4) follows to summarize the major findings of this study.

2. Model and Data

The observational data including vertical velocity, SST, wind stresses, and 20 °C isotherm depth which represents the thermocline depth was obtained from the European Centre for Medium-Range Weather Forecasts (ECMWF) operational ocean analysis/reanalysis system [ORA-S3; [13], for the period 1959–2009]. The fine equatorial resolution of ORA-S3 is important in analyzing the ocean-atmosphere dynamics in the tropical Pacific [14,15]. It has also been frequently used in the equatorial area based on previous studies [10,12,16,17,18], indicating the reliability of this dataset. The annual cycles were defined in this work as the anomalies with respect to the climate annual mean of the entire data period.
For the modeled data, we analyzed a series of historical experiment simulations from 25 CMIP5 models during the period around 1950–2005. We used the “historical” experiment and the first realization “r1i1p1” in each case. See Taylor et al. [19] for the relevant model descriptions and experiment designs. We mainly focused on the performance of CMIP5 multi-model ensemble (MME). The results of each individual and the average value of 25 models are also discussed. The data from all model outputs were interpolated onto a 1° × 1° grid. Detailed information about the analyzed models is given in Table 1.

3. Results and Discussion

3.1. The Theoretical Formation of Upwelling Annual Cycles

The theory to characterize the upwelling annual cycle in the equatorial area proposed by Wang et al. [10] is based on the ZC87 model [11]. The equatorial upwelling annual cycle can be characterized by a linear combination of a locally wind-driven Ekman upwelling and a nonlocally wind-driven upwelling:
W   = W e · [ 1 R ( x ) ] + W h · R ( x )
R ( x ) = H 1 / H ( x ) = 50 / H ( x ) = 1   if   H ( x ) < 50
The Ekman and wave upwellings are represented as We and Wh, respectively. “x” here denotes longitude. The wave upwelling here is calculated as -𝝏h/𝝏t (h denotes the depth of the thermocline). In other words, the waving upwelling represents the negative thermocline tendency. H and H1 refer to the mean climatic thermocline depth and the constant mixed layer depth, respectively. This linear framework of equatorial upwelling essentially follows ZC87, except that this formulation takes the zonal variations in the climatic mean of the thermocline depth, which is R(x), into account. Thus, the function R(x) also depends on longitude. See Wang et al. [10] and the Supplementary Information for more details.
Regarding the case in the equatorial Pacific, it was generally believed that upwellings were mostly driven by local winds through the Ekman pumping processes [6,7,8]. In this work, we first verified if the formulation still held in the equatorial Pacific upwelling annual cycle. Next, we investigated the dynamics of the essential controls on the equatorial Pacific upwelling annual cycle. Both the observational and modeled results will be discussed.

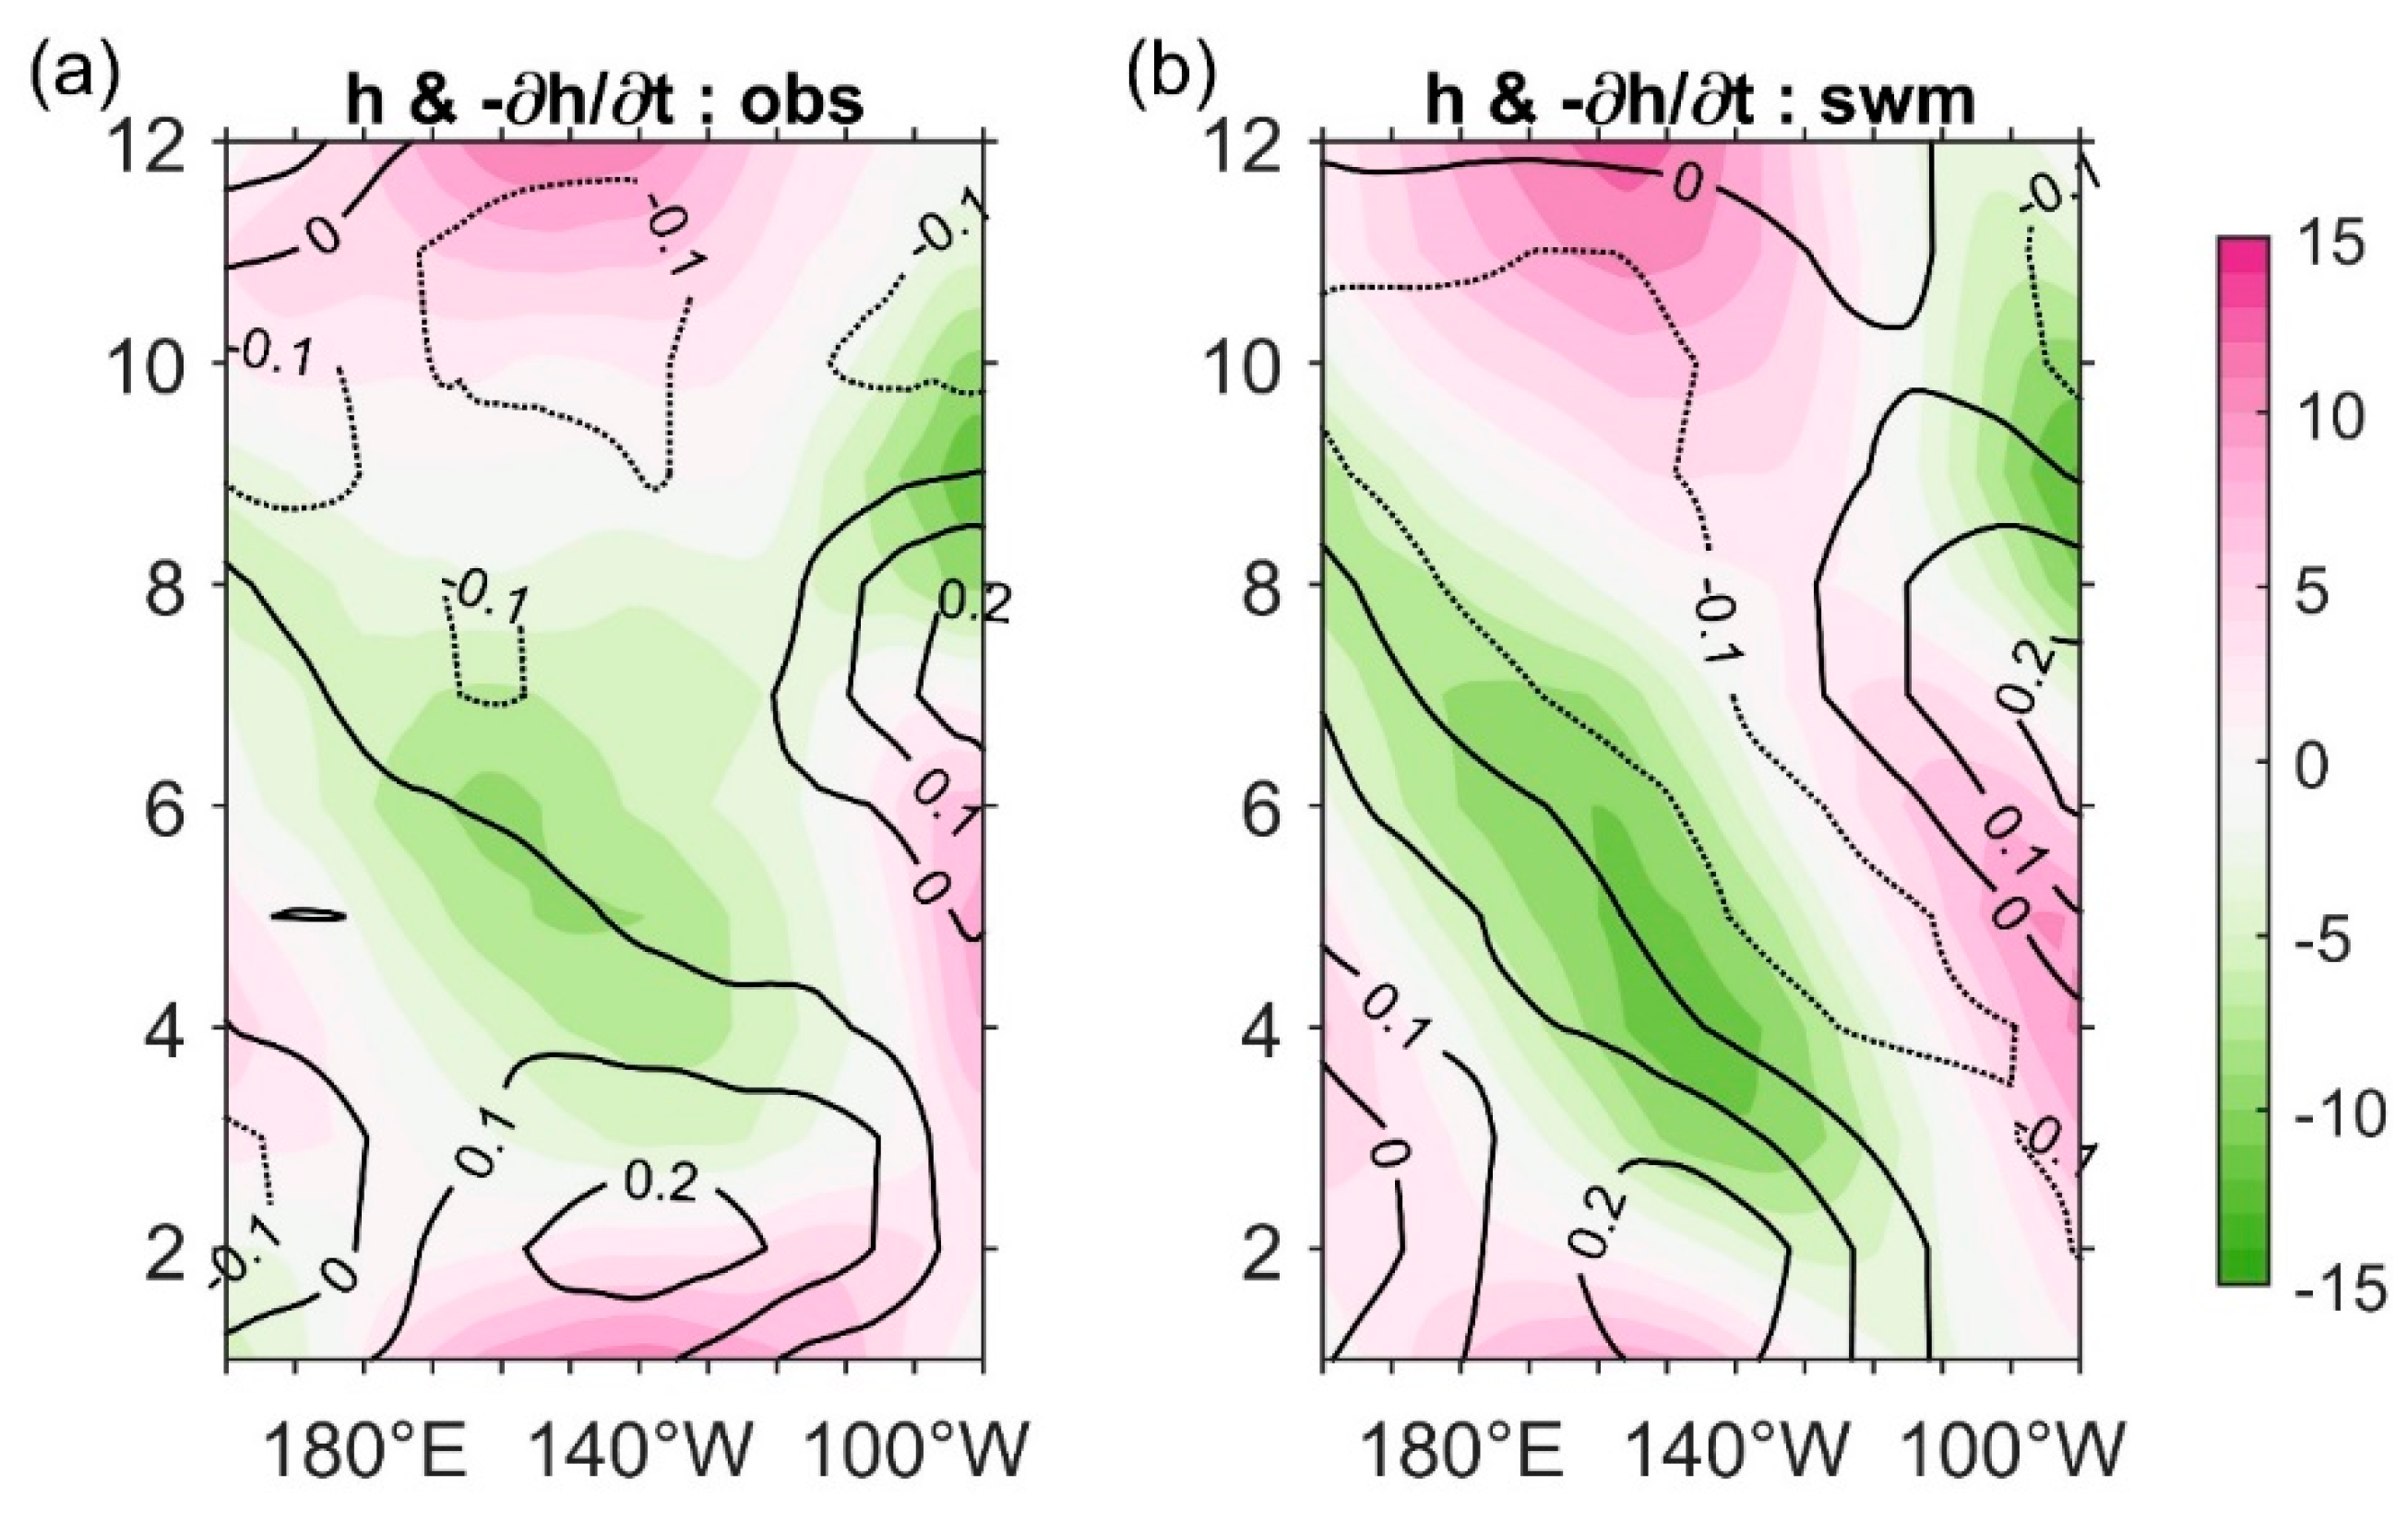
3.2. Validation in Observation

To obtain the theoretical equatorial vertical velocity in the Pacific using this formulation, we used: (1) The observed surface wind stress to calculate the Ekman upwelling We, (2) the observed thermocline depth to calculate Wh; and (3) the observed climate mean depth of thermocline H(x) to calculate R(x). We then made a comparison between the original W from ORA-S3 data and the theoretical-estimated W from the formulation (Figure 1).
The original equatorial upwelling annual cycle was found to be dominated by a strong component expanding all over the year in the central to eastern Pacific. The negative value (downwelling) peaked around May–June, while the positive value (upwelling) took place at the beginning and the end of the year. This seasonal pattern was also found in previous work [20]. These features were both captured by the theoretically estimated W (Figure 1b), the pattern correlation between the original and theoretical estimated vertical velocity reached 0.81, indicating that the simple formulation of (1) was also successful in the Pacific.
With our simple formulation, we further examined the contributions to the 50 m vertical velocity from the Ekman upwelling and the wave upwelling. The Ekman upwelling (Figure 1c) showed a consistent pattern as the main dominated signal in the original vertical velocity. It was dominated in the central to eastern Pacific with a clear prevailing component which had a phasing very similar to the observed original upwelling (Figure 1a), except that the highest variability in the Ekman upwelling started 2–3 months earlier than that in the original upwelling. The pattern correlation between the observed vertical velocity in Figure 1a and the derived Ekman upwelling reached 0.72, demonstrating that the Ekman upwelling determined to a large extent the upwelling annual cycle in the equatorial Pacific Ocean. In contrast, the wave upwelling played a minor role in the equatorial Pacific upwelling annual cycle (Figure 1d). The pattern correlation between the observed vertical velocity and the wave upwelling was about 0.11, implying that the wave effects contributed very little.
Indicated by Wang et al. [10,12], this linear combination derived from the ZC87 model is naturally the best way to capture contributions from the Ekman and wave upwellings in the equatorial Atlantic. The results in the present study further verify that this formulation worked just as well in the equatorial Pacific. Moreover, it confirmed the dominant role of the wind-driven Ekman processes in the upwelling annual cycle in the equatorial Pacific.
Since the Ekman upwelling is associated with the local wind stress forcing, we further used a shallow-water model [21] (hereafter denoted as SWM) to discern the dynamics of the wave upwelling near the eastern boundary. We found that the SWM successfully captures the annual variations of the equatorial thermocline (Figure 2a,b, shadings), and this was in high agreement with several studies [22,23]. The pattern correlation between the observational and the SWM-modeled thermocline depth was 0.78. The essential point here, however, is that the notable consistency of the simulated wave upwelling with the observed wave upwelling as estimated by the observed thermocline tendency (Figure 2a,b, contours), showed a pattern correlation as high as 0.79.

3.3. Validation in CMIP5 Simulations

Before contrasting the upwelling annual cycles in the equatorial Pacific between the observation and CMIP5 simulations through this linear framework, we first took a glance at how the CMIP5 upwelling annual cycle performed in longitude–time evolutions (Figure 3). Compared to the observation (Figure 1a), not all CMIP5 models yielded realistic upwelling annual cycle patterns. Their performances are actually diverse. The weak semi-annual signal in the observational wave upwelling seemed to be enlarged and shifted westward in CMIP5 simulations. Yet, a large part of them still reproduced an annual signal in the central Pacific.
We then applied this simple framework to the CMIP5 simulations of the Pacific equatorial upwelling annual cycle (Figure 4) and compared them with the observation. Suggested from Figure 1, in the observed upwelling annual cycle, the Ekman upwelling served as a dominant contributor, whereas the wave upwelling contributed very little. In contrast, the CMIP5 MME pictured a fairly different story. The pattern correlation between the original and theoretical-reconstructed upwelling (Figure 4a,b) from the MME was 0.7, a bit smaller than observational results but still agreeing that the simple framework did a good job in characterizing the equatorial upwelling annual cycle pattern in model simulations. However, the wave upwelling (Figure 4d) served as a main contributor instead of the Ekman upwelling (Figure 4c) here. The pattern correlation between the original and the Ekman/wave upwelling was 0.35/0.75. Surprisingly, compared to the theoretically-reconstructed upwelling, the wave upwelling had an even higher consistency with the original upwelling. This somehow implies that in CMIP5 MME, the contribution of the local wind-driven Ekman upwelling was minor and overtaken by the remote wave upwelling. There are two more points worthy of note about the observation and the CMIP5 MME: First, the wave upwelling in observation was weak and confined to the eastern boundary (Figure 1d), while the wave upwelling in the MME was much stronger, shifting westward and occupying the central Pacific (Figure 4d). Second, the MME Ekman upwelling (Figure 4d) actually showed a quite similar pattern and amplitude as the observational Ekman upwelling (Figure 1c), but it failed to take control in the original upwelling annual cycle (Figure 4a). Evidently, the original output upwelling in CMIP5 MME was systematically biased. The reason will be discussed in the next section.
Figure 5 displays the pattern correlations between the originally simulated and the Ekman/wave/theoretically estimated equatorial upwellings, which are presented as blue, green and yellow colors, respectively, in light of 25 CMIP5 individual simulations. Concerning the theoretical upwellings (yellow bars), a great part of the models adequately reproduced the upwelling annual cycle in the equatorial Pacific; the mean correlation between the originally simulated and theoretically estimated upwellings applied by all CMIP5 models was nearly 0.6. The observation and the MME reached 0.81 and 0.7, respectively. These results imply that this linear combination framework can be used to characterize the equatorial upwelling annual cycle pattern.
However, the contributions from the Ekman and wave upwellings are not that well captured in model simulations. The pattern correlations between the original and the wave upwelling (green bars) are mostly higher than that between the original and the Ekman upwelling (blue bars), displaying an opposite relationship to the observation. In nearly half of the models, the correlations between the original and the wave upwellings even overtake the correlations between the original and theoretically reconstructed values, suggesting that the Ekman upwellings almost lose their controls on their own equatorial upwelling annual cycles.

3.4. The Dynamical Bias in CMIP5 Simulations

To investigate the origin of the systematic bias in the equatorial upwelling annual cycles in CMIP5 simulations, we needed to investigate the dynamics of the wave upwelling as estimated by thermocline tendency, which was originated from the thermocline. Figure 6a,b contrasts the annual evolution of the equatorial thermocline depth in terms of observation and CMIP5 MME. Apparently, they are not comparable regardless of amplitude or phase. The observational thermocline pattern was weak in the central equatorial Pacific, taking effects merely near the eastern boundary (Figure 6a). On the other hand, the MME thermocline pattern did not take place near the eastern boundary. Instead, the strongest area of MME thermocline pattern shifts westwards from the eastern boundary near 90° W to the central equatorial Pacific near 140° W, and its amplitude is nearly three times the strength of the observational thermocline depth pattern (Figure 6b). Demonstrated from the differences in thermocline annual evolution between the MME and observation, the CMIP5 MME tends to have an overestimation of thermocline depth strength in the central equatorial Pacific (Figure 6c). The MME bias in the annual evolution of thermocline depth was also directly transferred into the wave upwelling, which was estimated as thermocline depth tendency (Figure 6d).
As discussed before in Figure 4, the westward-shifting, strengthened wave upwelling occupies the central equatorial Pacific (160° W–100° W), overlapping the impact area of the Ekman upwelling. Hence, the Ekman upwelling with an annual signal and the wave upwelling with a semi-annual signal contend with each other and biased the total upwelling annual cycle. We may further discover that although the MME Ekman upwelling exhibits relatively weak variance, it perfectly mimics the annual evolution pattern of the observed Ekman upwelling (Figure 1c and Figure 4c). The correlation between them reached 0.76. On the other hand, the pattern correlation between the observed and MME original vertical velocity was low (0.43), which was also largely associated with the diverse upwelling annual cycle patterns in CMIP5 individual simulations (Figure 3). It explains that biased wave upwelling contributes substantially to the entire Pacific equatorial upwelling annual cycle. The strengthened westward-shift wave upwelling, originating from the biased equatorial thermocline annual evolutions, overtakes the impact of the Ekman upwelling and consequently serves as a main contributor to the entire Pacific equatorial upwelling annual cycle in CMIP5 simulations.

4. Conclusions

The Pacific equatorial upwelling is a substantial dynamic characteristic of tropical climatic systems and marine ecosystems. Its annual cycle, especially in the central to eastern equatorial region, plays a crucial role in the development of Pacific cold tongue. Understanding the detailed dynamics of the Pacific equatorial upwelling annual cycle is therefore an important target in scientific research. In this work, we further confirmed the validity of the linear framework developed previously for the equatorial upwelling [10] in the case of the Pacific.
The theoretical upwelling annual cycles estimated through this framework generally agree with the original upwelling annual cycles in both observational and modeled simulations. This simple formulation was proved to successfully work not only in the Atlantic, but also in the Pacific. In observation, the Ekman upwelling serves as a dominant contributor to the equatorial Pacific upwelling annual cycle, while the wave process contributes very little. This remarkably matches what previous studies have suggested. The CMIP5 simulations, however, pictured a fairly different story: The contribution of wave upwelling overtakes the role of the Ekman upwelling, dominating the equatorial Pacific upwelling annual cycle.
Unlike the observational wave upwelling confined only near the eastern boundary, the CMIP5 simulated wave upwelling was strengthened and shifted westward to the central Pacific. From intermodal statistics, Li et al. [24] argued that the aforementioned too strong upwelling could be attributed to a too shallow thermocline along the equatorial Pacific found in CMIP5 models [24]. We further demonstrated that such a significant bias may be attributable to the bias in the central to eastern equatorial thermocline depth patterns. This biased remote wave upwelling weakens the impacts of the local wind-driven Ekman upwelling, and contributed substantially to the entire Pacific equatorial upwelling annual cycle. Thus, a realistic simulation of the equatorial Pacific upwelling annual cycle is very sensitive to a careful simulation of the equatorial thermocline depth annual patterns.

Supplementary Materials

The following are available online at https://www.mdpi.com/2071-1050/11/18/5038/s1, Figure S1. The weighting function R(x) used to estimate the equatorial Pacific upwelling annual cycle.

Author Contributions

L.-C.W. designed the study, analyzed the data and wrote the paper. J.-Y.Y. reviewed the paper and provided suggestions.

Funding

This study was supported by the Ministry of Science and Technology (MOST), Taiwan, under grants 108-2111-M-008-001-MY3. J.-Y. Yu was supported by MOST105-2111-M-008-025-MY3.

Acknowledgments

The authors would like to thank the editor and the anonymous reviewers for their careful review of the manuscript and detailed suggestions to improve the manuscript. The authors are grateful to F.-F. Jin and C.-R. Wu for useful communications on this topic. The data used in this study is listed in Section 2 at http://apdrc.soest.hawaii.edu/data/data.php.

Conflicts of Interest

The authors declare no conflict of interest.

References

  1. Xie, S.-P. Ocean–atmosphere interaction in the making of the Walker circulation and equatorial Pacific cold tongue. J. Clim. 1998, 11, 189–201. [Google Scholar] [CrossRef]
  2. Li, G.; Xie, S.-P. Tropical Biases in CMIP5 Multimodel Ensemble: The Excessive Equatorial Pacific Cold Tongue and Double ITCZ Problems. J. Clim. 2014, 27, 1765–1780. [Google Scholar] [CrossRef]
  3. Clement, A.C.; Seager, R.; Cane, M.; Zebiak, S.E. An ocean dynamical thermostat. Oceanogr. Lit. Rev. 1997, 6, 556. [Google Scholar] [CrossRef]
  4. An, S.-I.; Kim, J.-W.; Im, S.-H.; Kim, B.-M.; Park, J.H. Recent and future sea surface temperature trends in tropical Pacific warm pool and cold tongue regions. Clim. Dyn. 2012, 39, 1373–1383. [Google Scholar] [CrossRef]
  5. Dandonneau, Y.; Deschamps, P.-Y.; Nicolas, J.-M.; Loisel, H.; Blanchot, J.; Montel, Y.; Thieuleux, F.; Bécu, G. Seasonal and interannual variability of ocean color and composition of phytoplankton communities in the North Atlantic, equatorial Pacific and South Pacific. Deep. Sea Res. Part II Top. Stud. Oceanogr. 2004, 51, 303–318. [Google Scholar] [CrossRef] [Green Version]
  6. Weingartner, T.J.; Weisberg, R.H. On the Annual Cycle of Equatorial Upwelling in the Central Atlantic Ocean. J. Phys. Oceanogr. 1991, 21, 68–82. [Google Scholar] [CrossRef] [Green Version]
  7. Richter, I.; Xie, S.-P. On the origin of equatorial Atlantic biases in coupled general circulation models. Clim. Dyn. 2008, 31, 587–598. [Google Scholar] [CrossRef]
  8. Hagos, S.M.; Cook, K.H. Development of a Coupled Regional Model and Its Application to the Study of Interactions between the West African Monsoon and the Eastern Tropical Atlantic Ocean. J. Clim. 2009, 22, 2591–2604. [Google Scholar] [CrossRef]
  9. Caniaux, G.; Giordani, H.; Redelsperger, J.-L.; Guichard, F.; Key, E.; Wade, M. Coupling between the Atlantic cold tongue and the West African monsoon in boreal spring and summer. J. Geophys. Res. Space Phys. 2011, 116. [Google Scholar] [CrossRef]
  10. Wang, L.-C.; Jin, F.-F.; Wu, C.-R.; Hsu, H.-H. Dynamics of Upwelling Annual Cycle in the Equatorial Atlantic Ocean. Geophys. Res. Lett. 2017, 44, 3737–3743. [Google Scholar] [CrossRef]
  11. Zebiak, S.E.; Cane, M.A. A model El Niño–Southern Oscillation. Mon. Weather Rev. 1987, 115, 2262–2278. [Google Scholar] [CrossRef]
  12. Wang, L.-C.; Jin, F.-F.; Wu, C.-R. Dynamics of simulated Atlantic upwelling annual cycle in CMIP5 models. J. Geophys. Res. Ocean. 2017, 122, 3737–3743. [Google Scholar] [CrossRef]
  13. Balmaseda, M.A.; Vidard, A.; Anderson, D.L.T. The ECMWF Ocean Analysis System: ORA-S3. Mon. Weather Rev. 2008, 136, 3018–3034. [Google Scholar] [CrossRef]
  14. Zhai, F.; Hu, D. Revisit the interannual variability of the North Equatorial Current transport with ECMWF ORA-S3. J. Geophys. Res. Ocean. 2013, 118, 1349–1366. [Google Scholar] [CrossRef]
  15. Jin, F.-F.; Boucharel, J.; Lin, I.-I. Eastern Pacific tropical cyclones intensified by El Niño delivery of subsurface ocean heat. Nature 2014, 516, 82–85. [Google Scholar] [CrossRef] [PubMed]
  16. Munoz, E.; Kirtman, B.; Weijer, W. Varied representation of the Atlantic Meridional Overturning across multidecadal ocean reanalyses. Deep. Sea Res. Part II Top. Stud. Oceanogr. 2011, 58, 1848–1857. [Google Scholar] [CrossRef]
  17. Nnamchi, H.C.; Li, J.; Kucharski, F.; Kang, I.-S.; Keenlyside, N.S.; Chang, P.; Farneti, R. Thermodynamic controls of the Atlantic Niño. Nat. Commun. 2015, 6, 8895. [Google Scholar] [CrossRef]
  18. Nnamchi, H.C.; Li, J.; Kucharski, F.; Kang, I.-S.; Keenlyside, N.S.; Chang, P.; Farneti, R. An Equatorial–Extratropical Dipole Structure of the Atlantic Niño. J. Clim. 2016, 29, 7295–7311. [Google Scholar] [CrossRef]
  19. Taylor, K.E.; Stouffer, R.J.; Meehl, G.A. An Overview of CMIP5 and the Experiment Design. Bull. Am. Meteorol. Soc. 2012, 93, 485–498. [Google Scholar] [CrossRef] [Green Version]
  20. Wyrtki, K. An Estimate of Equatorial Upwelling in the Pacific. J. Phys. Oceanogr. 1981, 11, 1205–1214. [Google Scholar] [CrossRef] [Green Version]
  21. McGregor, S.; Holbrook, N.J.; Power, S.B. Interdecadal Sea Surface Temperature Variability in the Equatorial Pacific Ocean. Part I: The Role of Off-Equatorial Wind Stresses and Oceanic Rossby Waves. J. Clim. 2007, 20, 2643–2658. [Google Scholar] [CrossRef]
  22. Bunge, L.; Clarke, A.J. Seasonal Propagation of Sea Level along the Equator in the Atlantic. J. Phys. Oceanogr. 2009, 39, 1069–1074. [Google Scholar] [CrossRef]
  23. Ding, H.; Keenlyside, N.S.; Latif, M. Seasonal cycle in the upper equatorial Atlantic Ocean. J. Geophys. Res. Ocean. 2009, 114. [Google Scholar] [CrossRef] [Green Version]
  24. Li, G.; Du, Y.; Xu, H.; Ren, B. An Intermodel Approach to Identify the Source of Excessive Equatorial Pacific Cold Tongue in CMIP5 Models and Uncertainty in Observational Datasets. J. Clim. 2015, 28, 7630–7640. [Google Scholar] [CrossRef]
Figure 1. The annual cycles of the (a) observed, (b) theoretical, (c) Ekman and (d) wave upwelling in the equatorial Pacific (averaged in 3° N–3° S) (units: m/day).
Sustainability 11 05038 g001
Figure 2. The equatorial Pacific annual cycles (averaged in 3° N–3° S) of the thermocline changes (shadings, units: m) and the observed wave upwelling estimated by thermocline tendencies (contours, units: m/day) in (a) observation and (b) shallow-water model (SWM) simulations.
Sustainability 11 05038 g002
Figure 3. The upwelling annual cycles of the equatorial Pacific (averaged over 3° N–3° S) originally simulated by 25 CMIP5 models.
Sustainability 11 05038 g003
Figure 4. Same as Figure 1, but for the CMIP5 multi-model ensemble (MME).
Sustainability 11 05038 g004
Figure 5. A bar chart showing pattern correlations between the original and theoretical values of the equatorial upwelling annual cycles from 25 CMIP5 models and the observation. The blue, green, and yellow bars represent the correlations between the original and the Ekman, wave, and theoretical upwellings, respectively.
Sustainability 11 05038 g005
Figure 6. The equatorial Pacific annual anomalies with respect to the climate annual mean (averaged in 3° N–3° S) of the thermocline depth (units: m) in (a) observation and (b) CMIP5 MME and the departures of the CMIP5 MME from the observation in annual anomalies of (c) thermocline depth and (d) wave upwelling (units: m/day), respectively.
Sustainability 11 05038 g006
Table 1. List of the Coupled Model Intercomparison Phase 5 (CMIP5) models analyzed in the study.
Model NameModeling Center
ACCESS1-0The Centre for Australian Weather and Climate Research, Australia
ACCESS1-3The Centre for Australian Weather and Climate Research, Australia
bcc-csm1-1Beijing Climate Center, China Meteorological Administration, China
bcc-csm1-1-mBeijing Climate Center, China Meteorological Administration, China
CanESM2Canadian Centre for Climate Modelling and Analysis, Canada
CCSM4National Center for Atmospheric Research, US
CESM1-BGCNational Center for Atmospheric Research, US
CESM1-CAM5National Center for Atmospheric Research, US
CESM1-FASTCHEMNational Center for Atmospheric Research, US
CESM1-WACCMNational Center for Atmospheric Research, US
CMCC-CESMCentro Euro-Mediterraneo per I Cambiamenti Climatici, Italy
CMCC-CMCentro Euro-Mediterraneo per I Cambiamenti Climatici, Italy
CMCC-CMSCentro Euro-Mediterraneo per I Cambiamenti Climatici, Italy
FGOALS-g2LASG, Institute of Atmospheric Physics, Chinese Academy of Sciences, China
GFDL-ESM2MNOAA Geophysical Fluid Dynamics Laboratory, US
GISS-E2-RNASA Goddard Institute for Space Studies, US
GISS-E2-R-CCNASA Goddard Institute for Space Studies, US
HadGEM2-CCMet Office Hadley Centre, UK
HadGEM2-ESMet Office Hadley Centre, UK
IPSL-CM5A-LRInstitut Pierre-Simon Laplace, France
IPSL-CM5A-MRInstitut Pierre-Simon Laplace, France
IPSL-CM5B-LRInstitut Pierre-Simon Laplace, France
MRI-CGCM3Meteorological Research Institute, Japan
NorESM1-MNorwegian Climate Centre, Norway
NorESM1-MENorwegian Climate Centre, Norway

