Article

Boundary Conditions of the Curvilinear Relationships between Environmental Corporate Social Responsibility and New Product Performance: Evidence from China

1
School of Humanities and Economic Law, Northwestern Polytechnical University, Xi’an 710072, China
2
China Merchants Bank, Shenzhen 518040, China
3
School of Economics and Finance, Xi’an Jiaotong University, Xi’an 710061, China
4
School of Management, Xi’an Jiaotong University, Xi’an 710049, China
5
Department of Business Administration, National Chengchi University, Taipei 116, Taiwan
*
Author to whom correspondence should be addressed.
Sustainability 2019, 11(18), 4968; https://doi.org/10.3390/su11184968
Submission received: 26 August 2019 / Revised: 5 September 2019 / Accepted: 6 September 2019 / Published: 11 September 2019
(This article belongs to the Section Economic and Business Aspects of Sustainability)

Abstract

:
This study examines whether a firm’s environmental corporate social responsibility advances the growth of its new product performance, and investigates the moderating roles of a firm’s heterogeneous local institutional environment and ownership type. Based on a multi-informant survey dataset of 303 Chinese firms, we found that a firm’s environmental corporate social responsibility has a U-shaped relationship with the firm’s new product performance. In addition, compared with non-state-owned enterprises, state-owned enterprises with a higher environmental corporate social responsibility would receive relatively lower new product performance. Firms located in the provinces with a lower local institutional development level and higher environmental corporate social responsibility may experience relatively higher new product performance than firms located in the provinces with a higher local institutional development level.

1. Introduction

As an important and distinct part of corporate social responsibility (CSR), environmental corporate social responsibility (ECSR) has been deemed the foremost topic among entrepreneurs and researchers [1,2,3]. Firms in developing countries are faced with a considerable challenge in implementing ECSR to deal with increasing stakeholder awareness and the needs of environmental protection [4]. In order to expand market influence and enhance new product performance, ECSR, regarding taking care of the environment, speaks to a company’s needs to gain the recognition and support of key stakeholders, the general public, and key government officials. As new product performance is an important indicator that reflects the firms’ competitiveness in the fierce market, understanding the relationship between ECSR and new product performance is critical for academic research and corporate practice in order to resolve the problem of social and financial performance. However, it is noteworthy that the extant empirical studies have one-sidedly suggested a positive or negative linear effect of ECSR on firm’s new product performance [1,4,5,6].
In particular, firms may face a tradeoff when they work for increasing their new product performance. They may have strong incentives to both gain legitimacy through ECSR to cultivate a new consumer group in pursuing a long-term growth; meanwhile, they also want to enhance short-term economic profit to support their following new product development and promotion. The two goals may conflict insofar as ECSR diverts firms’ resources from productive market activities and hinders firms’ short-term revenue from new product. This study seeks to explore such complex cost-benefit tradeoff, for instance the evaluation parameters and their aggregation mechanism.
The empirical studies investigating the actual effect of ECSR have yet to reach a consensus, ranging from a positive to a negative linear effect [1,4,6,7,8]. Most prior literature has drawn upon a single perspective one-sidedly to interpret the factors that may give rise to the benefits and the costs of ECSR [9]. Further, most studies have focused primarily on the relationship between ECSR and firm performance, left the mechanism embedded in the relationship underexamined [3]. For example, Shu proposed that researchers pay less attention to the relationship between ECSR and product innovation. He examines the relationship between ECSR and two different kinds of product innovation and points out a positive relationship between ECSR and radical/incremental product innovation [6]. Some scholars posit that ECSR induces unnecessary costs and inefficiency [4], which may have an adverse effect on innovation. Moreover, signaling theory suggests that the strength of a signal may change for different institutional environments [9], such that signal receivers with different awareness of ECSR may give different feedback due to their regional institutional development level, which is the central theme of the institutional research. Neglecting the important role of “institutional contingency factors” can be the cause of these mixed results. By this token, the effect of ECSR on firm’s new product performance is not simply a positive or a negative linear effect, which calls for a more specific and in-depth investigation.
Drawing from the signaling theory and the institutional theory, this study improves on the prior literature by predicting ECSR to have a U-shaped effect on firm’s new product performance. To address further investigation, our study asks two questions. First, to what extent do firms with different levels of ECSR practice facilitate their new product performance? Second, whether the impact of ECSR on new product performance varies depending on the level of institutional development and firm’s ownership type? This study would thus contribute in two ways. First, among the factors that could be categorized as the behavioral sets (e.g., organizational commitment, public expectation) [10] and the infrastructural sets (e.g., organizational capabilities, local business infrastructures), previous research has often isolated these two sets of influences to predict the actual effects of ECSR [11,12,13]. Our research complements this inadequacy by advocating that ECSR brings both benefits and costs for firms, and the effects of ECSR should be analyzed from inside to outside comprehensively, which can be described as a double-edged sword effect. Second, scholars in environmental management have stressed the importance of the subnational parameters [14]. They suggested researchers should take characteristics of multiple levels into consideration. Our research echoes this call by considering the roles that firms’ heterogeneous locational institutional environments and ownership type play in influencing the signal receivers’ perception about the relationship between ECSR and firms’ new product performance.
The rest of the paper is organized as follows. Hypotheses are developed in the first section, which presents the theoretical background of firms’ ECSR, the concepts of institutional development level and ownership types as institutional factors. The second section presents the research method, followed by the third section which tests the hypotheses and discusses the results. The last section comes with conclusions, research implications, managerial implications, limitations, and directions for future research.

2. Theory and Hypotheses Development

2.1. Environmental Corporate Social Responsibility: A Double-Edged Sword

ECSR refers to a firm’s practice to take various environmental protection activities such as employing new technologies to eliminate waste and emissions [2], reduce pollution and internalize negative externalities [15], maximize the efficiency and productivity of its resources [16], adopting renewable energies and new recycling program [17], and creating eco-friendly organizational processes or products/service [18].
According to the signaling theory, given the information asymmetries between two parties, signalers obtain information about product that is not available to others, and this information may cover from the period ranging from the early stage (i.e., research and development) to the later stage (i.e., promotion). In this situation, one view holds that the signals send by firms with ECSR always exert positive effect. ECSR can signal firms unobservable behaviors and attitudes to the key stakeholders (e.g., attitudes towards social and environmental issues, their environmental protection intent and actions) [19], in capital markets [20], other business actors, customers, employees, and regulatory actors. Thus, as firms’ endeavors in shaping the impressions of key stakeholders may affect the decision-making processes of the purchasers in the launching process of a new product, the demand for products or services will increase, reducing consumer price sensitivity [21], thereby earning the firms more profits. Furthermore, ECSR may function similarly to advertising that the firm has superior capabilities for filling institutional voids, enhancing the capabilities to reshape market rules [9,13], and bringing to firms a long-term competitive advantage [22,23,24].
Others indicate that ECSR might induce explicit monetary costs and implicit management costs. The traditional view treats environmental protection as an additional cost imposed on firms [25], such that a firm can either control pollution or maximize profits to be a “good” company or a profitable company, but the former can only be accomplished at the cost of the latter. Specifically, ECSR may drag firms from their innovation by inducing risks and costs, for instance the purchasing of environment friendly materials, pollution control equipment, and recycling system that may increase firms fixed costs but have uncertain return in a considerable period of time [26], which may only bring firms with significant managerial benefits rather than financial benefits [27]. Margolis et al. [5] echo that “firms’ attempts to mitigate their ill effects on society or to fund projects that might directly benefit society are subjected to their rigorous financial analysis”.
Our research joins this line of inquiry by suggesting that most prior literature has drawn upon a single perspective to interpret the factors that may give rise to the benefits and the costs of ECSR and consequently adopted an isolated view to explain the complex effect of ECSR, resulting in ambiguous conclusions eventually. In fact, ECSR could bring firms infrastructural (e.g., cost reduction and process efficiency) and behavioral benefits (e.g., legitimacy, reputation, brand loyalty) from both inside and outside of firms’ boundaries simultaneously [4].
On the benefit side, externally, ECSR represents firms’ intentions and actions against socially irresponsible actions that legitimized by external stakeholders, it increases goodwill [28,29,30], trust [31], reputation [11,12,32], satisfaction and patronage [33,34] that firms may felt, which are the benefits we clarified into the behavioral set. In the infrastructural aspect, firms act as green suppliers would receive more government procurement [17], by which “demonstration” benefit could be derived because it would give valuable information about the potential benefits of the focal firm’s newer untried green technologies and products to other business actors. Thus, ECSR facilitates firms’ commercialization and diffusion of their new product and services [10].
Internally, ECSR increases firms’ organizational commitment and employees’ loyalty [35], which are the benefits we clarified into the behavioral set. with respect to the infrastructural aspect, ECSR has the potential to help firms achieve operational efficiency [13,22], waste reductions, process enhancements, legal and cleanup costs reduction [1], and risk reduction [36]. Table 1 shows the benefits of environmental corporate social responsibility.
On the costs side, internally, ECSR generates fixed costs when firms spend additional resources to purchase pollution control equipment, and variable costs when firms use recyclable materials [26]. Behaviorally, ECSR may lead to internal resistance when firms are integrating environmental management philosophy with original structure and new product development [41]. Externally, ECSR may violate the contractual relationship with shareholders and increase market risks. Table 2 shows the costs generated by environmental corporate social responsibility.

2.2. ECSR and New Product Performance

Firms are faced with options when they pursue innovative new products in order to accelerate growth and enhance new product performance. For firms with different levels in adopting ECSR, they act differently in choosing whether promote their new product in existing market or develop radical green product for new markets. The confluence, or in other words the tradeoff of the benefits and costs of a firm’s ECSR would constitute the effect it has on firms’ new product performance.
At a shallow level of ECSR adoption, firms show their awareness of environmental protection through taking part in environmental protection activities. This enables firms to reduce legal costs (green taxes, pollution discharge penalty) and cleanup costs [42]. Also, though they have not replaced their old equipment and materials, they can receive supports from the government (e.g., tax relief and financial support) to purchase new equipment and get started. In addition, the consciousness, efforts, and attitudes that a firm’s ECSR signals increase firms’ social recognition and reputation, and thus enhance their brand image among customers, and lead to (1) the higher marketing potential of firms’ new products, and (2) more direct access to capital markets, such as easier credit from banks in some provinces because of their preferential policies [6]. In this way, ECSR will bring economic and social benefits to research and development (R&D), production, and commercialization of their new product at the initial stage.
However, these advantages will be gradually offset in firms of low-to-moderate levels of ECSR, the contribution of their ECSR on new product performance would likely be lower than those at both ends of the spectrum. After the exciting stage of introducing ECSR into firms and the economic advantages granted by government, firms’ functional units, including management, R&D, operations, and marketing, must be involved and committed to the green vision [43], and thus require considerable managerial attention, resource investment, and process and/or product adjustment. Moreover, ECSR may compete for scarce resources with firms’ current new product development projects.
First, the procurement and maintenance of pollution control equipment will induce high fixed costs, and the adoption of recyclable or environment friendly materials will increase variable costs. Meanwhile, adopting ECSR requires increased skills from workers across all departments, which will increase the training costs. Although the trial-and-error process generates considerable economic and time costs throughout the whole process, firms under the moderate level suffer more. The existing product development and producing efficiency will be affected by the eco-friendly product development, they share resources and generate costs simultaneously. Second, ECSR may violate the contractual relationship with shareholders in the short run. Any substantial change in firms’ strategies will reflect in the abnormal return or lost in the capital market immediately [24]. In addition, although firms’ green publicity may attract external preferences for products, it also generates the risk of not meeting the public’s expectations [44,45].
The relationship between firm’s ECSR and new product performance is expected to reach a tipping point at which the advantage of an in-depth integrated ECSR dominates. At moderate-to-high levels of ECSR, firms have taken ECSR practice as their mission gradually, and shedding continuous efforts in promoting new technology for cutting pollutant emissions and using raw materials economically to create eco-friendly products. Meanwhile, the costs incurred by firms’ ECSR would be offset by firms’ “stakeholder influence capacity”, a capacity that is path-dependent and costly to imitate [9,46]. Thus, ECSR would be more effectively in improving firms’ new product development in the following ways. First, ECSR improve new product differentiation by introducing distinctive green characteristics into the products, and provide unique value to customers [47], firms can charge higher prices for eco-branded or eco-labeled products. Second, the extended development of high-performing and eco-friendly products often contain patents, which make firms occupy a leading position in significant markets. Meanwhile, ECSR also has the innovation-stimulating function that offers firms opportunities to outperform their rivals by exploring new niche markets. Third, a strong environmental stance also improves a firm’s image and identity that attracts high caliber candidates [43], which enhances their productivity during the new product development since it lowers the possibility of illnesses, absenteeism, recruitment, and turnover [6]. Just as some scholars postulated, firms’ proactively adopting of ECSR, as the political and business acumen that combines the elements of organizational commitment, learning, cross-functional integration, employee participation, and skills improvement would be a prime resource for firms to compete with rivals in the future [43]. Thus, we expect that firms that are either adopting ECSR at a shallow level or integrated ECSR into their entire structure will have greater returns from their new product performance than firms “stuck in the middle”.
Hypothesis 1.
A firm’s ECSR has a U-shaped relationship with its new product performance.

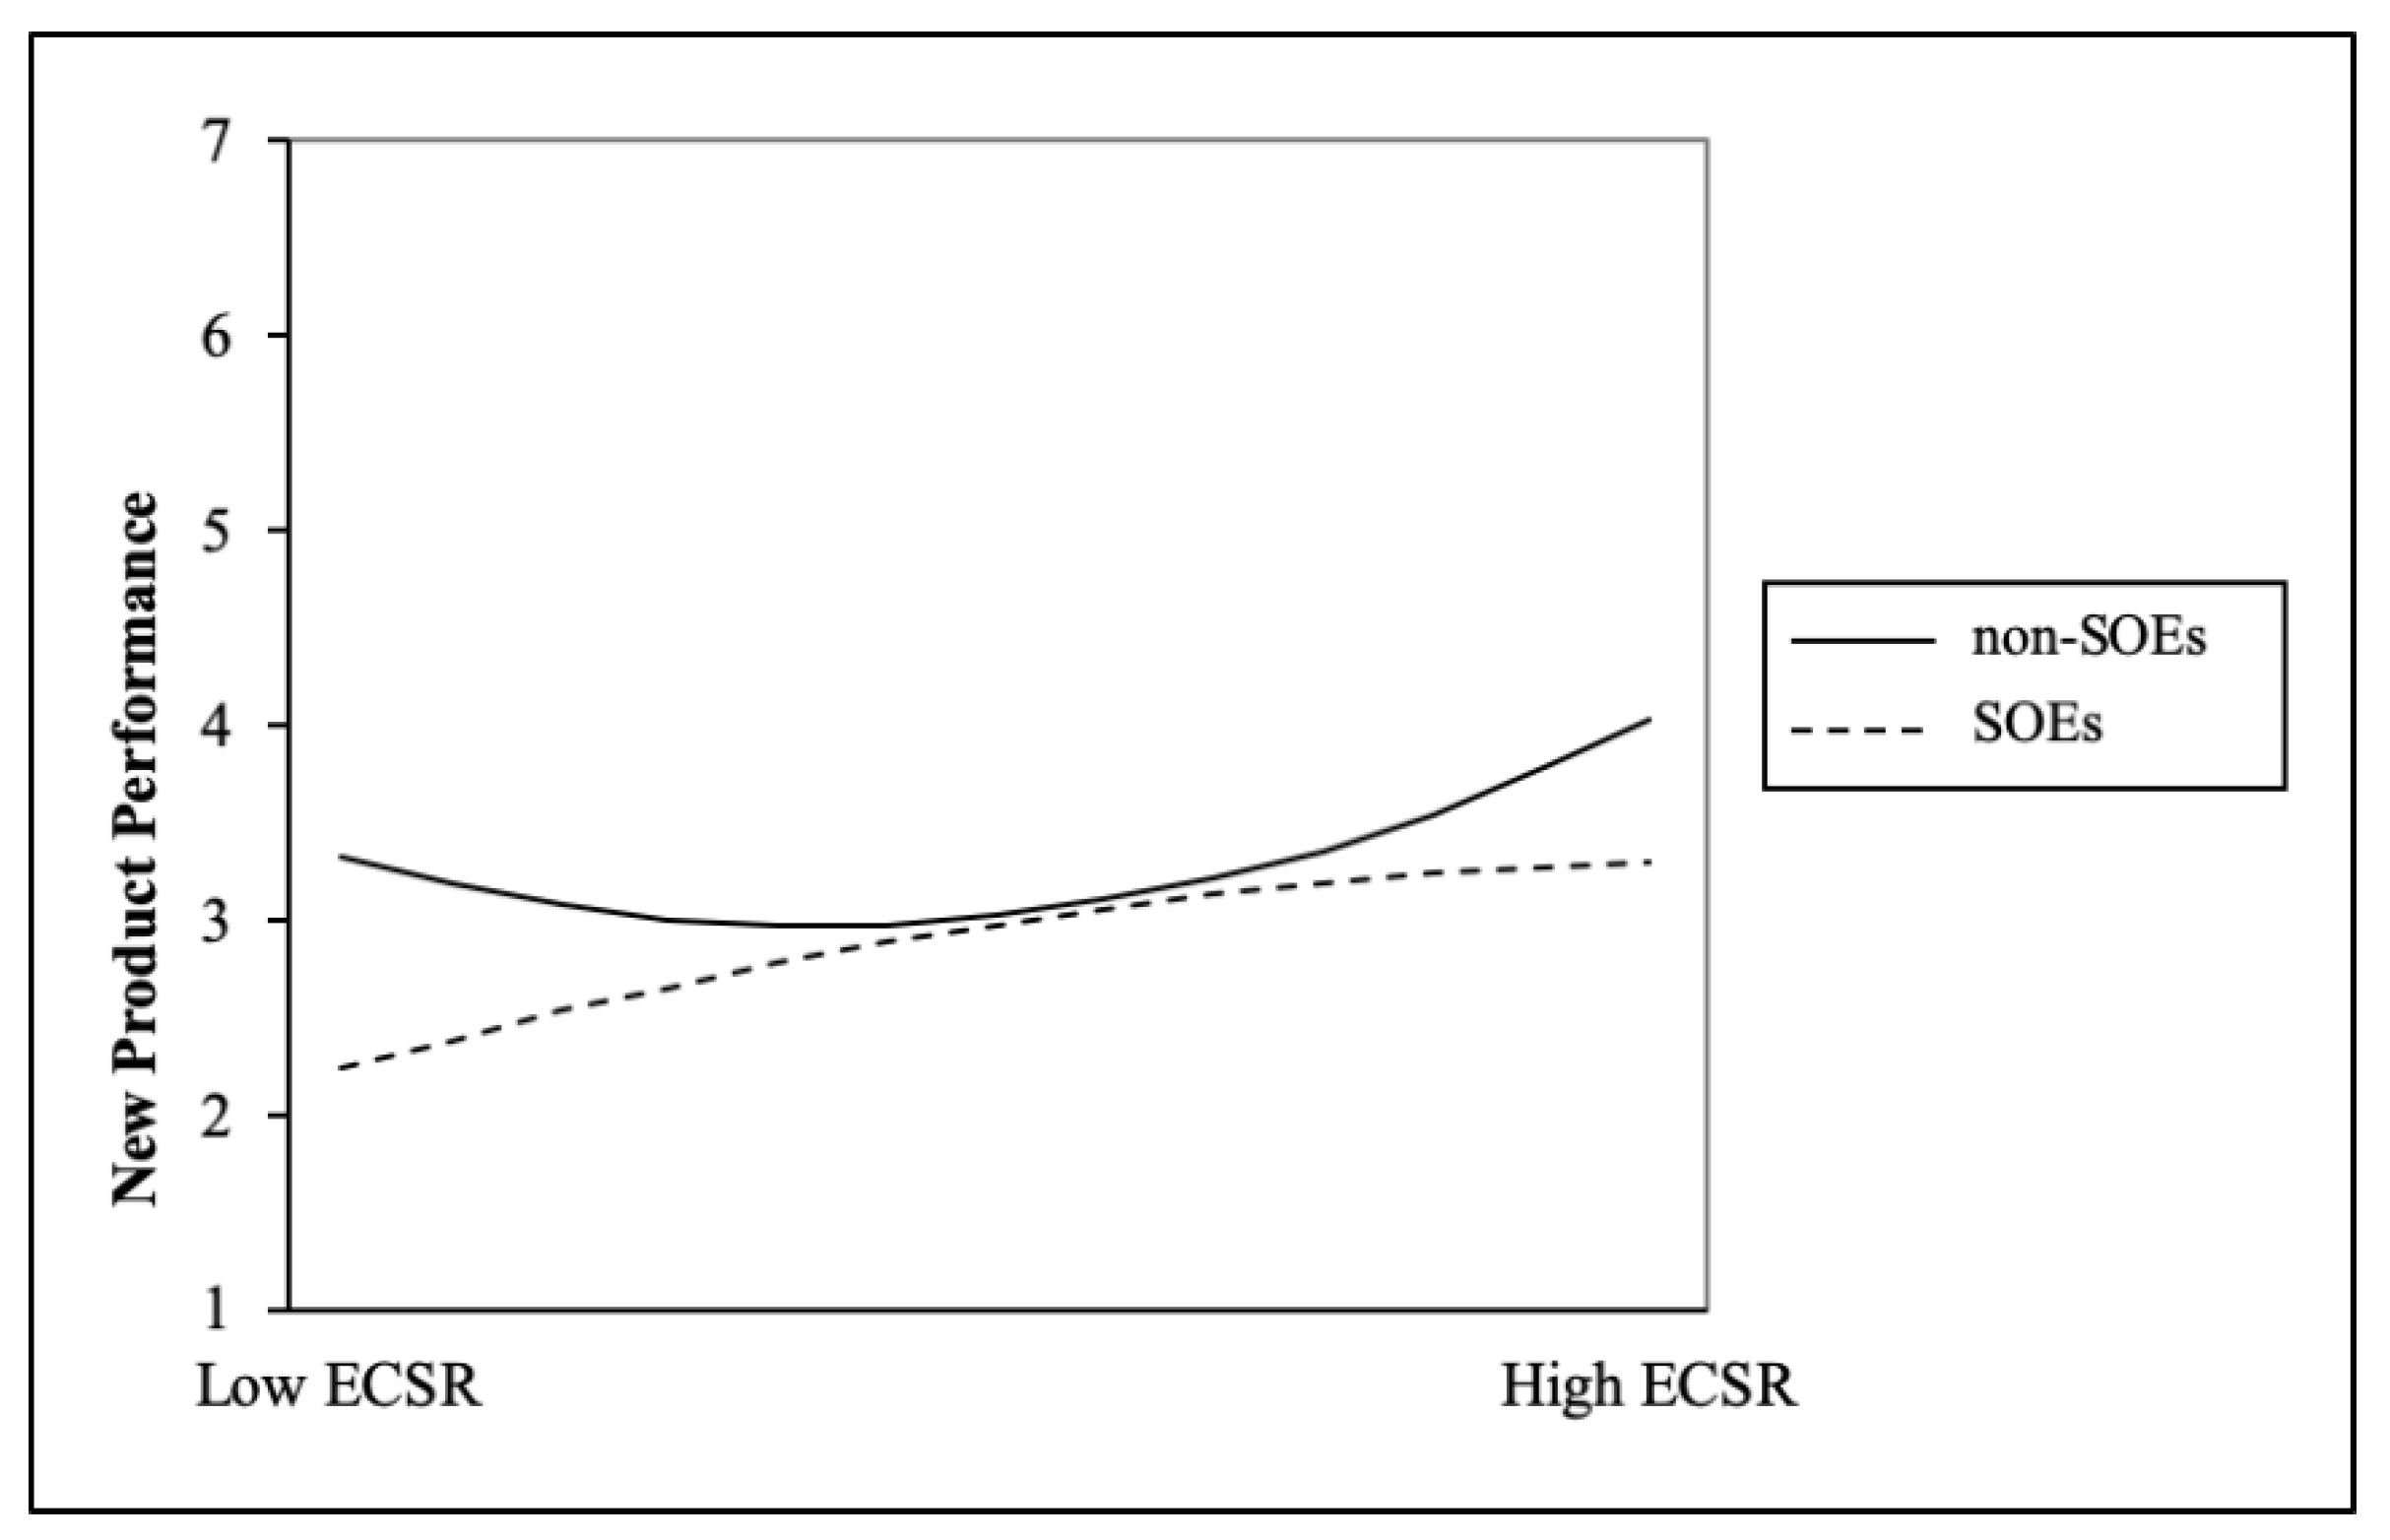
2.3. Influential Effects of Institutional Development Level and Ownership Types

In emerging economies, different regions vary significantly in terms of their market-supporting institutions [48,49]. For example, regional disparities in China originated from the institutional and economic reforms, in that the central government allows each province to develop the local institutions according to their own regional traits and provinces vary significantly in their development of market-supporting institutions [49,50]. In particular, there are significant amounts of revenue flow from local industries to local government because of the fiscal decentralization, which lead to the varying capabilities of the local government for developing economic and political infrastructure across different regions [51], which results in the varying environment issue regulations. According to the environmental protection law of China, if an enterprise or institution has caused severe environmental pollution, it must eliminate the pollution within a certain period of time under the supervision of a local environmental protection administrative department.
The biggest challenge of environmental protection in China is how to “regulate the behaviors and relationships of various stakeholders—different levels of governments, the industrial sectors, and the public” [14]. The enforcement of environmental protection laws and the awareness of environment issues among the public show significant differences across different regions. In developed regions, environmental protection laws and regulations are well established and enforced [14]. People in these regions have a relatively higher level of awareness of environmental protection. According to the institutional theory, firms’ reactions to external institutional pressures may range from active conformity to passive resistance, depending on the specific circumstance and nature of the pressures [52]. Thus, the formulation and implementation of firms’ green management strategies may vary considerably across different regions, as the local institutions determine the extent to which a firm is capable of- and willing to perform their ECSR, and can get appropriate value from new eco-friendly products due to the following reasons.
First, the extent to which a firm’s new product performance can draw benefits from their ECSR depends on three basic pre-requisites: (1) consumers must be willing to pay for the costs of ecological differentiation [53]; (2) reliable information about product’s environmental performance must be available to the consumer [4]; and (3) the differentiation should be difficult to be imitated by competitors. Accordingly, customers in developed regions have more awareness about the seriousness of environmental protection, have more convenient access and a greater ability for the detection of a certain firms’ ECSR activities [9]. Thus, differentiation benefits of adopting ECSR proactively would contain greater legitimacy and improved corporate reputation, and thus preferential treatment from consumers and stakeholders [54]. Second, in developed regions, the local factor market is well developed to provide environment friendly raw materials, and the labor market is competent with providing well-educated labor forces. Well-formulated market information diffusion system also decreases firms’ publicity expenses (the cost on informing the public of the significance of firms’ ECSR) [14].
However, for people in developed regions, firm’s efforts in ECSR are likely to be underestimated since environmental protection activity is common in developed regions. As firm’s ECSR may be perceived as a taken-for-granted duty, the respected benefits that a certain firm can receive from its efforts in ECSR would decrease accordingly. Therefore:
Hypothesis 2.
The U-shaped relationship between firm’s ECSR and new product performance is weaker (flatter) when the firm operates in the region with high institutional development level as opposed to low.
Firms with different ownership type are inherit with varying resource endowments that affect their environmental strategic choices [43], and may exert different influences upon individuals’ cognitions and behaviors [55] about the ECSR. In China, state-owned enterprises (SOEs) and non-state-owned enterprises (non-SOEs) are two typical types of firm that possess distinct organizational values, norms, routines, structures, and accumulated capabilities, resulting in their different capacities to derive benefits from their ECSR [42].
SOEs and non-SOEs face different pressures to implement ECSR. Founded by the central and local governments, SOEs receive benefits from the state that the non-SOEs can hardly obtains, yet they also carry tremendous expectation to promote the environment protection [56]. The State-owned Assets Supervision and Administration Commission of the State Council (hereafter SASAC) of China issued CSR guidelines for SOEs in January 2008, it requests the SOEs to report their annual ECSR circumstance [10]. Therefore, SOEs have more ECSR experiences than the non-SOEs, which makes it easier and less costly for SOEs to adopt ECSR practices than non-SOEs, and thus have relatively flatter learning curve. However, the extensive adoption of ECSR practices by SOEs is a double-edged sword that contains the abovementioned benefits (i.e., cost reduction) and the following negative sides simultaneously.
Given the inherent public expectation shed upon the SOEs, their enhancement of ECSR would be viewed as the mission they should accomplish rather than the contribution they make to the society. Meanwhile, the managers of SOEs may tend to fulfill political expectation regardless of the risks and costs in environmental conservation technology research and development. Thus, the marginal return from SOEs’ increasing of their ECSR would be lower comparing with the one from the non-SOEs. More importantly, the internal benefits that SOEs could receive from their enhancement of ECSR may also be lower than the one in the non-SOEs. In particular, since the typical features of most SOEs are hierarchical, inflexible, and bureaucratic, they suffered from the strategic inertia and centralism, which constrain their abilities to modify patterns of collective actions, for instance integrating ECSR with their current structure and product development processes. In the non-SOEs with a flat and flexible structure that facilitates internal modification, and low level of path-dependencies that facilitate changes, the opposite is true. Thus:
Hypothesis 3.
The U-shaped relationship between firm’s ECSR and new product performance is weaker (flatter) for state-owned enterprises as opposed to non-state-owned enterprises.

3. Research Methodology

3.1. Data and Sample

We use surveys of Chinese firms to test the hypotheses. This study investigates the impact of firm’s ECSR on the new product performance. ECSR involves the core confidentiality of how to obtain tacit resources and capabilities, and it is difficult to obtain detailed information directly through other means. Therefore, following the recommendation of Hoskisson et al., (2000), this study uses a questionnaire survey method to make respondents answer all the questions systematically, so as to obtain the data needed by the research efficiently and comprehensively.
We collected data from Chinese firms because China provides an ideal empirical setting to test our hypotheses. The severe ecological and environmental issues as well as the dysfunctional institutional environment bring enormous pressure the Chinese government’s regulatory authorities and enterprises [10,57]. China’s economy has skyrocketed over the past three decades, but it also paid a heavy price. The government has actively promoted economic development but the lack of supervision also incur severe environmental pollution [10]. China has become one of the world’s most polluted countries, where the chemicals come from wastewater and polluted air are caused by coal-fired thermal power stations, industries of iron and steel, cement, and petroleum. Although the government paid great attention to the formulation of the industrial exhaust emission standard, the poor monitoring and controlling systems in the institutional environment have given rise to serious water and air pollution in the region that can’t be ignored.
Following Gerbing and Anderson’s (1998) recommendation, we conducted face-to-face, in-depth interviews with several top managers of to develop the survey questionnaire based on an extensive literature review. In order to maintain the cross-cultural equivalence of the interview questionnaire [58], we used the translation and back-translation method. Then we conducted a pilot test in China with 10 firms’ top managers to refined and finalized our questionnaire. We informed the managers of the academic purpose of the survey and promised them that their responses would only be used in academic studies. We adopted a stratified random sampling procedure to collect the data. First, given the uneven degrees of IDL among China’s 31 provinces [59], we divided them into East, Central And West regions according to their geographic locations and marketization ranking [60]. For each region, we randomly selected 500 firms from the published industry directories to decrease the economic and institutional development bias [61]. The contact information of the firms was provided by local governments agencies of the economic development zones. Second, we make phone calls to the senior managers and invited them to participate in our survey. To increase the response rate and the data validity, we promised to offer a summary of our research results to the top managers to help them make business decisions. Third, we adopted an on-site survey approach using a structured questionnaire to conduct the survey from August 2010 to January 2011.
To mitigate potential common method bias, we used a multiple informant approach to obtain high-quality data [62]. We first interviewed top managers who had played important roles in firms’ strategy formulation and new product innovation. Then, we persuaded them to invite another manager in their firms that are positioned as at least middle-level manager for personal interview.
Ultimately, we collected 980 questionnaires from 490 firms, and each firm has two questionnaires. We eliminated the questionnaires with missing data and eventually obtained 303 paired valid responses, and the overall response rate is 20.2% (303/1500). Among the top-manager respondents, 19.26% were CEOs/chairmen and the rest were from top management teams. The middle managers included engineering (37.95%), market and sales (32.34%), manufacturing (22.11%), and other functional departments (7.60%). To test for non-response bias, we used t-test to compare the participating and non-participating firms in terms of firm age, firm size, and sales growth. The result showed no significant differences between them (p > 0.05).

3.2. Measures

We measured continuous variables in our survey with multi-item scales. All of the variables are randomly selected from the two groups of datasets. In other words, we randomly selected 150 samples in which the independent variable and moderators were from Group A and the dependent variable was from Group B, while the independent variable and moderators were from Group B and the dependent variable was from Group A in the rest 153 sample firms. The t-test comparison between the selected samples and non-selected samples suggested no significant difference, which allowed us to minimize survey method bias. Each item used a Likert-type response of 1 (“strongly disagree”) to 7 (“strongly agree”). The measures of focal constructs are reported in the Appendix A.

3.2.1. Independent Variable

The measure of ECSR was adopted from previous studies [18]. Five-item scales were employed to reflect a firm’s commitment to take various environmental protection activities and create eco-friendly organizational processes or products/service.

3.2.2. Moderator Variables

We used a dummy variable to measure ownership types according to Peng and Luo [63] to reflect the organizational context (coded “1” for SOEs and “0” for non-SOEs). To assess provinces variations, we use the construct, Institutional Development Level (IDL) to reflect the formal institutions in firms’ local contexts [59]. We used the marketization index developed by the Nevin Economic Research Institute [60] to measure the institutional development level of provincial infrastructural institutions in a certain province that firms operate [59,64,65] on the basis of the statistic book of the Marketization Index of China’s Provinces. Since the institutional transitions are uneven across different provinces in China [66], this general index was calculated on the basis of the weighted score of each individual index occurred in one province.

3.2.3. Dependent Variable

Our measure of new product performance was adopted from Kim and Atuahene-Gima [67]. We evaluated whether the performance of firm’s new products was better than their major competitors’ in (1) profit, (2) sales, (3) customer satisfaction, and (4) market shares.

3.2.4. Control Variables

Following the prevalent view in the literature on firm’s environmental corporate social responsibility [4,6], we controlled for a number of factors that might influence a firm’s aspiration and ability to innovate and adopt ECSR [68]. Enterprises with a long history or larger scale are more likely to have sufficient resources and capabilities to implement ECSR, thereby we controlled for firm age (natural logarithm of the firm operating years) and firm size (natural logarithm of the firm’s number of employees). We also controlled for industry type effects and industrial environmental effects that might influence firm’s ECSR (i.e., technology advancing, competitions) because firms in different industries are under varying degrees of pressure from technological innovation, fierce competition and regulation. We also controlled prior market share and prior R&D investment as they would impact firms’ new product performance, and manager as NPC members, which would impact firms’ implement of ECSR was also controlled.

4. Analysis and Results

We present the descriptive statistics (e.g., means and standard deviations), correlations, and square roots of the AVE values for each latent variable in Table 3.

4.1. Construct Validity and Reliability

In Table 3, we present the descriptive statistics, correlations, and square roots of the AVE values for all of the variables used in the study, and that all the AVE values were above 0.50, indicating good convergent validity. We included the independent and the dependent variables (i.e., ECSR and new product performance) that are multi-item variables into the factor analysis, while the moderating (e.g., firm’s ownership, institutional development level) and the control variables that are single-item variables were excluded. In factor analysis, all the indicators were significantly loaded on the variables as they were supposed to be and exceeded the threshold of 0.60 (see the Appendix A). We used CR values to examine their reliability and the results show a minimal value of 0.91, exceeding the recommended threshold of 0.70. The internal consistency indicated by considering the Cronbach’s alphas showed in Appendix A (all exceeded 0.80). These results revealed support for convergent validity and unidimensionality.
To examine discriminant validity, we compared the variance shared between the constructs with the average variance extracted (AVE). The square roots of the AVE we showed in Table 3 in the diagonal and the correlation coefficients between all the variables were below them [69]. As we mentioned in the data collection section, we collected data from two informants from one firm, and our independent and dependent variables came from different dataset. The potential common method bias is reduced. We further tested CMV using two additional techniques. First, we added one latent CMV variable into our hypothesized measurement model. The results indicated that the variance extracted by the CMV variable was 0.02, well below the 0.50 cutoff value. Prior studies suggest that the CMV is not a serious concern if the variance extracted by CMV variable is lower than 0.50 [64,70]. Second, we conducted Harman’s single-factor test using exploratory factor analysis without rotation to check the factor structure of the variables [70]. Two factors emerged, with the first factor accounting for 49.8% of the variance. Thus, no overwhelming factor was found to occur.

4.2. Hypothesis Testing and Results

We conducted the moderated hierarchical linear regression analysis to test the hypotheses. To eliminate potential multicollinearity, we mean-centered all the variables in the quadratic or interaction terms [71]. Our three-model regression are shown in Table 4. We conduct F tests to examine the significance of R-square changes in the models, and the results suggested that the newly added variables explained a significant extent of variance in the dependent variable.
As shown in Table 4, Model 1 contained control variables only. We added the independent variable ECSR and its quadratic term to test the main effect in Model 2. Ultimately, we added the interactions to test the moderating effects in Model 3. In Table 4, ECSR is positively related to firm’s new product performance (Model 2; β = 0.30, p < 0.001) and the square of ECSR is also positively related to firm’s new product performance (Model 2; β = 0.14, p < 0.01), supporting the U-shaped relationship predicted in Hypothesis 1. We used unstandardized parameter estimates to plot the main effect in Figure 1 to show the results intuitively.
The results of Model 3 in Table 4 supported the moderating roles of ownership type and institutional development level on the relationship between ECSR and a firm’s new product performance. First, the regression coefficient of the interaction term between market index and the square of ECSR was negative and significant (Model 3; β = −0.14, p < 0.05), which supported Hypothesis 2. Second, the regression coefficient of the interaction term between ownership type and square of ECSR was negative and significant (Model 3; β = −0.14, p < 0.10), which supported Hypothesis 3. We also plot the moderating effects in Figure 2; Figure 3 to gain more insights into these contingent effects. As shown in Figure 2, when firm operating in the region with high institutional development level, the ECSR has a flatter U-shaped relationship with new product performance. In Figure 3, compared with non-SOEs, the relationship between SOEs’ ECSR and new product performance flips from a U-shaped to a flatter inverted U-shaped.

5. Discussion

This study investigates and reveals a U-shaped relationship between firm’s ECSR and new product performance. Meanwhile, the findings show that a firm’s ownership and the institutional development level have negative contingent effects on such a curvilinear relationship. This paper makes several important contributions to the literature. Primarily, previous studies of ECSR delineate their effects upon firms by illustrating the cost and benefit sides of ECSR individually [4,72]. What is missing is how these costs and benefits would together formulate the actual effects of ECSR. Our study categorizes the influences that ECSR may shed upon firms into the ‘internal versus external’ and the ‘behavioral versus infrastructural’ categories, and that depict a relatively complete picture regards the functional mechanism of ECSR upon the outcome variables. Specifically, firms’ implementation of ECSR is a process during which firms’ capacity and intention, and the perceptional influences (e.g., public awareness) and the infrastructural assistances and/or impediments (e.g., public support, environment protection laws) from external entities would converge with each other to determine the actual effects of firms’ ECSR at different stages.
More importantly, the conceptual framework we propose advances current understandings about the contingent effects of firms’ ECSR. First, previous explorations provide wisdoms about how firms’ internal or external factors may affect the effects of ECSR, our research goes one step further to advance an ex ante view by proposing that, firms’ inherent traits, namely their ownership type and location choice, would determine the contingent effects of their ECSR inherently. As the empirical results suggest, other things are equal, and a firm that extensively implements ECSR would receive relatively lower returns when it is an SOE rather than a non-SOE, and may experience relatively higher returns when it locates in the provinces with a lower local institutional development level rather than high one. In other words, who you are and where you locate largely determine the extent of new product performance you may get from the implementation of ECSR.
In addition, the moderation indicators we employed also provide possible avenues to combine the fragmented influential factors that previous studies recognize [10,14]. As the institutional research suggests, “firms rationally pursue their interests and make strategic choices within the formal and informal constraints” [73] (p. 67), and the implementation of a certain kind of practice (e.g., ECSR) may be affected by managers’ calculation of risks, costs, and potential benefits in a given institutional framework [74]. Incorporating these wisdoms, based on the evaluation framework we established, we interpret the influences that firms’ internal (reflected by ownership structure) and external (reflected by institutional development level) contexts may have upon the ECSR-new product performance link by comprehensively considering their behavioral and infrastructural influences.

6. Conclusions

6.1. Theoretical Contributions

This study draws on signal theory and institutional theory to corroborates the curvilinear effects of ECSR on firms’ new product performance, and its contingencies upon firms’ owner structure and local institutional environment. This study not only provides a relatively complete picture of institution-based ECSR that encompasses how the cost–benefit tradeoff may formulate the actual effects of ECSR at different stages, but also how the various contexts in which ECSR have been implemented lead to infrastructural and behavioral variations that would together determine the contingent effects of ECSR ex ante.

6.2. Managerial Implications

Given the striking air pollution in China in recent days, our research is not intended to offer advices regard how firms could receive maximized returns at minimum expenses on their ECSR. Instead, we contend that, in this globalized world, ECSR should be deemed as the responsibility of each firms for the society and human race rather than the tool to obtain profits and competitive advantages. Fortunately, the empirical results clearly indicate that, for firms in general, and under the contingent context that we examined, though the profiting curve may differ, the highest return always comes when firms have sufficiently implemented their ECSR. As a management scholar, and more importantly as a human being, we suggest that, for those firms who operate in the developing countries, no matter who you are, and where you locate, it is a rational and also feasible choice to implement ECSR.

6.3. Limitations and Directions for Future Research

Several limitations provide opportunities for future research. First, we didn’t consider the potential problem of endogeneity. Future research should consider collecting an appropriate instrumental variable to perform the Heckman test to better control for endogeneity. Second, we illustrate how firms’ contexts influence the effects of firms’ ECSR. Our data were collected from a single nation, and that the findings are more salient in the context of China. Hence, it would be meaningful to test these hypotheses using data from other transitional economies and developed economies to test the generalizability our research. Further research could investigate the combined influences (SOEs in provinces with different IDLs) to develop instruments and investigate firms’ specific perceptions as well as adaptions to such contextual influences. Finally, the cross-sectional nature of our survey data could not test the cause- and-effect relationships in the model, and future research may consider a longitudinal study to test the theoretical framework, especially the comparisons of the effects of ECSR across different institutional contexts.

Author Contributions

Concept, writing-original draft, investigation, methodology and supervision, writing review & editing, Z.Y.; formal analysis, resources, software and validation, visualization, Y.Z.; data curation, investigation, methodology, Y.G.; funding acquisition, supervision, S.G.; writing review & editing, K.F.H.

Funding

This research was supported by National Natural Science Foundation of China (71602157, 71972151), China Postdoctoral Science Foundation (2018M641004), and Fundamental Research Funds for the Central Universities (SK2018037).

Conflicts of Interest

The authors declare no conflict of interest.

Appendix A

Table A1. Measurement Items, Factor Loadings, and Internal Reliabilities.
Item (Composite Reliability)Cronbach’s AlphaFactor Loadings
To what extent do you agree with the following statements according to your company?
Environmental Corporate Social Responsibility(0.92)0.90
(Adopted from Orsato 2006)
In the past three years, your company has
Protected the environment
0.86
Maintained an ethical working environment 0.87
Utilized resources wisely and responsibly0.91
Economized the usage of raw materials0.85
Recycled our products 0.72
New Product Development Performance (0.91)0.87
(Adopted from Kim and Atuahene-Gima, 2010)
In the past three years, whether the new product development performance of your company is better than your major competitors’ in
Profit0.84
Sales 0.90
Customer satisfaction 0.78
Market shares0.87

References

  1. Flammer, C. Corporate social responsibility and shareholder reaction: The environmental awareness of investors. Acad. Manag. J. 2013, 56, 758–781. [Google Scholar] [CrossRef]
  2. Rahman, N.; Post, C. Measurement issues in environmental corporate social responsibility (ECSR): Toward a transparent, reliable, and construct valid instrument. J. Bus. Ethics 2012, 105, 307–319. [Google Scholar] [CrossRef]
  3. Cho, S.J.; Chung, C.Y.; Young, J. Study on the Relationship between CSR and Financial Performance. Sustainability 2019, 11, 343. [Google Scholar] [CrossRef]
  4. Wei, Z.; Shen, H.; Zhou, K.Z.; Li, J.J. How does environmental corporate social responsibility matter in a dysfunctional institutional environment? Evidence from China. J. Bus. Ethics 2017, 140, 209–223. [Google Scholar] [CrossRef]
  5. Margolis, J.D.; Elfenbein, H.A.; Walsh, J.P. Does it pay to be good? A meta-analysis and redirection of research on the relationship between corporate social and financial performance. Ann. Arbor 2007, 1001, 48109-1234. [Google Scholar]
  6. Shu, C.; Zhou, K.Z.; Xiao, Y.; Gao, S. How green management influences product innovation in China: The role of institutional benefits. J. Bus. Ethics 2016, 133, 471–485. [Google Scholar] [CrossRef]
  7. Liu, C.C.; Wang, L.F.; Lee, S.H. Strategic environmental corporate social responsibility in a differentiated duopoly market. Econ. Lett. 2015, 129, 108–111. [Google Scholar] [CrossRef]
  8. Hirose, K.; Lee, S.H.; Matsumura, T. Environmental corporate social responsibility: A note on the first-mover advantage under price competition. Econ. Bull. 2017, 37, 214–221. [Google Scholar]
  9. Su, W.; Peng, M.W.; Tan, W.; Cheung, Y.L. The signaling effect of corporate social responsibility in emerging economies. J. Bus. Ethics 2016, 134, 479–491. [Google Scholar] [CrossRef]
  10. Marquis, C.; Zhang, J.; Zhou, Y. Regulatory uncertainty and corporate responses to environmental protection in China. Calif. Manag. Rev. 2011, 54, 39–63. [Google Scholar] [CrossRef]
  11. Orlitzky, M.; Schmidt, F.L.; Rynes, S.L. Corporate social and financial performance: A meta-analysis. Organ. Stud. 2003, 24, 403–441. [Google Scholar] [CrossRef]
  12. Surroca, J.; Tribó, J.A.; Waddock, S. Corporate responsibility and financial performance: The role of intangible resources. Strateg. Manag. J. 2010, 31, 463–490. [Google Scholar] [CrossRef]
  13. Chen, Y.S.; Chang, C.H. The determinants of green product development performance: Green dynamic capabilities, green transformational leadership, and green creativity. J. Bus. Ethics 2013, 116, 107–119. [Google Scholar] [CrossRef]
  14. Ding, S.; Jia, C.; Wu, Z.; Yuan, W. Environmental management under subnational institutional constraints. J. Bus. Ethics 2016, 134, 631–648. [Google Scholar] [CrossRef]
  15. Lyon, T.P.; Maxwell, J.W. Corporate social responsibility and the environment: A theoretical perspective. Rev. Environ. Econ. Policy 2008, 2, 240–260. [Google Scholar] [CrossRef]
  16. Armas-Cruz, Y.; Gil-Soto, E.; Oreja-Rodríguez, J.R. Environmental management in SMEs: Organizational and sectoral determinants in the context of an Outermost European Region. J. Bus. Econ. Manag. 2017, 18, 935–953. [Google Scholar] [CrossRef]
  17. Flammer, C. Competing for government procurement contracts: The role of corporate social responsibility. Strateg. Manag. J. 2018, 39, 1299–1324. [Google Scholar] [CrossRef]
  18. Orsato, R.J. Competitive Environmental Strategies: When Does It Pay to be Green? Calif. Manag. Rev. 2006, 48, 127–143. [Google Scholar] [CrossRef]
  19. Jayachandran, S.; Kalaignanam, K.; Eilert, M. Product and environmental social performance: Varying effect on firm performance. Strateg. Manag. J. 2013, 34, 1255–1264. [Google Scholar] [CrossRef]
  20. Hou, M.; Liu, H.; Fan, P.; Wei, Z. Does CSR practice pay off in East Asian firms? A meta-analytic investigation. Asia Pac. J. Manag. 2016, 33, 195–228. [Google Scholar] [CrossRef]
  21. Cheng, B.; Ioannou, I.; Serafeim, G. Corporate Social Responsibility and Access to Finance. Strateg. Manag. J. 2014, 35, 1–23. [Google Scholar] [CrossRef]
  22. Hart, S.L. A natural-resource-based view of the firm. Acad. Manag. Rev. 1995, 20, 986–1014. [Google Scholar] [CrossRef]
  23. Hart, S.L.; Dowell, G. Invited editorial: A natural-resource-based view of the firm: Fifteen years after. J. Manag. 2011, 37, 1464–1479. [Google Scholar] [CrossRef]
  24. Becchetti, L.; Ciciretti, R.; Hasan, I.; Kobeissi, N. Corporate social responsibility and shareholder’s value. J. Bus. Res. 2012, 65, 1628–1635. [Google Scholar] [CrossRef]
  25. Ambec, S.; Cohen, M.A.; Elgie, S.; Lanoie, P. The Porter Hypothesis at 20: Can Environmental Regulation Enhance Innovation and Competitiveness? Rev. Environ. Econ. Policy 2013, 7, 2–22. [Google Scholar] [CrossRef] [Green Version]
  26. McWilliams, A.; Siegel, D. Corporate social responsibility: A theory of the firm perspective. Acad. Manag. Rev. 2001, 26, 117–127. [Google Scholar] [CrossRef]
  27. Brammer, S.; Millington, A. Does It Pay to Be Different? An Analysis of the Relationship between Corporate Social and Financial Performance. Strateg. Manag. J. 2008, 29, 1325–1343. [Google Scholar] [CrossRef]
  28. Godfrey, P.C. The relationship between corporate philanthropy and shareholder wealth: A risk management perspective. Acad. Manag. Rev. 2005, 30, 777–798. [Google Scholar] [CrossRef]
  29. Gao, C.; Zuzul, T.; Jones, G.; Khanna, T. Overcoming institutional voids: A reputation-based view of long-run survival. Strateg. Manag. J. 2017, 38, 2147–2167. [Google Scholar] [CrossRef]
  30. Kaul, A.; Luo, J. An economic case for CSR: The comparative efficiency of for-profit firms in meeting consumer demand for social goods. Strateg. Manag. J. 2018, 39, 1650–1677. [Google Scholar] [CrossRef]
  31. Park, J.; Lee, H.; Kim, C.; Jbusres, J. Corporate social responsibilities, consumer trust and corporate reputation: South Korean consumers’ perspectives. J. Bus. Res. 2014, 67, 295–302. [Google Scholar] [CrossRef]
  32. Alshammari, M. Corporate social responsibility and firm performance: The moderating role of reputation and institutional investors. Int. J. Bus. Manag. 2015, 10, 15. [Google Scholar] [CrossRef]
  33. Luo, X.; Bhattacharya, C.B. Corporate social responsibility, customer satisfaction, and market value. J. Mark. 2006, 70, 1–18. [Google Scholar] [CrossRef]
  34. Du, S.; Vieira, E.T. Striving for legitimacy through corporate social responsibility: Insights from oil companies. J. Bus. Ethics 2012, 110, 413–427. [Google Scholar] [CrossRef]
  35. Greening, D.W.; Turban, D.B. Corporate social performance as a competitive advantage in attracting a quality workforce. Bus. Soc. 2000, 39, 254–280. [Google Scholar] [CrossRef]
  36. Shiu, Y.M.; Yang, S.L. Does engagement in corporate social responsibility provide strategic insurance-like effects? Strateg. Manag. J. 2017, 38, 455–470. [Google Scholar] [CrossRef]
  37. Flammer, C.; Luo, J. Corporate social responsibility as an employee governance tool: Evidence from a quasi-experiment. Strateg. Manag. J. 2017, 38, 163–183. [Google Scholar] [CrossRef]
  38. Fremeth, A.R.; Shaver, J.M. Strategic rationale for responding to extra-jurisdictional regulation: Evidence from firm adoption of renewable power in the US. Strateg. Manag. J. 2014, 35, 629–651. [Google Scholar] [CrossRef]
  39. Freeman, R.E. Strategic Management: A Stakeholder Approach; Cambridge University Press: Cambridge, UK, 2010. [Google Scholar]
  40. Peloza, J. The challenge of measuring financial impacts from investments in corporate social performance. J. Manag. 2009, 35, 1518–1541. [Google Scholar] [CrossRef]
  41. Pujari, D.; Wright, G.; Peattie, K. Green and competitive: Influences on environmental new product development performance. J. Bus. Res. 2003, 56, 657–671. [Google Scholar] [CrossRef]
  42. Wang, H.; Jin, Y. Industrial Ownership and Environmental Performance: Evidence from China. Environ. Resour. Econ 2007, 36, 255–273. [Google Scholar] [CrossRef]
  43. Russo, M.V.; Fouts, P.A. A Resource-Based Perspective on Corporate Environmental Performance and Profitability. Acad. Manag. J. 1997, 40, 534–559. [Google Scholar]
  44. Baron, D.P. A Positive Theory of Moral Management, Social Pressure, and Corporate Social Performance. J. Econ. Manag. Strategy 2009, 18, 7–43. [Google Scholar] [CrossRef]
  45. Baron, D.P.; Diermeier, D. Strategic Activism and Nonmarket Strategy. J. Econ. Manag. Strategy 2007, 16, 36. [Google Scholar] [CrossRef]
  46. Barnett, M.L.; Salomon, R.M. Does it pay to be really good? Addressing the shape of the relationship between social and financial performance. Strateg. Manag. J. 2012, 33, 1304–1320. [Google Scholar] [CrossRef]
  47. Porter, M.E.; Kramer, M.R. The link between competitive advantage and corporate social responsibility. Harv. Bus. Rev. 2006, 84, 78–92. [Google Scholar] [PubMed]
  48. Bai, C.E.; Lu, J.; Tao, Z. Property rights protection and access to bank loans: Evidence from private enterprises in China. Econ. Transit. 2006, 14, 611–628. [Google Scholar] [CrossRef]
  49. Jia, N. Are collective political actions and private political actions substitutes or complements? Empirical evidence from China’s private sector. Strateg. Manag. J. 2014, 35, 292–315. [Google Scholar] [CrossRef]
  50. Pearson, M.M. China’s New Business Elite: The Political Consequences of Economic Reform; University of California Press: Berkeley, CA, USA, 1997. [Google Scholar]
  51. Jin, H.; Qian, Y.; Weingast, B.R. Regional decentralization and fiscal incentives: Federalism, Chinese style. J. Public Econ. 2006, 89, 1719–1742. [Google Scholar] [CrossRef]
  52. Oliver, C.; Holzinger, I. The effectiveness of strategic political management: A dynamic capabilities framework. Acad. Manag. Rev. 2008, 33, 496–520. [Google Scholar] [CrossRef]
  53. Sonenshein, S.; DeCelles, K.A.; Dutton, J.E. It’s not easy being green: The role of self-evaluations in explaining support of environmental issues. Acad. Manag. J. 2014, 57, 7–37. [Google Scholar] [CrossRef]
  54. Werner, T. Gaining access by doing good: The effect of sociopolitical reputation on firm participation in public policy making. Manag. Sci. 2015, 61, 1989–2011. [Google Scholar] [CrossRef]
  55. Walsh, I.J.; Bhatt, M.; Bartunek, J.M. Organizational knowledge creation in the Chinese context. Manag. Organ. Rev. 2009, 5, 261–278. [Google Scholar] [CrossRef]
  56. Stan, C.V.; Peng, M.W.; Bruton, G.D. Slack and the performance of state-owned enterprises. Asia Pac. J. Manag. 2014, 31, 473–495. [Google Scholar] [CrossRef]
  57. Sheng, S.; Zhou, K.Z.; Li, J.J. The effects of business and political ties on firm performance: Evidence from China. J. Mark. 2011, 75, 1–15. [Google Scholar] [CrossRef]
  58. Hoskisson, R.E.; Eden, L.; Lau, C.M.; Wright, M. Strategy in emerging economies. Acad. Manag. J. 2000, 43, 249–267. [Google Scholar]
  59. Li, J.; Qian, C. Principal-principal conflicts under weak institutions: A study of corporate takeovers in China. Strateg. Manag. J. 2013, 34, 498–508. [Google Scholar] [CrossRef]
  60. Fan, G.; Wang, X.; Zhu, H. NERI Index of Marketization of China’s Provinces 2011 Report; Economic Science Press: Beijing, China, 2011. [Google Scholar]
  61. Gao, Y.; Gao, S.; Zhou, Y.; Huang, K.F. Picturing firms’ institutional capital-based radical innovation under China’s institutional voids. J. Bus. Res. 2015, 68, 1166–1175. [Google Scholar] [CrossRef]
  62. Van Bruggen, G.H.; Lilien, G.L.; Kacker, M. Informants in organizational marketing research: Why use multiple informants and how to aggregate responses. J. Mark. Res. 2002, 39, 469–478. [Google Scholar] [CrossRef]
  63. Peng, M.W.; Luo, Y. Managerial ties and firm performance in a transition economy: The nature of a micro-macro link. Acad. Manag. J. 2000, 43, 486–501. [Google Scholar]
  64. Shi, W.; Sun, S.L.; Peng, M.W. Sub-national institutional contingencies, network positions, and IJV partner selection. J. Manag. Stud. 2012, 49, 1221–1245. [Google Scholar] [CrossRef]
  65. Li, K.; Yue, H.; Zhao, L. Ownership, institutions, and capital structure: Evidence from China. J. Comp. Econ. 2009, 37, 471–490. [Google Scholar] [CrossRef]
  66. Chan, C.M.; Makino, S.; Isobe, T. Does subnational region matter? Foreign affiliate performance in the United States and China. Strateg. Manag. J. 2010, 31, 1226–1243. [Google Scholar] [CrossRef]
  67. Kim, N.; Atuahene-Gima, K. Using exploratory and exploitative market learning for new product development. J. Prod. Innov. Manag. 2010, 27, 519–536. [Google Scholar] [CrossRef]
  68. Zimmerman, M.A.; Zeitz, G.J. Beyond survival: Achieving new venture growth by building legitimacy. Acad. Manag. Rev. 2002, 27, 414–431. [Google Scholar] [CrossRef]
  69. Fornell, C.; Larcker, D.F. Evaluating structural equation models with unobservable variables and measurement error. J. Mark. Res. 1981, 18, 39–50. [Google Scholar] [CrossRef]
  70. Podsakoff, P.M.; MacKenzie, S.B.; Lee, J.Y.; Podsakoff, N.P. Common method biases in behavioral research: A critical review of the literature and recommended remedies. J. Appl. Psychol. 2003, 88, 879. [Google Scholar] [CrossRef]
  71. Aiken, L.; West, S. The Effects of Predictor Scaling on Coefficients of Regression Equations; Sage: Newbury Park, CA, USA, 1991. [Google Scholar]
  72. Scherer, A.G.; Palazzo, G. The new political role of business in a globalized world: A review of a new perspective on CSR and its implications for the firm, governance, and democracy. J. Manag. Stud. 2011, 48, 899–931. [Google Scholar] [CrossRef]
  73. Peng, M.W.; Sun, S.L.; Pinkham, B.; Chen, H. The institution-based view as a third leg for a strategy tripod. Acad. Manag. Perspect. 2009, 23, 63–81. [Google Scholar] [CrossRef]
  74. Bruton, G.D.; Lau, C.M. Asian management research: Status today and future outlook. J. Manag. Stud. 2008, 45, 636–659. [Google Scholar] [CrossRef]
Figure 1. Main effect (H1).
Sustainability 11 04968 g001
Figure 2. Contingent effect of institutional development level (H2).
Sustainability 11 04968 g002
Figure 3. Contingent effect of firm ownership (H3).
Sustainability 11 04968 g003
Table 1. Benefits of environmental corporate social responsibility.
BenefitsBehavioralInfrastructural
InternalOrganizational commitment and loyalty by employees [35]Operational efficiency [13,22]
Intangible resources [12]
Legal and cleanup costs reduction [1]
Improvements in waste reductions and process enhancements [37]
A focus/differentiation-based strategy
Reduce risk [36]
ExternalGreen images reputation [11,12]
Legitimacy [4,6]
Long-term competitive advantages [23,24,38]
Stakeholder relationship [11,30,39]
Customer satisfaction [33]
Trust and goodwill [28,29,31,40]
Reshape marketing rules in the market [13]
Table 2. Costs of environmental corporate social responsibility.
CostsBehavioralInfrastructural
InternalInternal resistance [41]Decrease profits
Cost of integrating environmental management philosophy with internal structure
High fixed and variable costs [26]
ExternalIncreasing market riskViolate the contractual relationship with shareholders [1,24]
Table 3. Descriptive statistics and construct correlations (N = 303).
Variables123456789101112131415161718
1. Ownership--
2. Firm age0.25 **--
3. Firm size0.18 **0.50 **--
4. Machinery manufacturing.−0.05−0.01−0.05--
5. Aerospace0.060.030.07−0.05--
6. Chemical0.06−0.03−0.06−0.13 *−0.04--
7. Pharmaceutical−0.06−0.07−0.06−0.07−0.02−0.05--
8. IT−0.15 **0.100.16 **−0.12 *−0.04−0.09−0.05--
9. Food−0.10−0.05−0.05−0.09−0.03−0.06−0.04−0.06--
10. Other industries0.09−0.030.02−0.14 *−0.04−0.10−0.06−0.09−0.07--
11. Market index−0.26 **−0.100.11−0.020.01−0.09−0.090.31 **−0.060.04--
12. ECSR−0.11−0.070.10−0.04−0.01−0.010.000.13 *0.100.080.100.84
13. New product development performance−0.13 *−0.030.07−0.110.08−0.010.020.05−0.080.17 **0.15 **0.38 **0.85
14. Market share0.01−0.030.10−0.10−0.030.01−0.05−0.04−0.000.010.100.22 **0.27 **--
15. R&D input−0.10−0.11−0.04−0.09−0.02−0.02−0.070.09−0.030.010.21 **0.25 **0.32 **0.58 **--
16. Technology advancing−0.040.14 *0.03−0.060.05−0.04−0.05−0.01−0.010.11 *−0.020.20 **0.25 **0.050.08--
17. Competition intensity0.040.02−0.070.050.07−0.08−0.04−0.080.050.02−0.16 **0.080.12 *0.01−0.090.46 **--
18. Manager as NPC member0.23 **0.090.20 **−0.000.05−0.01−0.02−0.070.090.10−0.080.16 **0.020.020.020.16 **0.18 **--
Mean0.39236.420.150.020.080.030.080.040.107.255.314.985.484.814.614.814.18
SD0.4919.661.970.360.130.280.170.270.200.292.110.870.881.191.221.151.071.48
Notes: Diagonal elements (in bold) are square roots of the AVE values; * p < 0.05, ** p < 0.01.
Table 4. Hierarchical linear regression results (n = 303).
VariablesModel 1Model 2Model 3
BVIFBVIFBVIF
Control Variables
Firm age−0.081.40−0.041.43−0.011.57
Firm size0.12 +1.490.091.520.091.58
Machinery manufacturing−0.031.13−0.031.14−0.051.16
Aerospace0.081.030.071.030.091.07
Chemical0.011.080.001.080.011.11
Pharmaceutical0.071.050.061.050.061.07
IT0.031.13−0.011.16−0.051.30
Food−0.051.06−0.081.08−0.091.11
Other industries0.12 *1.090.081.120.091.14
Market share0.14 *1.720.11 +1.730.12 +1.76
R&D input0.23 **1.750.18 **1.780.171.84
Technology advancing0.18 **1.340.11 +1.400.111.48
Competition intensity0.071.360.091.390.101.42
Manager as NPC member−0.071.13−0.10 +1.14−0.101.22
Direct Effects
Environmental Corporate Social Responsibility (ECSR) 0.30 ***1.230.29 ***1.31
ECSR × ECSR 0.14 **1.080.11 *1.13
Market Index (MI) 0.13 +2.09
Ownership −0.011.94
Interactions
ECSR × MI 0.041.24
ECSR × Ownership 0.031.22
ECSR × ECSR × MI 0.14 *1.93
ECSR × ECSR × Ownership 0.14 +1.91
R20.210.290.32
Adjusted R20.170.250.26
ΔR2 0.080.03
F-Value5.24 ***7.17 ***5.75 ***
Note: Hypotheses in the parentheses in bold are supported; + p < 0.10, * p < 0.05, ** p < 0.01, *** p < 0.001.

