Article

Geochemical Characteristics of Rare Earth Elements in Soils from Puding Karst Critical Zone Observatory, Southwest China

1
School of Water Resources and Environment, China University of Geosciences (Beijing), Beijing 100083, China
2
Institute of Geographic Sciences and Natural Resources Research, Chinese Academy of Sciences, Beijing 100101, China
*
Author to whom correspondence should be addressed.
Sustainability 2019, 11(18), 4963; https://doi.org/10.3390/su11184963
Submission received: 27 July 2019 / Revised: 5 September 2019 / Accepted: 5 September 2019 / Published: 11 September 2019

Abstract

:
Soil samples from eight soil profiles under different land-use types were collected at the Puding Karst Critical Zone Observatory, Southwest China, to investigate the distribution, fractionation, and controlling factors of rare earth elements (REEs). The total REEs contents in topsoil ranged from 149.97 to 247.74 mg kg−1, the contents in most topsoil were higher than local soil background value (202.60 mg kg−1), and the highest content was observed in topsoil under cropland. The REEs contents in surface soils from lower slopes sites were higher than that of middle and upper slope sites, and the highest contents were observed in cropland. The PAAS-normalized REEs pattern in soils showed MREEs significantly enriched relative to LREEs and HREEs, and HREEs were enriched relative to LREEs. The results showed that clay content, pH, soil organic carbon, total phosphorus, and Fe content were the main factors influencing the distribution of REEs in karst soils, and soil organic carbon (SOC), Fe content showed better linear relationship with REEs.

1. Introduction

Rare earth elements (REEs) include a series of lanthanide elements, and they have similar electronic structures and chemical properties. Two to three groups of REEs are generally distinguished into light rare earth elements (LREEs), heavy rare earth elements (HREEs), and sometimes middle rare earth elements (MREEs) based on their atomic mass and effective ion radius [1,2]. REEs generally occur as trivalent ions, Ce can be also in tetravalent state, and Eu is in divalent state. REEs are widely used to investigate soil environmental change and weathering processes, and they are the powerful indicators of geochemical processes and soil development [3,4].
REEs contents in soils are largely influenced by the bedrocks and its physical/chemical properties [5]. Extrinsic REEs sources in soils are anthropogenic inputs and atmospheric depositions [6]. In general, the soil properties such as clay mineralogy, organic matter, pH and presence of carbonate influence the distribution and migration of REEs [5,7]. Galán et al. [8] reported that clay minerals acted as the carriers of REEs in soils and weathering profiles, and partially controlled the stocks of REEs. However, some researchers found that REEs seemed to have a high affinity for organic substances, and soil organic matters with lots of negatively charged groups had high capacity to adsorb, chelate or complex REEs with positive charge [9,10]. Aubert et al. revealed that the proportion of REEs bound to organic matters increased with soil depth and the migration was more obvious for HREEs than for LREEs [8]. REEs contents in environment have been increased by anthropogenic inputs via agricultural activities, medical application and mining [11,12,13]. REEs-based micro-nutrient fertilizers or feed additives are widely applied in plant and animal production, because they can lead to an improvement of harvest and quality of agricultural, and REEs within a certain concentration can advance the uptake of nutritional elements [14,15]. P-fertilizers are always the anthropogenic source of REEs, and generally lead to enhance of REEs contents in soils, due to the high affinity of phosphates to REEs [5,16].
Puding Karst Critical Zone Observatory (CZO) in Southwest China is controlled by fragile karst environment [17,18]. The regions are easily damaged by anthropogenic activities, such as rocky desertification [19]. Land-use/land-cover change is an important anthropogenic factor influenced the structure and properties of karst soils, and causes land degradation [20,21]. Studies on the distribution of REEs and the controlling factors will help to understand mobilization processes and to predict their geochemical behaviors in karst soils. However, only a few studies have been published on the vertical distribution of REEs and controlling factors with different land-use types [22,23]. Therefore, the objectives of the present study were to characterize the distribution and fractionation of REEs along soil profiles in the karst CZO, and to research the factors influencing REEs transportation and distribution under different types of land use.

2. Materials and Methods

2.1. Study Area

The study site is located at the Puding karst CZO within Chenqi county in Guizhou province (26°15′–26° 16′ N, 105°46′–105°47′ E), southwest China (Figure 1). This area is characterized by a subtropical monsoon climate with the mean annual precipitation 1400 mm, and mean air temperature of 15 °C [24]. The main lithology is carbonate rocks of Permian and Triassic, and the karst rocky desertification areas are about 21.5% of the total area of Guizhou province [23]. The study area is a typical karst peak cluster including three mountains around, and sampling sites are designed according to different terrains and land-use types. The soils are mainly developed from limestones, and their thicknesses range from 10 to 160 cm [18,25]. This study catchment is far from cities and mining operations, and the agricultural activities strongly affect the ecological environment.

2.2. Samples Collection and Analysis

Eight soil profiles were selected with different land uses and slope positions from three mountains and their peripheries in summer, 2016. A total of 41 soil samples were collected from the soil profiles, which are classified as secondary forest (USF), shrub land (USL, MSL and MSP), grassland (LGL), abandoned cropland (LAC and LAW), and cropland (LCL). One bedrock sample and two fertilizer samples were collected. Eight soil profiles are also divided into upper slope (USF and USL), middle slope (MSL and MSP) and lower slope (LGL, LAC, LAW and LCL) according to slope positions of mountains. Features of land-use types, slope position, and land-use description of the sampling sites are shown in Table 1. Soil profile samples were sectioned into 0–10, 10–20, 20–30, 30–50, 50–70, and 70–90 cm from top to bottom. A total of 18 background samples at depths of 0–20 cm were selected in Guizhou province, and the REEs contents were analyzed by Chinese Environmental Monitoring Station [26].
Soil samples were air-dried and sieved through a 2 mm sieve to remove coarse materials. Afterwards, some soil samples were ground into powder which could pass through a 200-mesh sieve for analysis. Bedrock sample was crumbled into fragments and then ground into powder for analysis. Soil particle size was measured by Laser Particle Analyzer (Mastersizer 2000 Type, Malvern, England), and clay content was calculated based on the analysis. Soil pH value was determined at a in a 1:2.5 soil/water suspension with a pH meter. SOC was determined with an elemental analyzer (Vario TOC cube, Elementar, Germany) after removing soil carbonates [27], and carbonate content was calculated according to the literature method [28]. Soil, bedrock and fertilizer samples were digested with HNO3-HF-HClO4 and analyzed with total phosphorus (TP) and Fe content by ICP-OES (Optima 5300DV, Perkin Elmer, US) [29].
For analysis of total REEs contents, samples were digested using HNO3, HF and HClO4, and the detail steps as follows: 50 mg sample was digested with 3 mL HNO3, 3 mL HF and 1 mL HClO4 in a teflon crucible at 120°C for 3 d. 1 mL HF and 1 mL HNO3 were used as supplements to make sure the digestion solutions clear. When the samples were completely digested, the digestion solutions were concentrated to about 0.5 mL. Finally, the digested remainder was reconstituted to 25 mL with purified water for ICP-MS (Elan DRC-e, Perkin Elmer, US) analysis. Quality control was performed by using national standard reference materials of China (GBW07404 and GBW07120) from the Chinese Academy of Measurement Sciences and procedural blanks.
Statistical analyses were performed using the commercial statistics software package SPSS 22.0 (IBM SPSS Statistics, Chicago, IL, US) and Origin 8.0 (OriginLab Northampton, MA, USA).

2.3. Data Treatment

The concentrations of REEs were normalized to Post-Archaean Australian Shale (PAAS) [30], and this normalization was used to identify the depletion or enrichment of REEs and to compare the REEs abundance in geological materials. REEs were divided into three groups including LREEs, MREEs, and HREEs. LREEs comprised of elements from La to Sm; MREEs comprised of Eu, and Gd, Tb; and Dy, HREEs comprised of elements from Ho to Lu.
The characteristic parameters of REEs, including ΣREEs, (La/Gd)N, (Gd/Yb)N, Ce anomaly (δCe), were calculated, where subscript N indicates the normalized abundance with PAAS.
The Ce anomaly represents a depletion or enrichment of Ce compared with its neighboring elements (La and Pr). Ce anomalies [31,32] are defined as follows:
δCe = 2 CeN/(LaN + PrN)
where CeN, LaN, PrN respectively represent REEs in the PAAS-normalized pattern of the samples. Generally, the δCe values greater than 1.0 represent positive anomalies, and the δCe values less than 1.0 represent negative anomalies.

3. Results and Discussion

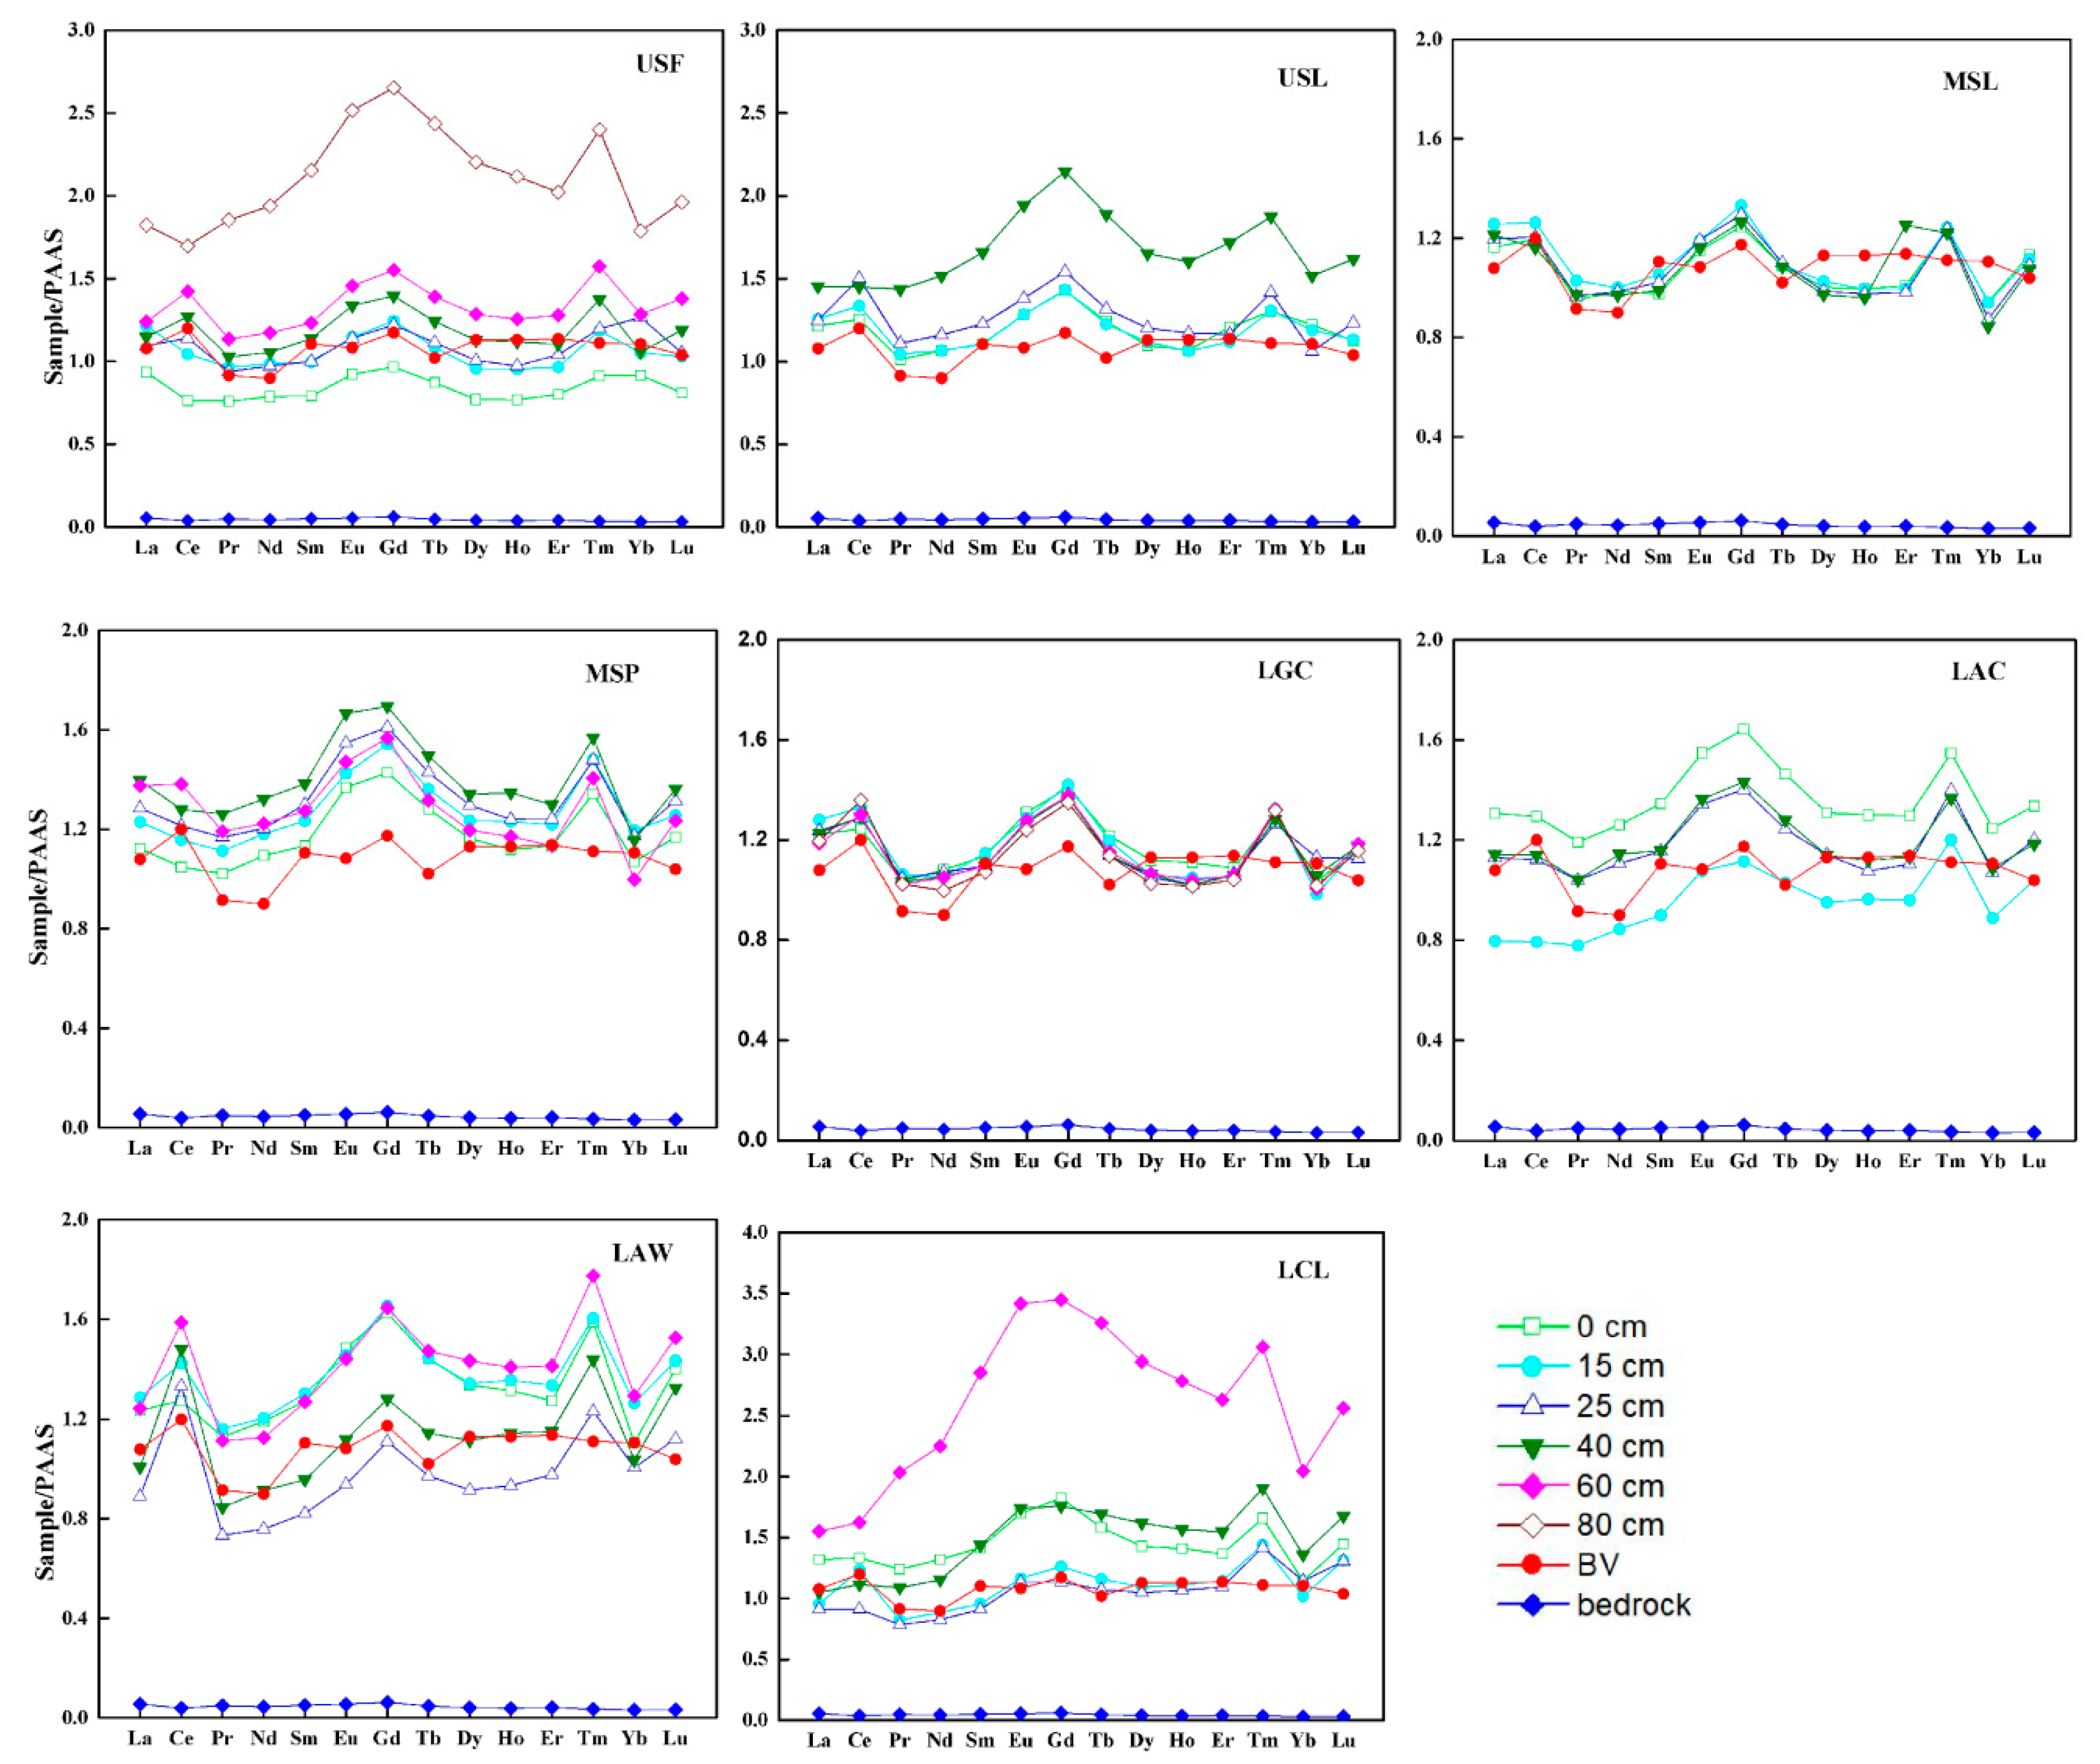
3.1. Distribution of REEs in the Soil Profile

Total REEs (ΣREEs) concentration in eight soil profiles and bedrock are summarized in Table 2. The ΣREEs in surface soils ranged from 145 to 248 mg kg−1, and the contents in most surface soils were higher than local soil background value (BV) (ΣREEs = 203 mg kg−1). The background samples were selected from Guizhou province, and the arithmetic means of REEs contents were as the BV and standard deviations shown in Table A1 [26]. The ΣREEs contents of bedrock was 8.05 mg kg−1 which was much lower than the level of soil layers in study area.
The ΣREEs contents in surface soils under different land uses followed an order of cropland > abandoned cropland > grassland > shrub land > secondary forest. The ΣREEs contents in topsoil layers were the lowest in secondary forest, which might be attributed to the dilution by organic matter availability, and the SOC contents in the secondary forest soils were the highest among all the surface soils with the contents 139 g·kg−1. The highest ΣREEs in surface soil was observed in cropland with the contents 248 mg·kg−1. The research area is in small catchment where is far from mining operations and cities, and agricultural activities are likely anthropogenic inputs of REEs. Some research revealed that high REEs distribution in agricultural region depended on the application of REEs-based pesticide and fertilizer in farming activities [11,16]. However, the REEs contents in modern fertilizer materials we collected were lower than the detection limits of instrument. Therefore, high REEs contents in cropland topsoil were related to farming activities long ago, or the nature soil erosion and movement of carriers from upper land.
ΣREEs contents in surface soils of lower slopes sites (LGL, LAC, LAW, LCL) were higher than that of upper and middle slope sites (USF, USL, MSL, MSP). It might be related to types of land-cover in different slope sites. At upper and middle slopes positions, there were amounts of dense trees and shrubs, and soils in the surface layer were covered by litter layers, which were rich in organic matter due to the decomposition of plant residues. ΣREEs in soils of these sampling sites were lower, which was possible associated with effects of organic matter. At lower slope positions, ΣREEs contents in surface soils were higher, and it might be attributed to natural comprehensive actions including secondary pedogenesis, erosion and soil accumulation from upland [33]. Song et al. revealed that in situ weathering and pedogenesis were the main activities in mountaintop, and chemical weathering and pedogenesis accompanying with soil erosion were the main forms in upper and middle slopes, and in situ weathering was not significant in foothills [33].
Distribution of ΣREEs with depth in soil profiles from different slope positions are shown in Figure 2a,b, and there were two kinds of changing trend of ΣREEs along the soil profiles. On the one hand, the ΣREEs contents in soil profiles from the upper and middle slope sites (USF, USL, MSL, MSP) increased with increasing depth from the surface layer to deeper layer, as shown in Figure 2a, and the ΣREEs contents were the lowest in surface layer and the highest in bottom layer. The most significant change of ΣREEs contents was observed in secondary forest soils from the upper slope sites, and the values increased from 145 to 340 mg·kg−1. On the other hand, ΣREEs contents in profile soils from lower slopes sites (LGL, LAC, LAW, LCL) decreased with increasing depth from surface to 25 cm, and then increased with increasing depth from 25 cm to bottom, and the lowest concentrations of ΣREEs were observed at a depth of 25 cm, as shown in Figure 2b. ΣREEs contents in soils above 25 cm might be related to soil erosion and movement of carriers from upper land. ΣREEs contents in the bottom soils were the highest among all the eight soil profiles, indicating that REEs accumulated in the deeper soils [34]. The reasons may be that REEs tended to be lost from shallower soil layers due to weathering and pedogenesis. Nesbitt and Markovics [35] also reported REEs, many transition metals, and metalloids tended to accumulate in the deeper parts of the weathering profile.

3.2. LREE/MREE/HREE Fractionation

The distribution of REEs in soil profile normalized to PAAS are illustrated in Figure 3. The shale-normalized REEs pattern showed MREEs significant fractionation relative to LREEs and HREEs. The REEs distribution patterns in soil profiles from eight sampling sites were similar. The fractionation of REEs in soil layers was much higher than the level of bedrock. The REEs enrichment in soil layers is caused by the pedogenesis of karst soils, and REEs were imported from outside with the soil-forming materials and were absorbed by clays [36]. It indicated that REE distribution were not mainly from bedrock, and it might be significantly related to chemical weathering, pedogenesis, and soil transportation. The variation extent of REEs fractionation patterns along the soil profiles was relatively large in cropland (LCL) and abandoned cropland (LAC and LAW). Therefore, the REE fractionation in cropland and abandoned cropland soils were associated with pedogenesis, erosion, and soil accumulation from upper land.
The values of (La/Yb)N, (La/Gd)N and (Gd/Yb)N are summarized in Table 2. The (La/Yb)N values were higher than 1 in all surface soils and most profile soils, which indicating that LREEs enrichment relative to HREE, and the values did not increase with increasing depth. The values of (La/Gd)N were in the range of 0.45–0.98, which indicting that MREEs were enriched relative to LREE. However, the values of (Gd/Yb)N were in the range of 0.96–1.68 (average value of 1.32), indicating that MREEs were enriched relative to HREEs. These patterns of REEs reflected the significant enrichments of MREEs relative to LREEs and HREEs, which might be attributed to preferentially MREEs complexed by organic colloidal material [37]. Tang et al. [37] reported that only MREE-enriched fractionation patterns were observed relative to LREEs and HREEs, when REEs were dominated by organic complexes with dissolved organic carbon with high molecular weight in natural terrestrial waters.

3.3. Ce Anomalies

The values of δCe in soils ranged from 0.91 to 1.64, with the most values higher than 1.0, showing slightly positive Ce anomaly in the soils. The positive Ce anomaly can be explained by redox chemistry. Redox condition may be the main cause to explain positive Ce anomaly in karst soils. Ce3+ was oxidized to Ce4+ under relative oxidation condition, and Ce anomaly is caused by more Ce4+, which might be able to be achieved by geochemical modeling. Yang et al. [38] reported that varying degrees of positive Ce anomaly was shown in red soils from southern China, which reflected the differentiation of Ce caused by different oxidation environments during the process of soil-forming.

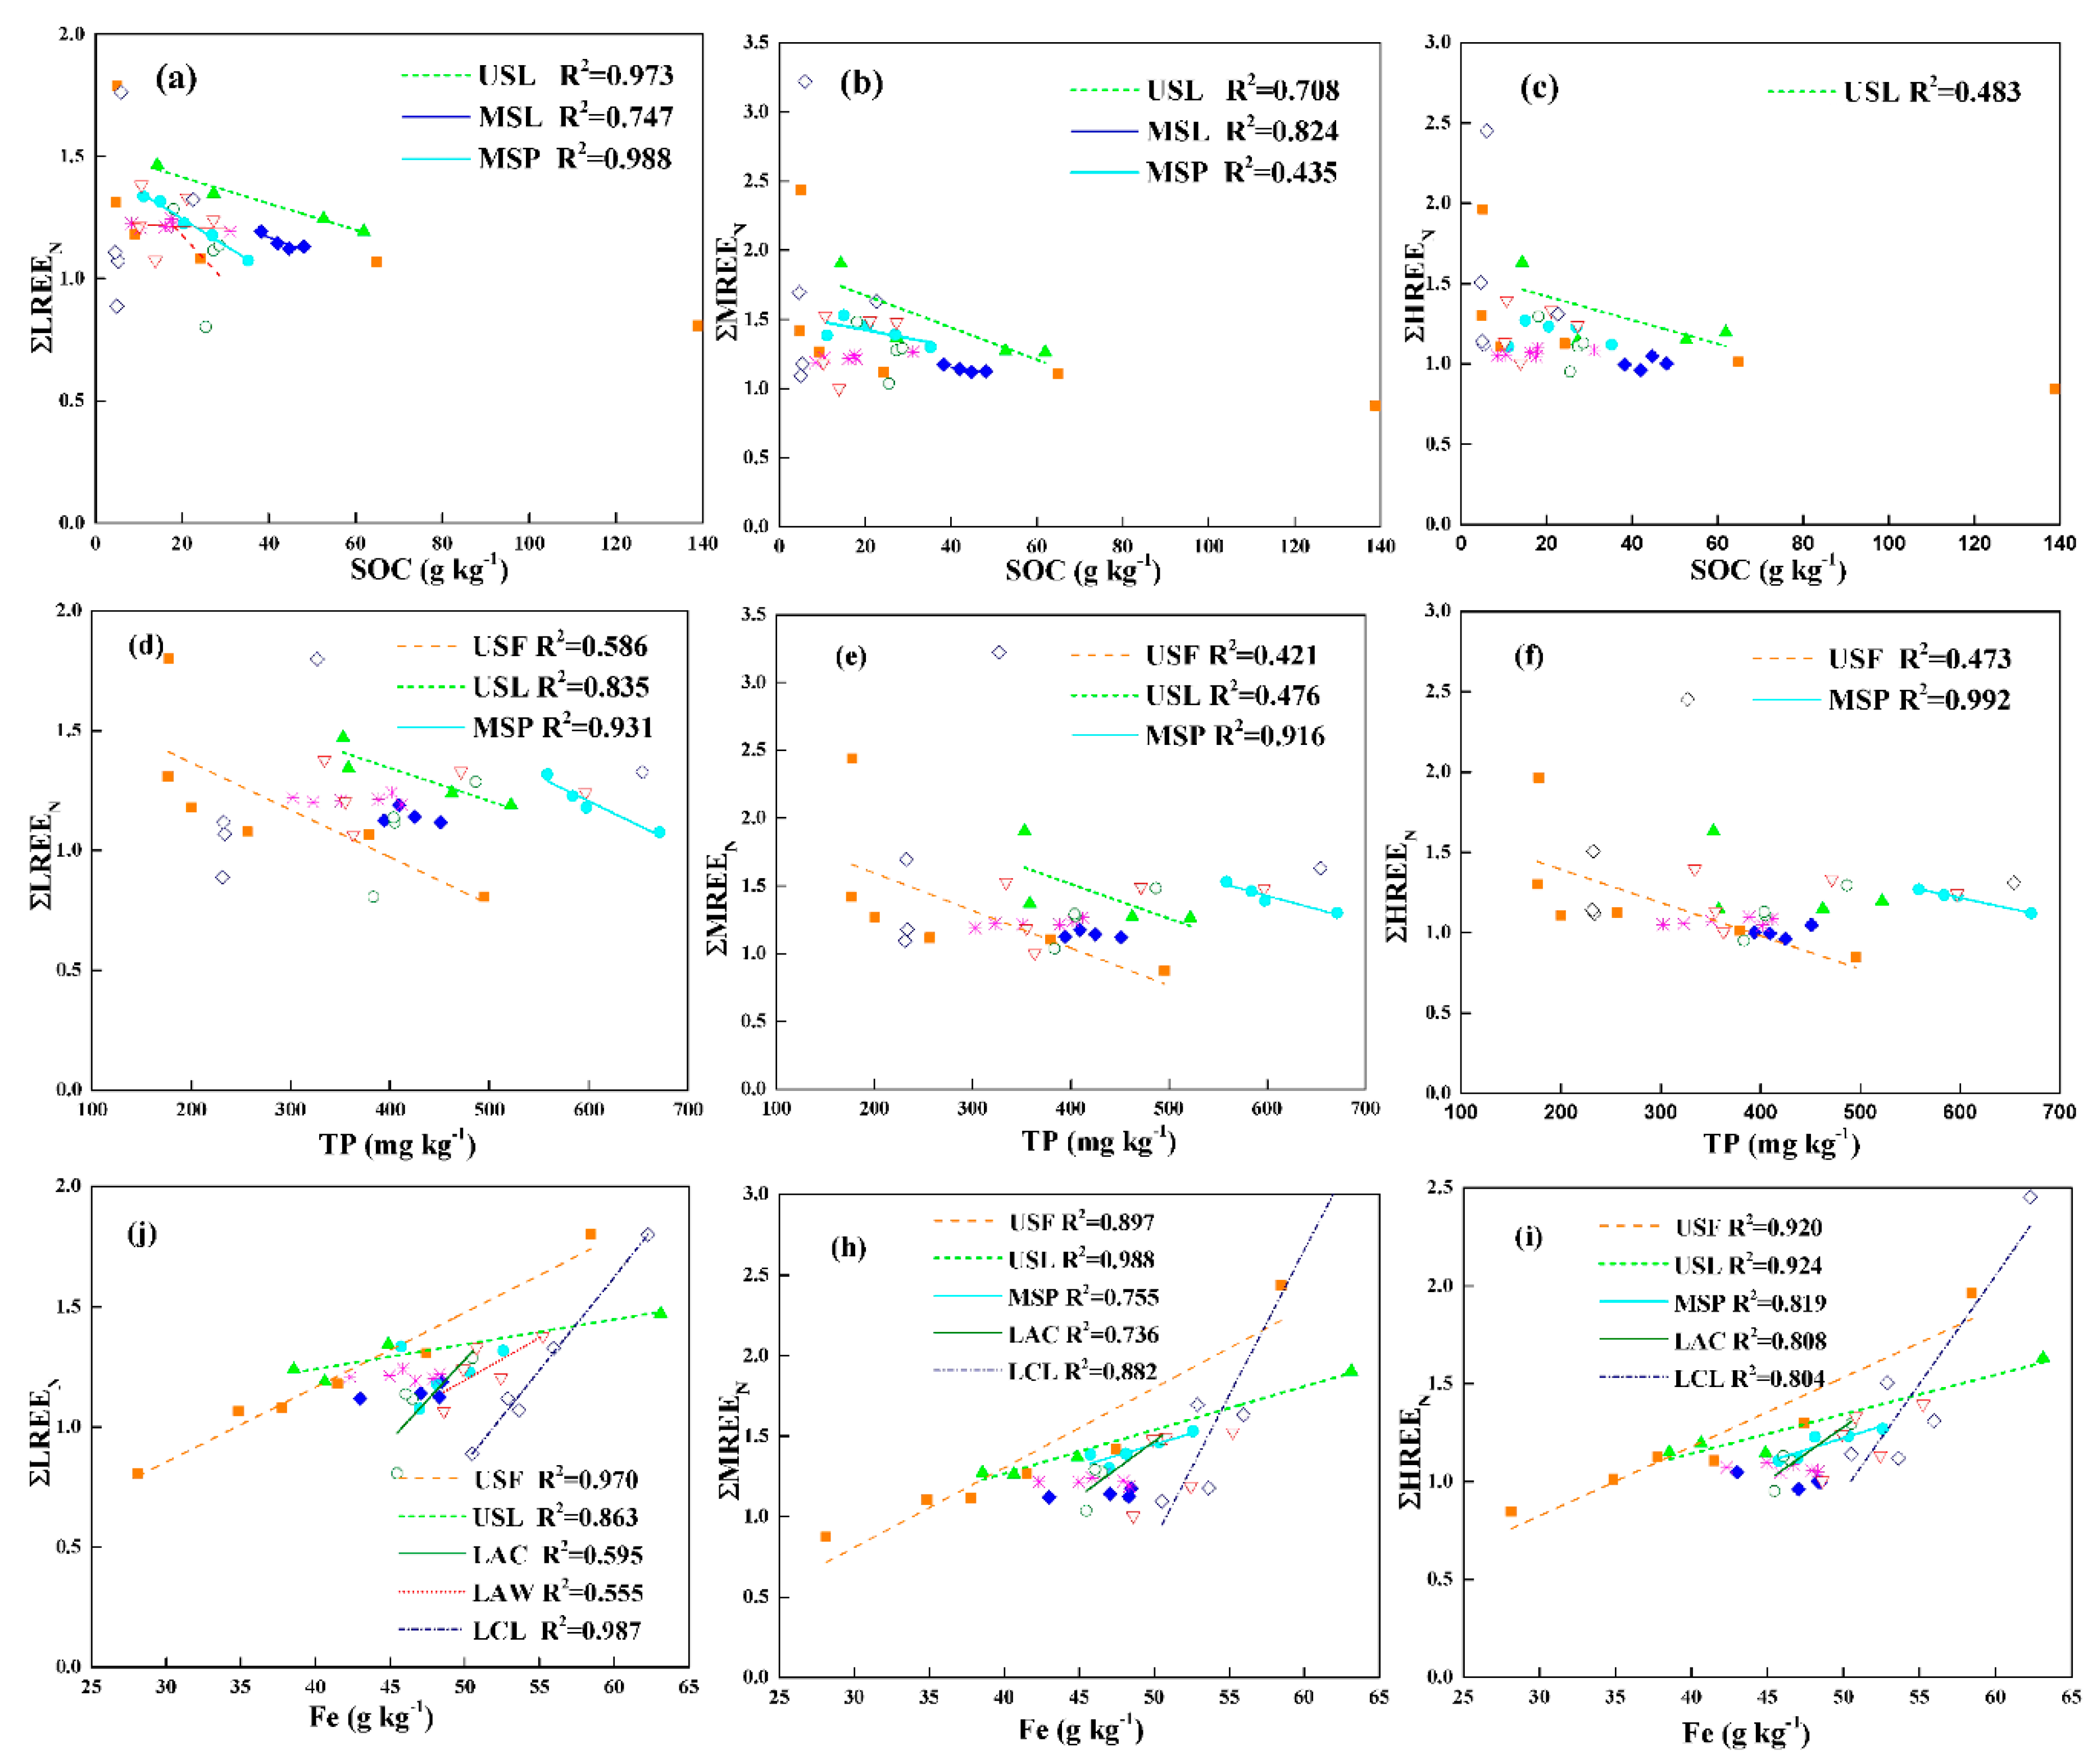
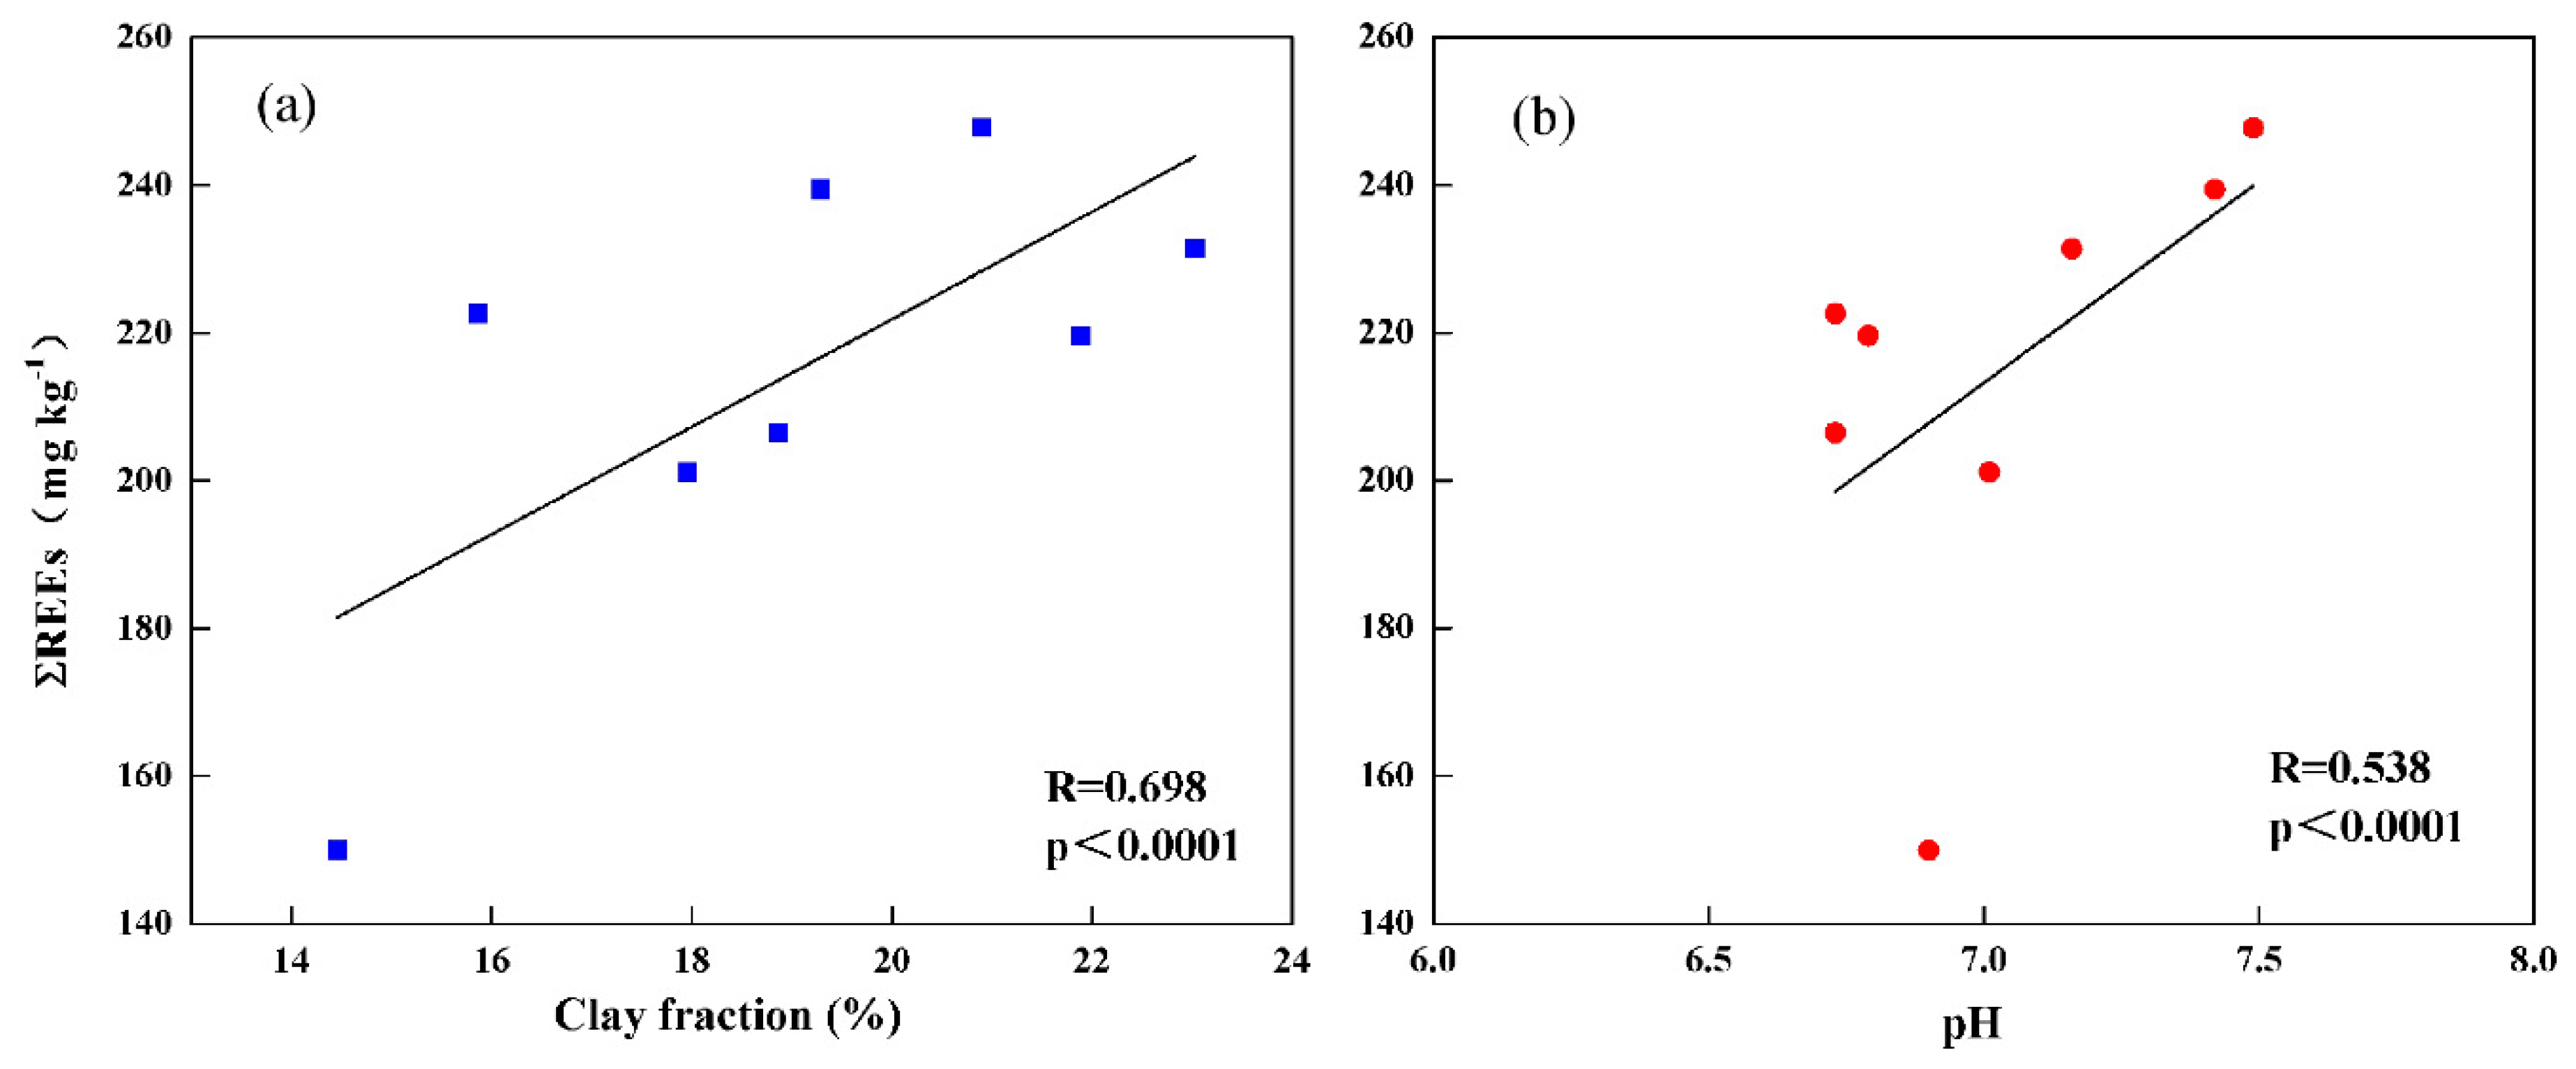
3.4. Influencing Factors for the REEs

In general, soil properties such as clay minerals, organic matter, Fe content, carbonate, and pH play key roles for the distribution of REEs. The REEs in studied soils revealed significant relations between SOC, TP, Fe content (Figure 4) and clay content, pH (Figure 5). The relations to the carbonate content were not significant, because the carbonate content was low and played a less important role to influence REEs [7]. The data of soil physical/chemical properties of eight soil profiles are shown in Table A2.

3.4.1. Clay Content

One main factor that influences REEs distributions in soils is clay minerals, which can adsorb the REEs [2]. The percentage of clay content was ranged from 13.2% to 24.6% in eight soil profiles, and the values increased first and then decreased as the increase of depth. Generally, REEs content increase with decreasing particle size and with increasing proportion of clay content [39,40]. In the present study, the regression analysis showed that ΣREEs tended to increase with increasing clay fraction in surface soils, and the linear relationships are observed in Figure 5a. The relations to the clay content in deep soils were not obvious. The percentage of clay content was low in the studied soils and the clay minerals could only partly explain the REEs behavior.

3.4.2. Soil pH

Soil pH also contributes to the adsorption of REEs. The pH in eight soil profiles revealed weak acid to weak alkaline and the values ranged from 6.63 to 7.67. Figure 4b shows that soil pH was positively associated with ΣREEs in the surface soils. The reason may be that soil organic matters and soil particles in surface layer have more negatively charged at high pH, and dissolved REEs ions can easily adsorb on negatively charged groups [41]. Cao et al. [42] revealed that the bond strengths between REEs and organic complex were greater with increasing of soil pH. The relationships between pH and REEs contents in deep soils were not significant, because the influencing factors on REEs behavior in the deeper soil were more complicated.

3.4.3. SOC

Soil organic matter plays an important role in the adsorption and migration of REEs in ecosystems [9,10]. The SOC contents in topsoil tends to decrease in the following order: secondary forest > shrub land > grassland > abandoned cropland > cropland, and SOC content decreases as the decreasing slope positions as follows: upper slope > middle slope >lower slope (Table A2). The SOC contents were the highest in secondary forest soils, because the surface soils were covered by plant residues such as leaves and branches, and the original soil contains substantial humus, plant roots, and debris. The SOC contents in soil profiles were in the range of 4.58–138.8 g kg−1, and the contents decreased with increasing soil depth for each profile, and the most obvious variation trends were observed in the upper 0–30 cm.
The regression analysis between REEs and SOC are further detailed, and the linear relationships are observed in Figure 4a–c. The results show that SOC was negatively associated with ΣREEN (PAAS-normalized patterns), and ΣREEs content decreased with increasing content of SOC. The relationships between ΣLREEN, ΣMREEN, ΣHREEN and SOC exhibited similar linear relation, and the closer relationships were observed in secondary forest and shrub land. SOC contents in these types of land were higher than that in other land-use soils indicating that SOC played a significant role in controlling REEs distribution. REEs can form complexes with organic ligands, which enhances the solubility and leaching from organic rich soil profiles. Wu et al. [9] also reported that soil organic matter with some negatively charged groups had higher capacity to adsorb divalent and trivalent cations.
The linear relationships between SOC and ΣLREEN, ΣMREEN were more significant than that of ΣHREEN, which was related to the formation of REE-organic complexes. Soil organic matter can form complexes or chelates with REEs, and REEs patterns depend on different organic binding sites and competitive cations. Davranche et al. identified that lighter REEs were inclined to be complexed by carboxylic groups, and higher REEs were inclined to be complexed by (carboxy-) phenolic groups [43]. Öhlander et al. [44] observed that REEs-organic complexes formed by LREEs and organic matter are more stable than the HREEs.

3.4.4. TP

This paper also discussed relationship between REEs and TP. REEs can change the adsorption of ions on soil particle surfaces, and alter the cation exchange capacity in soils, thus affect availability of nutrients in soil such as phosphate [45,46]. TP contents were in the range of 177–671 mg kg−1, and TP contents were the highest in surface soils under different land-use types and decreased as the increasing depth. The regression analysis between TP and ΣLREEN, ΣMREEN, ΣHREEN are depicted in Figure 4d–f. The negative linear relationships were observed between TP and ΣREEN, and the linear relationships were better in secondary forest and shrub land than other type lands, and TP revealed more significant relations with ΣLREEN than ΣMREEN and ΣHREEN. The transport mechanism of REEs complexation by phosphate was similar to REEs-organic complexes [47].

3.4.5. Fe

Another important factor influencing REEs distributions is the adsorption of REEs onto sesquioxides such as Fe oxides. Mihajlovic et al. [7] reported that REEs contents increased with the increase of Fe content blow 500 mol kg−1, then REEs content tended to decrease with further increase of Fe content in soil profiles. Fe contents in the studied soils ranged from 28.1 to 62.3 g kg−1, and the contents in most land-use type soils decreased with the increasing depth, and Fe contents in surface soils tends to decrease in the following order: lower slope > middle slope >upper slope.
The regression analysis between ΣREEN and Fe contents are shown in Figure 4j–i. REEs contents increased with the increasing Fe content, and the linear relationships were well in most soil profiles. Fe content exhibited more significant relations with ΣHREEN, ΣMREEN than that of ΣLREEN, which might be related to adsorption of amorphous or crystalline Fe oxides. Grawunder et al. [48] observed that a preferential bonding occurred between higher REEs and a crystalline Fe oxides, and stronger bonding between lighter REEs and amorphous Fe oxides.

3.5. Implication for the Transportation of Soil REEs

Soils in the studied systems were classified by land-use types to research transportation of soil REEs. Different types of land-use and land-cover affect soil weathering processes, and further influence soil physical/chemical properties. Soil organic matters are produced by decomposition of plant litter, which are closely related to land-use and land-cover. SOC and Fe contents showed better linear relationships with REEs, and organic matter and Fe oxides in soils made significant contributions to influence the transportation of soil REEs. The REEs contents in soil layers were not mainly from bedrock, and might be significantly related to chemical weathering, pedogenesis, and soil transportation. Although the REEs contents in fertilizer we collected were not detected, REEs contents in cropland surface soils were highest among different land-use types. REEs distribution pattern provided theoretical basis for managers to make strategic decisions in agricultural productivity, which is advantageous to the environmental sustainability in Karst Critical Zone Observatory.

4. Conclusions

This study demonstrates the distribution, fractionation and influencing factors of REEs in eight soil profiles at the Puding Karst Critical Zone Observatory and the conclusions are summarized as follows.
(1)
The ΣREEs contents in most soils were higher than the local soil background value. The ΣREEs contents in bedrock was much lower than the level of soil layers, indicating that REEs distribution in studied soils were not mainly from bedrock.
(2)
The ΣREEs contents in surface soils of lower slopes sites (LGL, LAC, LAW, LCL) were higher than that of middle and upper slope sites, and the highest contents were observed in cropland (LGL). It might be related to farming activities long ago, or the nature soil erosion and movement of carriers from upper land.
(3)
The shale-normalized REEs pattern in soils showed MREEs significant enriched relative to LREEs and HREEs, and HREE enrichment relative to LREE. A positive Ce anomaly was found in soils, which might be related to the redox condition.
(4)
The clay content, pH, SOC, TP and Fe content are the main factors influencing the distribution of REEs in study areas, and SOC and Fe content showed the better linear relationship with REEs.

Author Contributions

Conceptualization, G.H., and Q.Z.; methodology, Q.Z. and M.L; formal analysis, Q.Z. and M.L.; writing—original draft preparation, Q.Z.; writing—review and editing, Q.Z., G.H. and L.W.; Project administration, G.H.; Supervision, G.H.

Funding

This work was funded by National Natural Science Foundation of China (No. 41661144029; 41325010).

Conflicts of Interest

The authors declare no conflict of interest.

Appendix A

Table A1. Reference concentrations of REEs.
LaCePrNdSmEuGdTbDyHoErTmYbLu
Arithmetic mean a (g kg−1)41.295.58.0830.56.131.175.470.795.291.123.240.453.120.45
Standard deviation13.547.33.6111.92.510.5212.210.3611.9310.3851.0860.1260.9170.124
a Background values of Guizhou soil [26].
Table A2. Soil physical/chemical properties of eight soil profiles.
Sampling SitesDepth (cm)SOC (g kg−1)Fe (g kg−1)pHClay Fraction(%)TP (mg kg−1)Carbonate (%)
USF01399.66.9014.54950.65
1564.825.17.1616.63790.22
2524.22.47.2618.52560.37
409.221.67.5720.52000.36
604.731.37.6318.11760.49
805.051.57.5713.21780.13
USL061.966.7315.95223.32
1552.65.27.0113.44632.67
2527.33.16.9916.13581.85
4014.31.67.3412.73531.26
MSL048.14.16.7318.93943.38
1538.34.16.9417.94093.14
2542.04.57.1319.64252.81
4044.74.47.1916.54512.04
MSP035.24.17.0118.06711.31
1527.03.57.1717.65980.74
2520.52.77.3016.55840.46
4015.02.57.3316.25590.76
6011.12.47.4016.64180.25
LGL031.13.86.7921.94122.72
1517.62.76.6621.44021.19
2517.92.66.6620.23890.86
4016.12.66.3821.93510.89
6010.52.26.3619.33230.97
808.382.16.4718.33020.69
LAC018.12.67.4219.34871.42
1525.52.97.7521.13831.46
2527.33.27.6718.74051.61
4028.63.37.5817.74041.12
LAW027.33.57.1623.05970.99
1521.12.97.3524.64720.43
2513.92.47.5221.43631.08
4010.22.27.4021.13551.44
6010.61.97.3923.23340.21
LCL022.63.27.4920.96541.32
155.331.87.3920.62340.05
254.941.87.5120.02310.25
404.581.77.3419.22330.67
605.961.87.2518.73270.61

References

  1. Henderson, P. Rare Earth Element Geochemistry: Developments in Geochemistry; Elsevier: Amsterdam, The Netherlands, 1984; Volume 2, p. 510. [Google Scholar]
  2. Laveuf, C.; Cornu, S. A review on the potentiality of rare earth elements to trace pedogenetic processes. Geoderma 2009, 154, 1–12. [Google Scholar] [CrossRef]
  3. Mao, L.J.; Mo, D.W.; Yang, J.H.; Shi, C.X. Geochemistry of trace and rare earth elements in red soils from the Dongting lake area and its environmental significance. Pedosphere 2009, 19, 615–622. [Google Scholar] [CrossRef]
  4. Taylor, S.R.; McLennan, S.M. The Continental Crust: Its Composition and Evolution; Blackwell: Oxford, UK, 1985; p. 312. [Google Scholar]
  5. Tyler, G. Rare earth elements in soil and plant systems—A review. Plant Soil 2004, 267, 191–206. [Google Scholar] [CrossRef]
  6. Aubert, D.; Stille, P.; Probst, A.; Gauthier-Lafaye, F.; Pourcelot, L.; Del Nero, M. Characterization and migration of atmospheric REE in soils and surface waters. Geochim. Cosmochim. Acta 2002, 66, 3339–3350. [Google Scholar] [CrossRef] [Green Version]
  7. Mihajlovic, J.; Rinklebe, J. Rare earth elements in German soils—A review. Chemosphere 2018, 205, 514–523. [Google Scholar] [CrossRef]
  8. Galán, E.; Fernández-Caliani, J.C.; Miras, A.; Aparicio, P.; Márquez, M.G. Residenceand fractionation of rare earth elements during kaolinization of alkaline peraluminous granites in NW Spain. Clay Miner. 2007, 42, 341–352. [Google Scholar] [CrossRef]
  9. Wu, Z.; Jun, L.; Guo, H.; Wang, X.; Yang, C. Adsorption isotherms of lanthanum to soil constituents and effects of pH, EDTA and fulvic acid on adsorption of lanthanum onto goethite and humic acid. Chem. Speciat. Bioavailab. 2001, 13, 75–81. [Google Scholar] [Green Version]
  10. Tang, J.; Johannesson, K.H. Speciation of rare earth elements in natural terrestrial waters: Assessing the role of dissolved organic matter from the modeling approach. Geochim. Cosmochim. Acta 2003, 67, 2321–2339. [Google Scholar] [CrossRef]
  11. Thomas, P.J.; Carpenter, D.; Boutin, C.; Allison, J.E. Rare earth elements (REEs): Effects on germination and growth of selected crop and native plant species. Chemosphere 2014, 96, 57–66. [Google Scholar] [CrossRef]
  12. Wang, L.; Liang, T. Geochemical fractions of rare earth elements in soil around a mine tailing in Baotou, China. Sci. Rep. 2015, 5, 12483. [Google Scholar] [CrossRef] [Green Version]
  13. Kulaksız, S.; Bau, M. Rare earth elements in the Rhine River, Germany: First case of anthropogenic lanthanum as a dissolved microcontaminant in the hydrosphere. Environ. Int. 2011, 37, 973–979. [Google Scholar] [CrossRef]
  14. Germund, T.; Tommy, O. Rare earth elements in forest-floor herbs as related to soil conditions and mineral nutrition. Biol. Trace Elem. Res. 2005, 106, 177–191. [Google Scholar]
  15. Hu, Z.; Haneklaus, S.; Sparovek, G.; Schnug, E. Rare earth elements in soils. Commun. Soil Sci. Plant Anal. 2006, 37, 1381–1420. [Google Scholar] [CrossRef]
  16. Volokh, A.A.; Gorbunov, A.V.; Gundorina, S.F.; Revich, B.A.; Frontasyeva, M.V.; Pal, C.S. Phosphorus-fertilizer production as a source of rare-earth elements pollution of the environment. Sci. Total Environ. 1990, 95, 141–148. [Google Scholar] [CrossRef]
  17. Yuan, D. Sensitivity of karst process to environmental change along the PEP II transect. Quat. Int. 1997, 37, 105–113. [Google Scholar] [CrossRef]
  18. Zhao, M.; Zeng, C.; Liu, Z.; Wang, S. Effect of different land use/land cover on karst hydrogeochemistry: A paired catchment study of Chenqi and Dengzhanhe, Puding, Guizhou, SW China. J. Hydrol. 2010, 388, 121–130. [Google Scholar] [CrossRef]
  19. Parise, M.; Waele, J.D.; Gutierrez, F. Current perspectives on the environmental impacts and hazards in karst. Environ. Geol. 2009, 58, 235–237. [Google Scholar] [CrossRef]
  20. Jianchu, X.; Fox, J.; Vogler, J.B.; Yongshou, Z.P.F.; Lixin, Y.; Jie, Q.; Leisz, S. Land-Use and Land-Cover Change and Farmer Vulnerability in Xishuangbanna Prefecture in Southwestern China. Environ. Manag. 2005, 36, 404–413. [Google Scholar] [CrossRef]
  21. Lambin, E.F.; Turner, B.L.; Geist, H.J.; Agbola, S.B.; Angelsen, A.; Bruce, J.W.; Coomes, O.T.; Dirzo, R.; Fischer, G.; Folke, C.; et al. The causes of land-use and land-cover change: Moving beyond the myths. Glob. Environ. Chang. 2001, 11, 261–269. [Google Scholar] [CrossRef]
  22. Han, G.; Song, Z.; Tang, Y. Geochemistry of rare earth elements in soils under different land uses in a typical karst area, Guizhou Province, Southwest China. Can. J. Soil Sci. 2017, 97, 606–612. [Google Scholar] [CrossRef]
  23. Han, G.; Li, F.; Tang, Y. Organic matter impact on distribution of rare earth elements in soil under different land uses. CLEAN–Soil Air Water 2017, 45, 1600235. [Google Scholar] [CrossRef]
  24. Liu, M.; Han, G.; Zhang, Q.; Song, Z. Variations and indications of δ 13C SOC and δ 15N SON in soil profiles in Karst Critical Zone Observatory (CZO), southwest China. Sustainability 2019, 11, 2144. [Google Scholar] [CrossRef]
  25. Liu, M.; Han, G.; Li, Z.; Liu, T.; Yang, X.; Wu, Y.; Song, Z. Effects of slope position and land use on the stability of aggregate-associated organic carbon in calcareous soils. Acta Geochim. 2017, 36, 456–461. [Google Scholar] [CrossRef]
  26. Chinese Environmental Monitoring Station. Background Values of Element in Soil of China; Chinese Environmental Science Press: Beijing, China, 1990; pp. 418–451. [Google Scholar]
  27. Midwood, A.J.; Boutton, T.W. Soil carbonate decomposition by acid has little effect on δ 13C of organic matter. Soil Biol. Biochem. 1998, 30, 1301–1307. [Google Scholar] [CrossRef]
  28. Peng, H.; Xiao, H.; Wu, J.; Su, Y.; Li, X.; Tang, G. An indirect method for determination of soil total carbonate. Soils 2006, 38, 477–482. [Google Scholar]
  29. Zhang, Q.; Han, G.; Liu, M.; Liang, T. Spatial distribution and controlling factors of heavy metals in soils from Puding Karst Critical Zone Observatory, southwest China. Environ. Earth Sci. 2019, 78, 279. [Google Scholar] [CrossRef]
  30. McLennan, S. Rare earth elements in sedimentary rocks; influence of provenance and sedimentary processes. Rev. Mineral. Geochem. 1989, 21, 169–200. [Google Scholar]
  31. Sholkovitz, E.R.; Landing, W.M.; Lewis, B.L. Ocean particle chemistry: The fractionation of rare earth elements between suspended particles and seawater. Geochim. Cosmochim. Acta 1994, 58, 1567–1579. [Google Scholar] [CrossRef]
  32. Han, G.; Xu, Z.; Tang, Y.; Zhang, G. Rare Earth Element Patterns in the Karst Terrains of Guizhou Province, China: Implication for Water/Particle Interaction. Aquat. Geochem. 2009, 15, 457–484. [Google Scholar] [CrossRef]
  33. Song, Z. Weathering and Pedogenesis of Karst Catchment, Behavior of Mineral Elements and Environmental Quality; Institute of Geochemistry, Chinese Academy of Sciences Press: Guizhou, China, 2006. [Google Scholar]
  34. Duddy, L.R. Redistribution and fractionation of rare-earth and other elements in a weathering profile. Chem. Geol. 1980, 30, 363–381. [Google Scholar] [CrossRef]
  35. Wayne Nesbitt, H.; Markovics, G. Weathering of granodioritic crust, long-term storage of elements in weathering profiles, and petrogenesis of siliciclastic sediments. Geochim. Cosmochim. Acta 1997, 61, 1653–1670. [Google Scholar] [CrossRef]
  36. Li, J.; Zhu, L.; Chen, Y. Rare earth element distribution in weathering crusts of carbonte rocks, Guizhou Province. Carsol. Sin. 1998, 17, 15–24. [Google Scholar]
  37. Tang, J.; Johannesson, K.H. Ligand extraction of rare earth elements from aquifer sediments: Implications for rare earth element complexation with organic matter in natural waters. Geochim. Cosmochim. Acta 2010, 74, 6690–6705. [Google Scholar] [CrossRef]
  38. Chen, B.; Wei, H.; Huang, Z.; Zhou, Y. Cerium Anomalies in Supergene Geological Bodies and Its Effecting Factors. Chin. Rare Earths 2007, 28, 79–83. [Google Scholar]
  39. Rao, W.; Tan, H.; Jiang, S.; Chen, J. Trace element and REE geochemistry of fine- and coarse-grained sands in the Ordos deserts and links with sediments in surrounding areas. Geochemistry 2011, 71, 155–170. [Google Scholar] [CrossRef]
  40. Kimoto, A.; Nearing, M.A.; Zhang, X.C.; Powell, D.M. Applicability of rare earth element oxides as a sediment tracer for coarse-textured soils. Catena 2006, 65, 214–221. [Google Scholar] [CrossRef]
  41. Yamasaki, S.; Tsumura, A. Adsorption and Desorption of Exogenous Rare Earth Elements in Soils: I. Rate and Forms of Rare Earth Elements Sorbed. Pedosphere 1993, 3, 299–308. [Google Scholar]
  42. Cao, X.; Chen, Y.; Wang, X.; Deng, X. Effects of redox potential and pH value on the release of rare earth elements from soil. Chemosphere 2001, 44, 655–661. [Google Scholar] [CrossRef]
  43. Davranche, M.; Gruau, G.; Dia, A.; Marsac, R.; Pédrot, M.; Pourret, O. Biogeochemical Factors Affecting Rare Earth Element Distribution in Shallow Wetland Groundwater. Aquat. Geochem. 2015, 21, 197–215. [Google Scholar] [CrossRef]
  44. Öhlander, B.; Land, M.; Ingri, J.; Widerlund, A. Mobility of rare earth elements during weathering of till in northern Sweden. Appl. Geochem. 1996, 11, 93–99. [Google Scholar] [CrossRef]
  45. Xu, X.K. Research advances in the behavior and fate of rare earth elements in soil-plant systems. J. Agro-Environ. Sci. 2005, 24 (Suppl. 1), 315–319. [Google Scholar]
  46. Liang, T.; Song, W.; Wang, L.; Kleinman, P.J.A.; Cao, H. Interactions between exogenous rare earth elements and phosphorus leaching in packed soil columns. Pedosphere 2010, 20, 616–622. [Google Scholar] [CrossRef]
  47. Byrne, R.H.; Liu, X.W.; Schjf, J. The influence of phosphate coprecipitation on rare earth distributions in natural waters. Geochim. Cosmochim. Acta 1996, 60, 3341–3346. [Google Scholar] [CrossRef]
  48. Grawunder, A.; Lonschinski, M.; Merten, D.; Büchel, G. Distribution and bonding of residual contamination in glacial sediments at the former uranium mining leaching heap of Gessen/Thuringia, Germany. Chem. der Erde 2009, 69 (Suppl. 2), 5–19. [Google Scholar] [CrossRef]
Figure 1. Distribution of land-use types and sampling sites in Guizhou province, Southwest China.
Sustainability 11 04963 g001
Figure 2. Distribution of ΣREEs with depth in soil profiles from different slope positions. (a) upper and middle slope sites (USF, USL, MSL, MSP); (b) lower slopes sites (LGL, LAC, LAW, LCL).
Sustainability 11 04963 g002
Figure 3. Fractionation patterns of REEs (PAAS-normalized) in soil profiles, background soil, and bedrock. BV: the background values of Guizhou soil [26].
Sustainability 11 04963 g003
Figure 4. Relationships between ΣLREEN, ΣMREEN, ΣHREEN and SOC, TP, and Fe content in soils with different land uses. p < 0.05 for (ac), and p < 0.005 for (df), and p < 0.001 for (ji).
Sustainability 11 04963 g004
Figure 5. Relationships between ΣREEs and clay fraction and pH. (a) Regression analysis between ΣREEs and clay fraction; (b) Regression analysis between ΣREEs and pH.
Sustainability 11 04963 g005
Table 1. Description of eight sampling sites in study area.
Sampling SiteSlope PositionLand-Use TypesElevation (m)Land-Use Description
USFUpper slopeSecondary forest land1442The virgin forest land had been deforested and evolved to secondary forest land for over 50 years
USLUpper slopeShrub land1425Natural evolution
MSLMiddle slopeShrub land1404Natural evolution
MSPMiddle slopeShrub land1385The pear orchard land had been abandoned and evolved to shrub land for over eight years
LGLLower slopeGrassland1376The cropland had been abandoned and evolved to grassland for five years
LACLower slopeAbandoned cropland1335The cropland had been abandoned and covered by weed. for two years
LAWLower slopeAbandoned cropland1333The cropland had been abandoned for two years
LCLLower slopeCropland1335The crop rotation and ploughed fallow had been for more than 50 years, and manure and fertilizer had been used
Table 2. Characteristic parameters of REEs in profile soils.
Sampling SitesDepth (cm)ΣREEs (mg kg−1)(La/Yb)N(La/Gd)N(Gd/Yb)NδCe
USF01451.020.971.050.90
151971.150.981.180.96
252000.860.900.971.12
402181.080.821.321.17
602420.960.801.211.20
803401.020.691.480.92
USL02230.990.851.171.13
152281.060.881.201.16
252471.180.811.451.27
402790.960.681.421.00
MSL02071.230.931.321.13
152171.340.941.421.10
252091.370.931.481.11
402061.440.961.501.06
MSP02011.050.791.330.98
152201.030.801.290.99
252291.100.801.370.99
402451.210.821.470.96
602451.380.881.571.08
LGL02201.180.871.371.10
152271.300.901.451.14
252231.090.901.221.13
402221.160.891.301.14
602211.180.861.371.18
802231.180.891.331.22
LAC02391.050.791.321.04
151520.900.721.261.01
252081.060.811.311.04
402111.050.801.321.04
LAW02311.120.761.471.08
152471.020.781.311.16
251950.880.801.101.64
402210.970.791.241.60
602560.960.761.271.35
LCL02481.150.721.591.04
151990.940.761.241.39
251680.800.800.991.07
402150.770.601.291.04
60352.0.760.451.690.91
bedrock 8.051.770.901.980.75
BV 2030.970.921.061.20

