Article

Effect of Underground Coal Mining on the Regional Soil Organic Carbon Pool in Farmland in a Mining Subsidence Area

1
Institute of Land Science, College of Resources and Environment, Shanxi Agricultural University, Taigu 030801, China
2
College of Territorial Resources and Tourism, Anhui Normal University, Wuhu 241003, China
*
Authors to whom correspondence should be addressed.
Sustainability 2019, 11(18), 4961; https://doi.org/10.3390/su11184961
Submission received: 20 June 2019 / Revised: 2 September 2019 / Accepted: 4 September 2019 / Published: 11 September 2019
(This article belongs to the Section Environmental Sustainability and Applications)

Abstract

:
The soil organic carbon (SOC) pool in farmland is changing rapidly due to human activities, thereby greatly affecting the regional and global environment, as well as influencing soil fertility and crop yields. The present study investigated the effects of underground coal mining on the regional SOC pool in farmland in the Jiuli Mining Area of Xuzhou City in China as a typical coal mining region based on field sampling, chemical analysis, model construction, and spatial analysis using the software of ArcGIS. The results showed that in the mining subsidence area, spatial variations in the SOC content and soil bulk density were mainly caused by structural factors (mining subsidence, subsidence waterlogging, and other structural factors due to coal mining) at a regional scale. SOC storage in farmland soil decreased sharply in non-waterlogged subsidence farmland and seasonally waterlogged subsidence farmland in the areas with mining, whereas the SOC storage increased in waterlogged wetland after coal mining. The SOC was reduced by 102,882 tonnes (32.81%) compared with the original SOC stock as a consequence of coal mining, and thus the effect of underground coal mining on the regional SOC pool in farmland was characterized as a carbon loss process. Land-use changes, soil degradation and erosion contributed almost equally to the carbon loss process in the study area. The results of this study may facilitate evaluations of low-carbon land reclamation and ecological compensation in mining areas.

1. Introduction

In China, coal production was 3.45 × 10⁹ tonnes in 2017, which accounted for 45.6% of the total world coal production [1]. Coal mining and especially underground coal mining has destroyed a huge number of land resources, and most of the coal-mining subsidence land is farmland [2], including agricultural regions in the North China Plain, Northeast China Plain, and middle and lower Yangtze River Plain. About 200 km2 of the agricultural area was affected by subsidence annually in China [3].
Underground coal mining also has a negative effect on the soil quality of farmland. For example, Raj K selected three types of soil to investigate the changes of soil physical and chemical properties after coal mining, and found that soil texture, soil organic matter, pH, and soil bulk density of all soils obviously degrade after mining subsidence in Ohio in United States [4]; Silburn studied soil quality in the farmland from the different mining areas in the Eastern Oklahoma area and found that soil bulk density, soil water retention, soil texture and soil saturated hydraulic conductivity all changed to a certain extent after mining subsidence [5]. Moreover, coal mining not only degrades the soil quality, but also change the soil organic carbon (SOC) pool of farmland, which greatly affects the regional and global environment, as well as changing the soil fertility and crop yields [6,7,8,9]. Maharaj et al. [10] found that mining could reduce soil carbon stocks by removing vegetation and topsoil, permanently changing the topography and geological structures, and disrupting the surface and subsurface hydrological regime. Brye [11] and Hetrick et al. [12] found that the soil microbial community was reduced greatly by the removal of topsoil and the dumping of coal tailings waste onto the soil surface, thereby eventually decreasing the soil carbon pool. Meng et al. [13] and Izaurralde [14] showed that mining destroys the surface ground and underground runoff, worsens soil erosion, and decreases biodiversity to cause soil carbon losses. Lal [15] suggested that mining can accentuate CO2 emissions via the mineralization of SOC due to soil disturbances.
The SOC pool in farmland is potentially the most important factor related to the reduction of carbon emissions in the terrestrial ecosystem [16,17], and it also plays a very important role in increasing food production and maintaining its stability. Therefore, it is necessary to quantify the effects of coal mining on the SOC pool of farmland in China and other major coal-producing countries throughout the world.
Unfortunately, the spatial scale of previous underground mining research has been conducted on small experimental plots, and thus the results obtained cannot accurately mean universally because coal mining affects the SOC pool in farmland at a regional spatial scale. In this paper, the large spatial scale Jiuli Mining Subsidence Area in Xuzhou City, China, was selected to study the effects of coal mining on the SOC pool in farmland at the regional scale. The main purposes of this study are building a model used to predict the SOC storage of farmland in the mining subsidence area at a regional scale, and establishing a method used to evaluate the effect of underground coal mining on the regional SOC pool in farmland in a mining subsidence area. We also want to investigate the effects of coal mining on the SOC pool in farmland at the regional scale, and find out its influencing factors. The results of the current study could be used to assess the low-carbon land reclamation and ecological compensation soil nutrient management in mining areas.

2. Materials and Methods

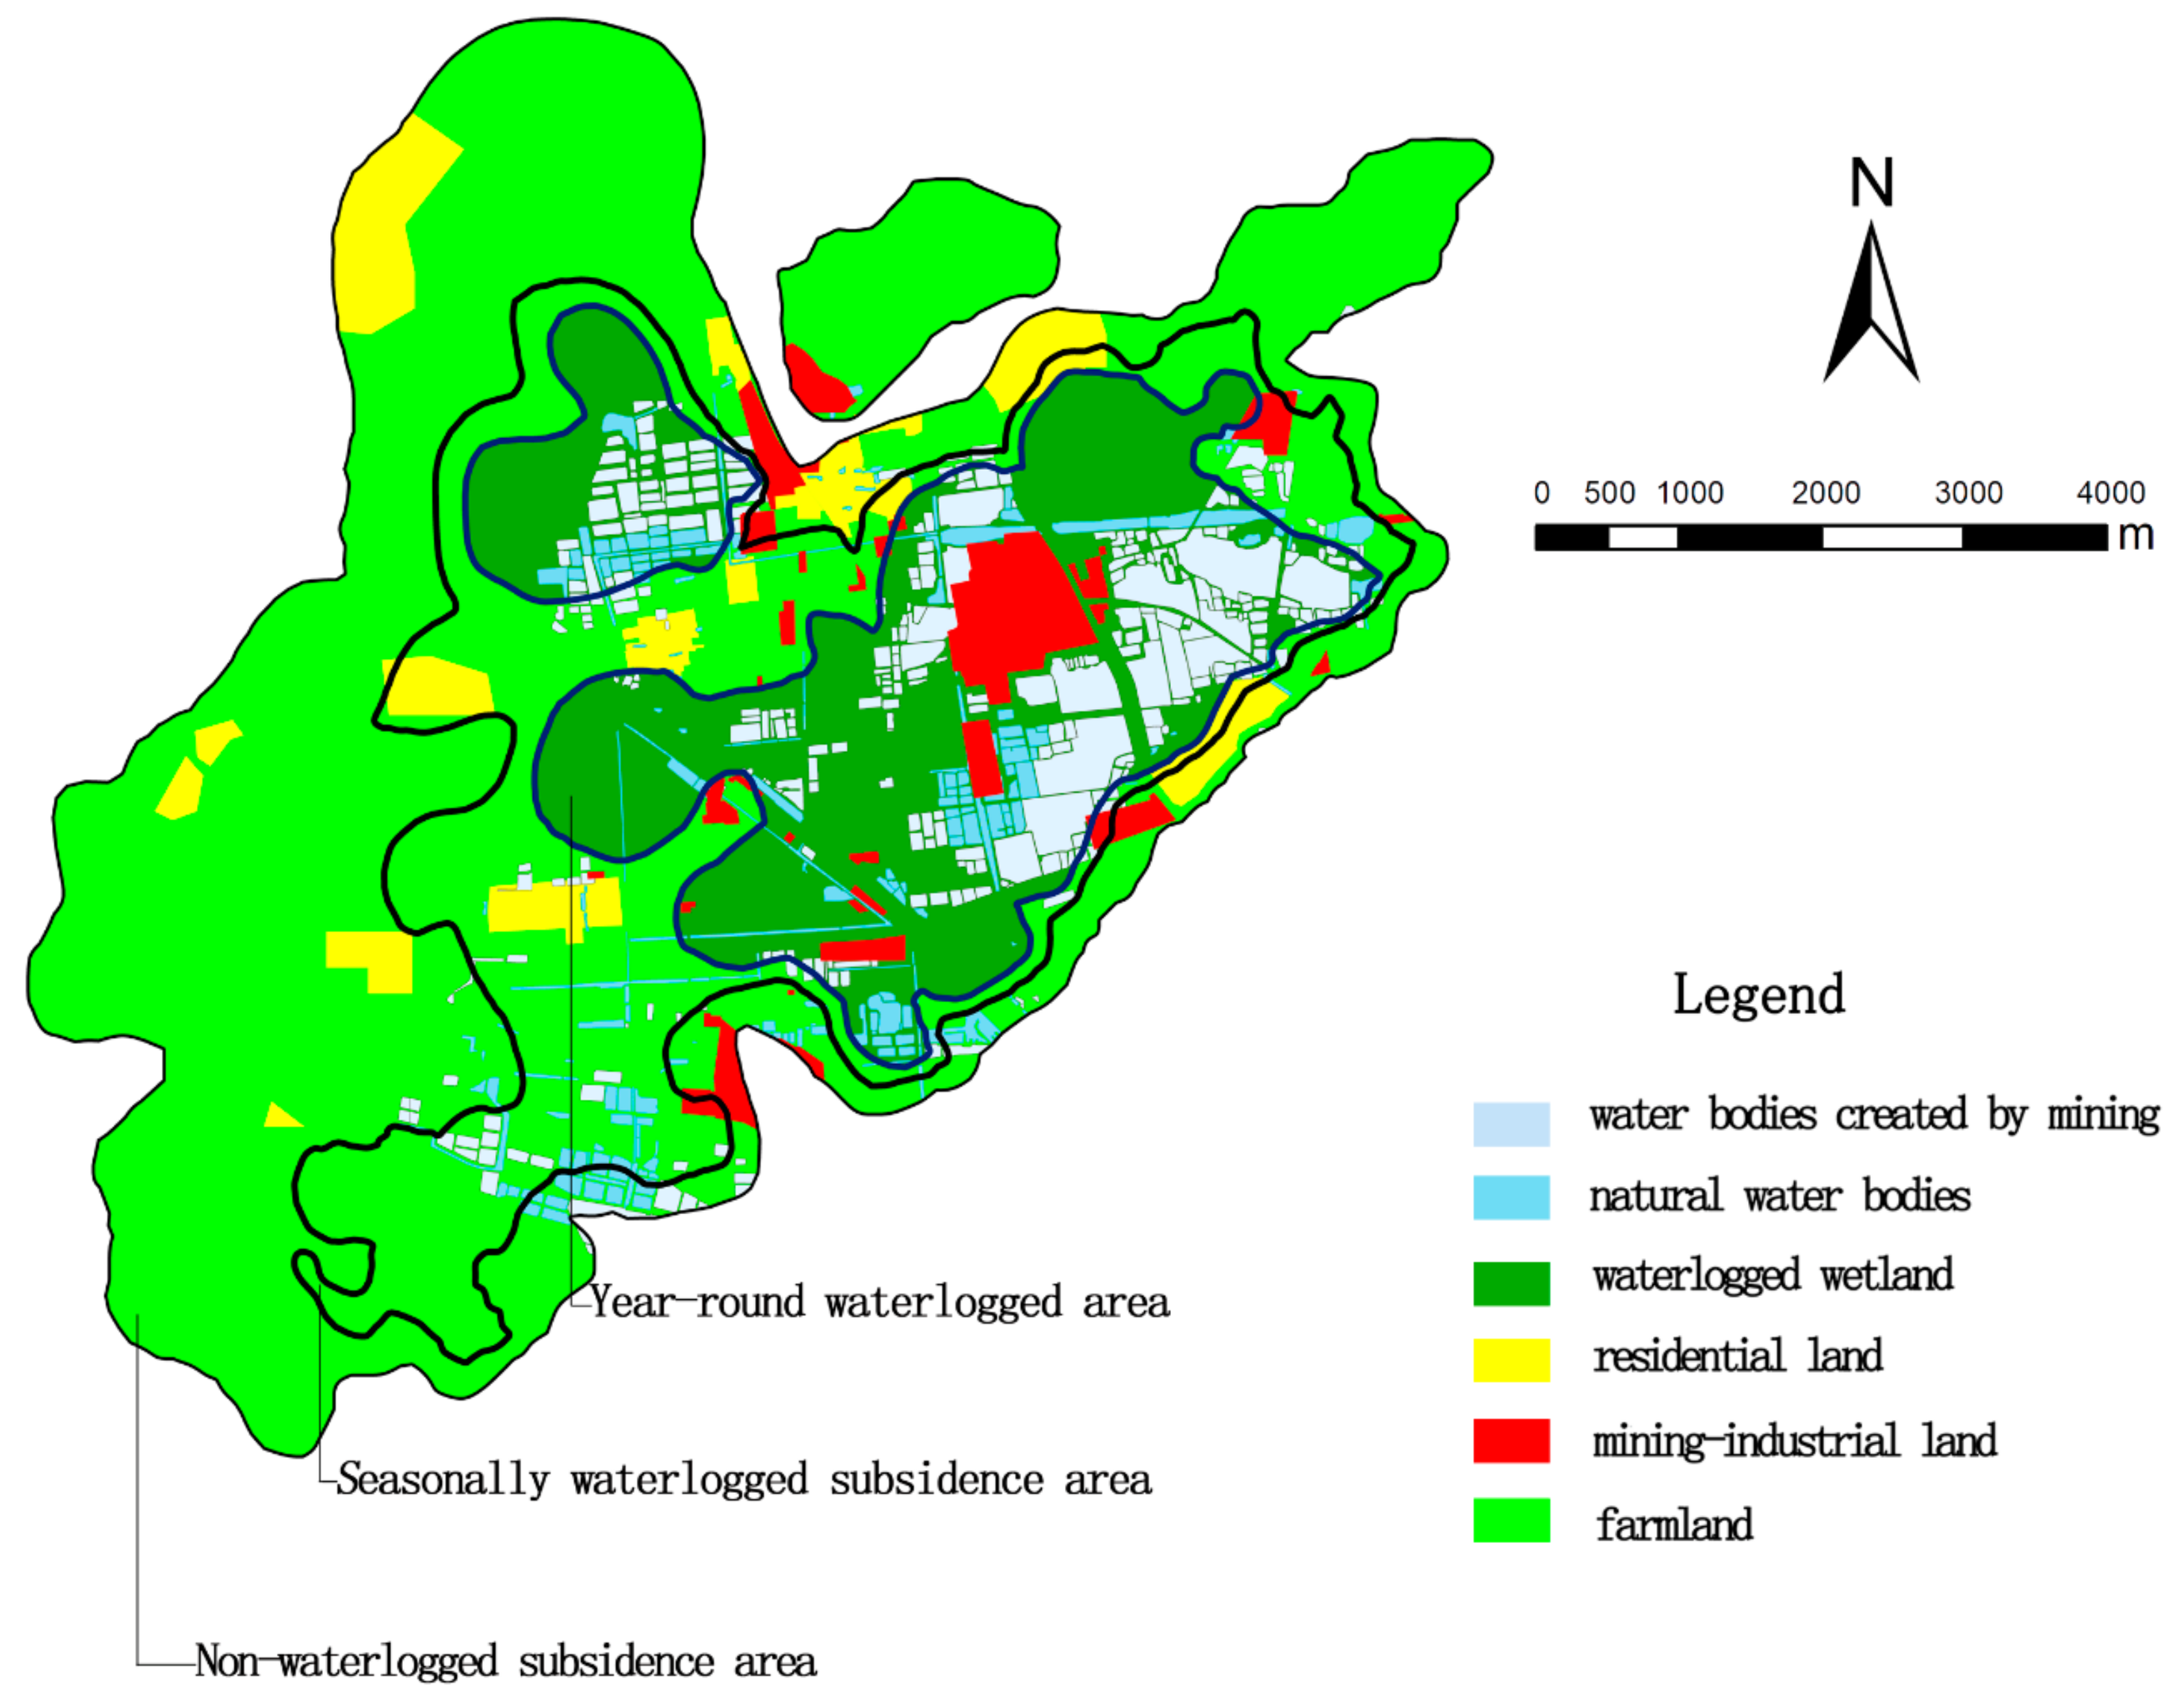
2.1. Description of the Study Area

The Jiuli Mining Subsidence Area (34°13′39″–34°26′16″ N, 117°06′21″–117°12′16″ E) covers an area of 42.15 km2 in Jiuli District, Xuzhou, China (the area mapped with the red line in Figure 1). This coal-mining subsidence area is related to the Jiahe Coal Mine, Pangzhuang Coal, and Zhangxiaolou Coal. The field boundaries of the three mines are shown in Figure 1.
This area has a warm monsoon climate, with an annual average temperature of 14 °C, a mean annual frost-free period of 200 to 220 days, and average annual precipitation of 800 to 930 mm, 56% of which falls in July and August [18]. The area is on a coastal plain with an elevation of 30–44 m above sea level, and the groundwater levels in this area are shallow. Moist soil, paddy soil, and Shajiang black soil are the main soil types in this region [19]. The research area is located in the grain-producing region of eastern China where the agricultural planting is a double-cropping system. Rice or wheat is planted in the summer or winter. The farmland cultivation management system and agricultural technical level are similar throughout the study area.
Underground mining is practiced in the study area, where it is located in the western sector of the Xuzhou anticlinorium where large- and medium-sized faults have developed geologically. Due to the effects of the folded structure, the regional stratigraphic sink has changed the strike and dip direction, and the strata inclination angle is generally 8–20°. Stratigraphic completeness has been destroyed because it has been carved up by faults in the western part of the study area. Sinian, Cambrian, Ordovician, Carboniferous, and Dyasand Quaternary forming deposits are from the pre-Sinian basement. Among these strata, the Carboniferous and Permian deposits are coal-bearing strata, and they are covered by Quaternary alluvium. There are seven mineable coal seams and three of them (Number 2, 7, and 9) are the main excavated coal seams. The coal-bed structure of these coal seams is of simple or low complexity with a stable thickness, and magmatic rocks are not detected [19]. The three mines in the study area extract coal from these three seams using longwall mining technology. Goaf areas are formed after the coal-mining panels have been excavated, which destroys the original stress equilibrium of the subterranean strata. The stress transmitted through the stratum induces inconsistent deformation of the overburden rock above the goaf areas. Mining subsidence problems occur when stress and deformation are transmitted to the land surface. After several decades of mining subsidence, the maximal subsidence is 8300 mm.
Underground coal mining in this area not only caused land subsidence but it was also responsible for a series of eco-environmental problems: (1) a large area of farmland has subsided due to coal mining; (2) some farmland has been transformed into water bodies created by mining subsidence in this area due to the high groundwater level; and (3) the land-use types have changed, such as the conversion of farmland into mining-industrial land, waterlogged wetland, and water bodies created by mining subsidence. Some safety coal pillars are planned to maintain the important structures on the land surface. Before coal mining, the study area was a flat agricultural area, but it changed into a mining-agriculture area after dozens of years (Figure 2). Figure 2 showed that in the study area, 24.86 km2 of farmland has been adversely affected by mining subsidence, 3.26 km2 of farmland has been inundated by water bodies created by mining subsidence, 8.15 km2 of farmland has been changed into waterlogged wetland, and 1.66 km2 of farmland has been occupied by mining-industrial areas after the construction of mining installations and accommodation.

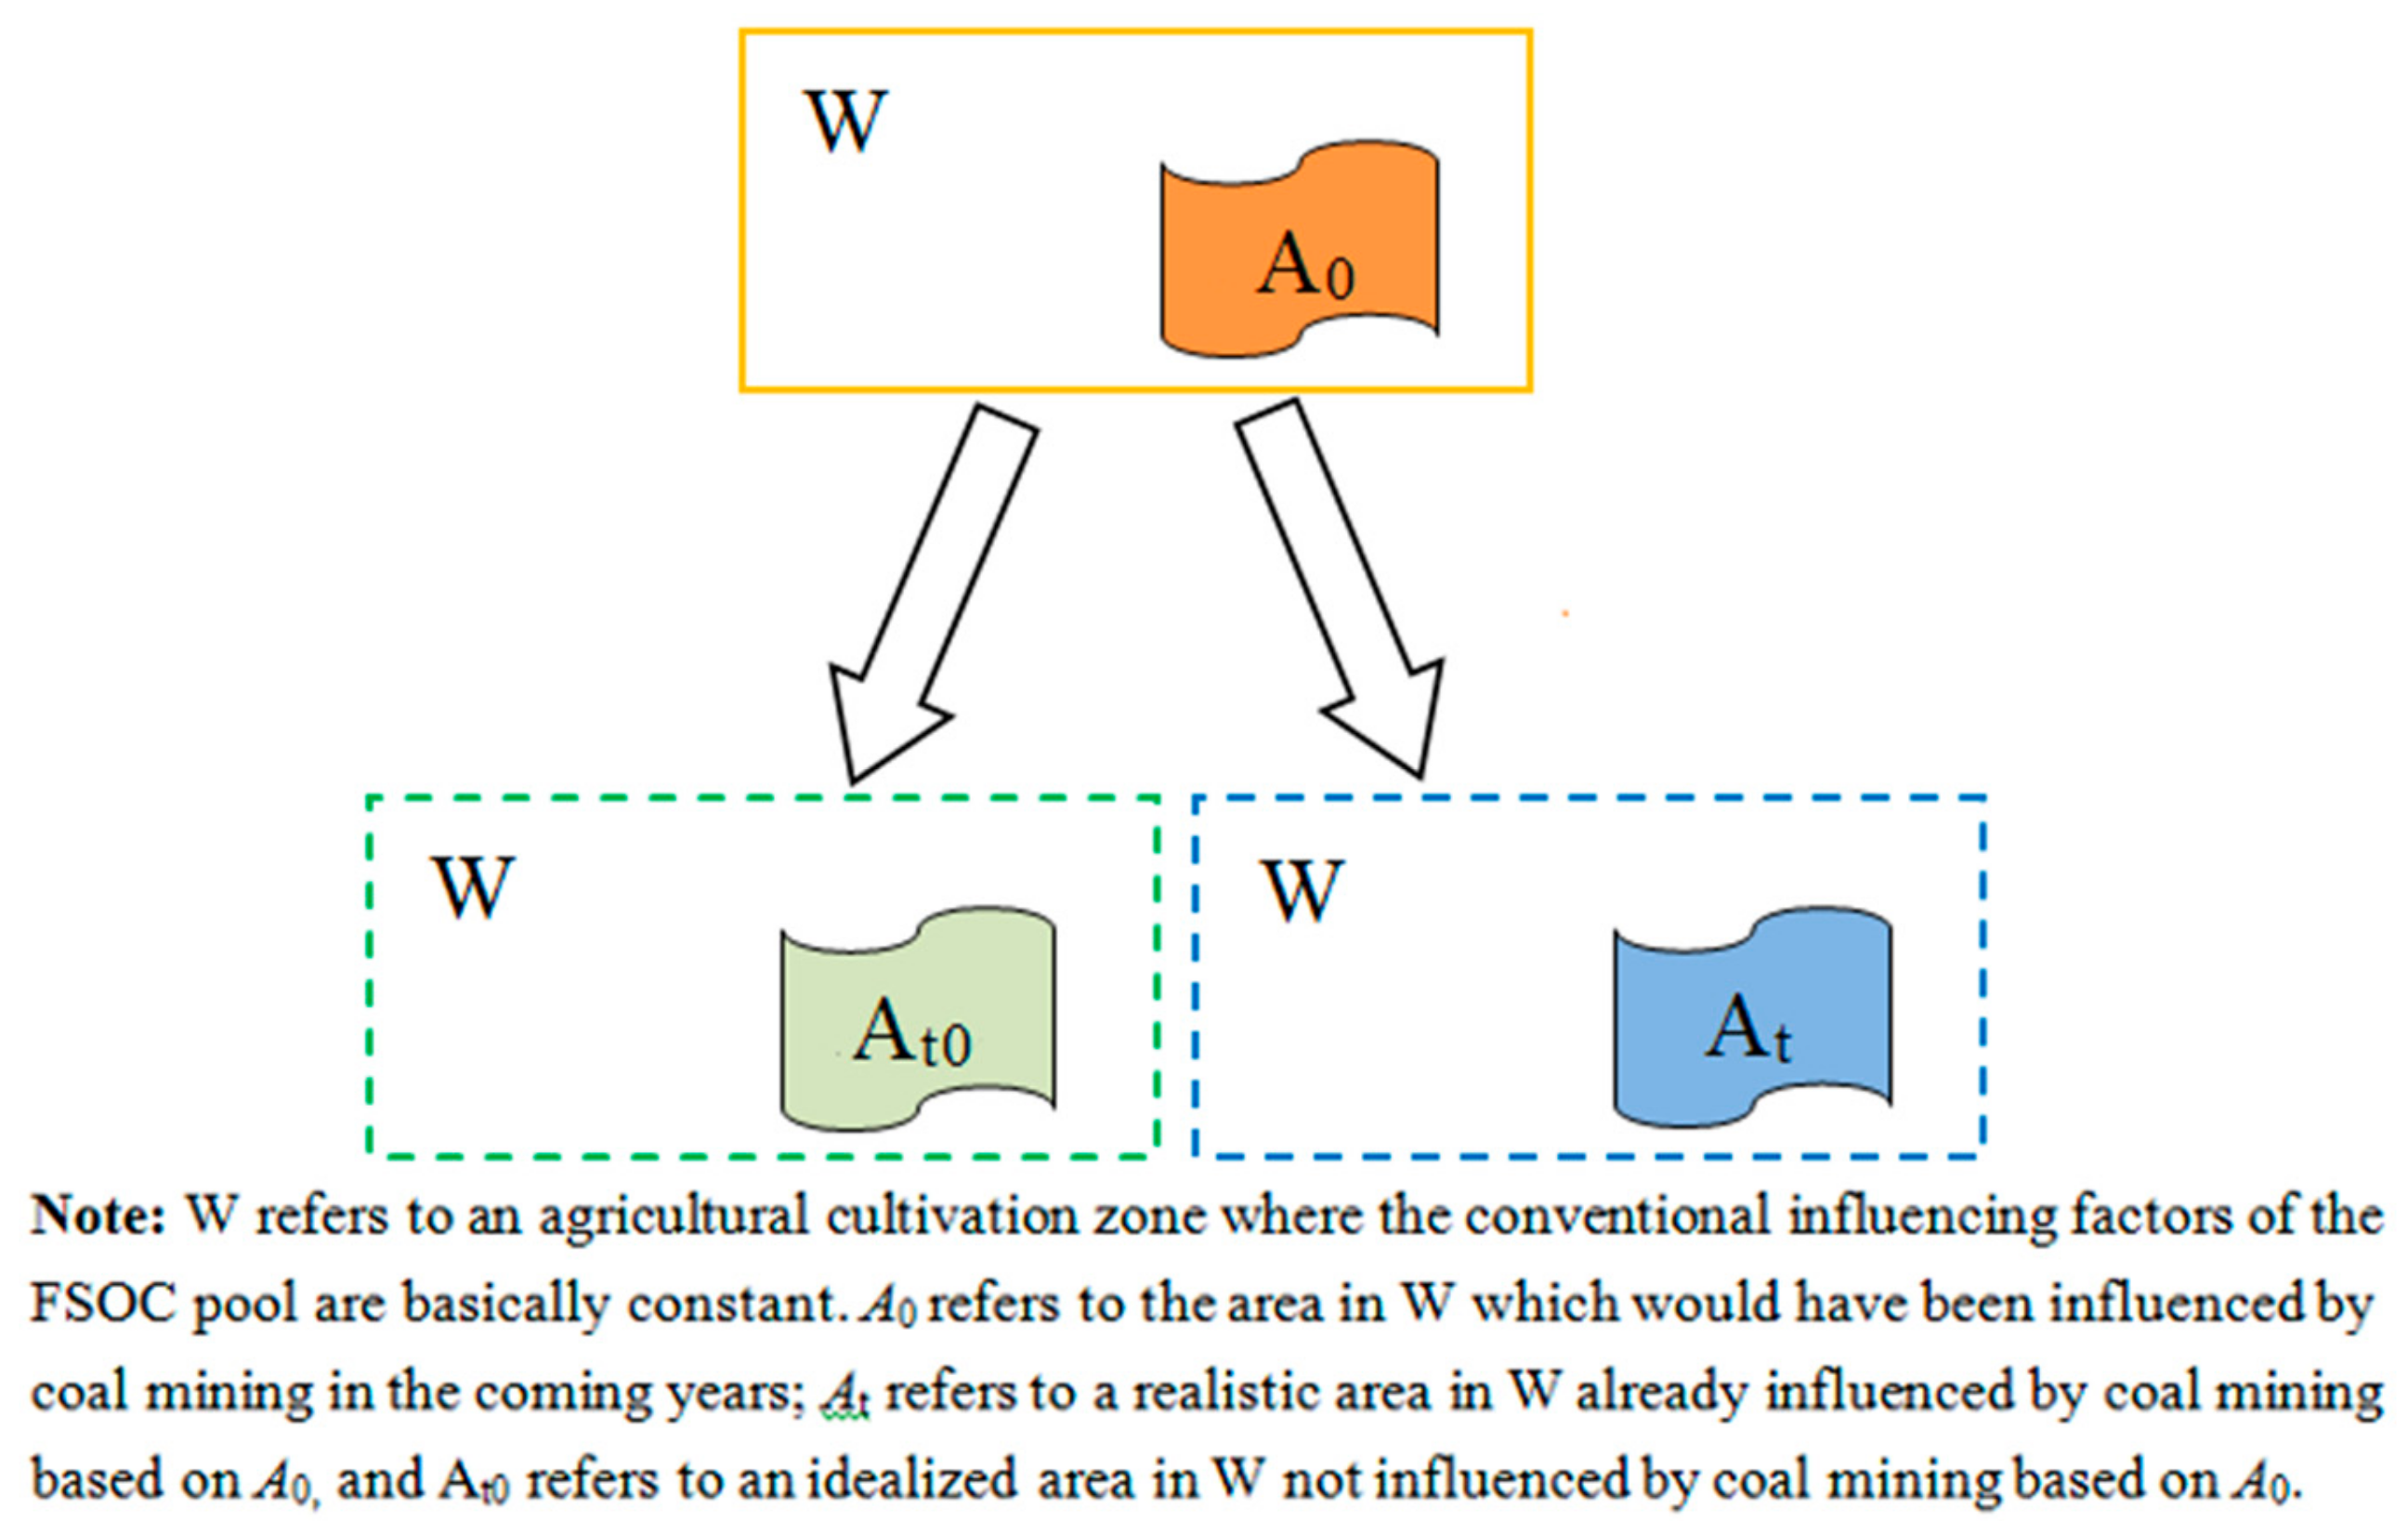
2.2. Method for Evaluating the Effect of Coal Mining on the Soil Organic Carbon (SOC) Pool in Farmland in Jiuli Mining Subsidence Area
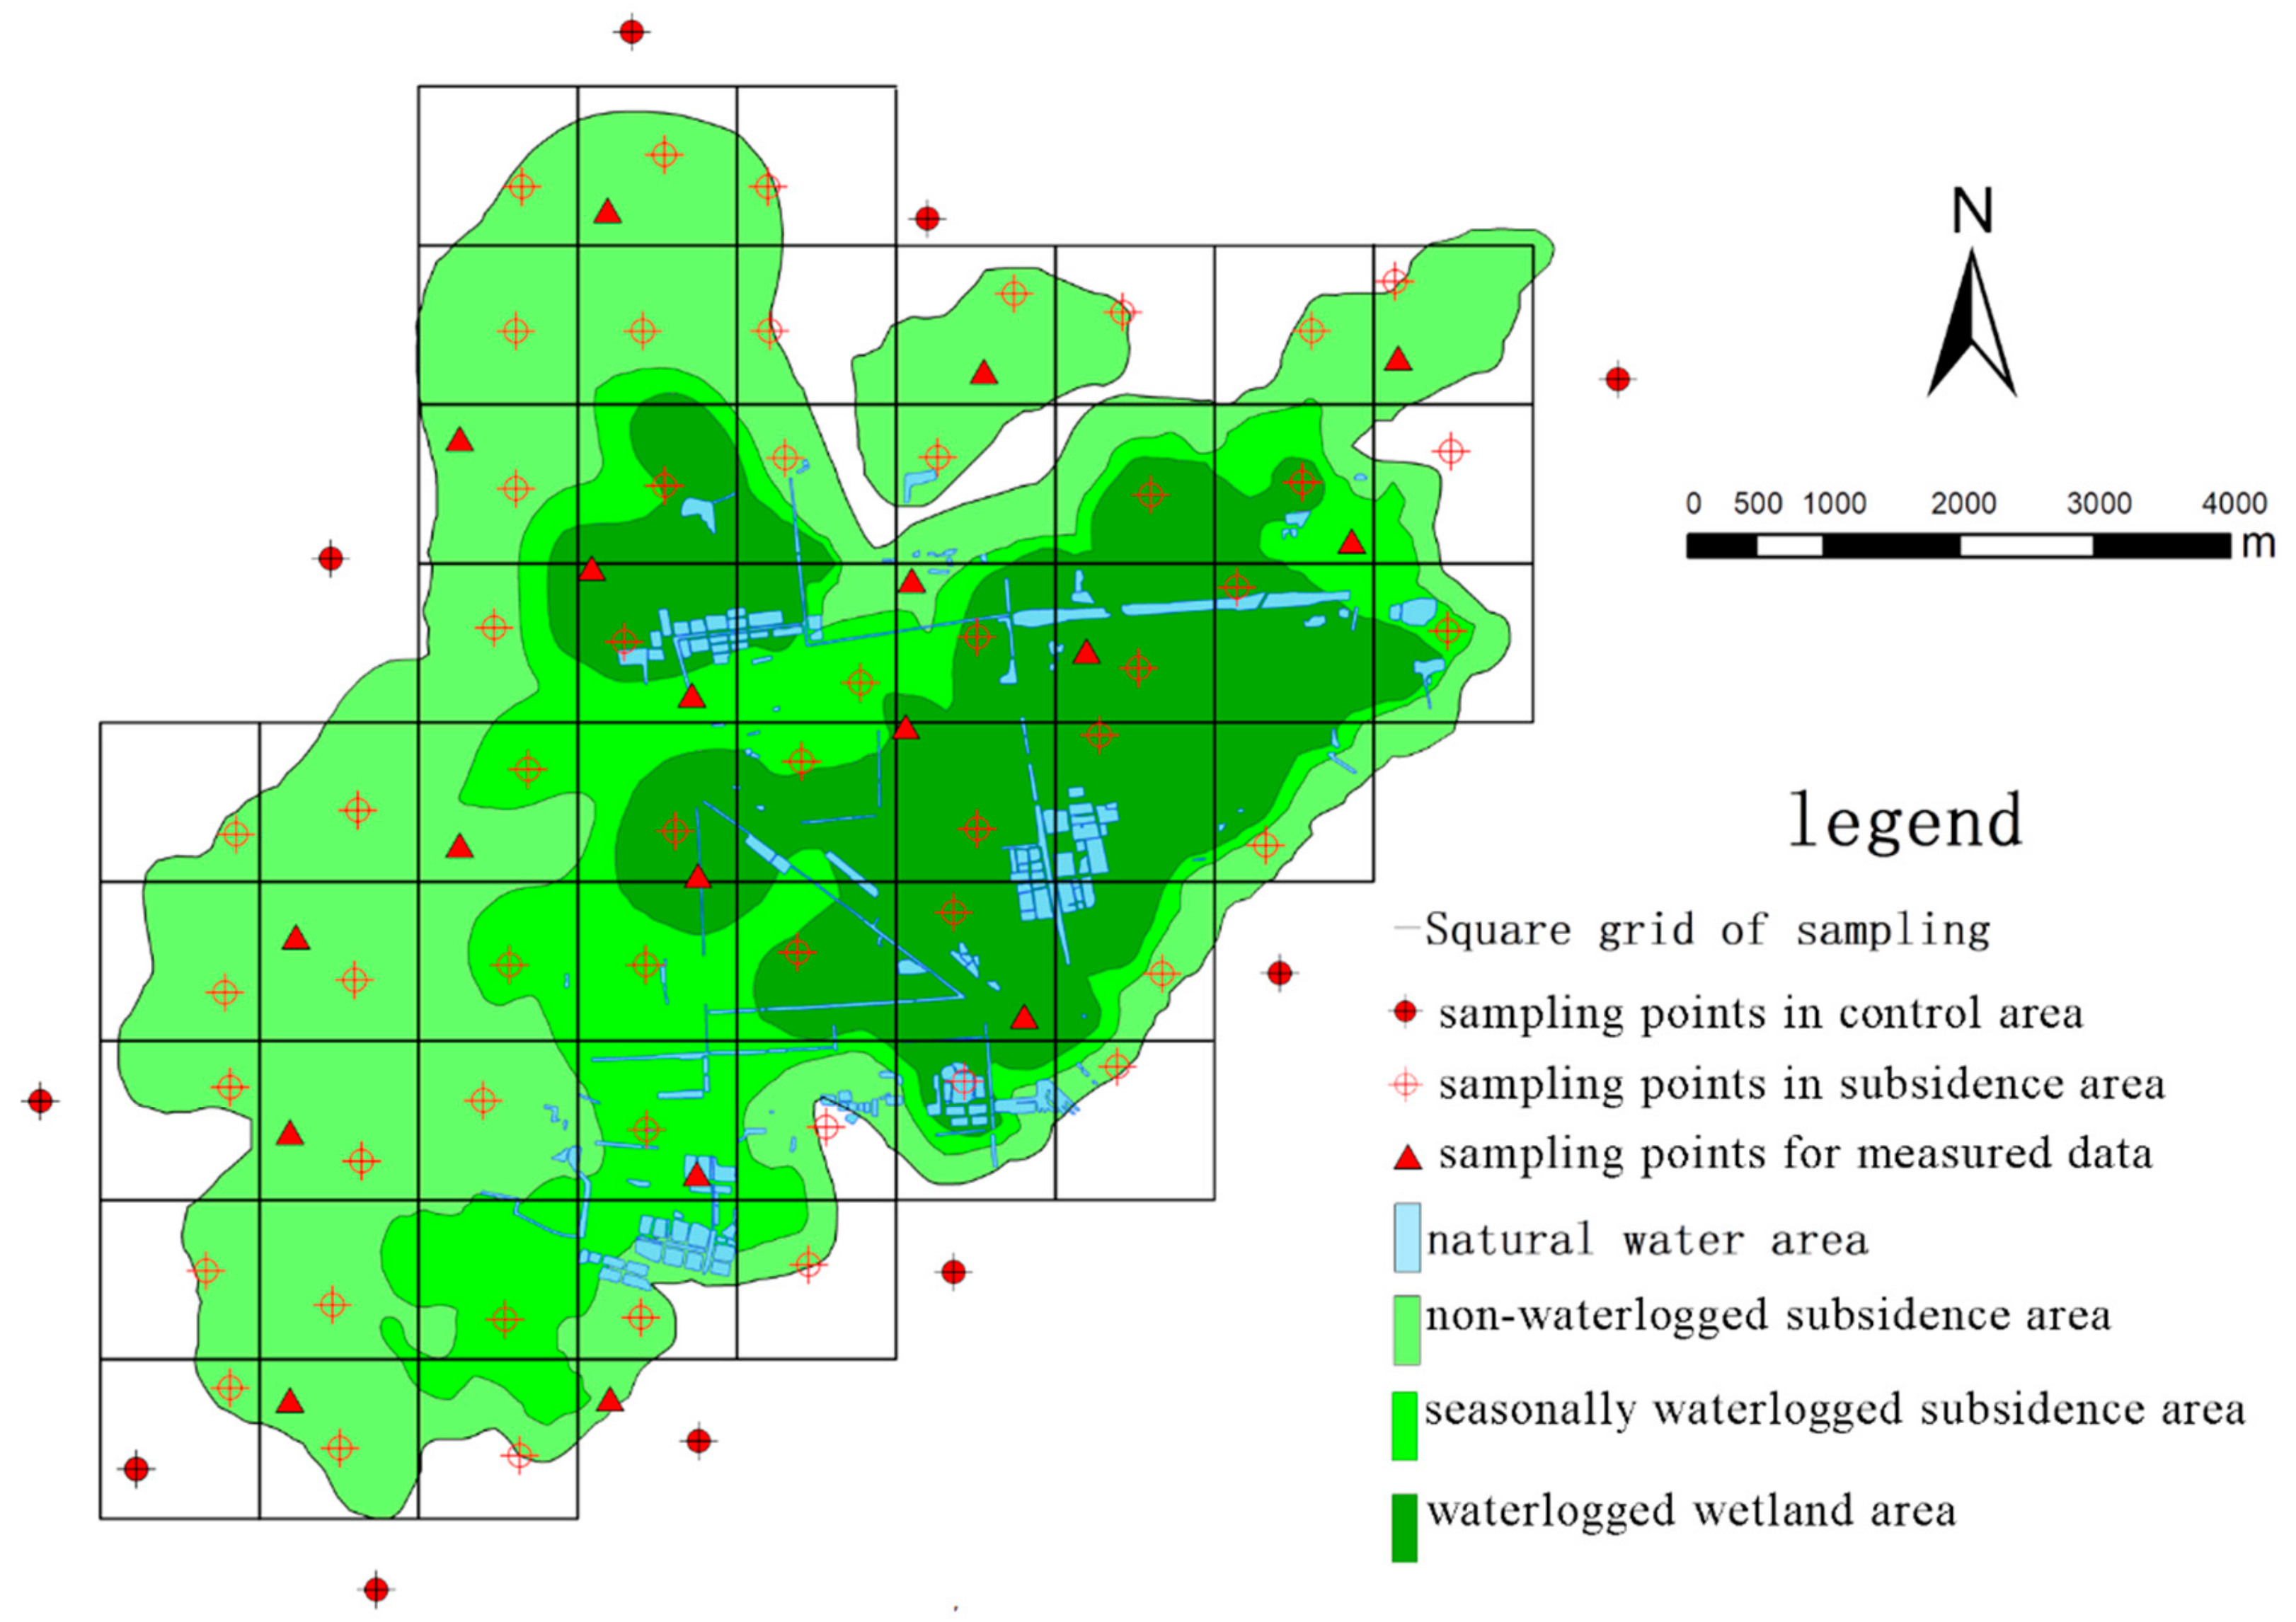
The farmland in the research area belongs to the same agricultural cultivation area, and human mining activity (underground mining) has continued for over 100 years. Therefore, besides the special coal-mining influencing factor, the SOC pool in the study area is also affected by conventional influencing factors such as climate, landforms, soil, farming system, fertilization system, and agricultural technological level. The SOC density in the farmland is similar to that in other SOC pools affected by the same factors [20,21].
Figure 3 presents a schematic diagram illustrating the disturbances caused by coal mining on the regional SOC pool of farmland. It is assumed that the SOC density in zone W without the influence of coal mining or under natural cultivation conditions is maintained at a relatively constant level. Parts of zone A0 in W were changed to zone At or zone At0 by various disturbances, such as coal mining or conventional factors. Therefore, the SOC pool in A0 has changed to become more like the SOC pool in At after dozens of years due to the effects of coal mining and conventional factors under realistic conditions. The SOC pool in A0 could also have changed to become more like the SOC pool in At0 after dozens of years due to the effects of conventional factors under idealized conditions. The SOC density in At0 is homogeneous and it approximates the density in the area around At where no coal mining occurs.
Thus, the effect of coal mining on the SOC pool in farmland in the mining subsidence area, i.e., the differences of SOC in farmland storage in the same agricultural cultivation zone under two situations (with and without the influence of coal mining) after cultivation for dozens of years, can be expressed by the following formula:
ΔSt = SAt − SAt0
where SAt and SAt0 refer to the SOC stored in At and At0, respectively. Therefore, At0 served as the control area in this study.
The most important factor that affects the SOC pool at a regional scale is land-use change [22,23,24]. In Jiuli Mining Area with a high groundwater level, the land use types were markedly different in the subsidence area before and after coal mining. Therefore, the effect of land use change must be considered when calculating the shifts in SOC storage.
The SOC density change in the residential land and natural water bodies was assumed to be 0 tonnes km−2 because these areas never were farmland before and after mining. However, for some land-use types, the carbon density would have changed after mining, including subsided farmland areas, mining-industrial land, waterlogged wetland, and water bodies created by mining subsidence.
The following formulae were used to evaluate the effect of coal mining on soil regional SOC storage in farmland by considering the effect of coal mining on land-use change:
MCE = MCEsf + MCEmi + MCEww + MCEwb
where MCE is the effect of coal mining on carbon storage in the regional SOC pool of farmland, i.e., the difference in SOC storage of farmland within the whole mining subsidence area before and after coal mining; sf, mi, ww, wb is the difference in SOC storage in the subsided farmland region, mining-industrial land, waterlogged wetland areas, and water bodies created by mining subsidence within the mining subsidence area before and after coal mining respectively.

2.3. Sampling

In this study the subsidence area was categorized into non-waterlogged subsidence area, seasonally waterlogged subsidence area, year-round waterlogged area, and natural water bodies (Figure 4).
The method of grid sampling was used in the study area, the grid covered the whole subsidence area, and the number of grids were more than the reasonable or required number of soil samples collected in the subsidence areas.
Reasonable or required sampling number represents the most economical sampling number under certain confidence level and precision. A reasonable or required number of samples may be calculated by the formula N = λ2a,f (S/∆)2 [25,26]. In this formula, N represents the number of reasonable or required samples, λa,f represents characteristic value of t-distribution which can be obtained from the the t-distribution table by the given significance level (a = 1 − PL) and degree of freedom (f = n − 1). S is the sample standard deviation, ∆ = , k represents the coefficient of accuracy, μ represents the sample mean.
The number of sampling points in the subsidence area should be more than the reasonable or required number of samples used for spatial interpolation of SOC density in the subsidence area. After calculation at the confidence level PL = 95% and the coefficient of accuracy k = 0.10, the reasonable sampling number of the subsidence area is 38. However the gird density and number of sampling points can be increased to improve the spatial prediction accuracy of SOC density in subsidence areas. For this study, 54 samples are collected.
The study area was divided into 54 1 km × 1 km square grids, and a stratified systematic sampling scheme was applied to collect soil samples in each grid, which were used to predict the SOC density in farmland in the mining subsidence area. Thirty-two sampling points were located in the non-waterlogged subsidence area, nine sampling points in the seasonally waterlogged subsidence area, and 13 sampling points in the year-round waterlogged area.
Another 18 soil sampling points were selected at random for verification in the mining subsidence area to evaluate the accuracy of predictions made by a kriging interpolation model of the SOC density in the subsidence area. The number of sampling points for verification is 30% of the prediction sample number, which accord with the geostatistical rules [25,27]. During sampling, a handheld Global Positioning System (GPS) was used to record the coordinates of the sampling points.
Using the method of five-point sampling mode [28,29], soil samples from the 0–40 cm layer were obtained with a soil auger at different sampling points and they were then uniformly mixed [30,31]. Finally, 200-g soil samples were selected using the quartering method. The potassium dichromate volumetric method was used to measure the SOC contents of the samples [32]. The SOC and soil organic matter (SOM) content were converted from one into the other according to a Bemmelen coefficient of 1.724 [33,34,35]. Additionally, 0–40 cm soil profiles were dug at the sampling points with a cutting ring and the soil bulk density was calculated for the 0–40 cm soil layer [30,31].
After completing the field sampling, GS+7 geostatistical software was used to perform statistical analyses of the SOC content at the sampling points in the subsidence area, and the same was done for the soil bulk density.

2.4. Model for Estimating the SOC Density and SOC Storage in the Regional SOC Pool in Farmland in the Mining Subsidence Area

Statistical analyses of factors that influence the soil in coal-mining subsidence areas have shown that waterlogged conditions have important effects on the physical and chemical properties of soil [36]. Thus, the SOC contents in farmland in a subsidence area under a given waterlogging situation are similar, but the SOC contents differ greatly between waterlogging situations. So, uncertainty exists when making spatial predictions of the SOC content, and same problems exists with the soil bulk density.
To reduce this uncertainty, the SOC content or soil bulk density value Z ( X k j ) for each soil sample was divided into two parts after field sampling. The mean value u ( t k ) and the residual error r ( x k j ) of the SOC content or the soil bulk density in farmland in the subsidence area under the same waterlogging situation are (Equation (3)):
Z ( X k j ) = u ( t k ) + r ( x k j )
where t k represents the mining subsidence areas under different waterlogging conditions, including the non-waterlogged subsidence area, seasonally waterlogged subsidence area, and year-round waterlogged area. The residual error r ( x k j ) is the difference between the value measured for each sampling point and the predicted value obtained by spatial interpolation with a common kriging model [37,38,39,40].
The different mean values reflect the variability of the SOC content or the soil bulk density in farmland in the subsidence area under different waterlogging situations, whereas the different residual errors reflect the variability of the SOC content or soil bulk density within subsidence areas under the same waterlogging situation.
After obtaining the spatial interpolation results for the SOC content or the soil bulk density in farmland in the subsidence area, the subsidence area was divided into small grid cells with equal size using a geographical information system (GIS)-based method. The carbon stored in the SOC pool in farmland in the subsidence area can be estimated according to the following model (Equation (4)):
T O C = i = 1 n O C i × S i × ρ i × H i
where: T O C is SOC storage in the whole mining subsidence area; S i is area of the i-th grid cell after dividing the mining subsidence area into n grid cells with equal size; H i is soil thickness in the i-th grid cell; ρ i and O C i are soil bulk density and SOC content in the i-th grid cell, where the values are equal to the spatially interpolated values obtained for the soil bulk density and SOC content at the grid cell center coordinates.
The SOC density of every equally sized grid cell was equal to O C i × ρ i × H i .

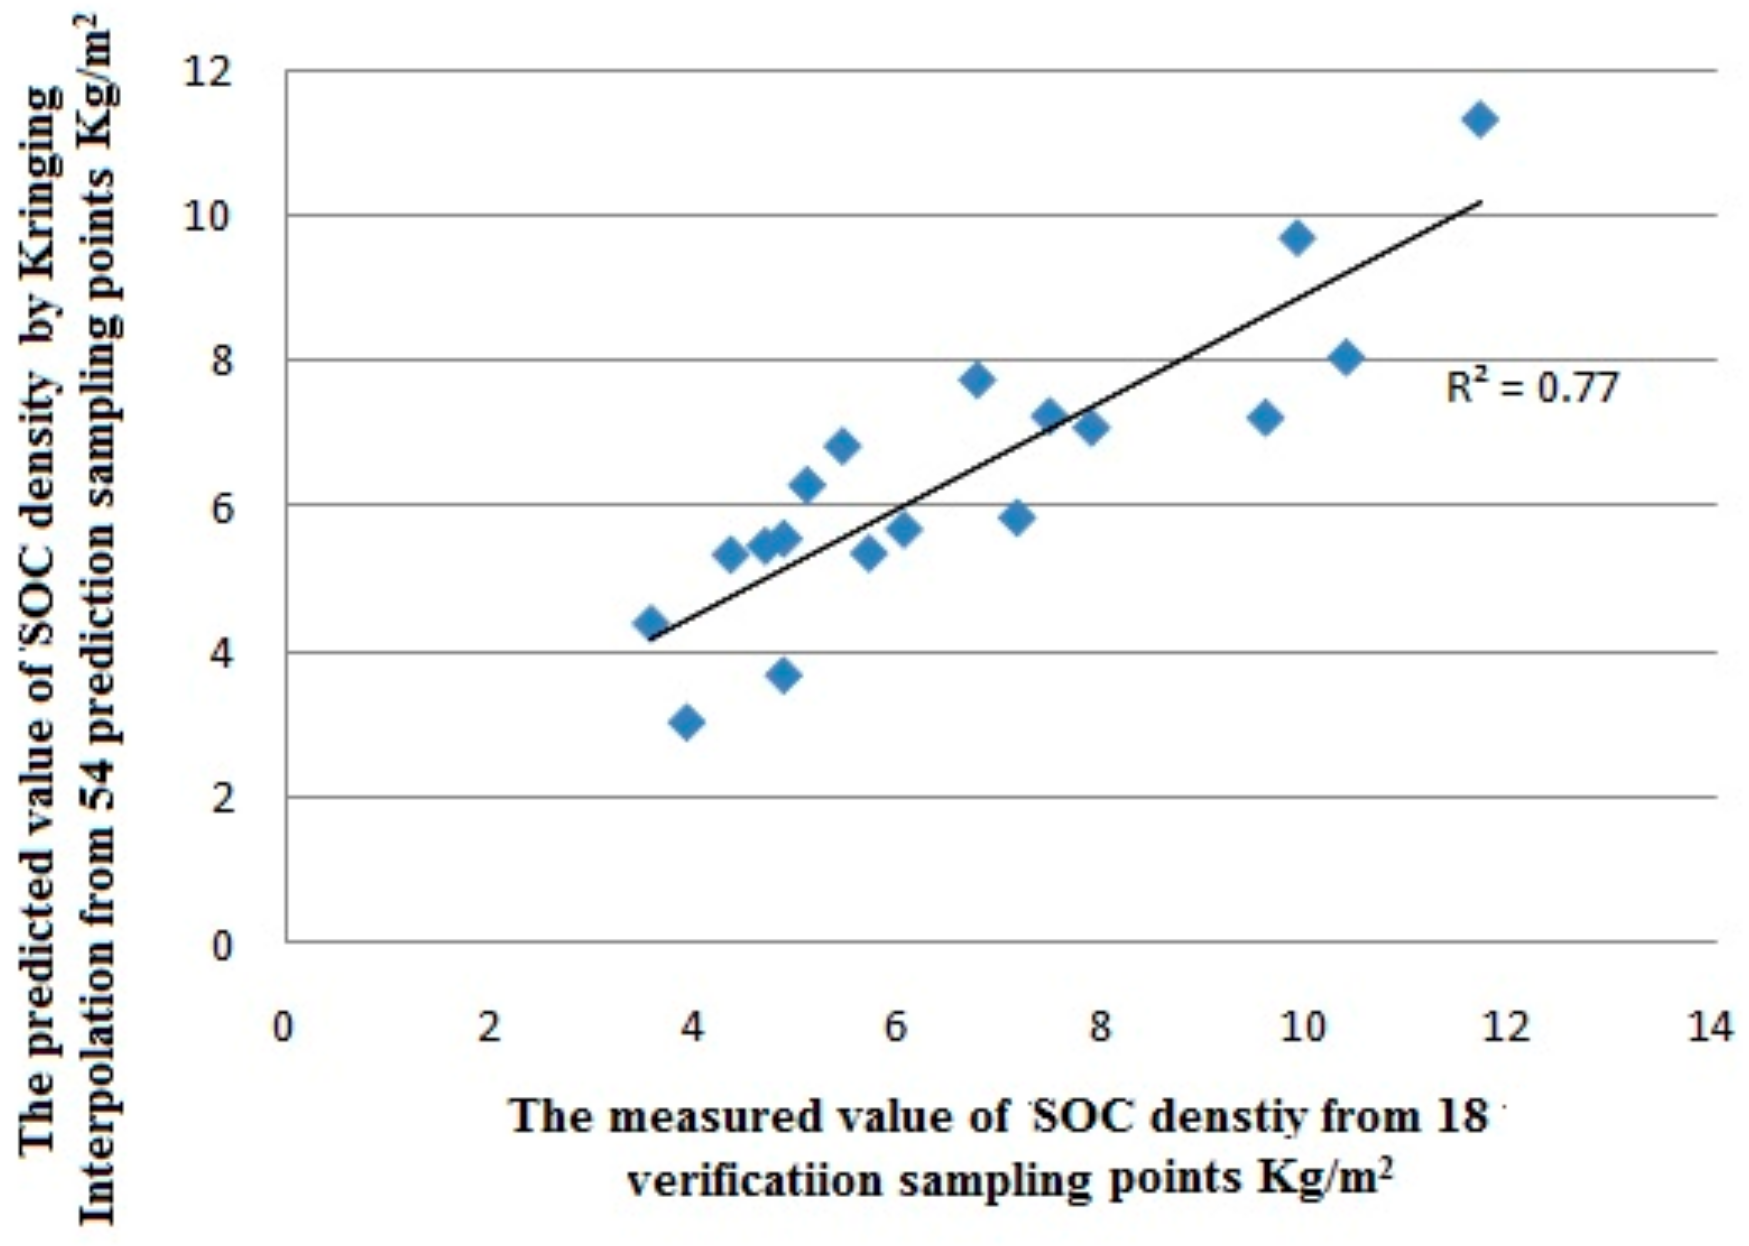
2.5. Evaluation of Estimation Precision

Eighteen soil samples were randomly collected with GPS positioning (Figure 4) in the study area for verification by the same soil sampling method described in Section 2.3. Based on the analysis results from 54 prediction samples, the regional SOC density distribution results in the mining subsidence area can be obtained by using the model described in Section 2.2 (Figure 5). On the platform of ArcGIS, the SOC density prediction values at the coordinate positions of 18 verification samples can be picked up on the SOC density distribution map (Figure 5).
A precision evaluation was conducted to compare the measured SOC density data for the regional SOC pool in farmland at 18 randomly selected verification sampling points in the subsidence area with the corresponding predicted data points obtained by the interpolation model described in Section 2.4. The goodness of fit was evaluated for the predicted and measured data based on the root mean square error (RMSE) [39], slope (k) and coefficient of determination (R2) [38,39,40]. The smaller RMSE is, and the closer k and R2 are both to 1, the higher the predictions accuracy obtained by the model is, whereas the accuracy is lower.

2.6. Carbon Storage in the Regional SOC Pool in Farmland without Coal Mining Effects in At0

According to Section 2.2, At0 with a homogeneous SOC density was treated as the control area in this study. To obtain the SOC density in At0, the areas around the mining subsidence area (or around At) where no coal-mining effect was present, had to be located precisely.
Based on the information from the underground coal working-face layout isograms and other related coal-mining subsidence information obtained from the three mines, the mining subsidence area and the surrounding area not affected by mining were predicted using mining subsidence theory [41,42]. Next, using the additional field survey information obtained from the three mines, the areas around zone At that were not affected by coal-mining subsidence were finally located precisely.
In Section 2.2, the areas around zone At belongs to the same agricultural cultivation area. The SOC pool in these areas is affected by conventional influencing factors, and the SOC density in this areas is homogeneous. Ten samples were collected randomly in the area around At where there was no effect of mining subsidence. These sampling points were not clustered in particular areas, but instead they were scattered around the borders of the mining subsidence area (Figure 4). All of the soil samples, including the prediction, verification, and control sites, were collected within three days, and a handheld GPS was used to record the coordinates of the sampling points. The collection and analysis methods were the same for all of the soil samples. The SOC densities were measured for 10 soil samples from the control area and the average value (7725 tonnes km−2) was treated as the SOC density in At0. At0 had the same spatial extent as At, so the spatial distribution diagram for the regional SOC density in At0 could be obtained using ArcGIS as a raster image with a homogeneous SOC density of 7725 tonnes km−2.

3. Results

3.1. Geostatistical Results for the Outside Soil Samples

Based on the kriging interpolation theory [43,44], the semivariance function structure of the spatial distribution was analyzed and the results are shown in Table 1. According to the spatial distribution of the SOC content and soil bulk density in the subsidence area, the C/(C0 + C) values of the semivariance function were 0.946 and 0.996, respectively, which are both greater than 0.75. Thus, the spatial correlations were high. The nugget values (C0) for the SOC content and soil bulk in the subsidence area were 0.97 and 1 × 10⁻⁵, respectively, which are relatively small.
The SOC content and soil bulk density at the sampling points in the study area were shown to obey normal distributions, indicating that kriging interpolation can be used in the study area.

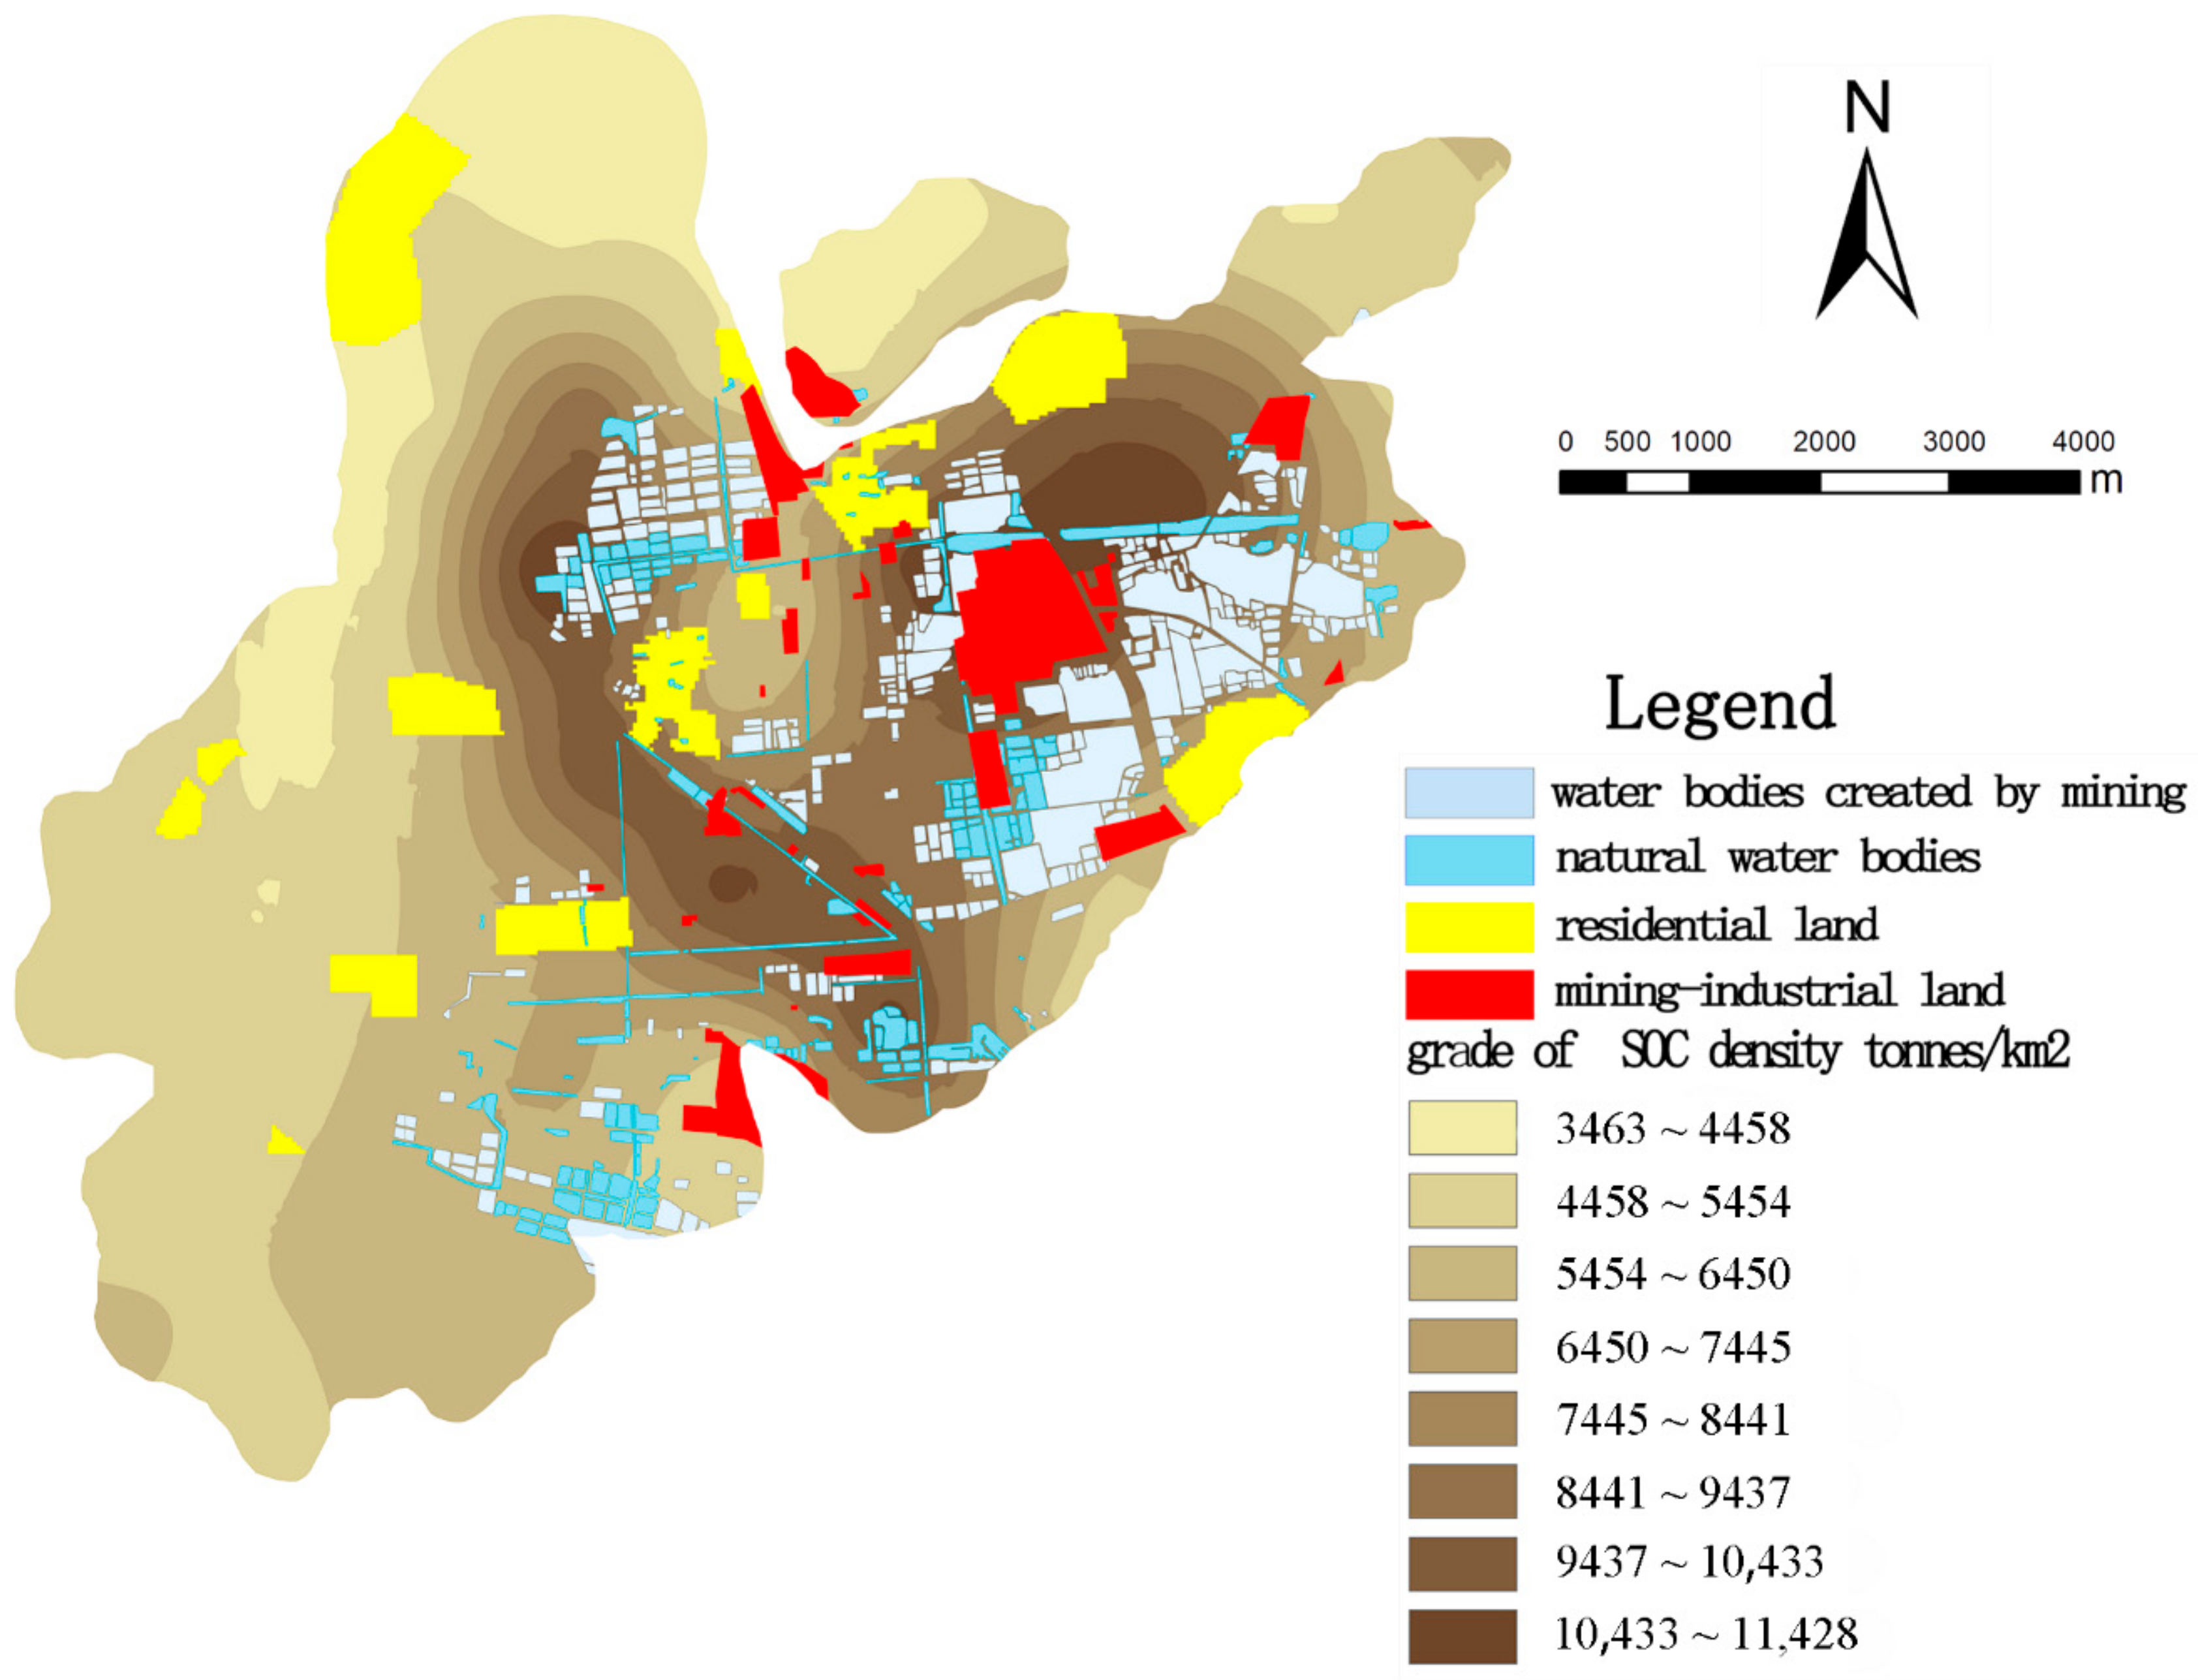
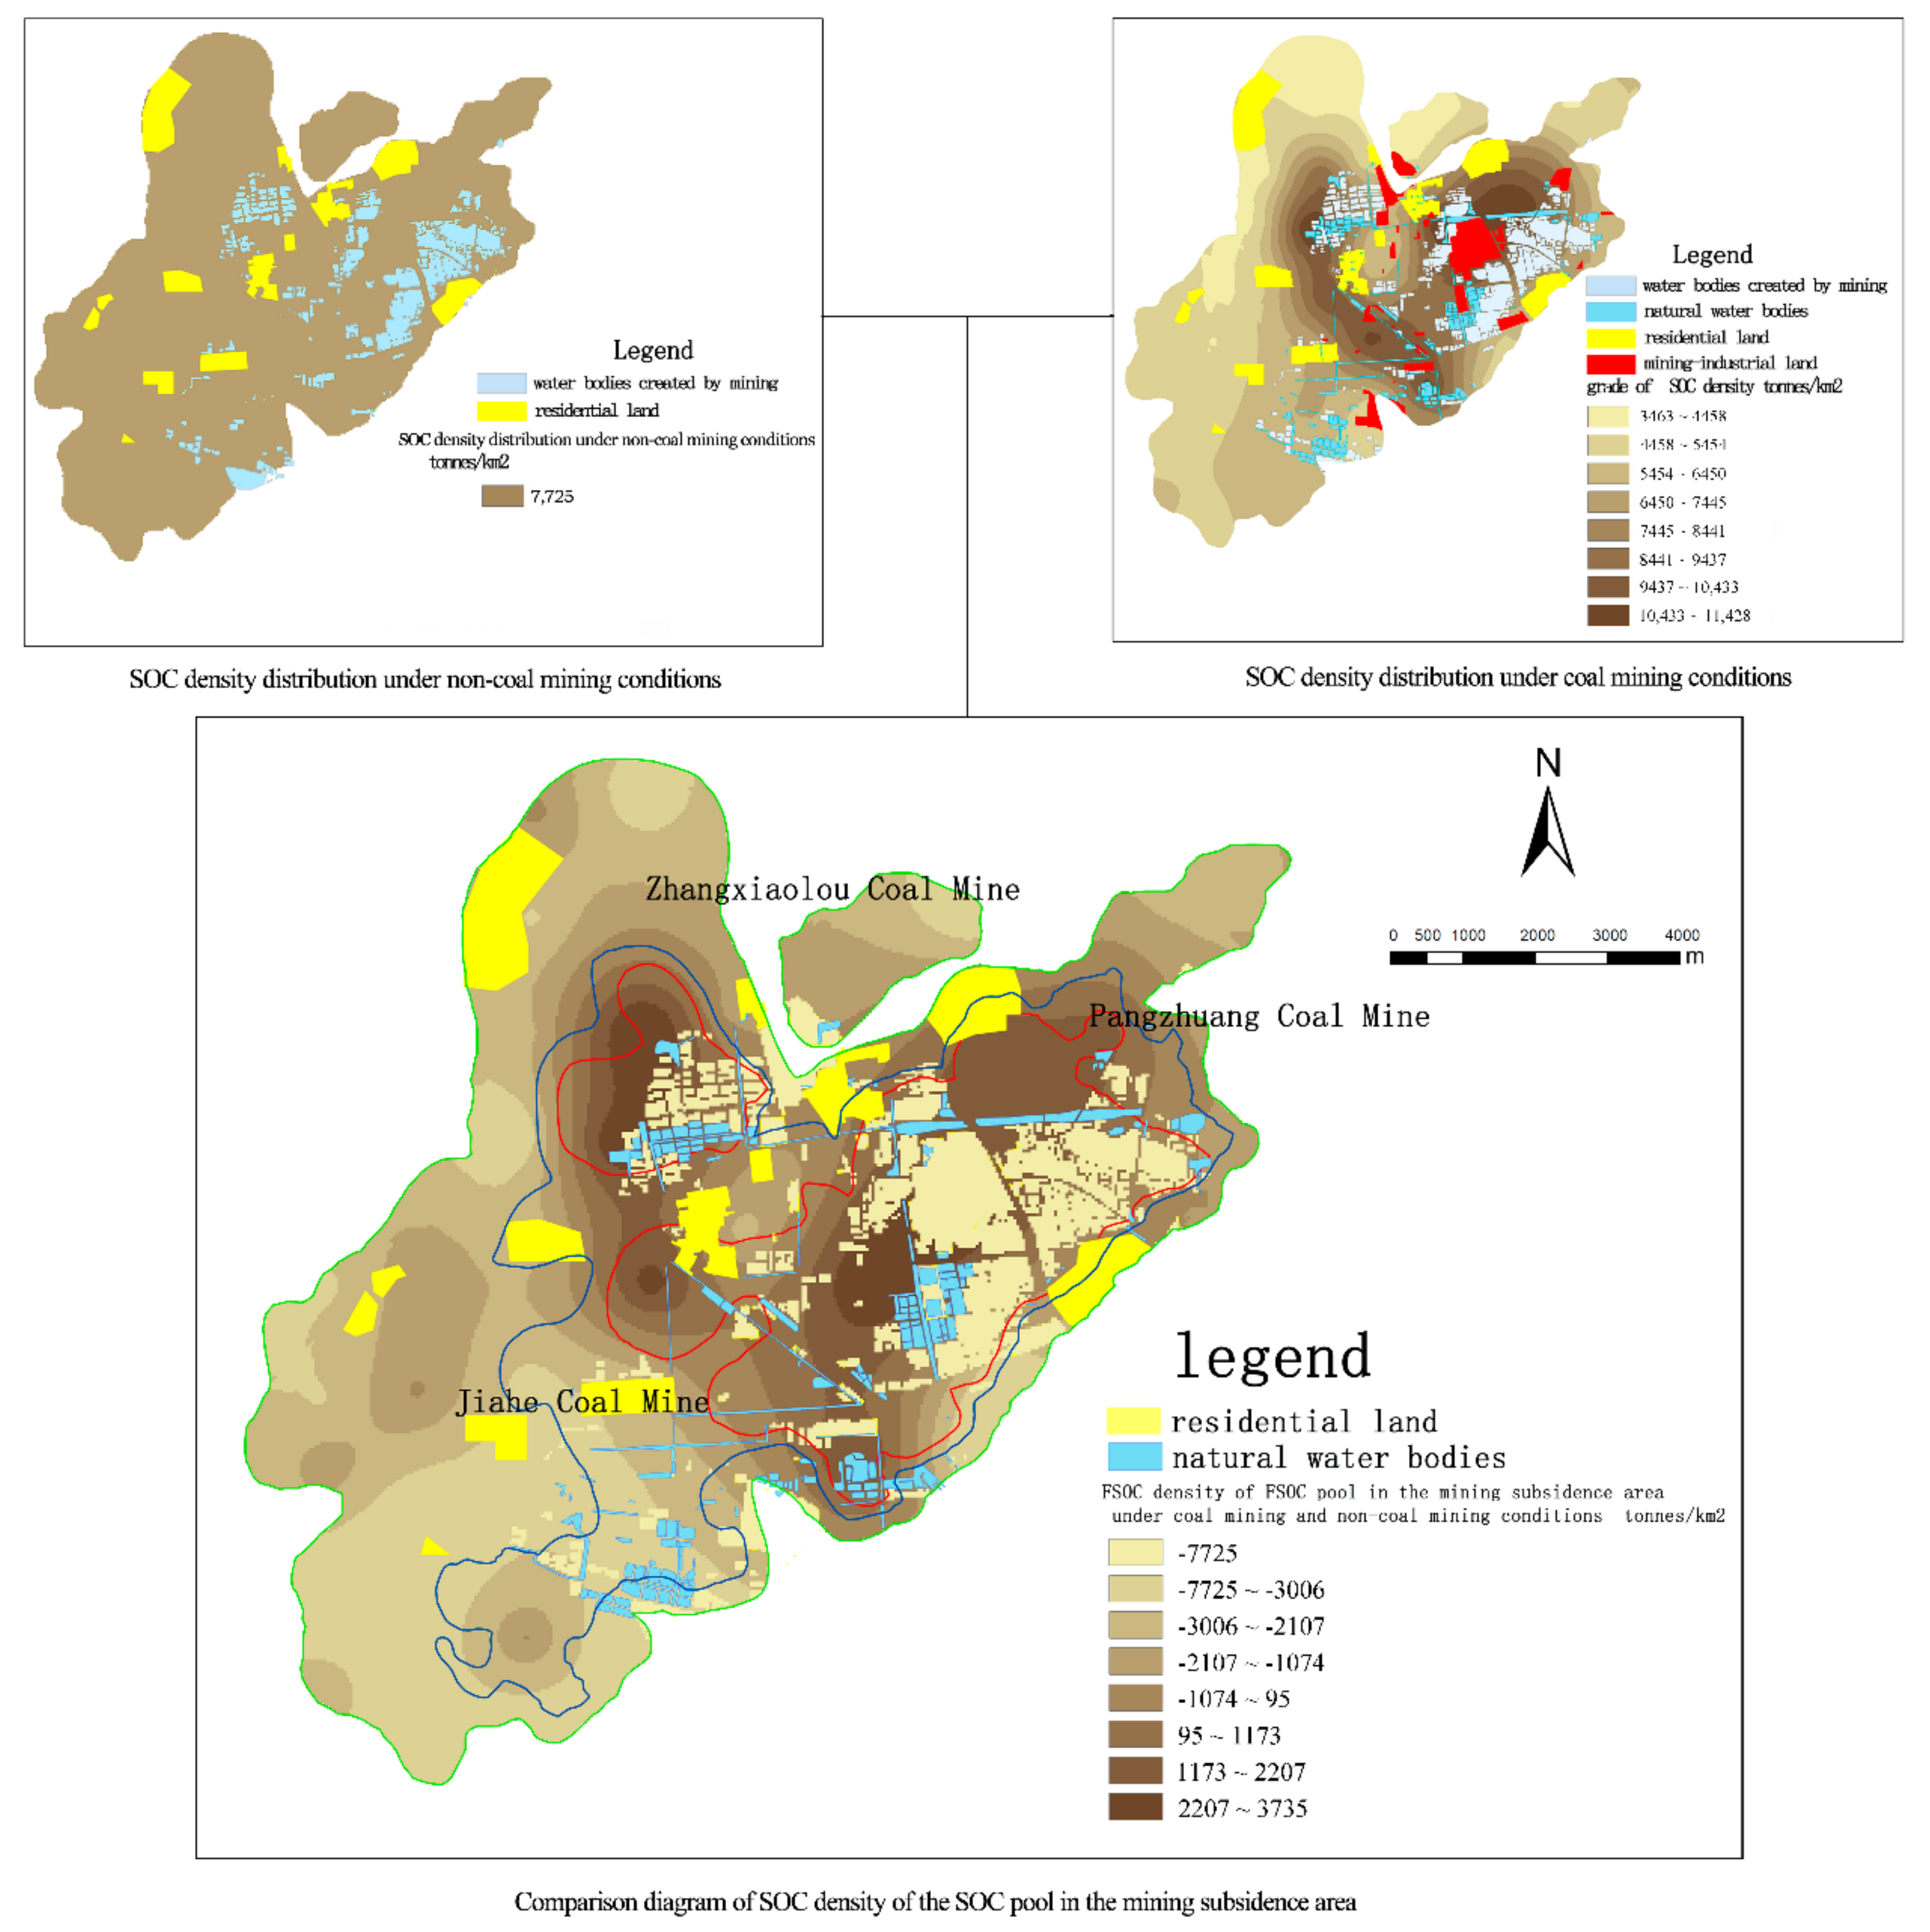
3.2. Spatial Distribution of SOC Density and SOC Storage in the Mining Subsidence Area (SOC Density and SOC Storage in At)

According to Section 2.4, the model for estimating carbon storage in the regional SOC pool in farmland in the subsidence area was used to estimate the regional SOC density in the mining area (or in At). Data processing was conducted by kriging interpolation using ArcGIS software, and the results are shown in Figure 5.
Accuracy evaluation was conducted, the xy scatter diagram was drawn for the predicted and measured SOC density data in the subsidence area, the fitting was then performed. The fitted equation was: y = 0.737x + 1.549, and the k = 0.737, R2 = 0.77 (Figure 6); RMSE = 0.31. The precision of the estimates obtained by the model was relatively high.
Figure 5 shows the spatial distributions of the SOC density in the subsidence area. The amount of SOC stored in the mining subsidence area in the Jiuli Mining Area was calculated as 210,717 tonnes, among which 94,251 tonnes of SOC (44.73%) existed in the non-waterlogged subsidence farmland area, 53,203 tonnes of SOC (25.23%) in the seasonally waterlogged subsidence farmland area, and 63,263 tonnes of SOC (30.02%) in the waterlogged wetland area. The SOC density in the subsidence area both tended to increase from low values along the periphery of the subsidence to the high values in the subsidence center.

3.3. Evaluation of the Effects of Underground Coal Mining on the Regional SOC Pool in Farmland in the Mining Subsidence Area

After determining the SOC density distributions for At and At0, the effect of coal mining on the regional SOC pool in the mining subsidence area was evaluated according to Equation (1). Data processing was performed by overlapping analysis of raster images using the ArcGIS platform and the results are shown in Figure 7. It is showed that compared with the non-mining scenario, the density of the SOC pool in the mining subsidence area decreased greatly by from −7725 to 3735 tonnes km−2 compared with the non-mining scenario. The SOC stored at the periphery of the subsidence area at higher elevations was severely decreased, whereas the SOC stored in the waterlogged wetland areas at low elevations increased.
Compared with non-mining areas, the changes in the SOC density in the subsidence area due to coal mining was between −7725 and 95 tonnes km−2, where this represented the largest proportion, covering 25.07 km2 and accounting for 59.45% of the total subsidence area. The areas affected generally comprised non-waterlogged subsidence farmland and seasonally waterlogged farmland. The SOC storage decreased by 48,477 tonnes due to coal mining in the non-waterlogged subsidence farmland and 5726 tonnes in the seasonally waterlogged subsidence farmland area (Table 2).
The areas with changes in the SOC density of −7725 tonnes km−2 comprised mining-industrial land and water bodies where 5.7928 tonnes SOC stored in farmland lost in this process caused by mining.
The portion of the subsidence area with an SOC density change between 95 and 3736 tonnes km−2 accounted for 19.07% of the whole subsidence area (8.04 km2). These areas was basically waterlogged wetland areas. In these areas, compared with the areas that were not affected by coal mining, the SOC storage increased by 9249 tonnes influenced by coal mining (Figure 7).
The SOC density and storage decreased in some areas, but increased in others. However, two types of areas had little SOC density changes: (1) areas where the SOC density remained unchanged under both situations (with and without the influence of coal mining) after cultivation for dozens of years as farmland; and (2) residential land and natural water bodies in the subsidence area.
Based on these results, compared with non-coal mining conditions, the total SOC storage was reduced by 102,882 tonnes due to coal mining over the whole coal-mining subsidence area.

4. Discussion

4.1. Geostatistical Analysis on the Spatial Variability of SOC in the Mining Subsidence Area

According to kriging interpolation theory, C0 is the nugget variance and the mean random error is the variation jointly caused by experimental error, fertilization, crop variation, management level, and other random factors at a small sampling scale [39,45]. The large nugget variance indicates that processes at a small scale cannot be ignored. In Jiuli Mining Subsidence Area, The nugget values (C0) for the SOC content and soil bulk were both small (Table 1), which indicates that the spatial variations in the SOC and soil bulk density caused by experimental error, fertilization, crop variation, management level, and other random factors at a small sampling scale were minimal at a regional scale.
C represents the structural variance and the mean system attribute or maximum spatial variation of a regional variable, where this variation is caused by the soil parent material, terrain, climate, and other structural factors [39,45]. The climate in the subsidence area remained unchanged before and after coal mining, so the spatial variability in the SOC content and soil bulk was basically caused by mining subsidence, subsidence waterlogging, and other structural factors due to coal mining. C + C0 is the sill variance (the stationary value of the semivariance function after the interval increases progressively to a certain degree) and it represents the total variation in the system. C/(C0 + C) represents the degree of spatial correlation (the proportion of spatial variation caused by structural factors in the total system variation). The spatial correlation is poor when the specific value is less than 0.25, moderate when the specific value is between 0.25 and 0.75, and good when the specific value is greater than 0.75.
In the study area, the C/(C0 + C) values of the SOC content and soil bulk were both greater than 0.75 (Table 1), which indicates that the spatial correlation in the SOC and soil bulk density mainly caused by the structural factors, such as mining, subsidence waterlogging, and other structural factors due to coal mining at a regional scale.

4.2. Reason for SOC Density Decrease in the Non-Waterlogged Subsidence Farmland and Seasonally Waterlogged Subsidence Farmland

SOC density decreased sharply in the non-waterlogged subsidence farmland area and the seasonally waterlogged farmland area, and the SOC density distribution was uneven, which may be ascribed to some reasons. First, the SOC erosion losses were more severe in the upslope areas when the surface subsidence caused by mining is unstable. After the surface subsidence caused by mining stabilizes, the slopes formed by coal-mining subsidence will continue to exist for a long time and the SOC losses due to soil erosion will be sustained [13]. Moreover, the topographic changes caused by underground mining subsidence, such as the slope gradient, length, and aspect, were the key factors that affected soil erosion, where this erosion was most severe in marginal subsidence basins [46], and this is consistent with our results (Figure 7).
Second, vegetation has obvious effects on soil and water conservation [47]. In non-waterlogged subsidence farmland areas and seasonally waterlogged farmland areas, when the surface subsidence caused by mining is unstable, soil respiration was enhanced in the subsidence area and even more CO2 was emitted [48]. After the surface subsidence caused by mining stabilized, root growth by vegetation and the carbon dioxide fixation capacity were severely inhibited, thereby aggravating soil erosion and carbon mineralization [15,49].
Furthermore, the seasonal waterlogging of farmland destroyed the soil microbial community, changed the physical and chemical properties of soil, and inhibited root nutrient uptake to reduce the formation of SOM (SOC) [4].

4.3. Reason for SOC Density Decrease in Mining-Industrial Land and Water Bodies Created by Mining

In the study area the land use change from farmland into mining-industrial land and water bodies created by mining decreased the SOC storage (Table 1). These areas were farmland before mining and the SOC density was also 7725 tonnes km−2, and gradually changed into mining-industrial land and water bodies after coal mining for many years. Some SOC was still present in a few grassy areas scattered over the mining-industrial landscape, which were designed to create environmentally friendly surroundings. However, the vast majority of the mining-industrial land was covered by buildings and cement-hardened ground, and thus the farmland in these regions was generally lost. Therefore, the SOC stored in the grassy areas can be ignored compared with the SOC lost from farmland after the conversion from farmland to mining-industrial land. Therefore, the SOC density in the mining-industrial land was treated as 0 tonnes km−2.
The results showed that the conversion of farmland into built-up land and water bodies caused losses from the SOC pool, which is in agreement with significantly decreased stored SOC caused by coal mining in land use with substantial reductions of farmland and woodland [23,24]. All of the farmland and woodland areas were converted into mining-industrial areas and the open pit at Pingshuo Opencast Mine from 1976 to 2009, which increased the loss of SOC to 250,966.72 tonnes [50]. Changes in land use such as the conversion of farmland, grassland, and woodland into industrial and mining land greatly disrupt the SOC pool and lead to carbon losses [51,52].

4.4. Reason for SOC Density Increase in the Waterlogged Wetland Area

SOC storage increased due to the land use change from farmland into waterlogged wetland area in the study area caused by mining subsidence. In the waterlogged wetland area, the increased SOC was derived partly from higher elevations in the non-waterlogged subsidence farmland area and the seasonally waterlogged subsidence farmland area due to soil erosion. Moreover, although large quantities of CH4 would be produced, wetland could be more beneficial for SOC accumulation because of its high carbon fixation capacity [53]. Moisture is a key factor that affected SOC decomposition in wetlands [54]. Due to the perennially waterlogged conditions in these areas, decomposition by aerobic microorganisms and enzymes can be suppressed, thereby inhibiting decomposition, but humification was enhanced under anaerobic conditions, which was conducive to SOC accumulation [55]. The wetlands formed by mining subsidence have existed for a relatively short time, which may affect the accumulation of SOC, which resulted in a little rise of the SOC density in the waterlogged wetland areas.

4.5. SOC Density Changes in the Whole Mining Subsidence Area

The results showed that SOC stored in farmland was reduced by 102,883 tonnes due to coal mining throughout the whole coal-mining subsidence area. Therefore, the effect of underground coal mining on the regional SOC pool of farmland is a carbon loss process. Although the SOC pool decreased in others’ studies at an experimental plot scale (Table 3), our study area was a typical underground mining area. In this area, the SOC storage decreased sharply in non-waterlogged subsidence farmland and seasonally waterlogged subsidence farmland, but increased remarkably in waterlogged wetland areas.
In addition, among all the lost SOC of farmland in the study area, 48,679 tonnes (47.3%) was contributed to land-use change and the remaining 54,204 tonnes (53.7%) was ascribed to soil degradation and the erosion, which indicates that the land use change, soil degradation and the erosion almost make an equal contribution toward the carbon lost process in the study area. Similar findings were not obtained in other studies at an experimental plot scale.

4.6. Applicability of the Models

SOC density spatial prediction model (the partition kriging method) suitable for coal mining subsidence areas was proposed in this study, and the model can guarantee a certain prediction accuracy (k = 0.737 and R2 = 0.77, RMSE = 0.31) in this study. The partition kriging method takes into account the spatial non-stationarity and the spatial autocorrelation of residuals, which will improve the prediction accuracy [60]. Therefore the accuracy of this method is higher than that of the ordinary kriging method.
Moreover, the main factors that mediate the effects of coal mining on the regional SOC pool include soil erosion, soil degradation, and land use change [15,48,49,53,61]. These factors were considered in the method for evaluating the effect of coal mining on soil regional SOC storage in farmland soil (Equations (1) and (2)). Therefore, this evaluation method proposed in this study have general implications.
The outcomes of this study cannot be applied to all mines because the specific numerical values for the factors mentioned above are different, and differences in land-use changes before and after mining will vary for coal mines. However, the main conclusion of this study may be of great importance for developing guidelines to evaluate the effects of coal mining on the regional SOC pool in mines located in the eastern plain of China (such as Huabei, Huainan, and Yanzhou mines), which are similar in climate, terrain, and soil conditions to the mine considered in the present study.

5. Conclusions

In the mining subsidence area, the spatial correlation in the SOC content was mainly caused by structural factors at a regional scale. These factors comprise mining subsidence, subsidence waterlogging, and other structural factors due to coal mining. The SOC density spatial prediction model suitable for coal mining subsidence areas was proposed in this study, and the model can guarantee a certain prediction accuracy. Based on the proposed model, the effects of underground coal mining on the regional SOC pool in farmland in the Jiuli Mining Area were also investigated, it was founded that the effect of underground coal mining on the regional SOC pool of farmland is a carbon loss process. SOC storage in farmland soil decreased sharply in non-waterlogged subsidence farmland and seasonally waterlogged subsidence farmland in the areas with mining, whereas the SOC storage increased in waterlogged wetland after coal mining. Land-use changes, soil degradation and erosion contributed almost equally to the carbon loss process in the study area.

Author Contributions

Z.X. conceived and designed the experiments; Y.Z. and C.L., J.Y. performed the experiments; Z.X., R.B. and J.Y. analyzed the data; F.L. and H.Z. contributed analysis tools; Z.X., J.Y., and F.L. wrote the paper.

Funding

This study was supported by the National Natural Science Foundation of China (No. 51304130, 41401619, and 21407102), Program for the Soft Science research of Shanxi (No. 2018041060-2, 2018041069-3), Program for the Philosophy and Social Sciences Research of Higher Learning Institutions of Shanxi (No. 201803010), the Natural Science Foundation of Shanxi Province, China (No. 2015021125), and the Foundation of Shanxi Agricultural University (No. 20132-13).

Conflicts of Interest

The authors declare no conflict of interest.

References

  1. Djerejian, E.P. The B.P. Statistical Review of World Energy. Available online: http://www.bp.com/content/dam/bp/pdf/Energy-economics/statistical-review-2018/BP-statistical-review-of-world-energy-2018-full-report.pdf (accessed on 9 October 2018).
  2. Hu, Z.; Xiao, W. Optimization of concurrent mining and reclamation plans for single coal seam: A case study in northern Anhui, China. Environ. Earth Sci. 2013, 68, 1247–1254. [Google Scholar] [CrossRef]
  3. Peng, S.P. Study on control and improvement of ecological environment in coal mine area in Western China. Sci. Technol. Rev. 2000, 27, 3. [Google Scholar]
  4. Shrestha, R.K.; Lal, R. Changes in physical and chemical properties of soil after surface mining and reclamation. Geoderma 2011, 161, 168–176. [Google Scholar] [CrossRef]
  5. Silburn, D.M.; Crow, F.R. Source: Transactions of the American Society of Agricultural Engineers. Am. Soc. Agric. Eng. 1984, 27, 827–832. [Google Scholar]
  6. Cole, C.; Duxbury, J.; Freney, J.; Heinemeyer, O.; Minami, K.; Mosier, A.; Paustian, K.; Rosenberg, N.; Sampson, N.; Sauerbeck, D.; et al. Global estimates of potential mitigation of greenhouse gas emissions by agriculture. Nutr. Cycl. Agroecosyst. 1997, 49, 221–228. [Google Scholar] [CrossRef]
  7. Lal, R. Carbon management in agricultural soils. Mitig. Adapt. Strateg. Glob. Chang. 2007, 12, 303–322. [Google Scholar] [CrossRef]
  8. Snyder, C.; Bruulsema, T.; Jensen, T.; Fixen, P. Review of greenhouse gas emissions from crop production systems and fertilizer management effects. Agric. Ecosyst. Environ. 2009, 133, 247–266. [Google Scholar] [CrossRef]
  9. Tubiello, F.N.; Schmidhuber, J. Emissions of greenhouse gases from agriculture and their mitigation. Handb. Food Demand Supply Sustain. Secur. 2014, 56, 422–430. [Google Scholar]
  10. Maharaj, S.; Barton, C.D.; Karathanasis, T.A.; Rowe, H.D.; Rimmer, S.M. Distinguishing “new” from “old” organic carbon on reclaimed coal mine sites using thermogravimetry: I. Method development. Soil Sci. 2007, 172, 292–301. [Google Scholar] [CrossRef]
  11. Brye, K.R. Soil Biochemical Properties as Affected by Land Leveling in a Clayey Aquert. Soil Sci. Soc. Am. J. 2006, 70, 1129–1139. [Google Scholar] [CrossRef]
  12. Hetrick, B.; Wilson, G.; Figge, D. The influence of mycorrhizal symbiosis and fertilizer amendments on establishment of vegetation in heavy metal mine spoil. Environ. Pollut. 1994, 86, 171–179. [Google Scholar] [CrossRef]
  13. Meng, L.; Feng, Q.-Y.; Zhou, L.; Lu, P.; Meng, Q.-J. Environmental cumulative effects of coal underground mining. Procedia Earth Planet. Sci. 2009, 1, 1280–1284. [Google Scholar] [CrossRef] [Green Version]
  14. Izaurralde, R.C. Cycles of soil. Crop Sci. 2000, 40, 288. [Google Scholar] [CrossRef]
  15. Shrestha, R.K.; Lal, R. Ecosystem carbon budgeting and soil carbon sequestration in reclaimed mine soil. Environ. Int. 2006, 32, 781–796. [Google Scholar] [CrossRef] [PubMed]
  16. González-Pérez, J.A.; González-Vila, F.J.; Almendros, G.; Knicker, H. The effect of fire on soil organic matter—A review. Environ. Int. 2004, 30, 855–870. [Google Scholar] [CrossRef] [PubMed]
  17. Zhang, G.S.; Ni, Z.W. Winter tillage impacts on soil organic carbon, aggregation and CO2 emission in a rained vegetable cropping system of the mid–Yunnan plateau, China. Soil Tillage Res. 2017, 165, 294–301. [Google Scholar] [CrossRef]
  18. XCMG. Mine Designed of Xuzhou Coal Mining Group; China University of Mining and Technology Press: Xuzhou, China, 2008. [Google Scholar]
  19. XCMG. Land Resources Invested of Xuzhou Coal Mining Group; China University of Mining and Technology Press: Xuzhou, China, 2008. [Google Scholar]
  20. Paradelo, R.; Virto, I.; Chenu, C. Net effect of liming on soil organic carbon stocks: A review. Agric. Ecosyst. Environ. 2015, 202, 98–107. [Google Scholar] [CrossRef]
  21. Haddaway, N.R.; Hedlund, K.; Jackson, L.E.; Kätterer, T.; Lugato, E.; Thomsen, I.K.; Isberg, P.E. How does tillage intensity affect soil organic carbon? A systematic review protocol. Environ. Evid. 2016, 5, 1. [Google Scholar] [CrossRef] [Green Version]
  22. Vindušková, O.; Frouz, J. Soil carbon accumulation after open-cast coal and oil shale mining in Northern Hemisphere: A quantitative review. Environ. Earth Sci. 2013, 69, 1685–1698. [Google Scholar] [CrossRef]
  23. Falahatkar, S.; Hosseini, S.M.; Ayoubi, S. Predicting soil organic carbon density using auxiliary environmental variables in northern Iran. Arch. Agron. Soil Sci. 2016, 62, 375–393. [Google Scholar] [CrossRef]
  24. Pei, W.; Yao, S.; Knight, J.F.; Dong, S.; Pelletier, K.; Rampi, L.P.; Wang, Y.; Klassen, J. Mapping and detection of land use change in a coal mining area using object-based image analysis. Environ. Earth Sci. 2017, 76, 125. [Google Scholar] [CrossRef]
  25. Shi, Z.; Li, Y. Application of Geostatistics in Soil Science; China Agriculture Press: Beijing, China, 2006. [Google Scholar]
  26. Lei, Z.D.; Yang, S.X. Soil Hydrodynamics; Tsinghua University Press: Beijing, China, 1988. [Google Scholar]
  27. Zhang, Z.; Yu, D.; Shi, X.; Weindorf, D.; Sun, W.; Wang, H.; Zhao, Y. Effects of prediction methods for detecting the temporal evolution of soil organic carbon in the Hilly Red Soil Region, China. Environ. Earth Sci. 2011, 64, 319–328. [Google Scholar] [CrossRef]
  28. Ghosh, S.; Scharenbroch, B.C.; Ow, L.F. Soil organic carbon distribution in roadside soils of Singapore. Chemosphere 2016, 165, 163–172. [Google Scholar] [CrossRef] [PubMed]
  29. Wang, S.; Fan, J.; Zhong, H.; Li, Y.; Zhu, H.; Qiao, Y.; Zhang, H.A. Multi-factor weighted regression approach for estimating the spatial distribution of soil organic carbon in grasslands. Catena 2019, 174, 248–258. [Google Scholar] [CrossRef]
  30. Kempen, B.; Dalsgaard, S.; Kaaya, A.K.; Chamuya, N.; Ruipérez-González, M.; Pekkarinen, A.; Walsh, M.G. Mapping topsoil organic carbon concentrations and stocks for Tanzania. Geoderma 2019, 337, 164–180. [Google Scholar] [CrossRef]
  31. Álvaro-Fuentes, J.; Gabriel, J.L.; Gutiérrez, C.; Nanos, N.; Escuer, M.; Ramos-Miras, J.J.; Gil, C.; Martín-Lammerding, D.; Boluda, R. Soil organic carbon stock on the Majorca Island: Temporal change in agricultural soil over the last 10 years. Catena 2019, 181, 221–230. [Google Scholar]
  32. Walkley, A.; Black, I.A. An examination of the degtjareff method for determining soil organic matter, and a proposed modification of the chromic acid titration method. Soil Sci. 1934, 37, 29–38. [Google Scholar] [CrossRef]
  33. Howard, P.J.A.; Howard, D.M. Use of organic carbon and loss-on-ignition to estimate soil organic matter in different soil types and horizons. Boil. Fertil. Soils 1990, 9, 306–310. [Google Scholar] [CrossRef]
  34. Wang, J.; Zhu, L.; Wang, Y.; Gao, S.; Daut, G. A comparison of different methods for determining the organic and inorganic carbon content of lake sediment from two lakes on the Tibetan Plateau. Quat. Int. 2012, 250, 49–54. [Google Scholar] [CrossRef]
  35. Wang, X.; Chow, J.C.; Kohl, S.D.; Percy, K.E.; Legge, A.H.; Watson, J.G. Characterization of PM2.5 and PM10 fugitive dust source profiles in the Athabasca Oil Sands Region. J. Air Waste Manag. Assoc. 2015, 65, 1421–1433. [Google Scholar] [CrossRef]
  36. Xu, Z.J.; Zhang, Y.; Zhang, S.L. Spatial prediction of soil organic carbon content in coal mining subsidence area based on GIS and partition kriging. Trans. Chin. Soc. Agric. Eng. 2018, 34, 253–259. [Google Scholar]
  37. Liu, T.L.; Juang, K.W.; Lee, D.Y. Interpolating soil properties using kriging combined with categorical information of soil maps. Soil Sci. Soc. Am. J. 2006, 70, 1200–1209. [Google Scholar] [CrossRef]
  38. Zhang, Z.; Yu, D.; Shi, X.; Weindorf, D.C.; Wang, X.; Tan, M. Effect of sampling classification patterns on SOC variability in the red soil region, China. Soil Tillage Res. 2010, 110, 2–7. [Google Scholar] [CrossRef]
  39. Guo, X.D.; Fu, B.J.; Chen, L.D.; Ke, M.A.; Li, J.R. The spatio-temporal variability of soil nutrients in Zunhua plain of Hebei province semivariogram and kriging analysis. Acta Geogr. Sin. 2000, 55, 555–566. [Google Scholar]
  40. Nakagawa, S.; Schielzeth, H. A general and simple method for obtaining R2 from generalized linear mixed-effects models. Methods Ecol. Evol. 2013, 4, 133–142. [Google Scholar] [CrossRef]
  41. Li, L.; Wu, K.; Zhou, D.-W. Extraction algorithm of mining subsidence information on water area based on support vector machine. Environ. Earth Sci. 2014, 72, 3991–4000. [Google Scholar] [CrossRef]
  42. Li, L.; Wu, K.; Zhou, D.-W. Evaluation theory and application of foundation stability of new buildings over an old goaf using longwall mining technology. Environ. Earth Sci. 2016, 75, 763. [Google Scholar] [CrossRef]
  43. Van Beers, W.C.M.; Kleijnen, J.P.C. Kriging for interpolation in random simulation. J. Oper. Res. Soc. 2003, 54, 255–262. [Google Scholar] [CrossRef]
  44. Mueller, T.G.; Pusuluri, N.B.; Mathias, K.K.; Cornelius, P.L.; Barnhisel, R.I.; Shearer, S.A. Map Quality for Ordinary Kriging and Inverse Distance Weighted Interpolation. Soil Sci. Soc. Am. J. 2004, 68, 2042. [Google Scholar] [CrossRef]
  45. Wang, Y.; Zhang, X.; Huang, C. Spatial variability of soil total nitrogen and soil total phosphorus under different land uses in a small watershed on the Loess Plateau, China. Geoderma 2009, 150, 141–149. [Google Scholar] [CrossRef]
  46. Meng, L.; Feng, Q.Y.; Wu, K.; Meng, Q.J. Quantitative evaluation of soil erosion of land subsided by coal mining using RUSLE. Int. J. Min. Sci. Technol. 2012, 22, 7–11. [Google Scholar] [CrossRef]
  47. Yang, G.; Bo, Z.; Pei, Z.; Tang, J.L.; Tao, W.; Miao, C.Y. Effects of vegetation cover on phosphorus loss from a hill slope cropland of purple soil under simulated rainfall: A case study in China. Nutr. Cycl. Agroecosyst. 2009, 85, 263–273. [Google Scholar]
  48. Cheng, J.X.; Nie, X.J.; Liu, C.H. Spatial variation of soil organic carbon in coal-mining subsidence areas. J. China Coal Soc. 2014, 39, 2495–2500. [Google Scholar]
  49. Zhang, L.; Wang, J.; Bai, Z.; Lv, C. Effects of vegetation on runoff and soil erosion on reclaimed land in an opencast coal-mine dump in a loess area. Catena 2015, 128, 44–53. [Google Scholar] [CrossRef]
  50. Zhang, Z.; Bai, Z.K.; He, Z.; Bao, N. Dynamic changes of land use type and carbon sinks based RS and GIS in Pingshuo opencast coal mine. Trans. China Soc. Agric. 2012, 28, 230–236. [Google Scholar]
  51. Wang, J.; Jiao, Z.; Bai, Z. Changes in carbon sink value based on RS and GIS in the Heidaigou opencast coal mine. Environ. Earth Sci. 2014, 71, 863–871. [Google Scholar] [CrossRef]
  52. Hu, Y.; Du, Z.; Wang, Q.; Li, G. Combined deep sampling and mass-based approaches to assess soil carbon and nitrogen losses due to land use changes in karst area of southwestern China. Solid Earth Discuss. 2016, 7, 1075–1084. [Google Scholar] [CrossRef]
  53. Zheng, Y.M.; Niu, Z.G.; Peng, G.; Dai, Y.J.; Wei, S. Preliminary estimation of the organic carbon pool in China’s wetlands. Sci. Bull. 2013, 58, 662–670. [Google Scholar] [CrossRef]
  54. Heikkinen, J.P.; Elsakov, V.; Martikainen, P.J. Carbon dioxide and methane dynamics and annual carbon balance in tundra wetland in NE Europe, Russia. Glob. Biogeochem. Cycles 2002, 16, 61–62. [Google Scholar] [CrossRef]
  55. Fenner, N.; Freeman, C.; Reynolds, B. Observations of a seasonally shifting thermal optimum in peatland carbon-cycling processes; implications for the global carbon cycle and soil enzyme methodologies. Soil Boil. Biochem. 2005, 37, 1814–1821. [Google Scholar] [CrossRef]
  56. Agus, C.; Putra, P.B.; Faridah, E.; Wulandari, D.; Napitupulu, R.R. Organic Carbon Stock and their Dynamics in Rehabilitation Ecosystem Areas of Post Open Coal Mining at Tropical Region. Procedia Eng. 2016, 159, 329–337. [Google Scholar] [CrossRef] [Green Version]
  57. Amichev, B.Y.; Burger, J.A.; Rodrigue, J.A. Carbon sequestration by forests and soils on mined land in the Midwestern and Appalachian coalfields of the U.S. For. Ecol. Manag. 2008, 256, 1949–1959. [Google Scholar] [CrossRef]
  58. Xu, Z.; Zhang, S.; Hou, H.P. Research on the Effect of Coal Mining on Carbon Reserves of Farmland Soil: Taking the Typical Coal Mining Subsidence Basin as a Case. Mod. Min. 2014, 29, 1850–1855. [Google Scholar]
  59. Hou, H.P.; Zhang, S.L.; Ding, Z.Y.; Ma, C.Z.; Huang, A. Impact on vegetation carbon storage in ecosystem from land use change in coal mine area: A case study at Chacheng Mine in Xuzhou mining area. J. China Coal Soc. 2013, 38, 1850–1855. [Google Scholar]
  60. Kumar, S.; Lal, R.; Liu, D. A geographically weighted regression kriging approach for mapping soil organic carbon stock. Geoderma 2012, 189, 627–634. [Google Scholar] [CrossRef]
  61. Huang, Y.; Tian, F.; Wang, Y.; Wang, M.; Hu, Z. Effect of coal mining on vegetation disturbance and associated carbon loss. Environ. Earth Sci. 2015, 73, 1–14. [Google Scholar] [CrossRef]
Figure 1. Mine field boundaries for the three mines and position of the subsidence area.
Sustainability 11 04961 g001
Figure 2. Land-use types in the Jiuli Mining Subsidence Area.
Sustainability 11 04961 g002
Figure 3. Diagrammatic drawing for the effect of coal mining on regional soil organic carbon (SOC) pool of farmland.
Sustainability 11 04961 g003
Figure 4. Distribution diagram of field sampling points for prediction.
Sustainability 11 04961 g004
Figure 5. Distribution diagram of SOC density in the mining subsidence area.
Sustainability 11 04961 g005
Figure 6. Scatter plots of the predicted and measured value of SOC density.
Sustainability 11 04961 g006
Figure 7. Comparison diagram of SOC density of the SOC pool in the mining subsidence area under coal mining and non-coal mining conditions.
Sustainability 11 04961 g007
Table 1. Semivariance function model and parameters for the farmland soil carbon density and soil bulk density in the subsidence area.
Vegetation
Feature
Model
Type
Nugget
C0
Sill
C0 + C
C/(C0 + C)Range
R
Coefficient of Determination
R2
SOC contentExponential0.9718.110.94642370.92
Soil bulk densityGaussian1 × 10−50.0230.99616940.95
Table 2. Evaluation of the effects of coal mining on the SOC pool in the mining subsidence area. Units: tonnes.
Non-Waterlogged FarmlandSeasonally Waterlogged FarmlandWaterlogged WetlandWater Bodies Created by MiningMining-Industrial LandResidential LandNatural Water BodiesWhole Mining Subsidence Area
Non-mining condition142,72858,92954,01438,51719,41100313,599
Mining condition94,25153,20363,2630000210,717
Carbon effect−48,477−57269249−38,517−19,41100−102,882
Carbon effect (%)−33.96−9.7217.12−100.00−100.00--−32.81
Table 3. Comparative analysis of the results obtained in previous studies.
ResearchersStudy AreaMining ModeSOC Pool ChangeReasons
Agus et al. [56]PT. Berau Coal, IndonesiaOpencastBefore mining:
28.5 Mg C ha−1
After mining:
4.3 Mg C ha−1;
Carbon loss
Vegetation and topsoil removed due to mining. SOC content decreased because of the loss of soil nutrients from the topsoil.
Beyhany et al. [57]Midwestern and Appalachian coalfields of the U.S.Opencast miningBefore mining:
210 Mg C ha−1
After mining:
130 Mg C ha−1;
Carbon loss
Vegetation destroyed and abundance of soil microbes reduced due to mining. The SOC content decreased because of the decline in the capacity to decompose litter and release soil nutrients.
Shrestha & Lal [4]Mining area of eastern Ohio, U.S.Opencast miningBefore mining:
11–29 Mg C ha−1
After mining:
1.2–2.5 Mg C ha−1;
Carbon loss
Mining led to the depletion of soil organic matter (SOM), increased oxidation, dilution of SOC via horizon mixing, accelerated erosion, and little or no SOC inputs from primary production during mining and the initial years of reclamation.
Xu et al. [58]Jiuli Mining Area of Xuzhou City, ChinaUnderground miningBefore mining:
560.3 tonnes C
After mining:
530.9 tonnes C;
Carbon loss
When surface subsidence caused by mining was unstable, the SOC losses from the upslope area were more severe due to soil erosion, and although the SOC pool had no carbon complement, soil respiration still continues and CO2 was emitted. After the surface subsidence caused by mining stabilized, SOC on the subsidence slope ran off to low-lying areas from higher areas in the mining subsidence basin due to soil erosion.
Cheng et al. [48]Jiaozuo Mining Area of Henan, ChinaUnderground miningDecreased by
20.8–47.3
tonnes C ha−1;
Carbon loss
Some ground fissures were created by underground mining. SOC from higher areas ran off into both low-lying areas and the ground fissures, thereby decreasing the SOC content in the topsoil.
Hou et al. [59]Chacheng Mining Area of Xuzhou City, ChinaUnderground miningBefore mining:
443.53 Pg C
After mining:
272.68 Pg C;Carbon loss
The change in SOC was associated with land use change due to underground mining. SOC was lost to the water bodies created by mining. SOC from woodland and farmland was reduced because of ground fissures, mining subsidence, and destruction of the soil structure due to mining activity.

