1. Introduction
Ensuring a continuous and reliable power supply represents a perpetual challenge for the sustainable economic growth of any country. According to the World Bank, only about 22.6% of the rural populace has access to electricity in Nigeria. This percentage of electricity access is considerably lower than that of Morocco and Ghana whose rural electricity access stands at 100% and 65.3%, respectively [
1]. Moreover, world electricity generation increased by 2.8% in 2017 due to the ever- growing expansion of renewable energy sources (RESs) led by solar (35%, 114 TWh) and wind (17%, 163 TWh), which contributed to about 49% of the entire growth, despite accounting for only 8% of the total power generated [
2]. RESs are essentially useful for sustainable and clean energy power supply [
3]. Besides, problems associated with individual energy sources can be mitigated when several energy sources are combined to form a hybrid system of renewable and non-renewable energy.
According to ref. [
4], Nigeria’s existing power plants have the capacity to generate 12,522 MW of electricity. However, only about 32% is realized due to high losses, power theft, lack of maintenance of power facilities, etc. To date, the country continues to face power supply problems with many customers being exposed to persistent power cuts. This is because the power generated is far below the electricity needed. This led to the privatization of the country’s generation and distribution companies in 2013 [
5]. Therefore, the government is seeking to diversify its electricity sources by implementing RESs for power generation. To this aim, the country has set a target of generating at least 2000 MW of renewable power by 2020 [
5], and achieving 30% of its total power generation from RESs by the end of 2030 [
6]. All potential RESs in the country such as hydro, wind, and solar can be exploited to meet electricity demand, with investment costs provided by the government, foreign investors, and the private sector.
A hybrid power system (HPS) is a combination of various energy resources (solar, wind, hydro, diesel, biomass, etc.) with or without an energy storage system that are used to meet the electricity load demand. Hybrid systems’ reliability and sustainability can be enhanced when different energy resources are utilized together. Furthermore, the recent reduction in solar PV and wind power technology costs, combined with innovative financing approaches, continued innovation in the design and operation of wind turbines, and financial inducement have attracted many investors to the sector, making PV and wind power systems quite competitive with conventional energy sources [
7,
8]. Furthermore, the costs of energy storage devices have been rapidly reduced [
9], making battery/RE systems more economically feasible for off-grid electricity generation systems [
10]. Besides, stand-alone diesel-fueled power systems, on the other hand, are very expensive to operate and maintain. Their average operation costs increase marginally at low load levels, especially at less than 40% rated capacity [
11].
Hence, PV/wind/battery/diesel generation systems with both off- and on-grid connections can ensure a continuous power supply with low operating costs, in addition to minimizing atmospheric pollution levels [
3,
12]. A renewable energy (RE) system has a high procurement cost when compared to traditional diesel plants, yet RE systems are finding a niche in many small and mass-scale low- carbon off-grid applications due to the availability of this energy source in areas where grid power is either erratic or simply unavailable [
8,
13]. Furthermore, various RE-based projects have been installed by government agencies in urban and remote areas primarily for electricity supply, water pumping, street lighting, and vaccine refrigerators in rural healthcare centers [
14,
15]. However, most of these projects are either small hydropower schemes of about 30 MW of total capacity or stand- alone mini-grid or off-grid light applications of a few kilo-watts, while off-grid hybrid RE projects are yet to be installed across the country.
Techno-economic analyses of combined RESs and conventional energy sources have been conducted in many studies, aiming to improve system reliability and tackle the unpredictable nature of grid-independent RE systems. Off-grid hybrid renewable electricity systems have been developed and proposed for a wide range of applications all around the globe. An HPS has been considered as a viable alternative system, showing a 37% CO
2 emission reduction compared to the conventional diesel system [
16]. In addition, a PV/hydro/diesel HPS system revealed a higher efficiency of electricity supply. However, it has a greater cost than the other HPSs or a diesel-only power system [
17]. A techno-economic viability study of PV with/without diesel generator using a worst-case user demand approach showed that a PV system of 68, 76, and 61 kW can adequately fulfill the load requirement of 63,500 kWh/year, with a system availability of 99.2% for selected sites [
18]. In another study, the addition of flywheel energy storage to a hybrid PV/diesel system makes it more economically viable [
19]. Adaramola et al. [
20] assessed the possibility of employing an HPS for power generation in semi-urban and rural areas in Jos, Nigeria using HOMER software. Optimal solutions were obtained at different interest rates and PV system costs using solar energy, a battery bank, and a diesel generator. Ngan and Tan [
21] assessed a wind/PV/diesel hybrid system and revealed that both diesel/PV and wind/diesel/PV HPS systems have higher net present cost (NPC) and cost of energy (COE) in comparison to the diesel-alone system.
Numerous studies have been conducted on both grid-connected and off-grid HPSs focusing on their reliability, cost-effectiveness, technical performance, environmental impact, and many other aspects. For example, in ref. [
22], a suitable renewable based hybrid energy system was evaluated and compared with high grid extension option, where the former system showed better performance in terms of NPC, COE, and carbon emissions. In an economic feasibility study for electricity demand in Iran using either a hybrid diesel/RE or grid/RE system, wind turbine was reported to reduce carbon emissions by 32%, with only 44% increase in NPC [
22]. However, the authors suggested that expanding a diesel-alone system to the proposed wind/diesel/battery system prior to grid connections would lower the overall expense. Guler et al. [
23] evaluated the feasibility of a hybrid grid/PV/wind system to meet the energy requirements of a medium-sized hotel in Turkey. The optimum solution was achieved only in the first scenario. In another study, Kim et al. [
24] reported that a PV/wind/battery/converter system is the optimum and most feasible standalone energy generation system among several options of grid-connected and off-grid systems considered.
However, most of the previous studies conducted on only a few areas across the country to investigate the viability of renewable hybrid energy generation system using the HOMER simulation program and the other techniques were limited to certain system configurations (grid-connected or off-grid topology) at different locations [
25,
26]. Moreover, the optimal design used in most of these studies cannot be effectively realized under both off-grid and grid-connected conditions without changing the entire system architecture. This demonstrates there is presently no study that has been performed that investigates a hybrid system capable of adequately functioning with both on-grid and grid-independent connections. Therefore, a reliable and adaptable hybrid system architecture is proposed in this work including all the functional parameters associated with the system for on- and off-grid operations. Besides, according to the literature, no study has been conducted that looks at developing a comprehensive and general approach to analyzing a common hybrid configuration, suitable for both on-and off-grid modes.
This study aims to determine an optimal adaptable system configuration for a renewable energy system and conventional energy system in combination with or without a battery storage system based on techno-economic and environmental investigation using the HOMER simulation tool for a residential load in Nigeria’s dry climate region. In this paper, multiple parameters including NPC, COE, and CO2 emissions, operating cost, renewable fraction, excess electricity, and battery state of charge were used to analyze system performance and the selection of the appropriate system configuration. A detailed sensitivity analysis to confirm the adaptability of the proposed system configuration to associated operational parameters was also conducted. The information in this work will assist the government and other major energy players in developing, planning, and implementing rural electrification frameworks.
2. Methodology
This study evaluated a community located in the north-western part of Nigeria at a coordinate of 11°32′ N and 7°13′ E. Based on the position of the selected area on the earth’s surface, it is characterized by a dry (hot semi-arid) climate. The techno-economic analysis and assessment of the environmental impact were based on solar irradiation levels, wind speed, fuel cost, and daily load demand. The meteorological data (solar radiation, ambient temperature, etc.) used in this research was retrieved from the National Aeronautics and Space Administration (NASA) satellite database website by specifying the latitude and longitude of the chosen locations. The proper and accurate selection of the criteria used in the analysis of the renewable and non-renewable energy model is essential in evaluating the performance of different frameworks.
The following outlines were employed in this study.
Load profile of the selected areas:
Temperature and solar resources;
Wind resource;
System units;
Mathematical description;
Hybrid energy system configuration.
2.1. Load Analysis
The residential load profile considered in this study was computed based on a realistic electricity consumption level in Nigeria rural areas. A daily energy consumption of a typical rural house during the wet season (March–October) and the dry season (November–February) is shown in
Table 1. The energy consumption during these seasons is computed based on the power ratings of common rural appliances and calculation criteria employed in [
25,
27], which is further expanded to the overall load profile of the village. As expected more energy is required during the wet season as compared to the dry season (November–February). Electricity from the hybrid system was essentially required for power points, lighting, and other medium and low consumption loads. The daily load demand of this village was taken as the hourly load in HOMER to obtain the daily (24 h) and monthly energy consumption profile for the entire year.
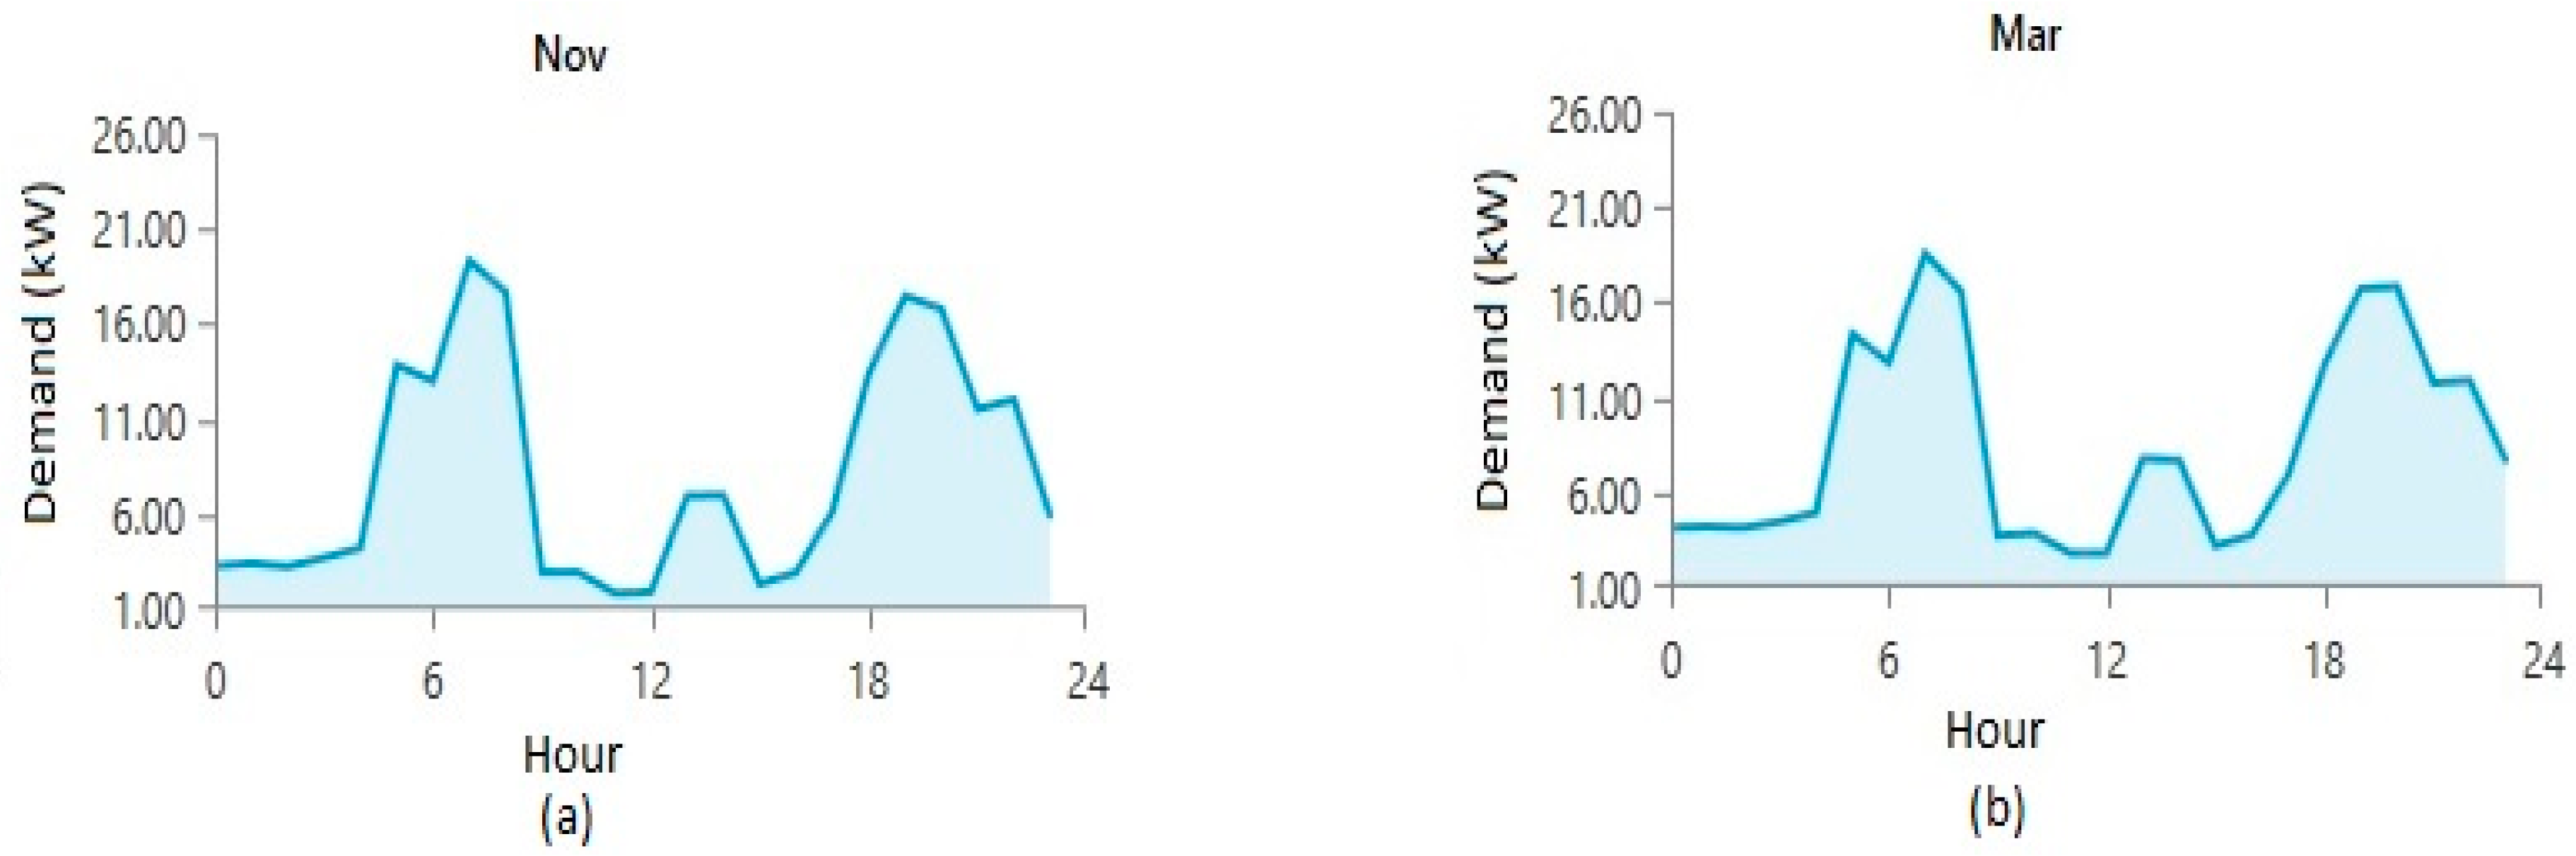
The typical hourly load profile of the selected village on a day of wet and dry seasons is illustrated in
Figure 1. Observation of the load profile reveals two important peak demand periods between 06:00 and 09:00 and 19:00 and 21:00, which are both due to normal morning and evening/night activities, such as lighting, cooking, ironing etc. However, the majority of residential load runs only for a few hours during the daytime (i.e., 24 h). Lighting load, for example, operates mostly during the night, while domestic appliance load runs for only a few hours [
28]. Based on this, the total annual average energy consumption and peak load for this location were found to be approximately 200 kWh/day and 25.52 kW, respectively, with a load factor of 0.33 for a sample of 20 households. However, 20 households were sampled to create a reasonable remote rural size sampling. A daily and time-step random variability of 15% and 10% was specified to improve system reliability and to ensure correct estimation of the peak load [
29].
2.2. Solar Radiation and Temperature
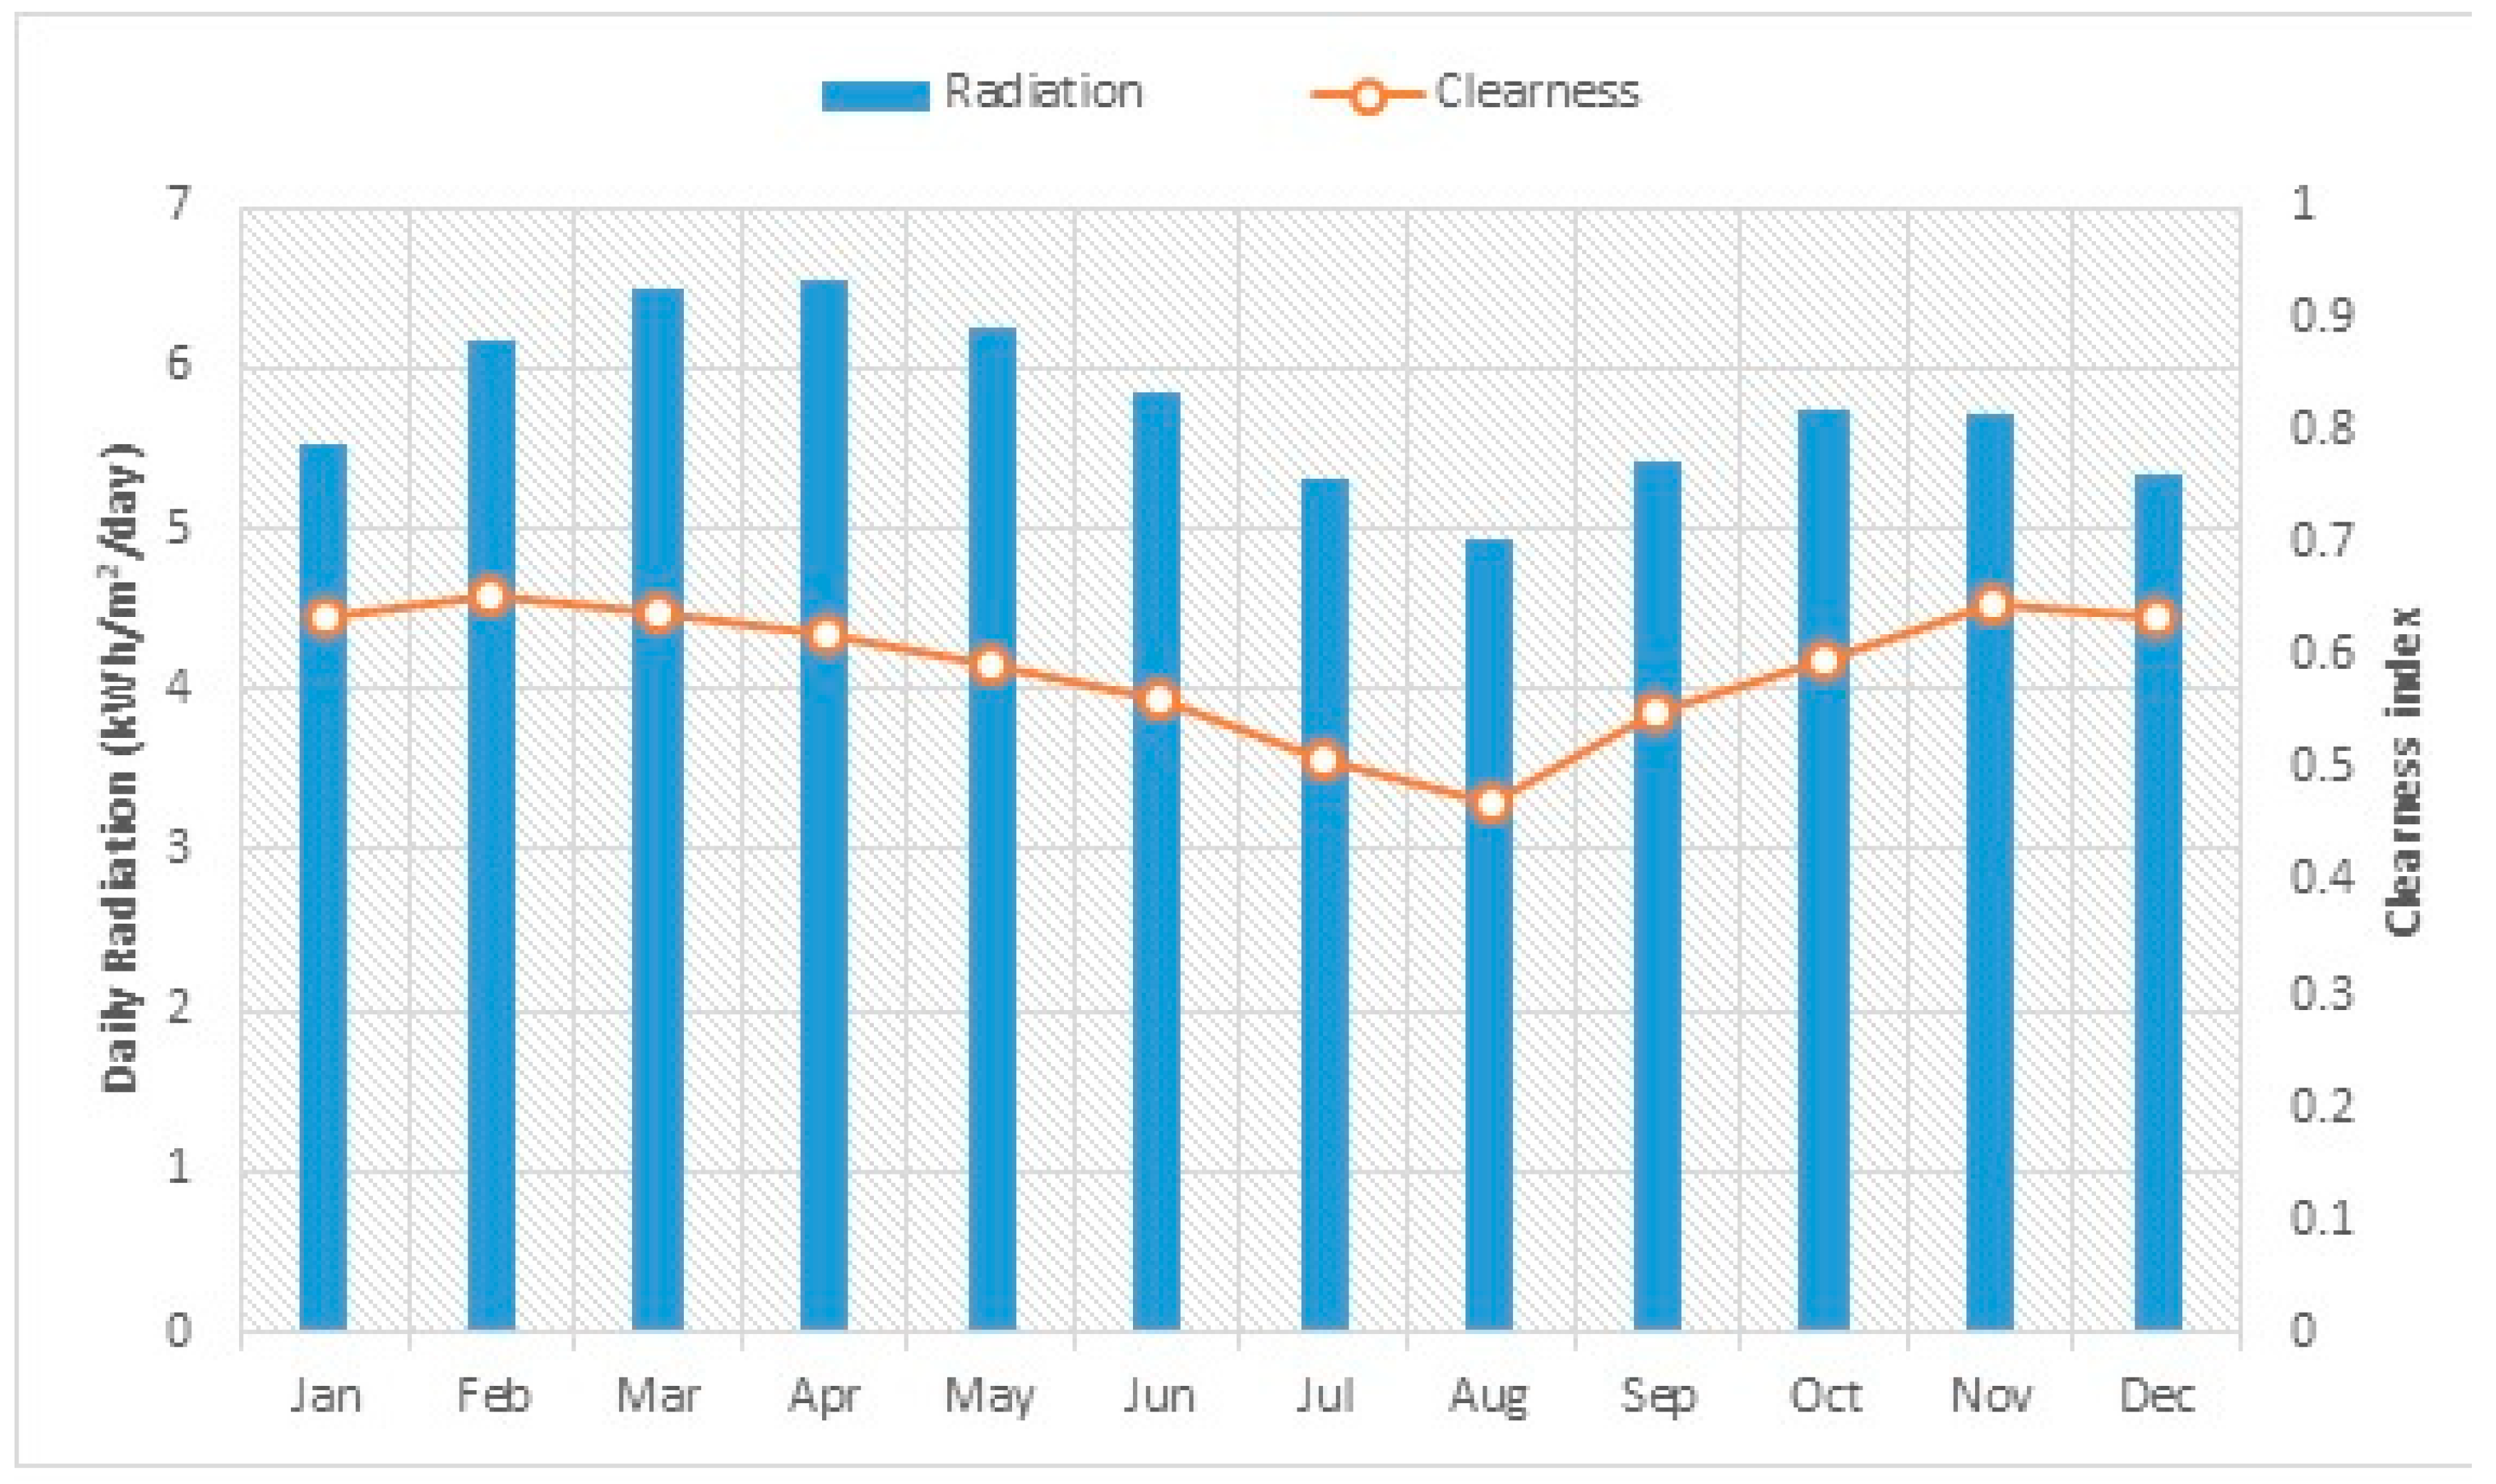
Figure 2 presents the changes in the monthly solar irradiation data for the selected village as obtained from HOMER via the NASA satellite database [
30] using the coordinates of this location. The energy output from a PV system depends mainly on the ambient temperature and the amount of solar irradiation over a specific area at a particular point in time. Hence, the power output is expected to vary due to the different values for solar irradiation and ambient temperature from one month to another. The total insolation reaching the surface of the earth depends on sky clarity and cloudiness conditions, which are very unpredictable [
31,
32]. Solar energy has a huge deposit in comparison to other RESs available in Nigeria [
15]. The annual mean solar radiation on a horizontal surface of the site is 5.78 kWh/m
2/day with a sunshine average of 6.5 h per day [
14,
30]. However, all months have a radiation intensity above 4.9 kWh/m
2/day with the highest intensity recorded during April. The monthly average solar irradiation varies between 4.94 kWh/m
2/day and 6.56 kWh/m
2/day. Based on this, it can be stated the study site exhibits better potential solar radiation than required for PV application.
Furthermore, the months of July and August recorded low global solar radiation due to heavy overcast conditions that exist during this period in Nigeria [
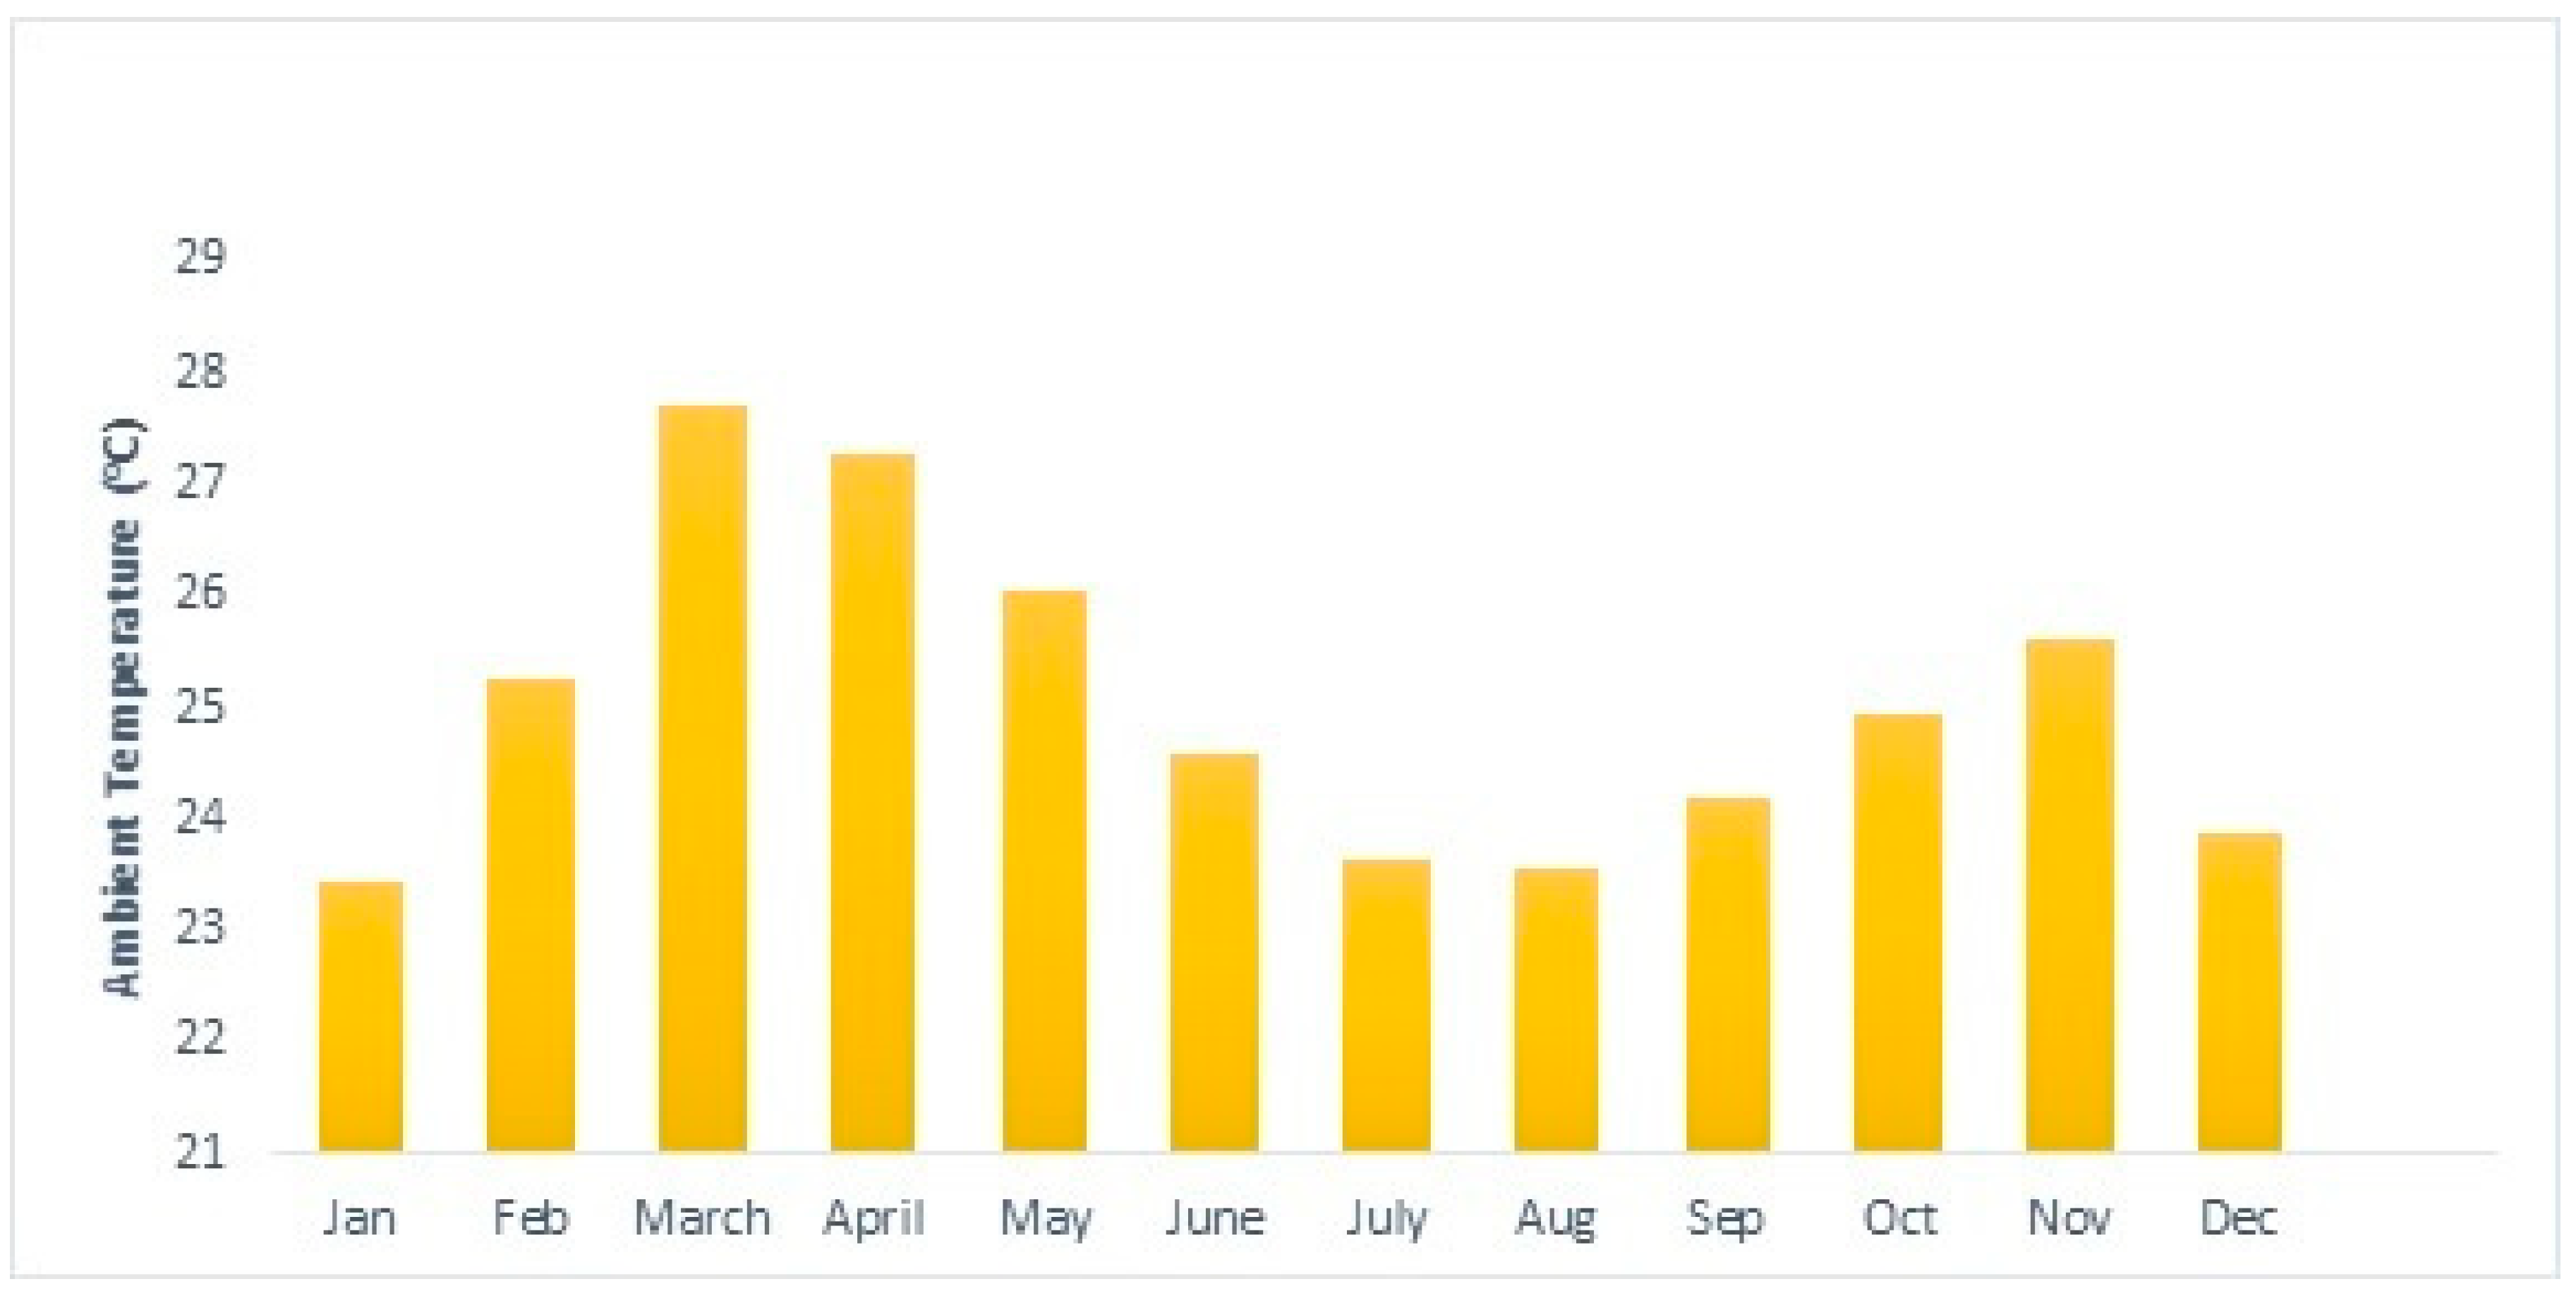
25]. The ambient temperature, on the other hand, affects the performance and power production level of PV panels. The influence of temperature on the PV module depends on the mounting configuration and climatic conditions of a particular place [
33]; hence the need to consider variations in the ambient temperature of this location.
Figure 3 shows the monthly mean ambient temperature as retrieved from the NASA database.
The mean ambient temperature per month exceeds 27 °C between March and April. Moreover, January and August record the lowest monthly average temperatures of below 23.6 °C. However, the annual average temperature is approximately 25 °C. By considering available data for the ambient temperature during simulation, HOMER evaluates the cell temperature for each time interval and takes the value into account while computing the output power of the PV system.
2.3. Wind Speed
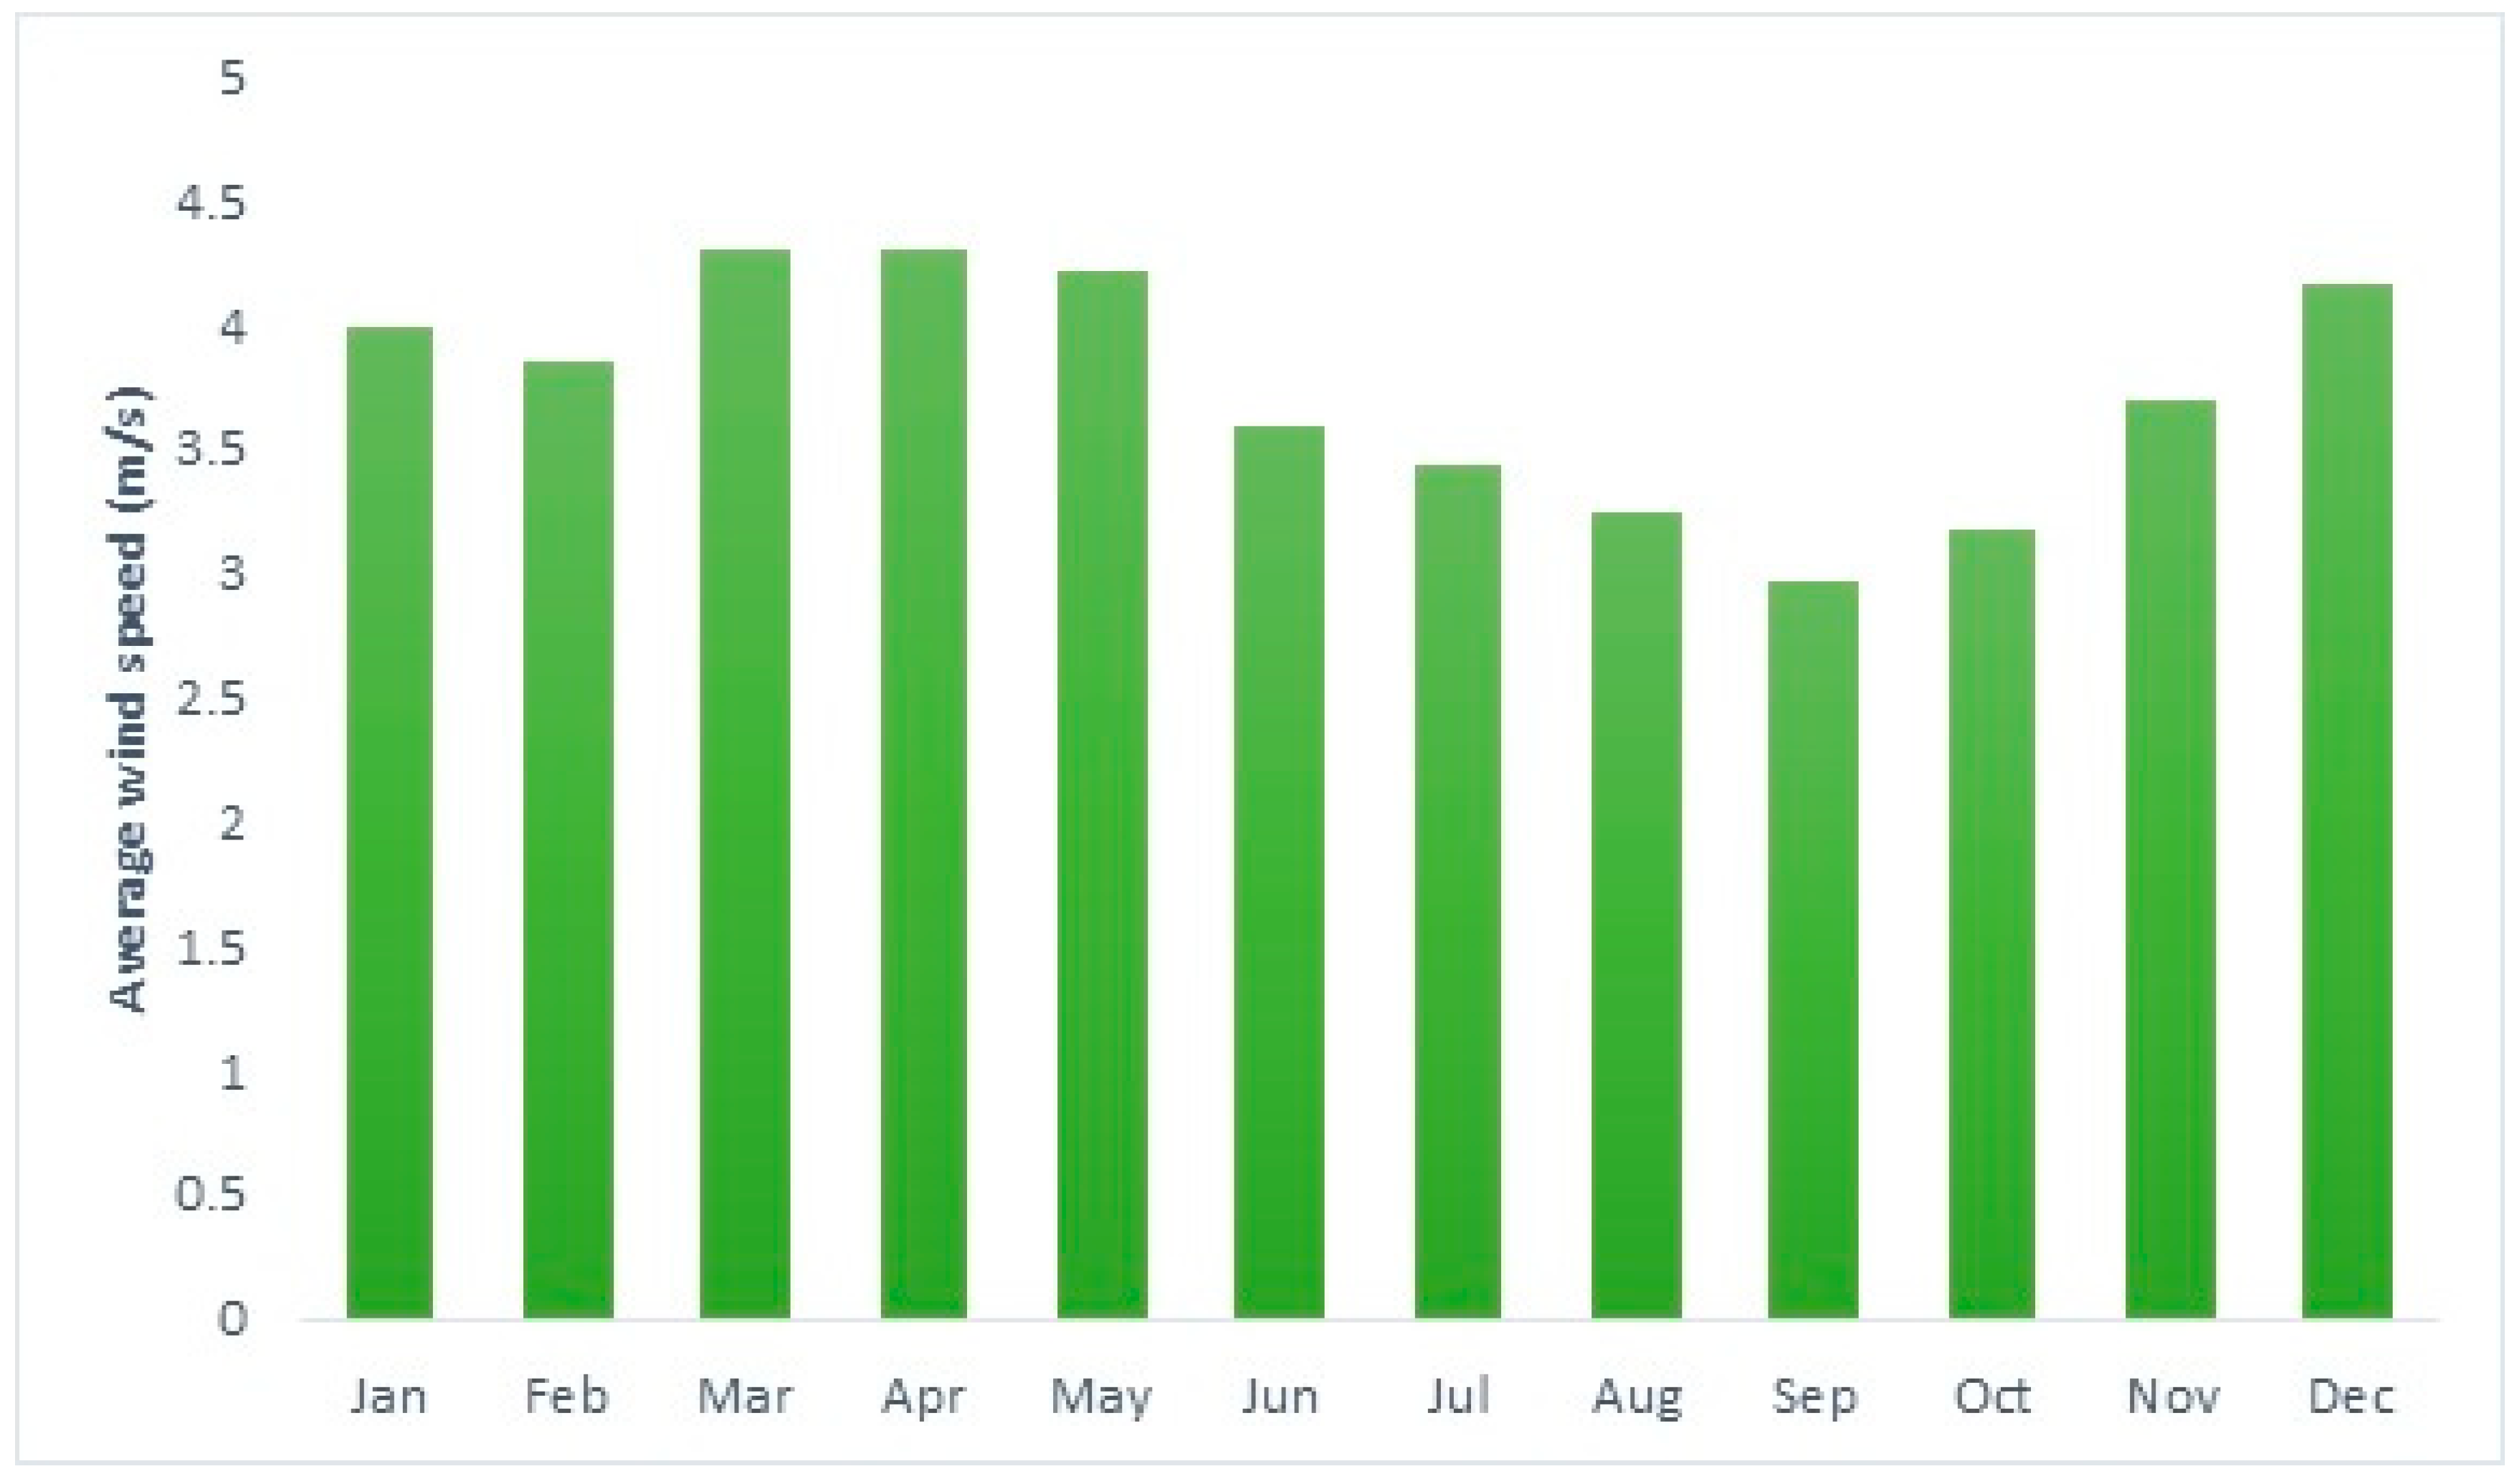
Electricity is produced from wind energy whenever wind hits a wind turbine’s blades. The rotating blade of a wind turbine converts the kinetic energy established by air in motion to rotational energy, by moving a shaft coupled with a generator; electrical energy is thereby generated via electromagnetism [
34]. The monthly average wind speed displayed in
Figure 4 was retrieved from the NASA database at 10 m above sea level using an anemometer [
30].
The annual averaged wind speed is 3.74 m/s, ranging between 2.96 m/s and 4.31 m/s. Vegetation cover and topographic features are among the factors that cause variation in the wind patterns observed [
35]. Once the average monthly wind speed data is entered, HOMER will create a synthetic hourly value for a year from this data with four other statistical variables, including the auto- correlation factor for 1.00 h (taken as 0.85), the Weibull shape factor (k = 2), and the hour of peak wind speed and the diurnal pattern strength of 15 h and 0.25, respectively [
36].
2.4. Diesel Fuel
According to the National Bureau of Statistics, the current diesel fuel price in Nigeria is
$0.63 per liter [
37]. It is worth noting that variation in the diesel price strongly depends on the foreign currency exchange rate coupled with the Federal Government of Nigeria’s inconsistent policy on fuel subsidies. However, diesel prices may likely be higher than the normal price in some parts of the country because of the poor state of the roads and the distance of these places from fuel depots.
2.5. System Detail and Component Specification
The HPS under study is made up of five major components which are comprised of PV, batteries, a power converter, a wind turbine, and a diesel generator. All feasible scenarios were adequately simulated and analyzed. Each system design is made up of two parts: the off-grid design and the grid-connected system. The renewable energy system serves the load according to the excess electricity stored in the battery bank, which is useful in the event the RESs are unable to adequately meet load demand under the off-grid scheme. The diesel generator operates as a back-up power source. Conversely, in the on-grid scenario, the power supply from the utility grid is responsible for meeting the load requirements when the RESs cannot meet power load demand, in addition to effectively using the excess electricity. In both scenarios, the accurate and best integration of system components is anticipated to discover the necessary and achievable benefits.
The diesel generator is employed in the supply of power to the load whenever the minimum load ratio is 25% or above, as recommended by the majority of generator manufacturers, in order to increase the generator’s lifespan, in addition to reducing the number of pollutant emissions [
38]. Several parameters were varied in the proposed design in order to ensure the criteria proposed for flexible configuration were realized, in addition to investigating the operational behavior of the design. However, the optimal configuration is anticipated to perform better for any variation that arises during the project’s operational lifetime. Detailed information on input parameters for individual components along with their lifespan is specified. The model specification and costs of the main components of the HPS are presented in
Table 2. The grid system, on the other hand, is modeled in HOMER as a component from which the HPS can buy AC power and to which it can sell excess AC power.
The grid power price, which refers to the amount the utility grid charges for purchased energy, is
$0.1/kWh: at US
$1 = N360.5 for residential users [
5]. The cost of energy in Nigeria is fixed by the distribution companies.
However, the sell-back price, which represents the price the national grid pays for electricity sold to the electric grid, is expected to be higher than the grid power price. This increase is a result of government financial aid and feed-in-tariff policies, which are usually provided to accelerate renewable energy technology investment. Wind power and solar PV are awarded a lower per kWh price due to their generation cost [
39]. According to Nigeria’s renewable energy feed-in-tariff plan (REFIT), the tariff shall be reviewed every three years. This implies that the resulting price per kWh will either increase or decrease based on the levelized cost of energy and long-term marginal cost [
5]. In this study, two different scenarios, including an off-grid and grid-connected design, were evaluated in addition to performing a comprehensive sensitivity analysis to justify the level of adaptability required to achieve an optimum configuration, making several changes to variables that directly influence system cost and operational behavior.
2.6. System Constraints and Dispatch Strategy
A dispatch strategy is essential for any system that comprises one or more generators and a battery storage system, which controls the charging of the battery [
36]. The dispatch influences the life-cycle cost via both the battery lifetime and fuel consumption [
40]. Two categories of dispatch strategies can be modeled in HOMER software: load following (LF) and cycle charging (CC). Under the LF strategy, the wind turbine and PV power source charge the battery while the generator operates to serve the load. Under the alternative strategy (i.e., CC strategy), the generator runs at its peak rated power to meet the load demand with surplus energy used for charging the battery. Due to its environmental and economic benefits [
21], the LF strategy was employed in the analysis and system design of parameters in the present study.
The proposed system’s operating lifetime was taken to be 20 years. Constraints are prerequisites that must be satisfied by the system, otherwise, HOMER discards those systems that fail to fulfill the specified constraints. To ensure continuous electricity supply in the event of an unexpected decrease in renewable power output or a sudden spike in load demand, the operating reserves, which are a function of both the renewable output and load, were set at 10% of load in current time step, 50% and 25% were specified for the wind and solar power output. The higher reserve specified for renewable energy output is due to its inherent unpredictability [
13]. The maximum unserved load was assumed to be 0%, while a range of 0% to 100% was considered for the maximum renewable fraction.
2.7. Mathematical Model
2.7.1. PV and Temperature Model
PV panels are made up of solar cells in a series or parallel connection and are utilized in a PV system to generate and supply power for different applications. In general, the PV system output power depends on the cell temperature and amount of solar irradiation, as well as the geographical characteristics of an area [
44]. In HOMER, PV output power is calculated as follows [
42]
where Y
PV refers to the PV power output under standard test conditions (STC) in kW, ƒ
PV represents the PV de-rating factor (%), G
T is the solar radiation incident on the PV panel in the current time step (kW/m
2), G
T,STC refers to the incident radiation under standard test conditions (1 kW/m
2), α
p is the temperature coefficient of power (%/°C), T
C is the temperature of the PV cell (°C), and T
C,STC is the PV cell temperature at STC (25 °C). The derating factor is the decrease in the output of the PV array resulting from temperature losses or any other factors that vary the expected output of the PV system under absolute conditions.
2.7.2. Wind Turbine Modeling
Wind energy is converted into mechanical power via a wind turbine and then transformed into electrical energy [
25]. However, it is necessary to evaluate the past wind power intensity (W/m
2) to examine the economic feasibility of a location since the amount of energy captured by the turbine rotor is determined by the wind speed’s cubic power. The output power of the wind turbine system is thus calculated as follows [
35]:
where ρ
0 refers to the air density at standard temperature and pressure (STP) (1.225 kg/m
3), and P
WTG,STP is the power output of the wind turbine at STP (kW).
2.7.3. Modeling of Diesel Generator Consumption
Renewable energy sources are highly dependent on environmental conditions, which greatly influence power generation levels. Hence, they are integrated into a conventional power generation system to supply continuous power output [
43]. A diesel generator functions as an uninterrupted source of energy in different hybrid energy systems and is characterized by its efficiency and fuel consumption [
19]. In this study, the diesel generator system is expected to feed the load and not to charge the battery based on the dispatch strategy employed. In HOMER, a fuel curve and linear correlation are employed while computing fuel consumption. Fuel consumption is the quantity of fuel utilized to generate electricity and is obtained from [
44]:
where F
d, a, T
d, b, P
d represent the fuel consumption rate of diesel generator (L/h), the coefficient of fuel intercept (L/kWh), the diesel generator capacity, the fuel slope (L/kWh), and the generator output, respectively. However, a and b were taken to be 0.0161 L/kWh rated and 0.2486 L/kWh output [
45], respectively.
2.7.4. Battery Storage System
The battery is a storage system required for storing electric power for reliable and efficient utilization of unpredictable RE systems. However, in most HPSs, battery energy storage is expected to start operating and supply energy stored at the time when the power output level of the RE generation system is low and unable to sufficiently serve the external load demand. The most commonly used technology for the battery in an HPS is lead-acid batteries. However, lithium-ion batteries are currently dominating the energy storage device (ESD) market for decentralized RE systems due to their extended lifecycle and high charge/discharge efficiency [
46]. The storage capacity of the battery is computed based on autonomy days and demand as follows [
47]:
where E
L refers to the average load energy per day (kWh/day), AD represents the autonomy days, η
inv denotes inverter efficiency (95%), DOD represents the depth of discharge (80%), and η
bat denotes battery efficiency (85%).
2.8. Economic Analysis and Modeling
Economics plays a fundamental role in HOMER by either minimizing or searching for the system with the least net present cost (NPC) [
36]. Current inflation and interest rates in Nigeria are 11.25% and 13.5% [
48], respectively. With regards to this, HOMER applies the equation below to find the annual real discount rate (or real interest rate):
where idenotes real interest rate, ƒ refers to the expected inflation rate, and i’ denotes the nominal discount rate.
2.8.1. Net Present Cost (NPC)
The NPC consists of the initial capital cost, replacement cost, fuel cost, cost of grid electricity purchased, as well as the salvage and operation and maintenance costs. NPC proved to be more reliable as an economic variable due to its mathematical foundation than the levelized electricity cost, which is somewhat arbitrary [
49]. The following equation is used to compute NPC [
41]:
where C
ann,tot refers to the total annualized cost (
$/year), n refers to the lifespan of the project (year), i denotes annual real interest rate (%), and CRF, which is a function of i and n, refers to the capital recovery factor as given in ref [
50]:
2.8.2. Cost of Energy (COE)
The COE is the average cost per kWh of effective electricity generated by the system. HOMER applies the following expression to evaluate COE [
36]:
where L
rim and L
def represent the overall amounts of load served by the system per year (primary and deferrable load), and El
grid,sales refers to the quantity of electricity sold per year to the utility grid.
2.9. Environmental Analysis and Modeling
The harmful greenhouse gas emissions in the hybrid generation system result from the quantity of fuel in-take by the diesel generator and utility grid power consumed. In this study, CO2 emissions are used to examine the environmental impact of the HPS.
CO2 Emissions Modeling
The total amount of CO
2 emitted by any hybrid generation system will depend on whether the system includes non-renewable energy sources or not. HOMER computes the emissions factor for individual pollutants before simulation and multiplies this factor by the net annual fuel consumption to determine the annual emissions of each pollutant at the end of the simulation [
35]. The equation for computing the amount of hybrid system CO
2 emissions is given as [
12]:
where m
f refers to the amount of fuel (liter), HV
f denotes the fuel heating value (MJ/L), CEF
f represents the carbon emissions factor (ton carbon/TJ), and, X
c is the oxidized carbon fraction.
3. Results and Discussion
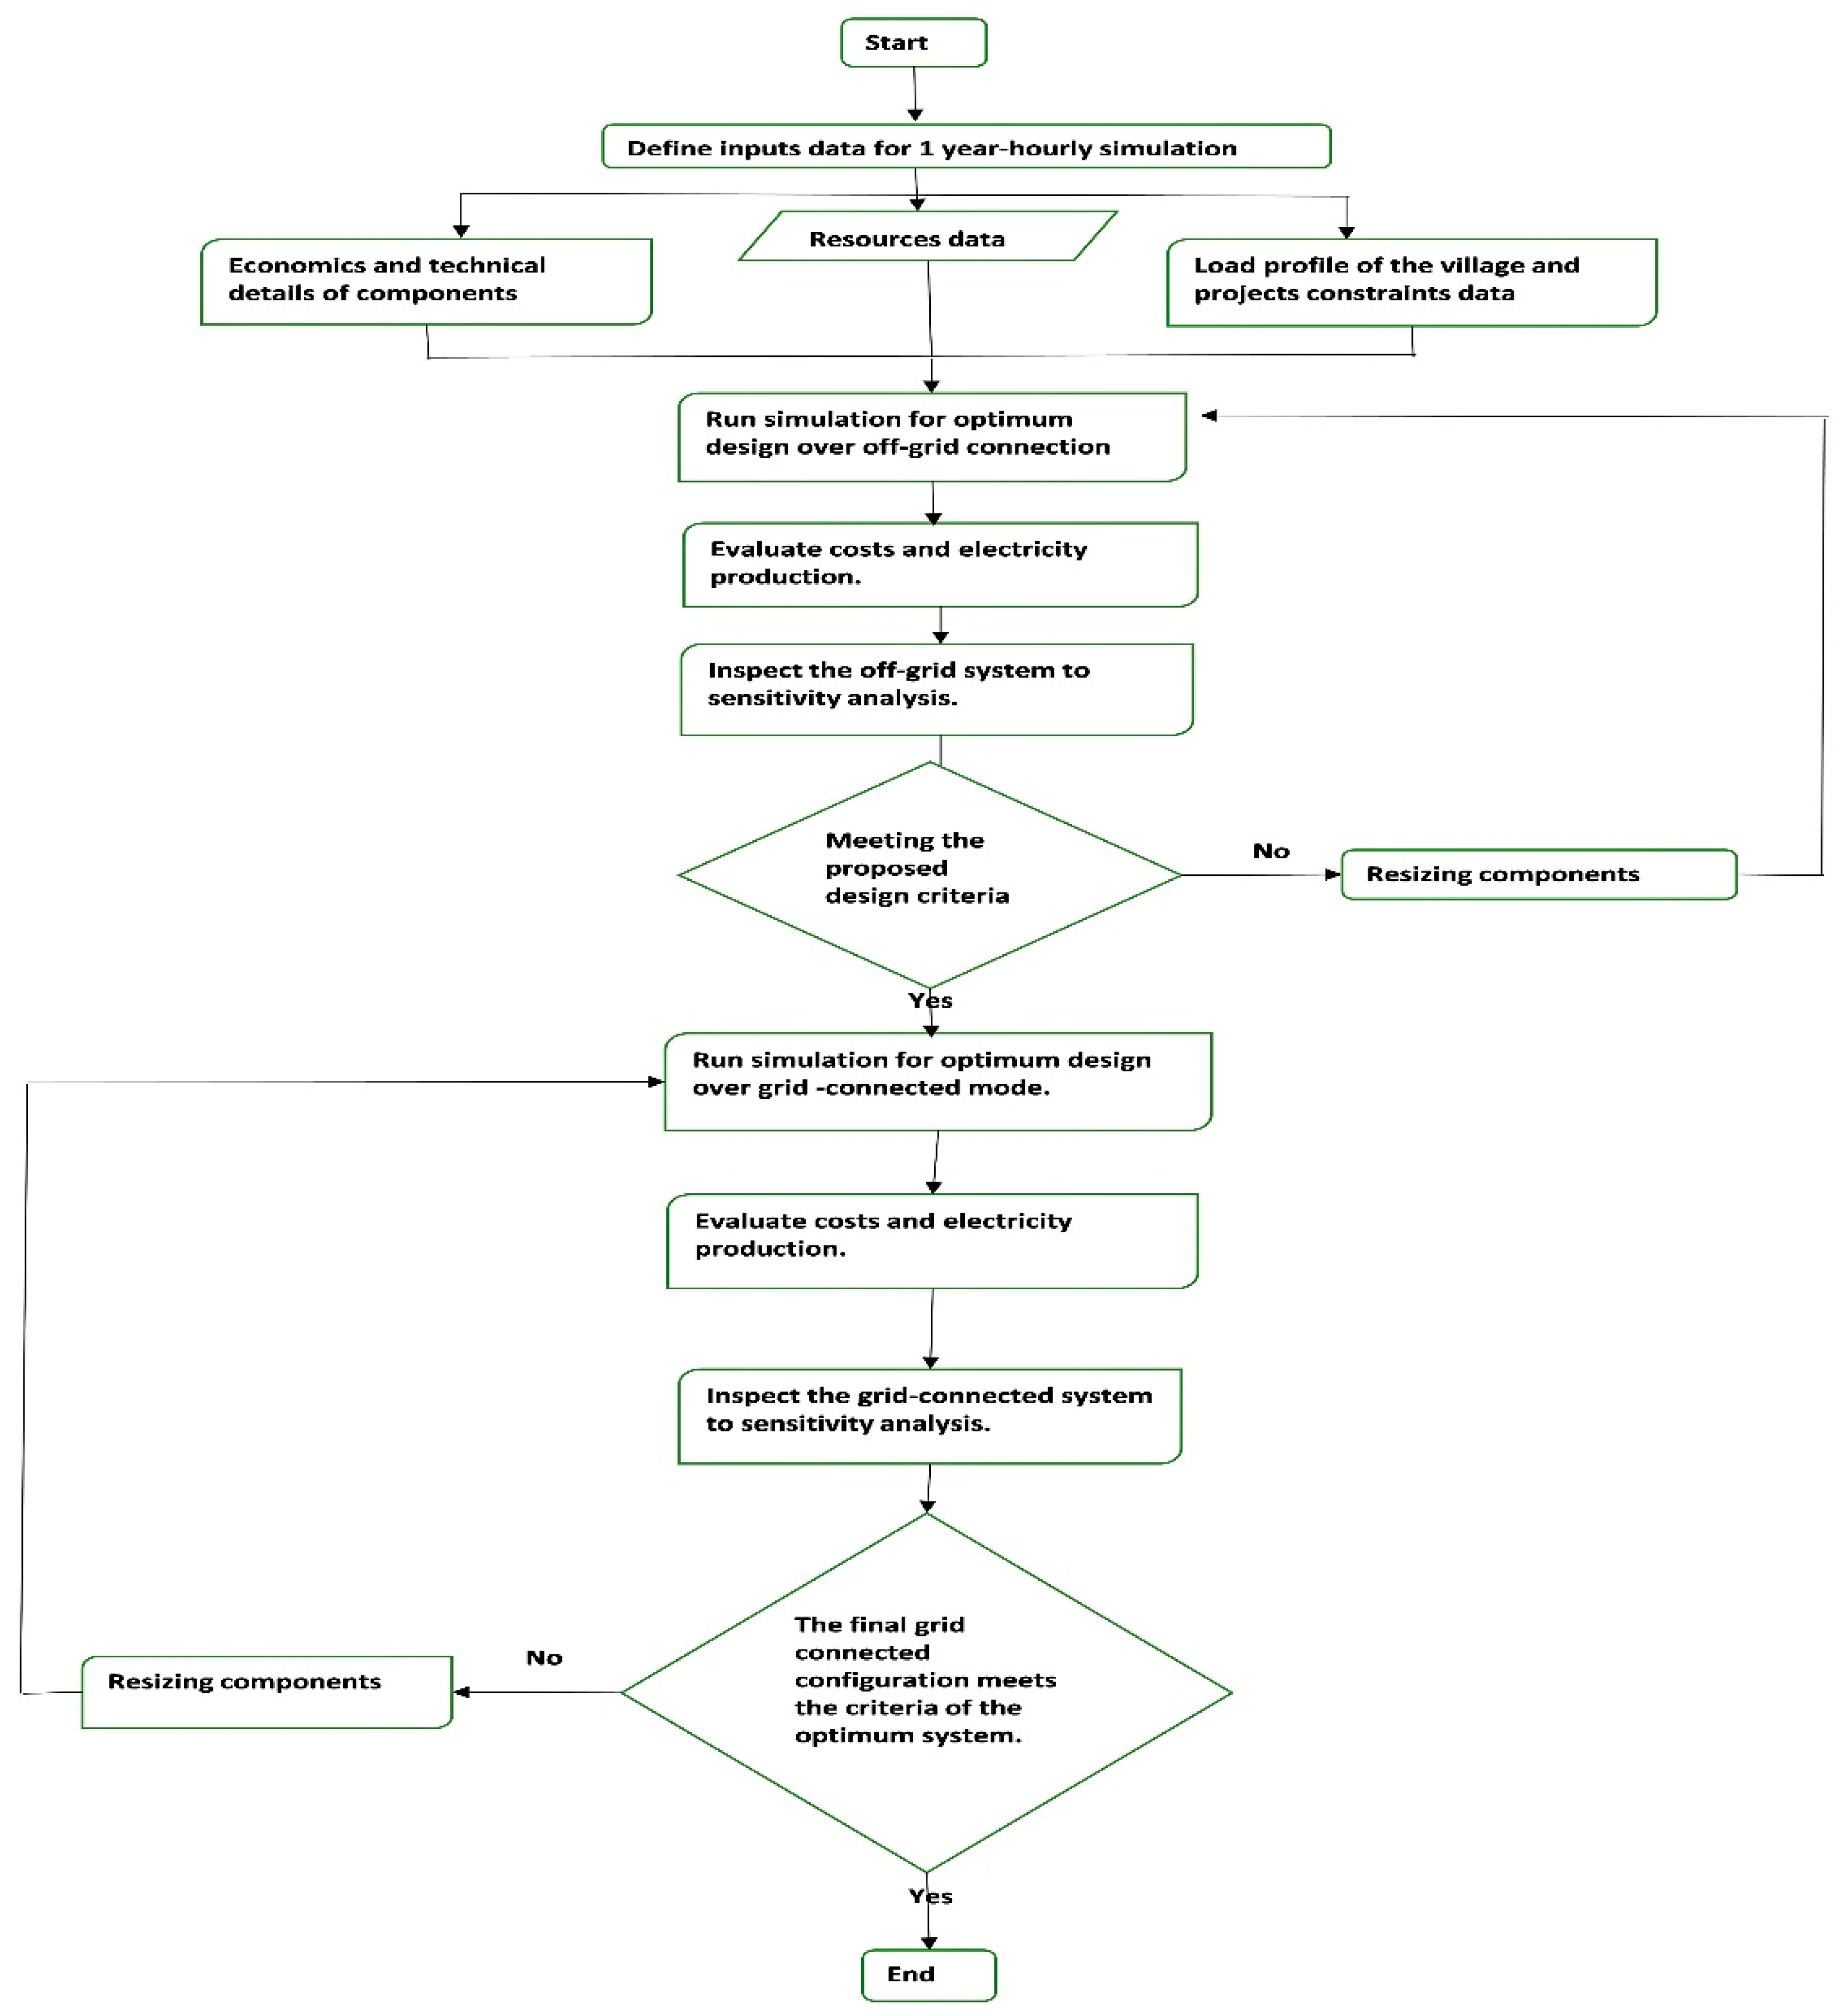
The HOMER pro software tool is employed in this study to determine the adaptability of the HPS operating in both on-and off-grid modes, as well as designing a hybrid system for optimum use of energy resources as per the study’s location, Dukke village, Nigeria, as detailed in the design procedure flowchart presented in
Figure 5. Different cases were studied with regards to the techno- economic possibility of the system. The proposed HPS is expected to undergo many changes including RE availability level, load growth, price of diesel, generator minimum load ratio, grid power and sell-back prices, and component cost over the project period of 20 years. Furthermore, the system should be able to adapt to and operate effectively under the two scenarios given, in addition to any variations in major parameters that directly influence the operational behavior of the HPS.
The system was analyzed under off-grid mode to determine the optimum combination of components as well as to evaluate its techno-economic performance and environmental impact. Moreover, a sensitivity analysis was conducted on the off-grid hybrid system to assess the effect of changing load demand, RE availability levels, and fuel price on the optimum configuration. The system was equally tested according to the utility grid connection scenario to quantify and investigate the impact of these components on the overall component mix, as well as the working performance. A sensitivity analysis was carried out on the optimum solution for the on-grid connection to examine the effect of some critical variables: grid power and sell-back prices, diesel price, and electricity consumption rate. The final configuration obtained based on the analysis is an optimum design with the capability to serve load requirements on a continuous basis in both scenarios, without making any significant changes to the design configuration.
3.1. Off-Grid Hybrid Energy System
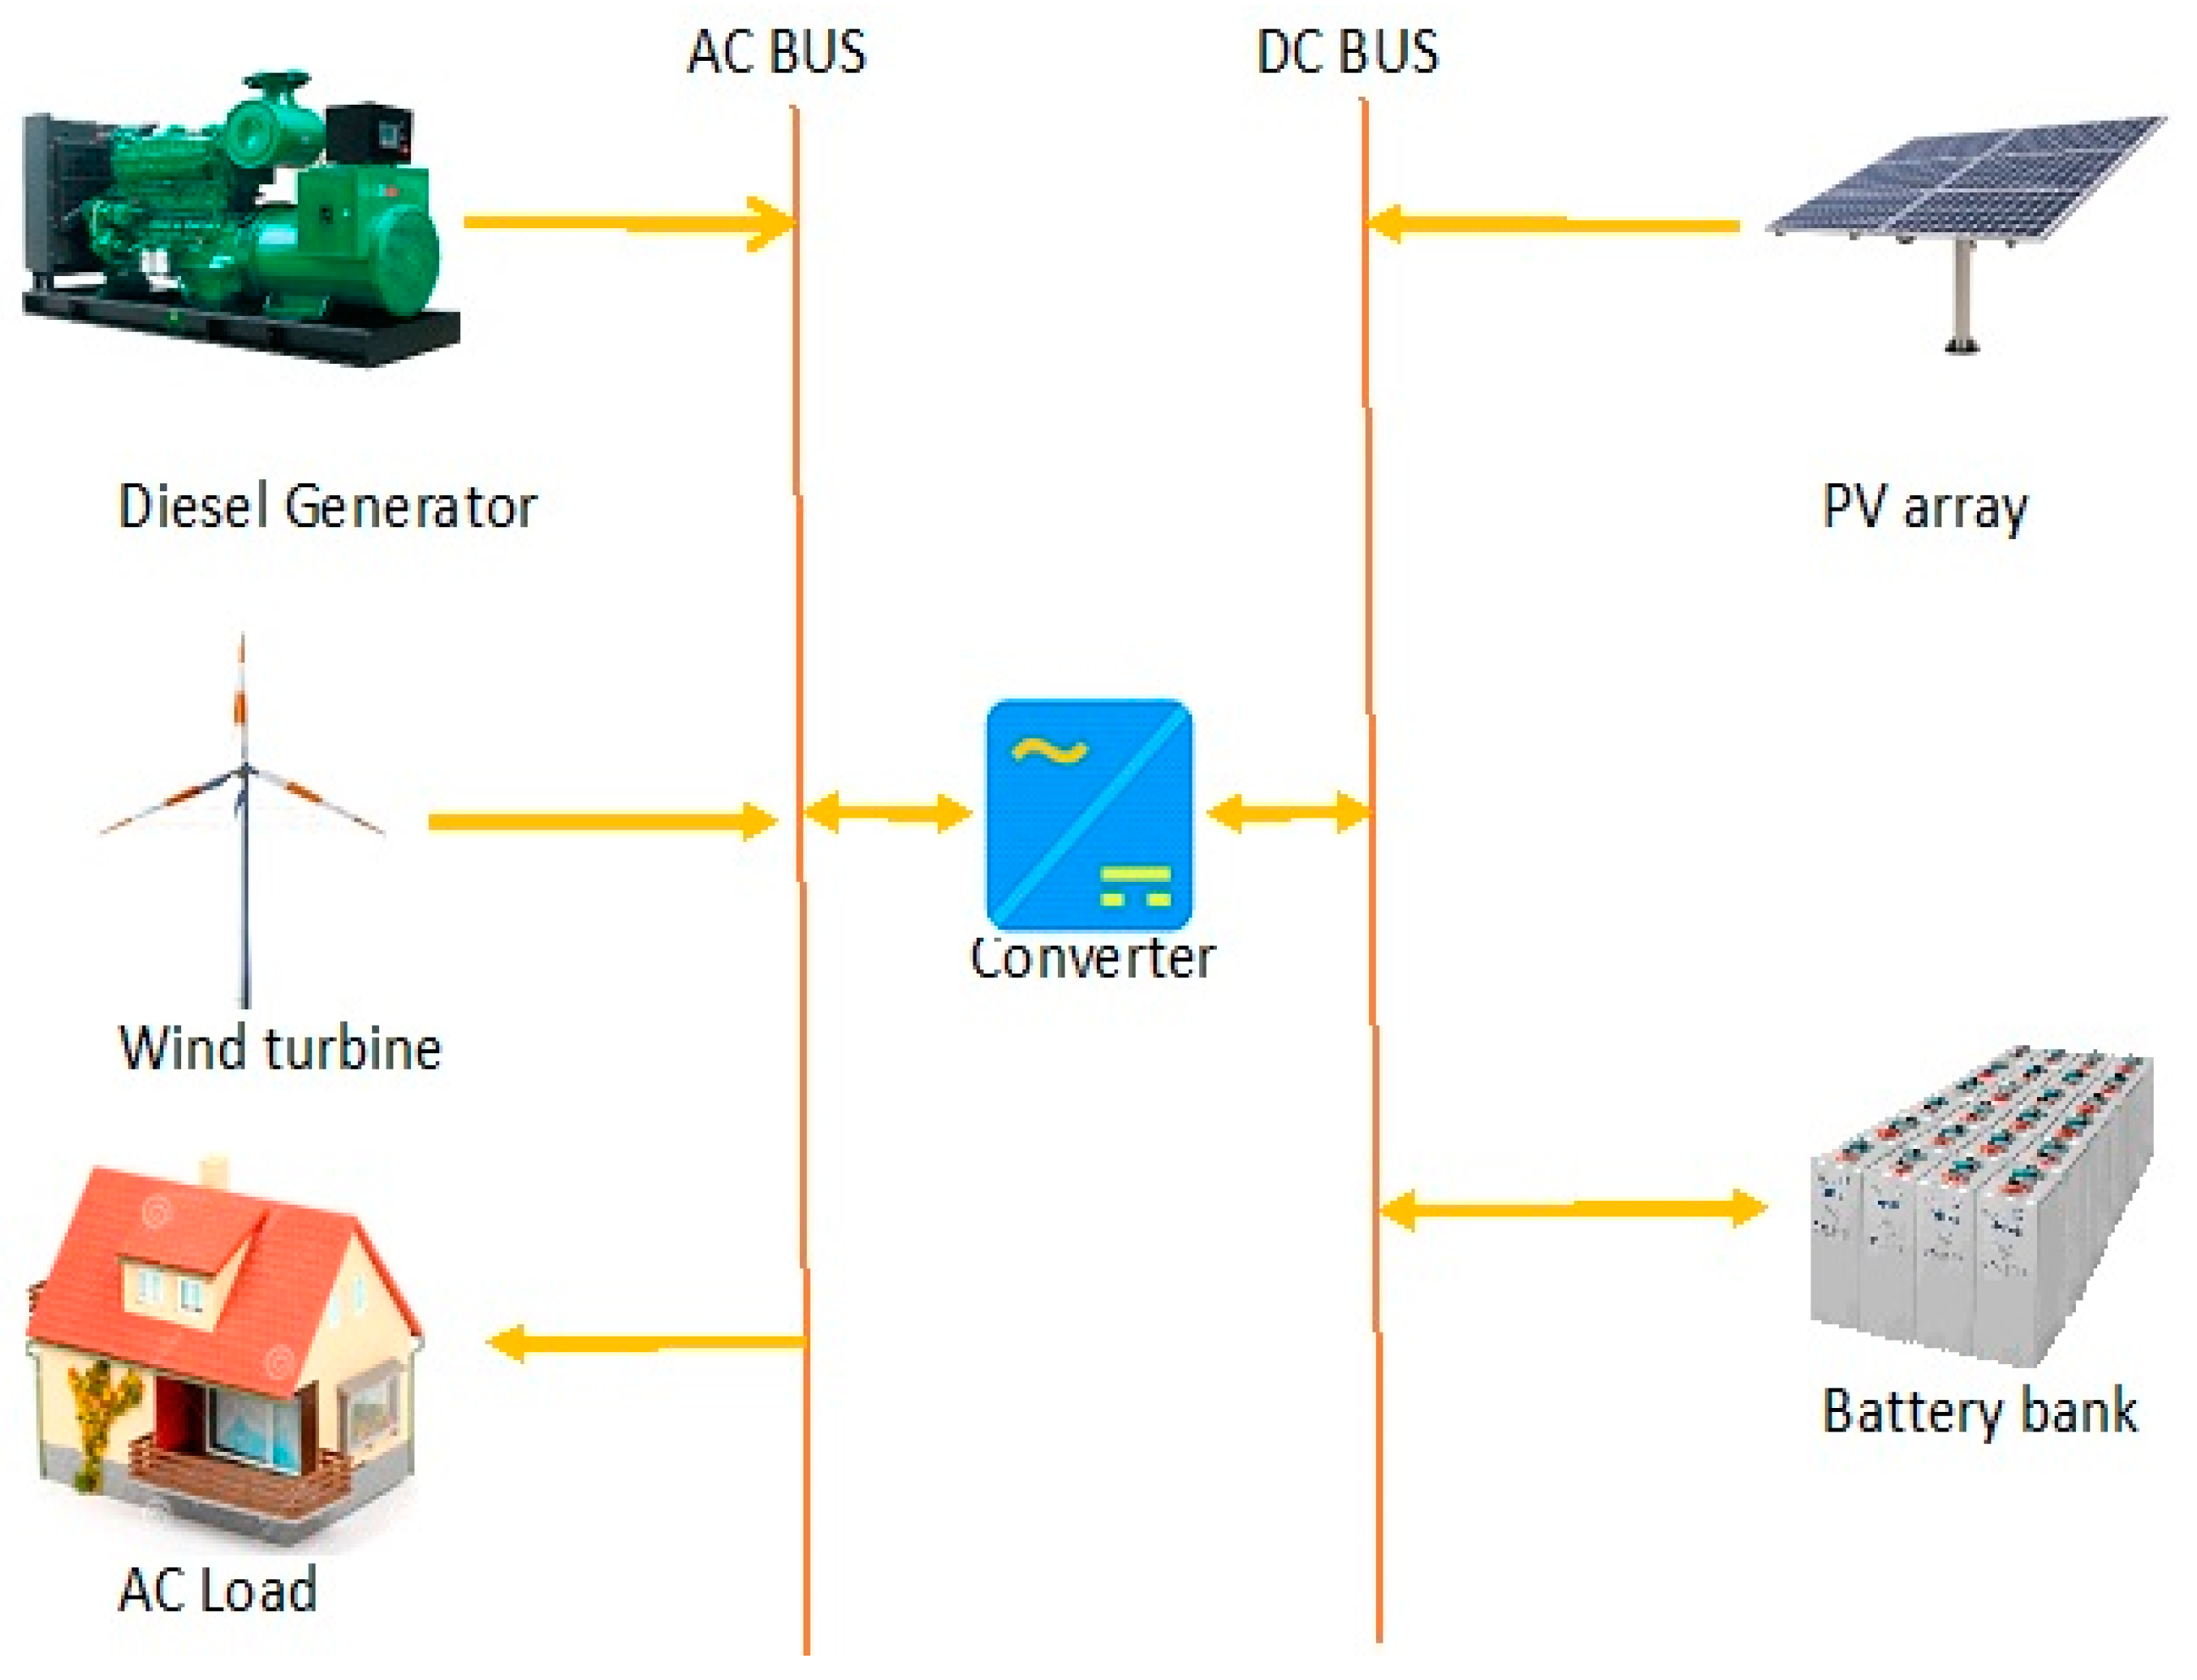
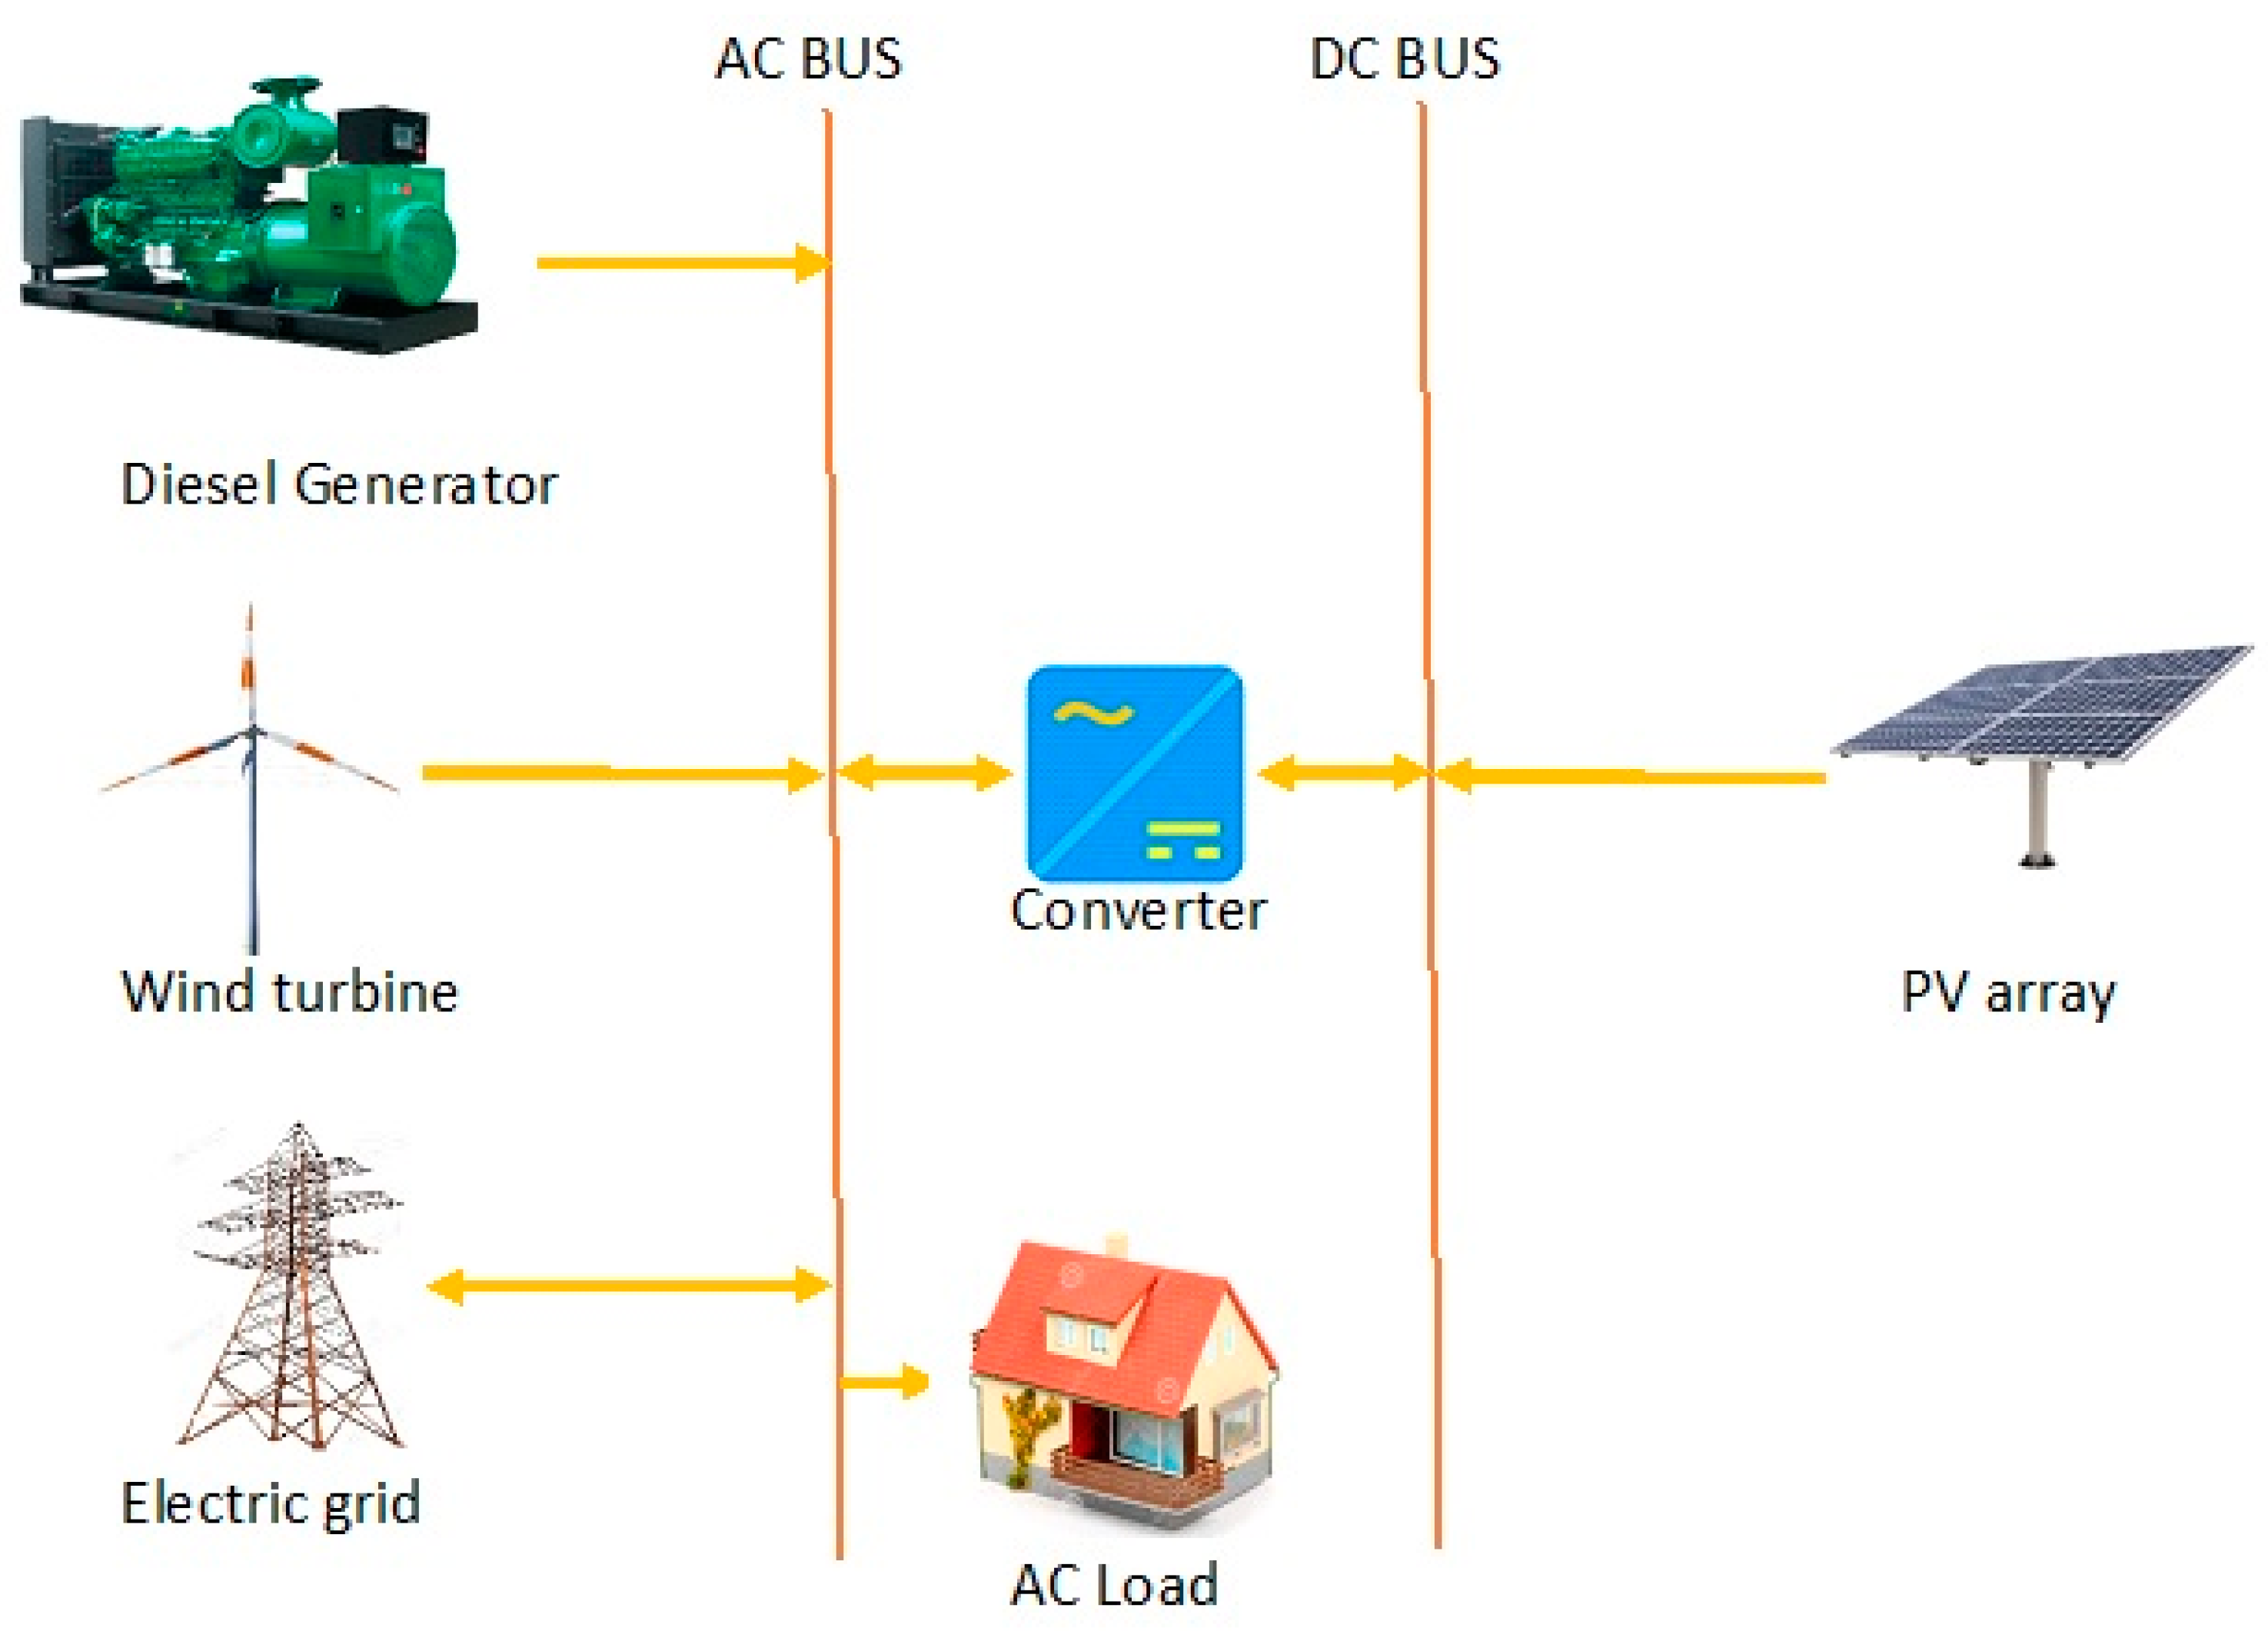
In this design, the standalone system comprises a diesel generator (DG), wind turbine, PV arrays, batteries, and a converter. These components are interconnected together to meet the energy consumption requirement of the system as the display in
Figure 6. The simulation of four different scenarios with various integrations of power sources was performed by HOMER; namely: PV/wind/battery (System 1), PV/DG (System 2), PV/DG/battery (System 3), and DG-only (System 4). Based on the dispatch strategy employed, the RESs are the main sources of the HPS. The diesel generator is operated as a back-up generation source whenever the RESs and/or the storage system are incapable of meeting the energy demand of the load. Several component combinations are selected by HOMER as the optimum system regarding NPC and COE, as reported in
Table 3. The result indicates that the optimum configuration (System 3) consists of a 21-kW power converter, 54 kW PV, 70 battery group (484 kWh nominal capacity battery bank), and a 12-kW diesel generator. The NPC, COE, Operating Cost, and Renewable Fraction (RF) are
$259,354–385,555, 0.218– 0.323
$/kWh, 2292–22,968
$/year, and 0%–100% respectively, when the capacities of the wind turbine system, diesel generator, battery storage, and PV panel are 0–1 kW, 0–20 kW, 0–761 kWh, and 0–76 kW, respectively. The result also shows that the optimum system reduces CO
2 emissions by 51,123 kg/year in comparison to the diesel-only system (System4) used in the current situation as shown in
Table 4.
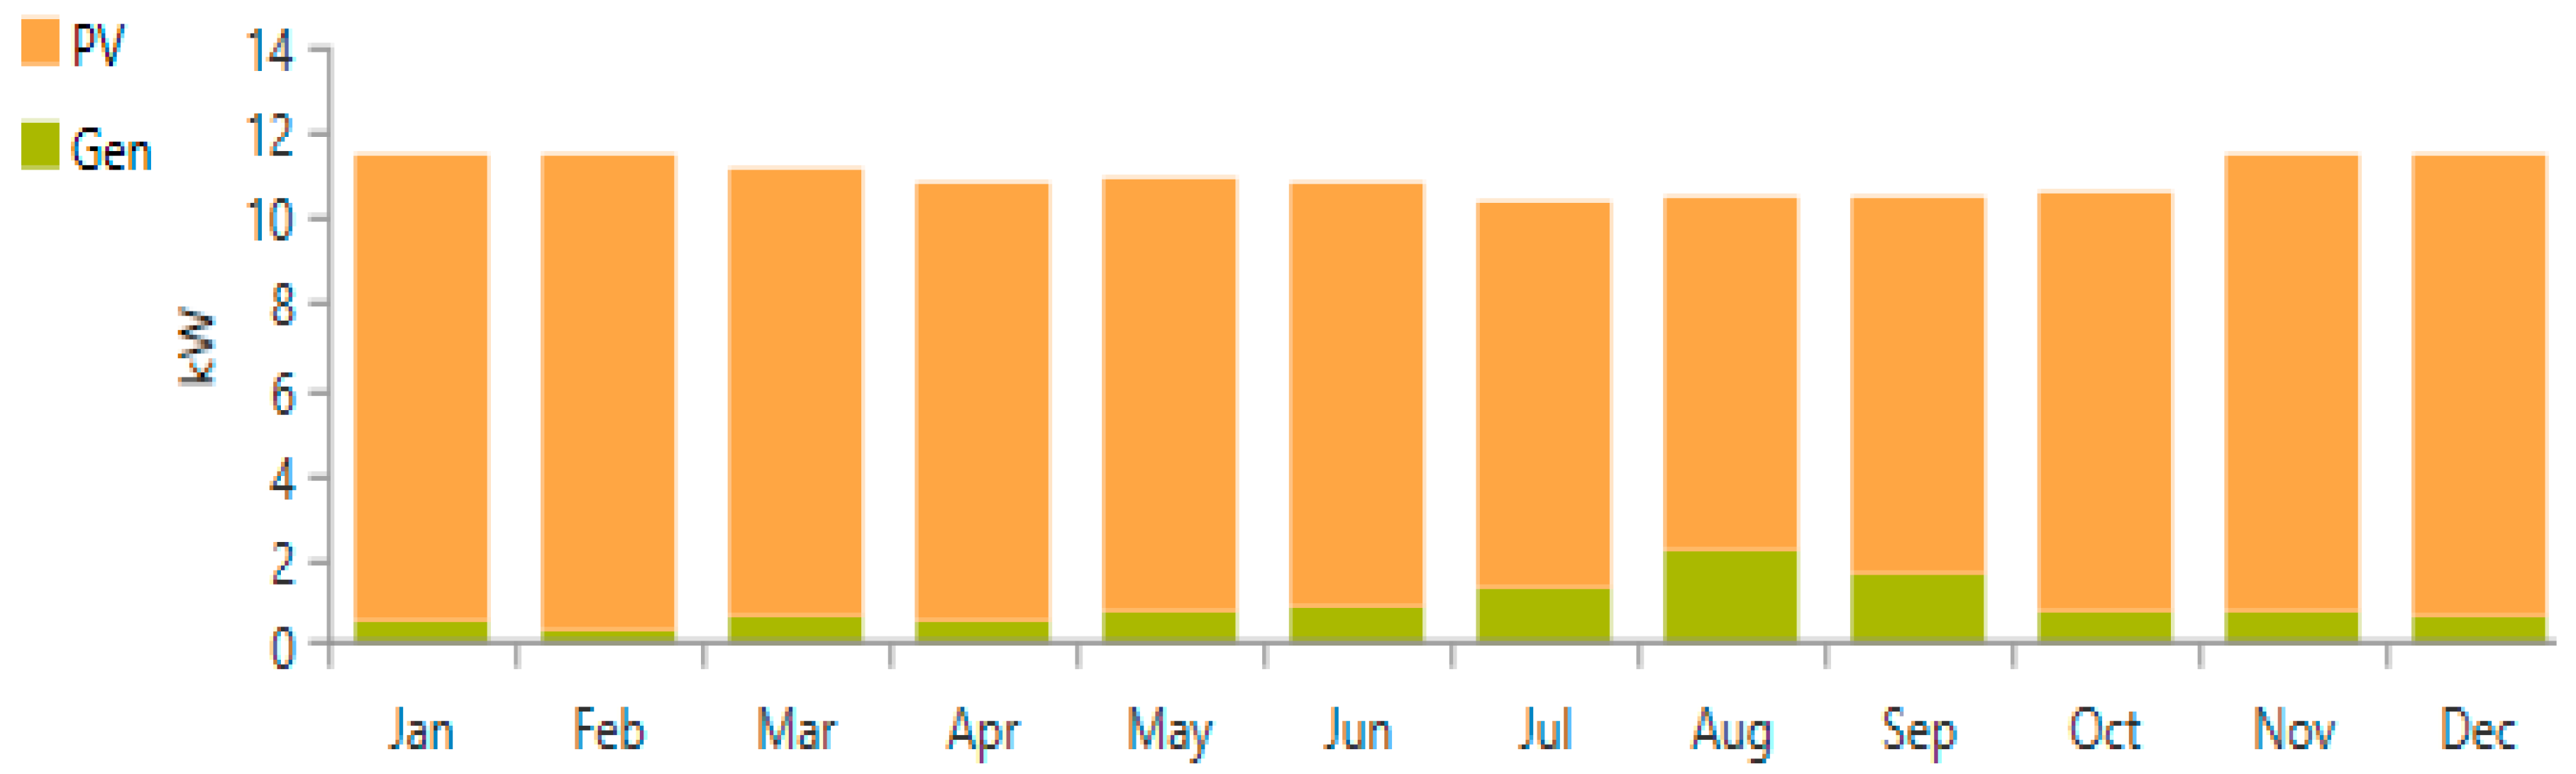
To meet the load requirement, the generator system runs for 1301 h/year and contributes to 8.51% (8,152 kWh/year) of the overall production, which leads to fuel consumption of 2278 L/year with a rate of 0.279 L per kWh. The annual generated energy of the PV is 87,661 kWh with a COE of
$0.0623/kWh. The monthly energy distribution of each energy source for a year with an optimum component combination is presented in
Figure 7.
The fact that the surplus energy produced by the off-grid system cannot be sold to the national utility grid poses a serious challenge for off-grid HPS. In this case, a small percentage of excess electricity is generated. It constitutes about 6% (5741 kWh/year) of the overall electricity production. However, the system can be connected to the national grid to sell back excess energy; in this way, all the excess electricity can be consumed, in addition to increasing the system’s earnings.
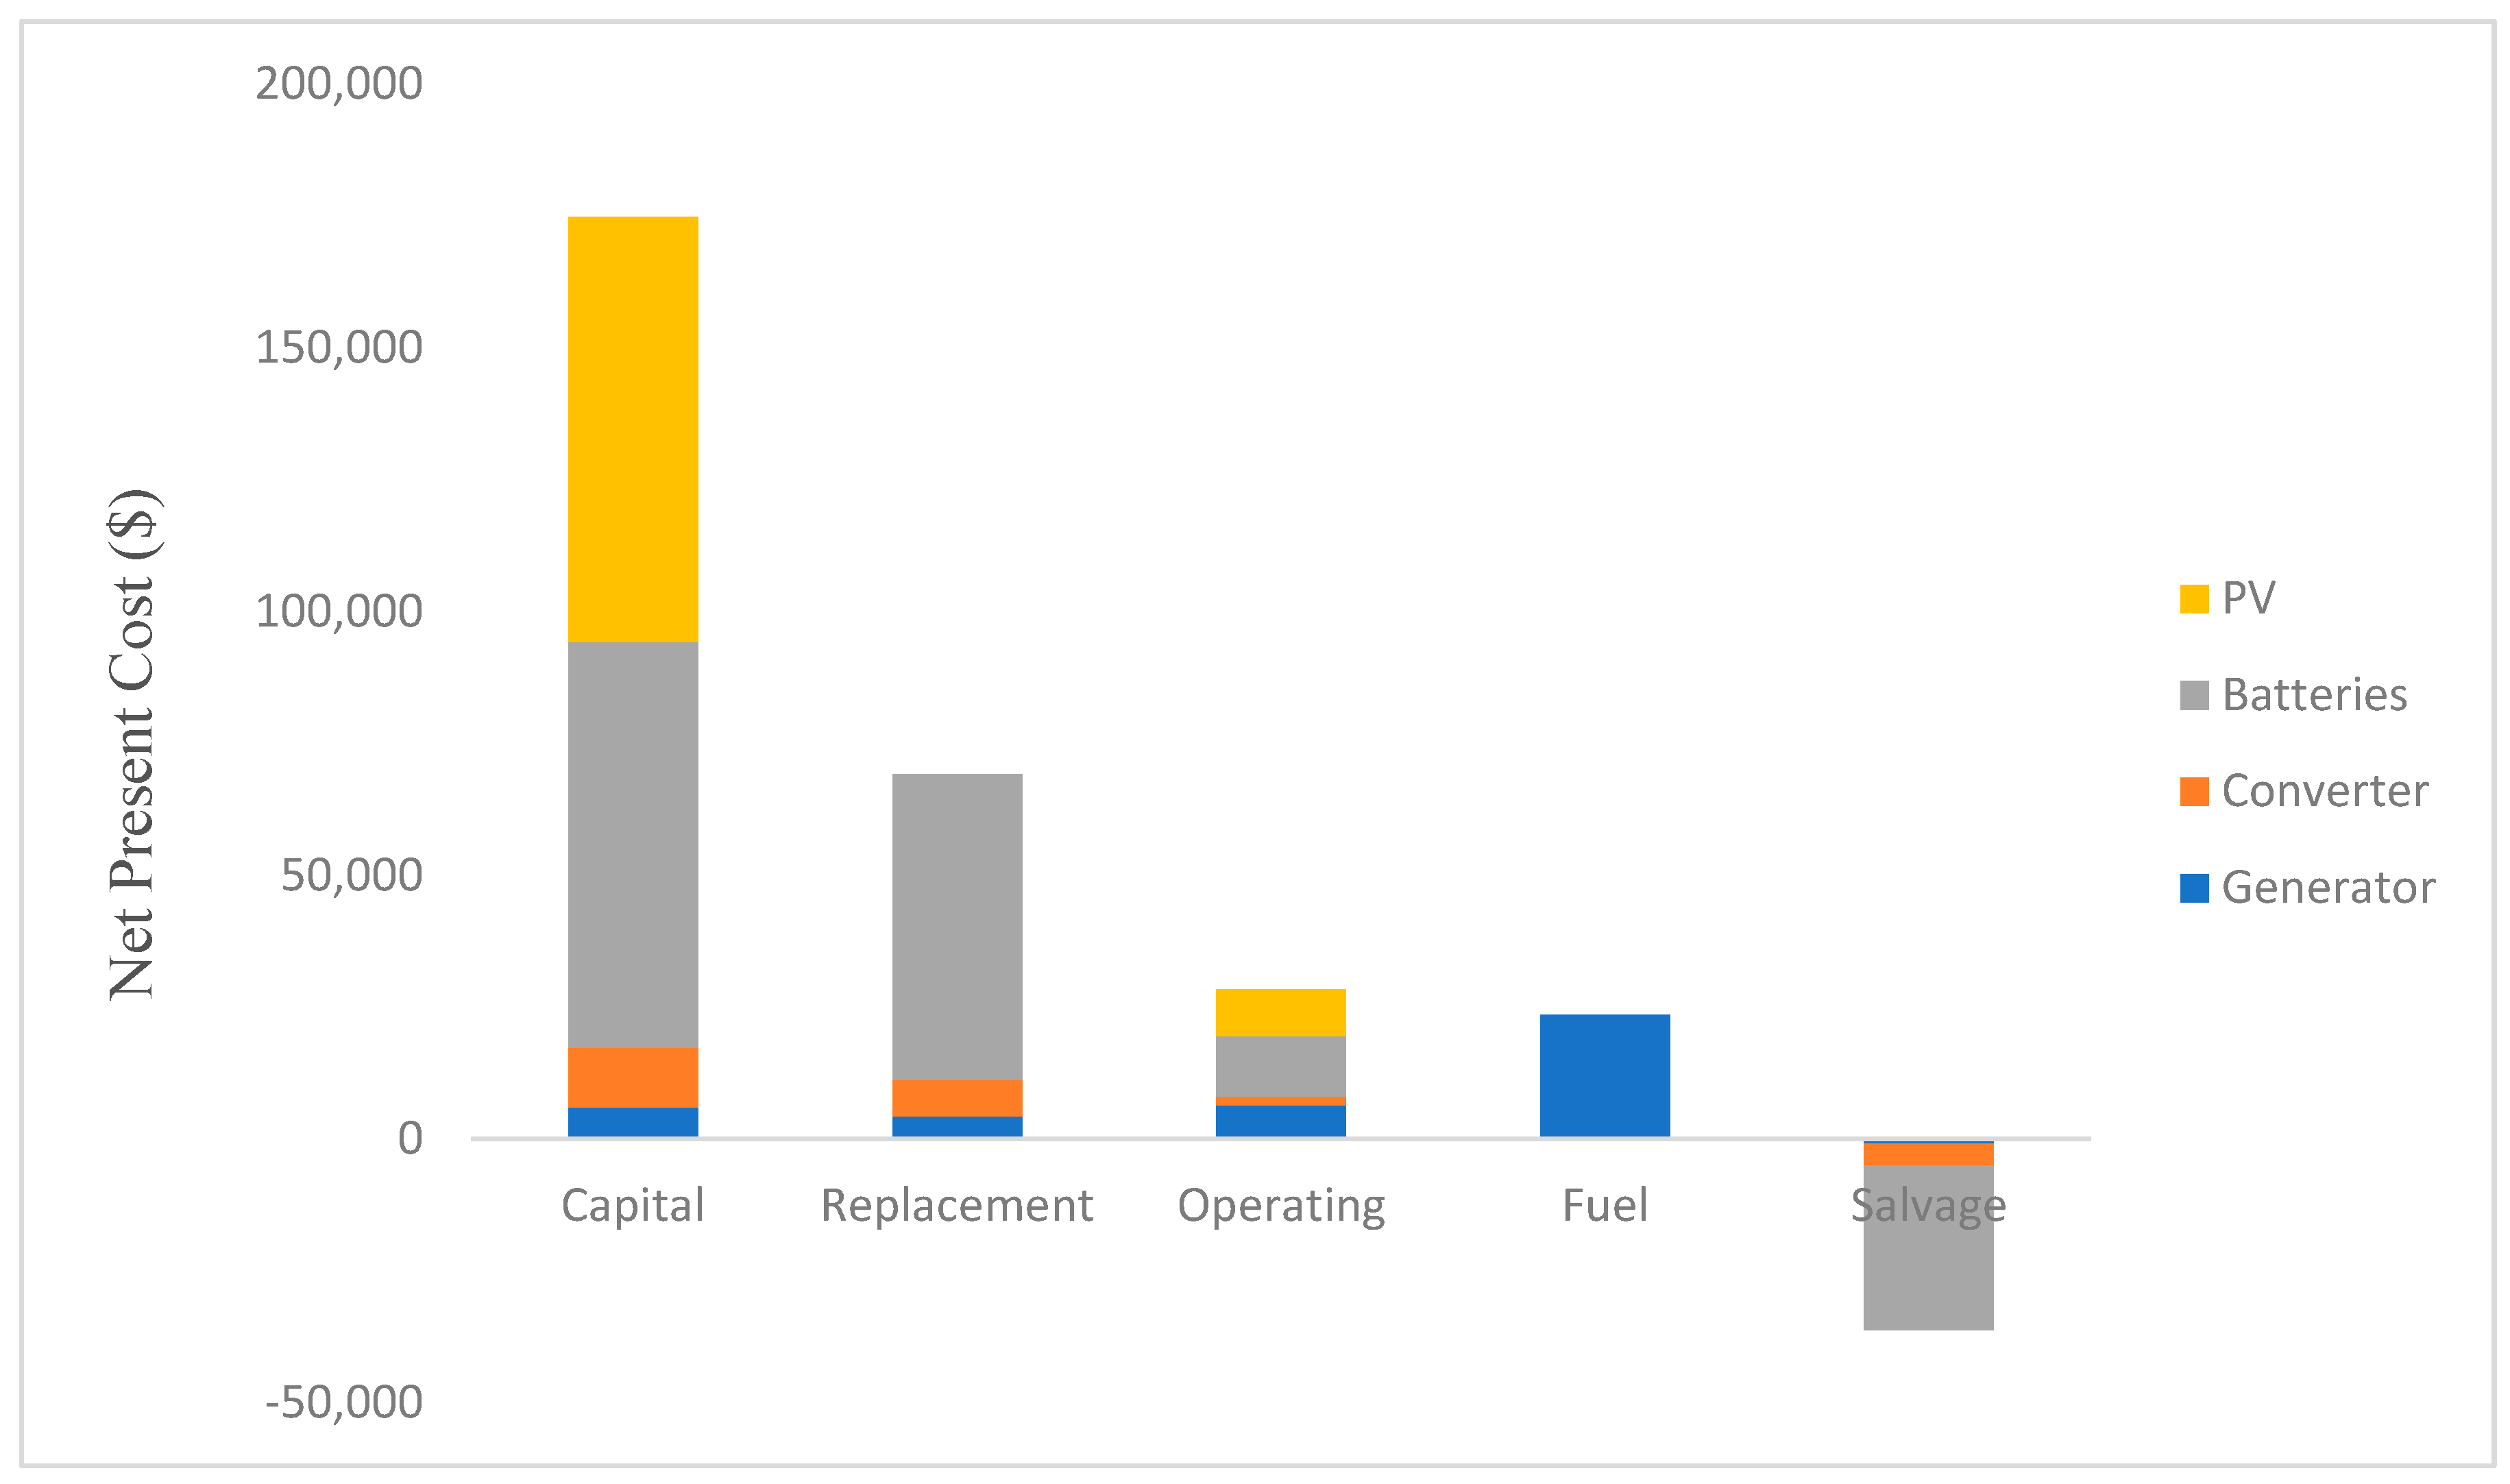
Details of the NPC of the optimized PV/battery/diesel hybrid system by cost type are illustrated in
Figure 8. A cost analysis of different cost types as a function of each component is given as follows:
The initial capital cost of the PV is around 46% of the overall capital cost of the system, closely followed by battery storage, which constitutes around 44% of the overall capital cost. The converter and diesel generator contributed about 6.44% and 3.43%, respectively. The total capital cost of the system is calculated to be $174,792, with the cost of the PV system accounting for most of the cost in this scenario.
The total replacement cost of the system is $69,138. The PV system has no replacement cost since the lifetime of this component is 20 years, which corresponds to the project’s lifetime. The replacement cost is, however, the sum of the converter, batteries, and diesel generator cost of replacement, where the storage system contributes to about 84% of the total cost due to its short- term operational lifetime compared to the overall system lifetime. The battery bank expected life and the diesel generator operational life are 14.3 years and 11.5 years respectively.
The overall operating, salvage and fuel costs of the proposed system are estimated to be $28,280, $36,322, and $23,465, respectively.
Battery Storage System
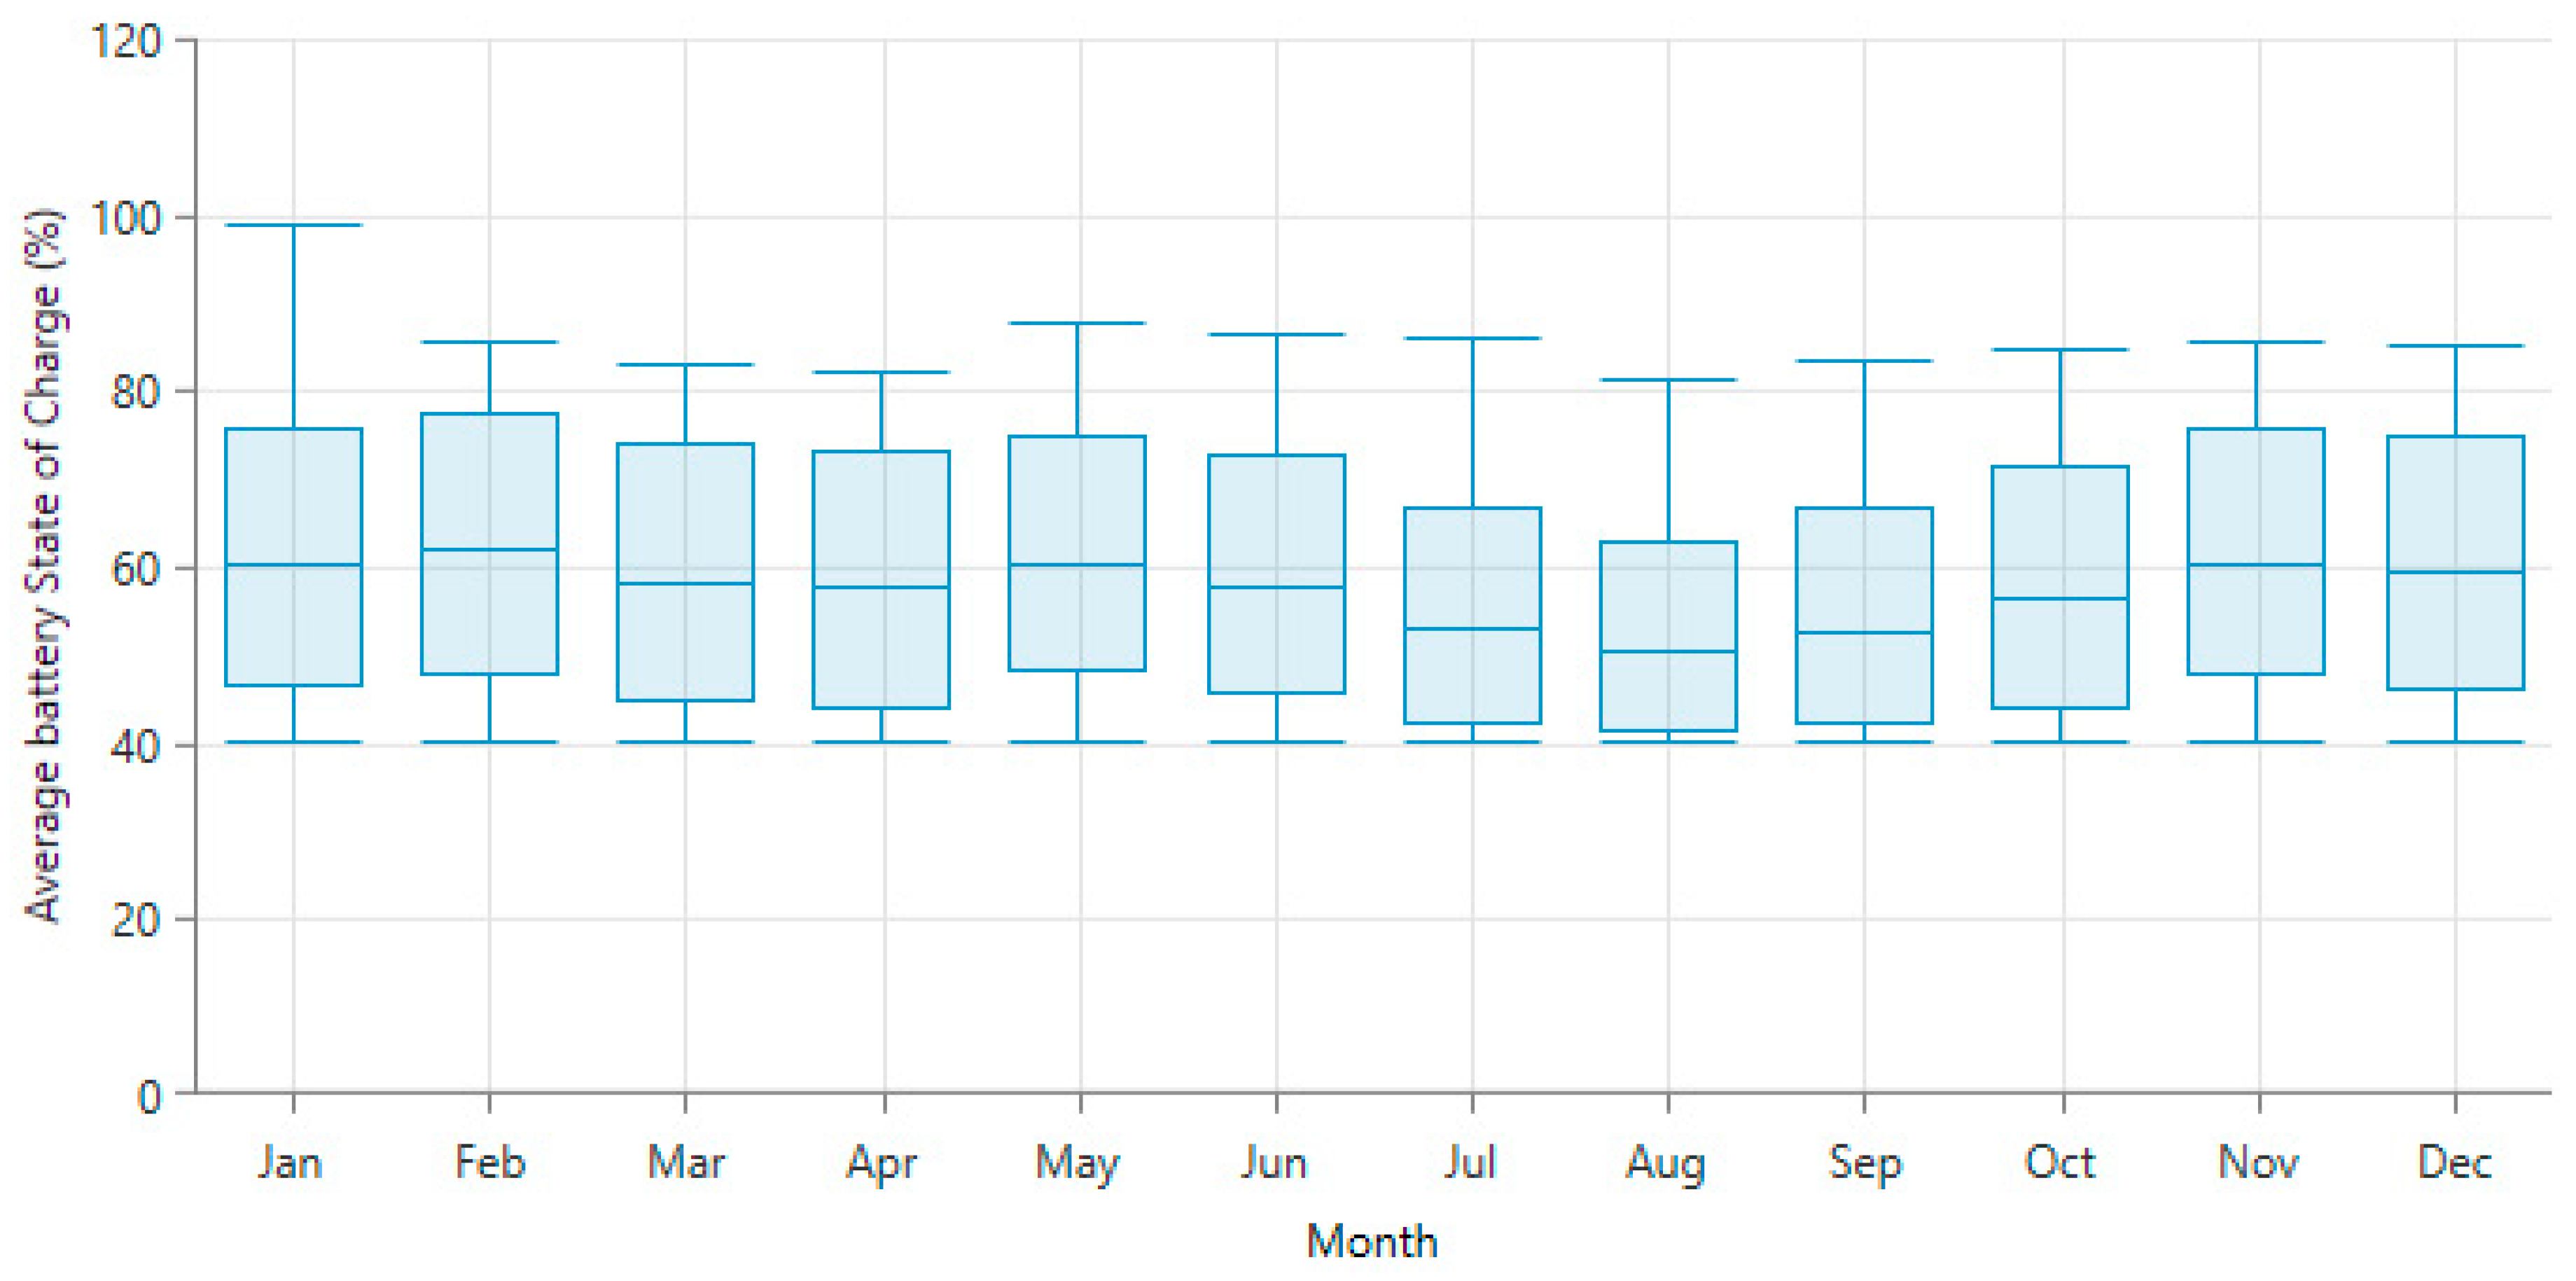
The inclusion of battery storage in any off-grid system can increase the renewable penetration rate and reduce excess energy at the expense of increasing the COE and capital cost. Furthermore, batteries are used to support load requirements during times when the output power of RESs is insufficient, thereby improving system reliability as well as mitigating the variability associated with the RE system. Battery autonomy refers to the periods of time (in hours) during which the battery can adequately supply the load without needing to recharge. In this paper, one string of battery storage forms 2.49 h of autonomy with a nominal capacity of 34.6 kWh. In the charging and discharging process of the battery, the use of a traditional control method leaves some parameters out of the user’s control. This results in the aging of the batteries in addition to decreasing the battery life cycle thereby causing irreversible battery damage. However, the introduction of other control methods such as model predictive and fuzzy logic controls in battery charging management for renewable energy systems can reduce the charging time, avoid deep discharging through the maintenance of the state of charge (SOC) above 50%, as well as protect the battery from wear and tear [
51] The monthly average SOC of the battery system is displayed in
Figure 9. It shows that the months of July through to September recorded the lowest charging cycles due to the low solar irradiation levels reported in these months.
This reduces the energy penetration of solar; thus, additional energy is expected to be supplied by the battery to meet the load demand. Conversely, the highest charging cycle was reported in the months of January through to May. This indicates the system mostly relies on other components to serve the load.
3.2. Sensitivity Analysis
In this part, different sensitivity analyses were conducted to investigate system behavior while changing some variables that influence off-grid system performance in order to determine whether the system would meet load requirements.
3.2.1. Sensitivity Analysis of Generator Parameters
Generator Minimum Load Ratio
The minimum ratio of load on the generator set is the least load allowed on it, as a percentage of its rated output. Specifying a minimum load will simply prevent the generator from running at too low a load rather than preventing it from being turned off [
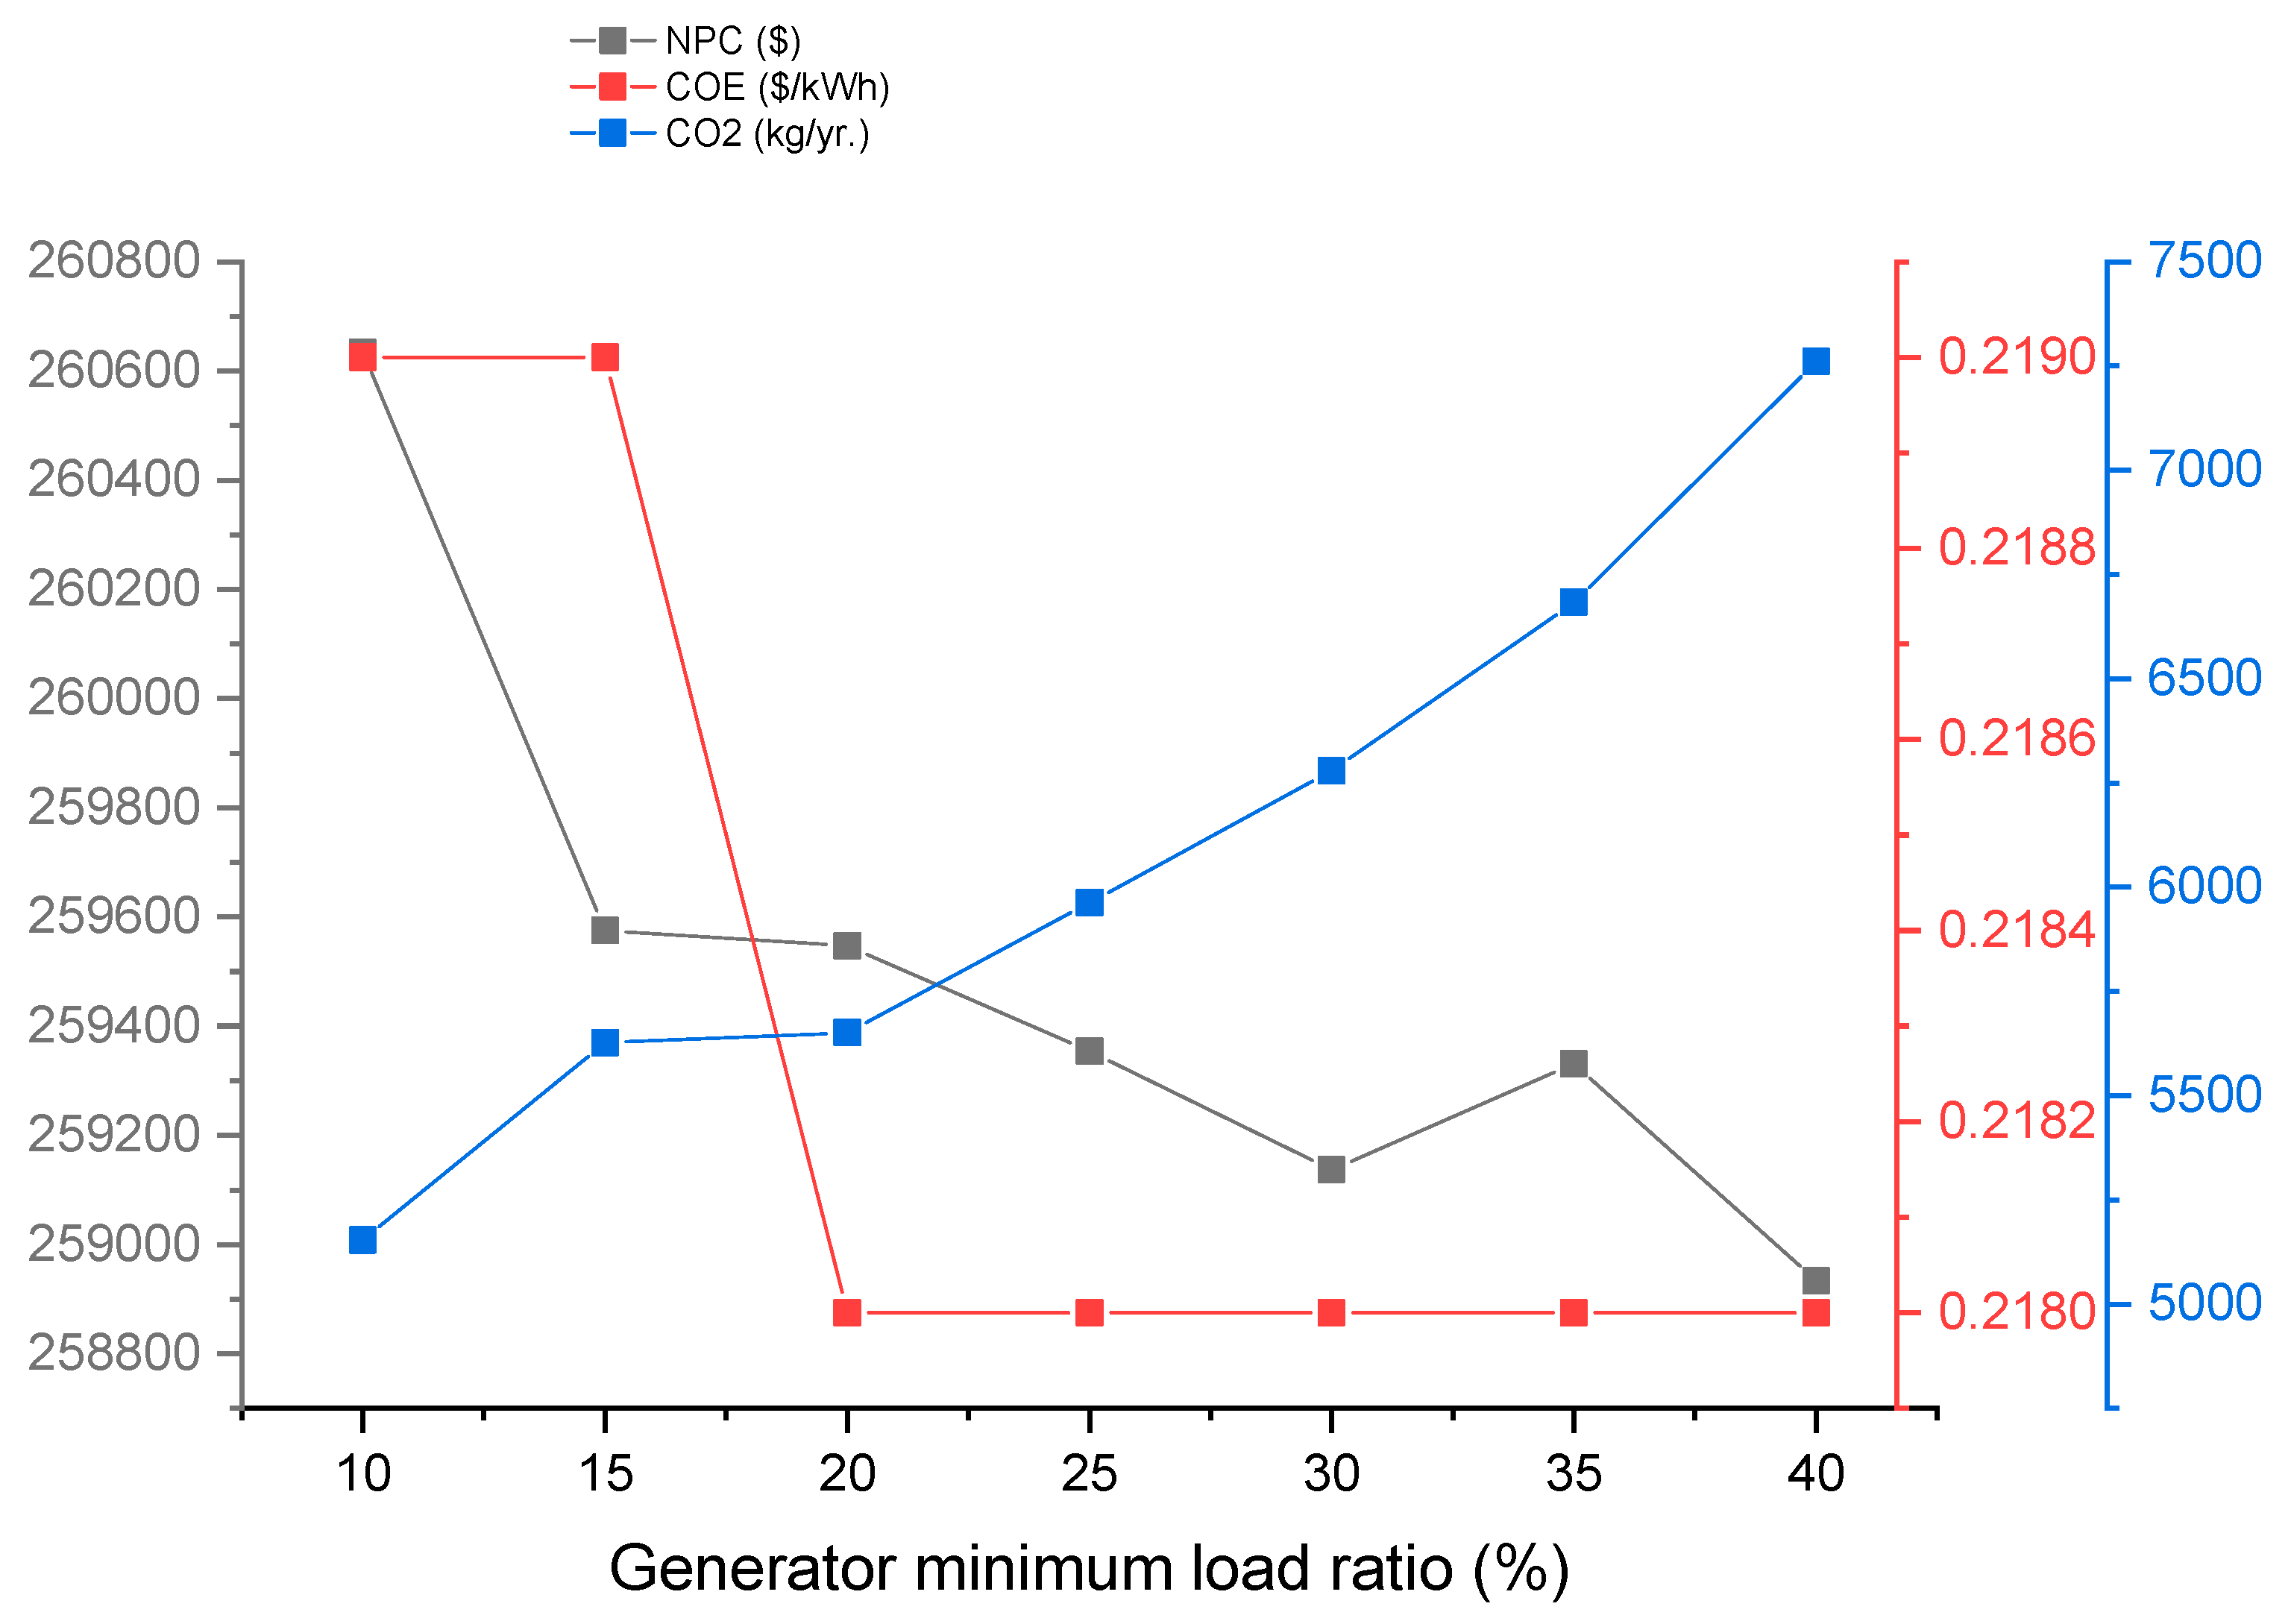
35]. This variable is of great importance as some manufacturers suggest the generator set should be shut off under a certain load. In view of this, the generator load minimum ratio is assumed to vary from 10% to 40% in order to evaluate its economic and environmental impact. The variation in NPC, COE, and CO
2 emissions for different minimum load ratios is presented in
Figure 10. At 10%, the NPC is
$260,634, COE is
$0.219/kWh, and CO
2 emissions are 5154 kg/year. However, the NPC is reduced by 0.65% and COE by 0.46%, while CO
2 increases by about 41% based on a generator minimum load of 40%.
The results reveal the direct impact of varying the minimum load ratio on the system cost and environment, as well as on generator working performance. However, operating the generator at low load levels for an extended time can impede its performance. The most common consequence associated with this is wet stacking, which is a black-oil liquid that can leak from exhaust joints as a result of the generator working under low or no load conditions for long. This problem can lead to system failure and decreased the operational lifespan of the generator [
52].
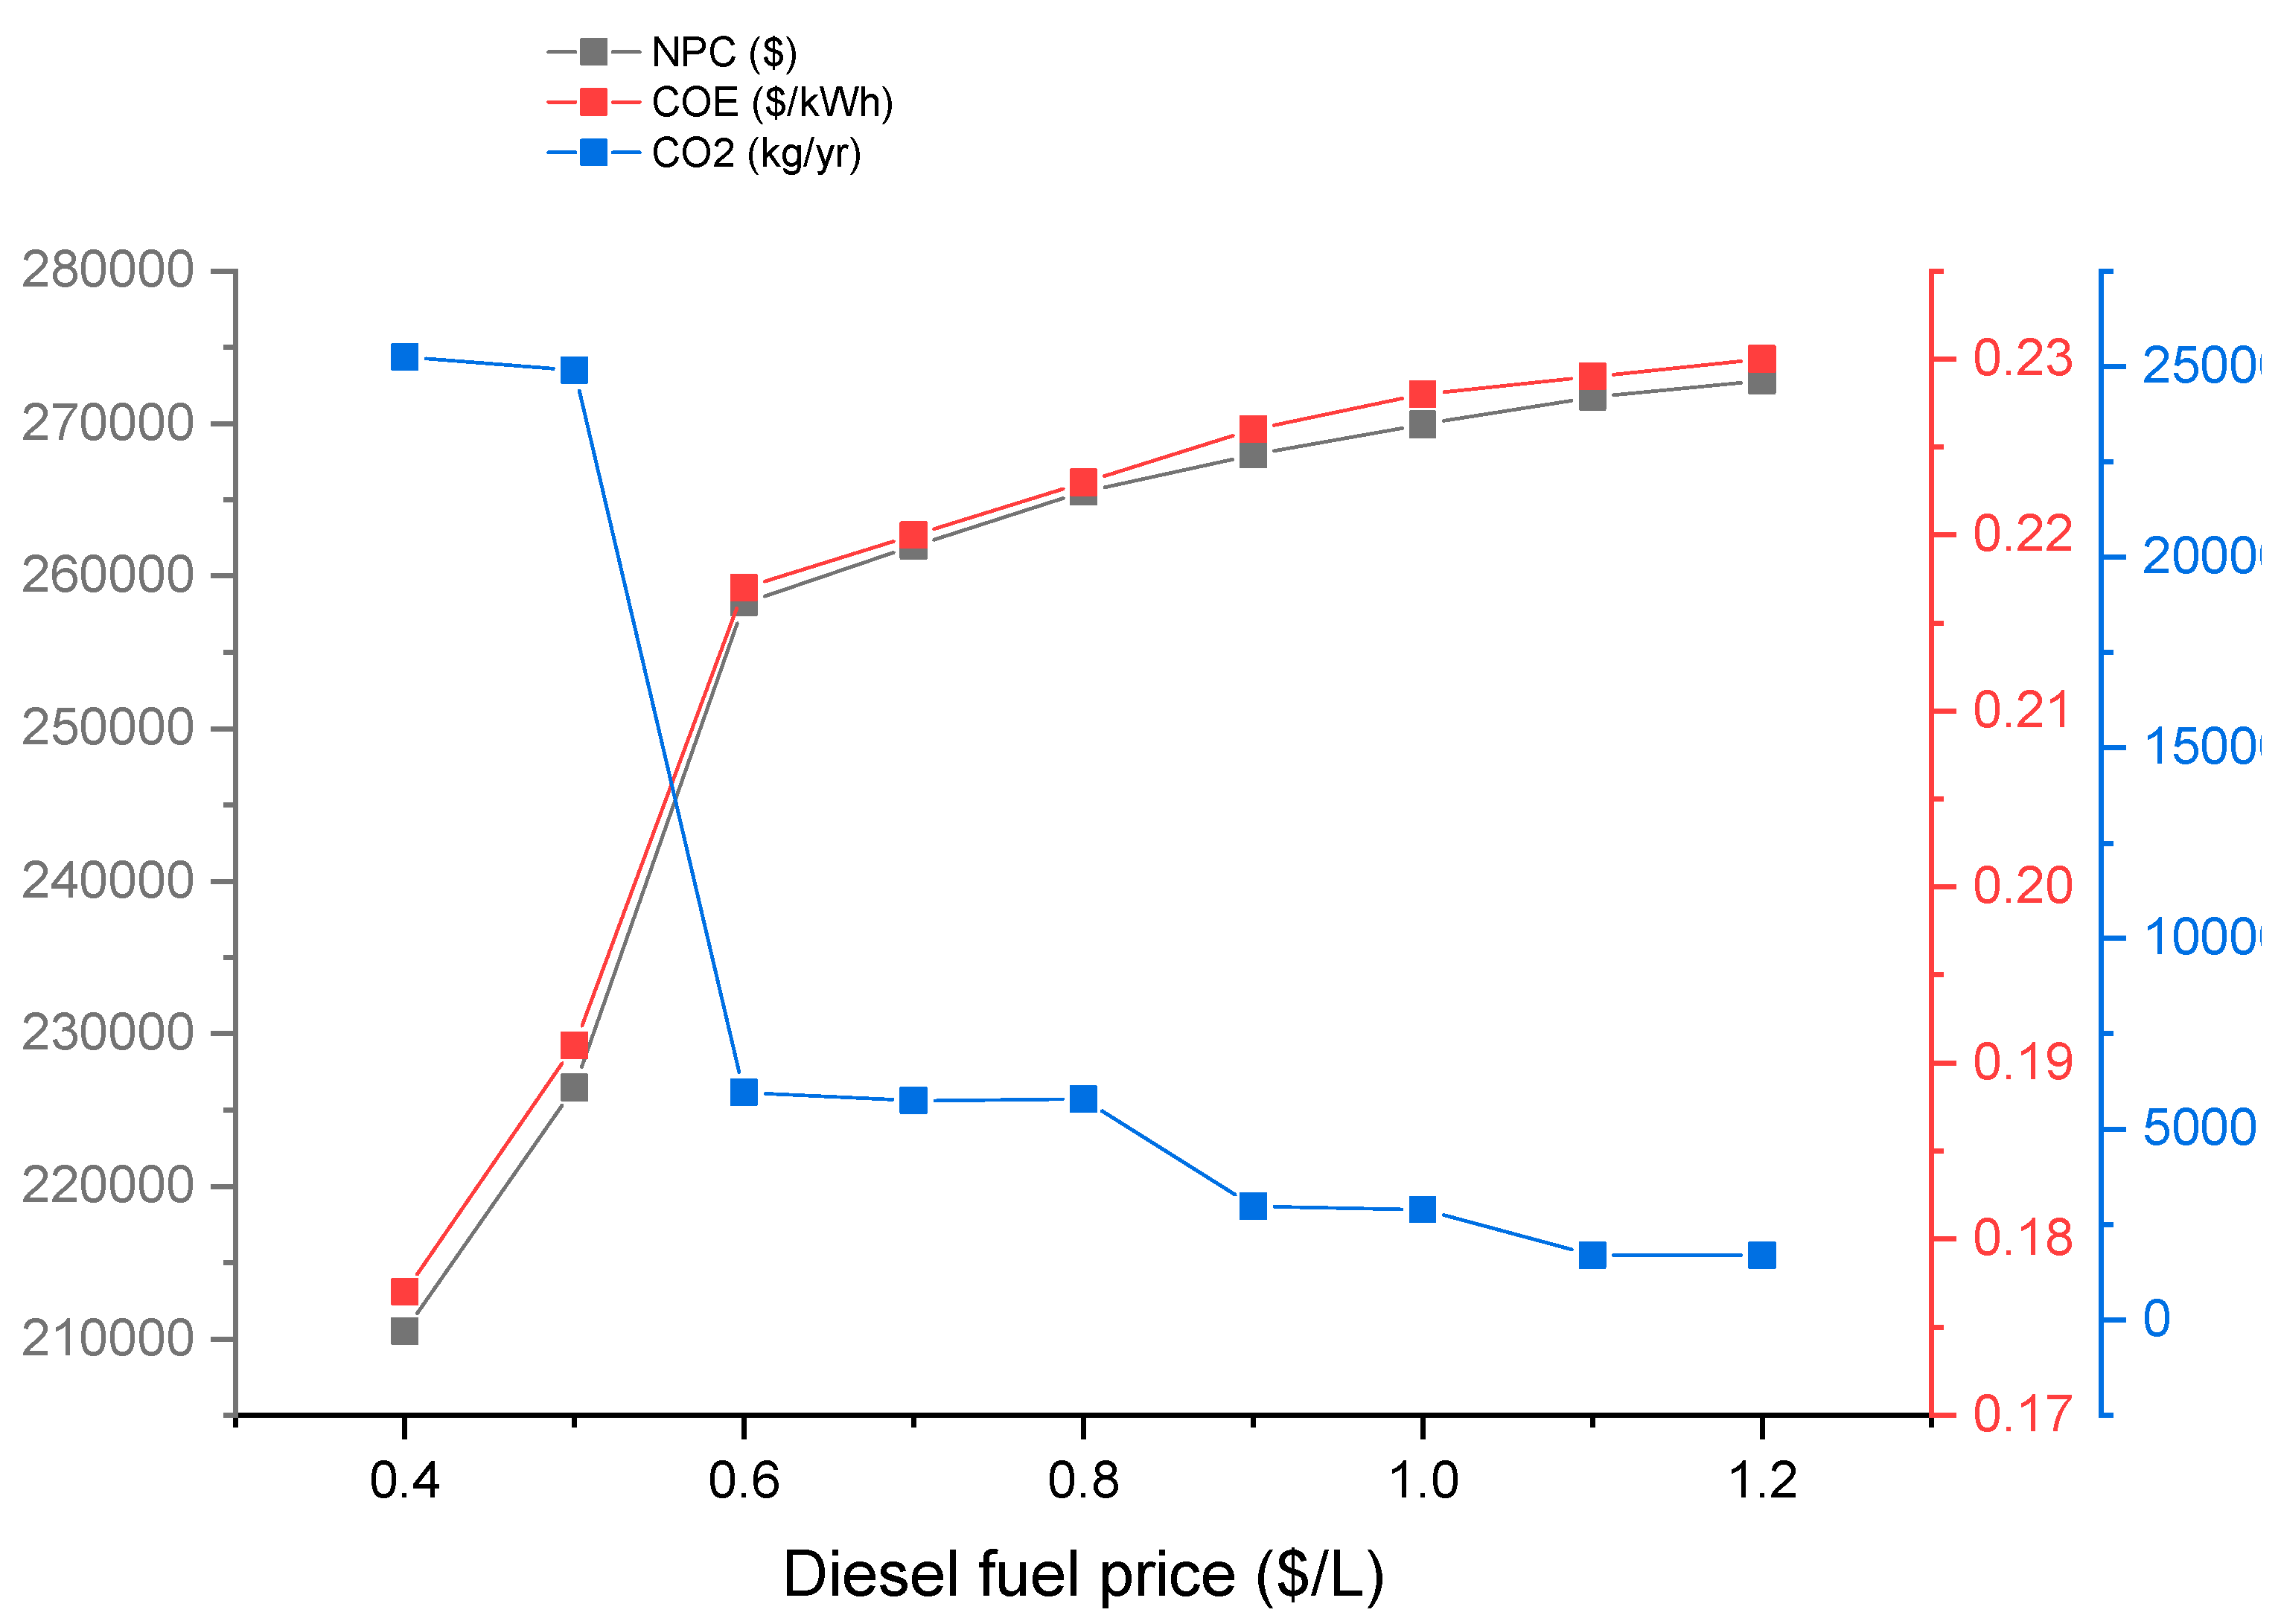
Generator Fuel Price
The price of diesel continues to fluctuate with exchange rate fluctuations in the global market. However, remote areas are likely to experience higher and more varied diesel prices, considering the cost of transportation and other costs associated with using diesel fuel in such areas. In this regard, the fuel price is assumed to range from
$0.4/L to
$1.2/L in order to investigate its impact on CO
2 emissions and the overall system cost. It can be seen in
Figure 11 that both NPC and COE increase from
$210,511 to
$272,799 and from
$0.177/kWh to
$0.23/kWh, while CO
2 emissions drop from 25,244 kg/year to 1692 kg/year when the fuel price rises from
$0.4/L to
$1.2/L. The variation that occurs with these parameters due to rises in diesel prices can be explained by the fact that the hybrid system tends to rely more on renewable energy components to meet load demand, thus reducing the hours the generator is in operation, which directly relates to the low CO
2 emissions and high NPC and COE.
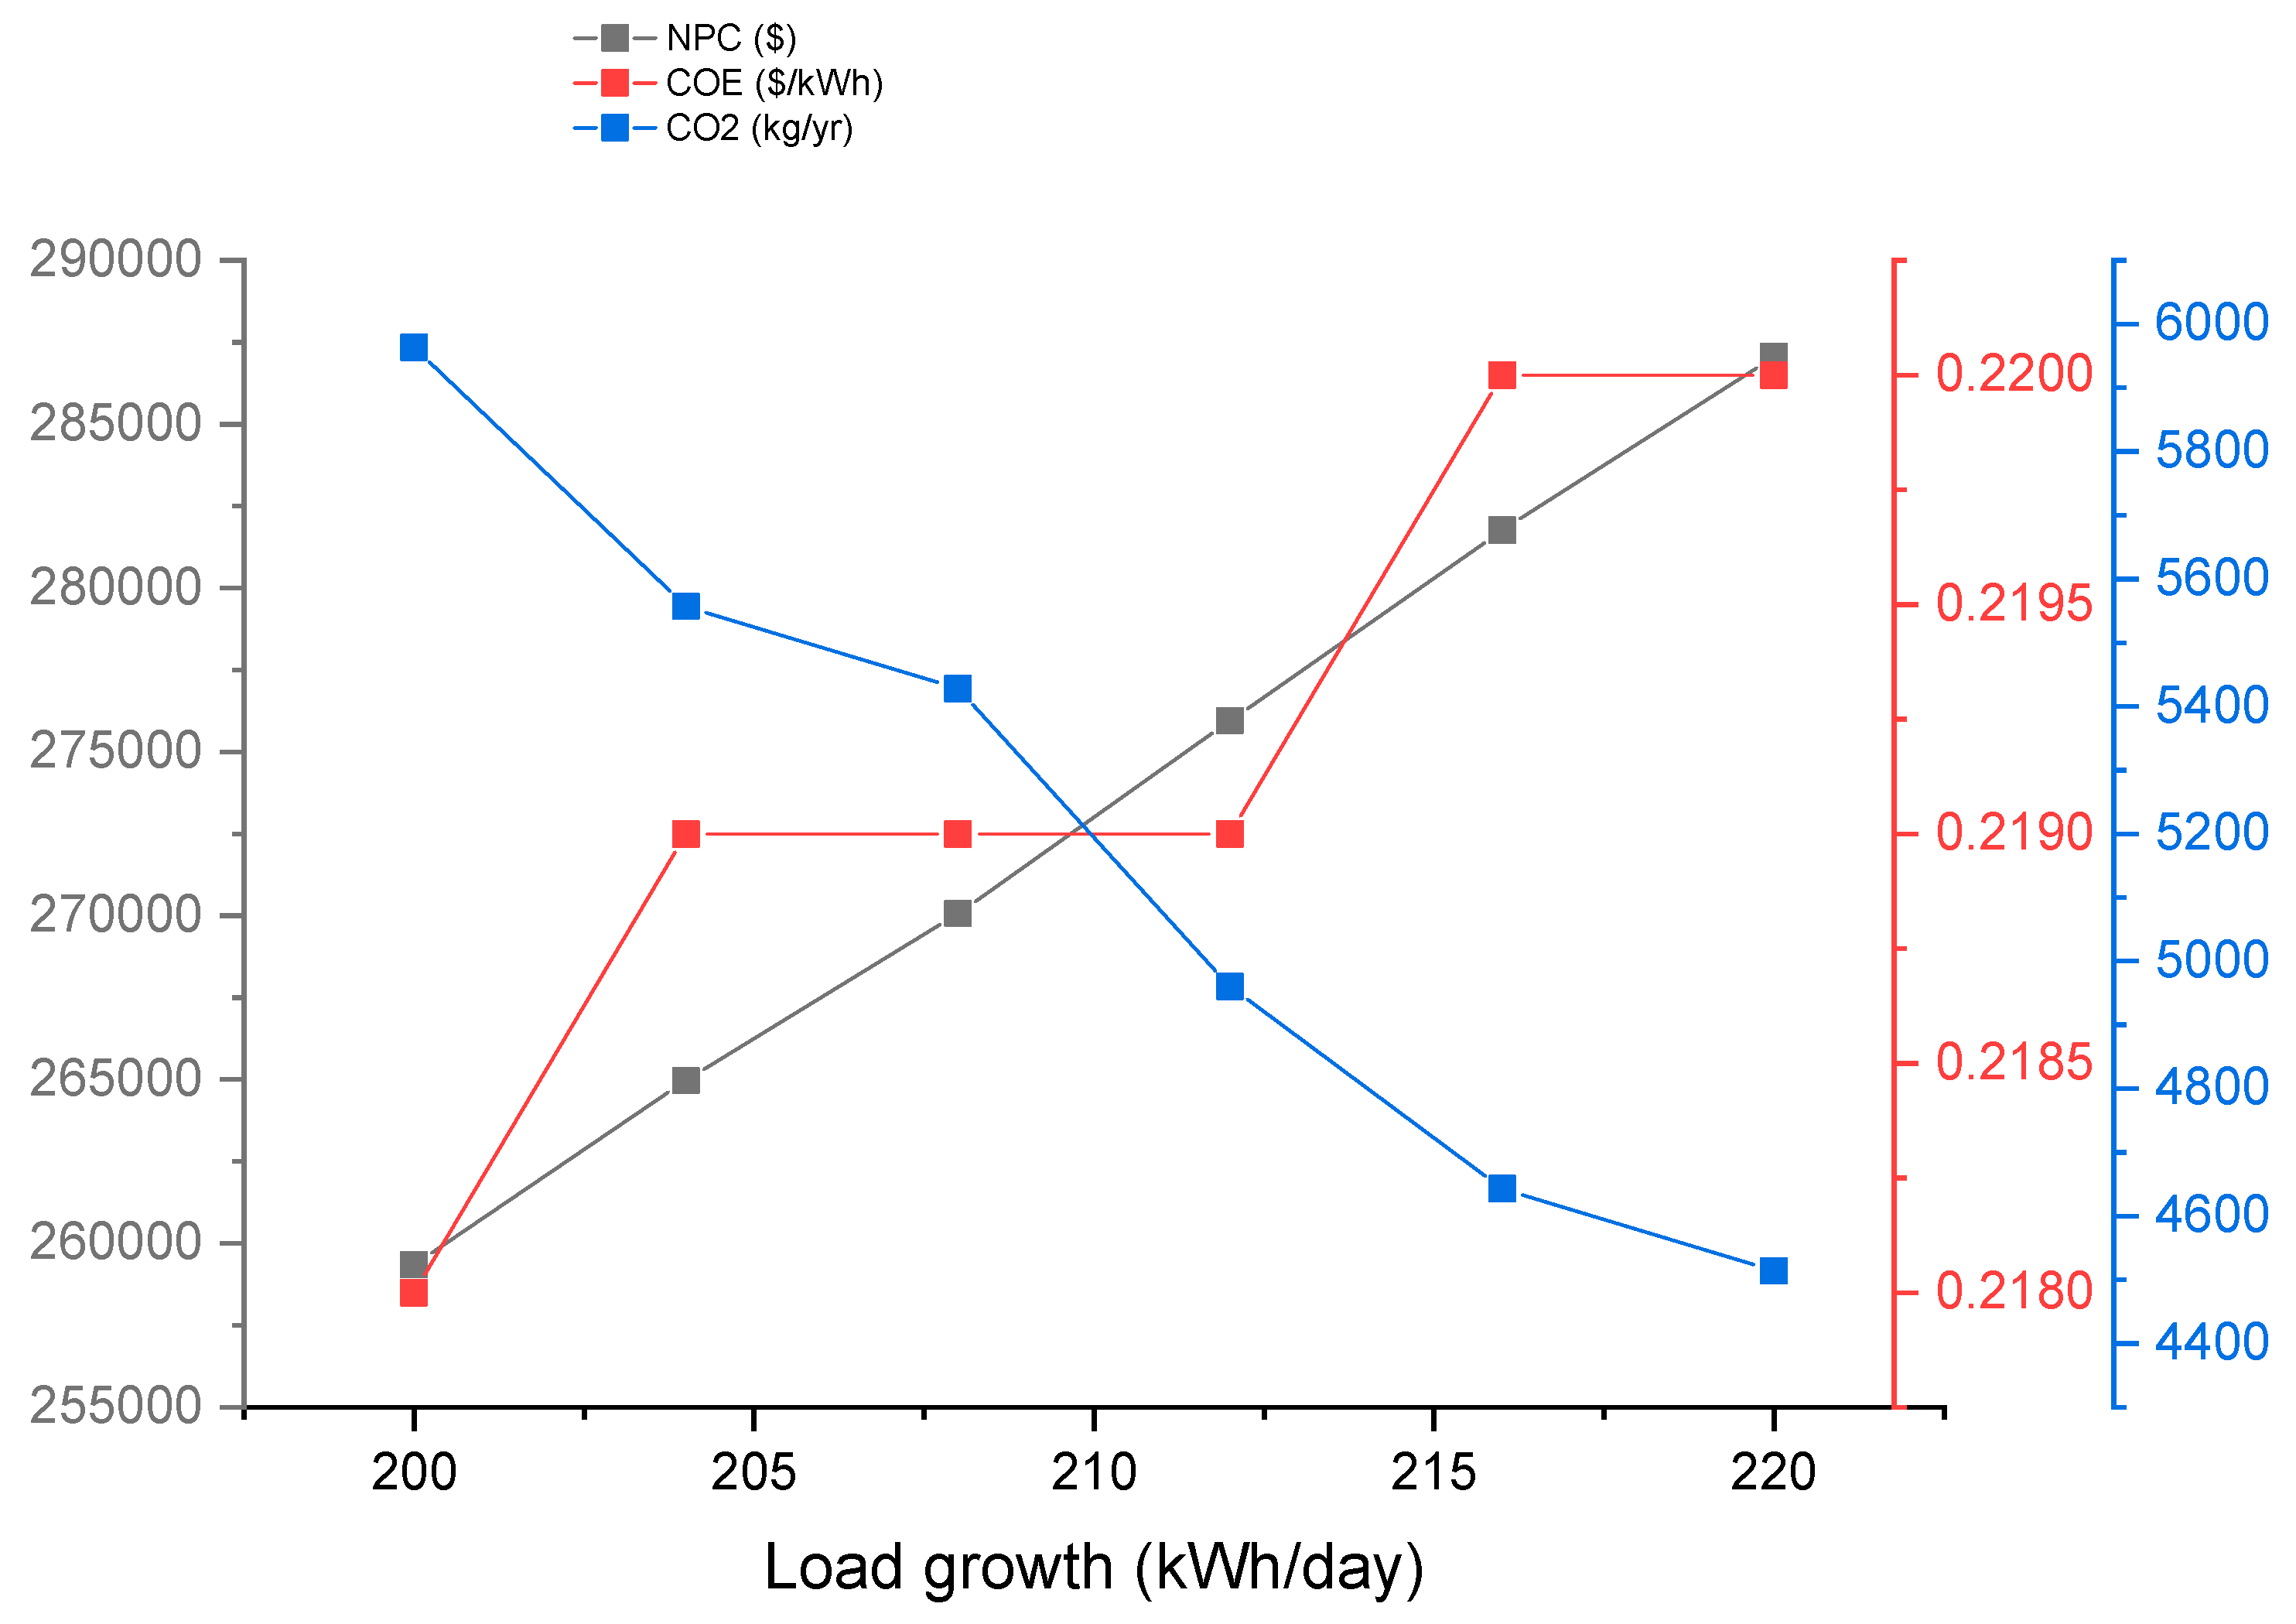
3.2.2. Impact of Load Demand Growth
The electrical energy from a power system depends on the load demand that should be met all the time. In this section, based on economic and population growth rates in remote rural areas in Nigeria [
53], load demand was assumed to increase by 0.5% per year over the project’s lifetime in order to investigate its impact on greenhouse gas emissions and overall system cost, as illustrated in
Figure 12. Besides, load demand generally changes from time to time. It is evident from
Figure 12 that the NPC and COE increased by 10.7% and 0.9%, respectively, whereas CO
2 gas emissions were reduced by 24.3% when the load demand rose from 200 kWh/day to 220 kWh/day. The result shows that the higher the load demand of an electricity consumer, the higher the energy production; hence, the need to update the capacity of different components of the hybrid system in order to raise the overall electricity generation at the expense of increased NPC. In this case, the PV capacity increases more than that of the diesel generator due to the high level of global solar radiation at this location, which explains the reduction in CO
2 emissions recorded.
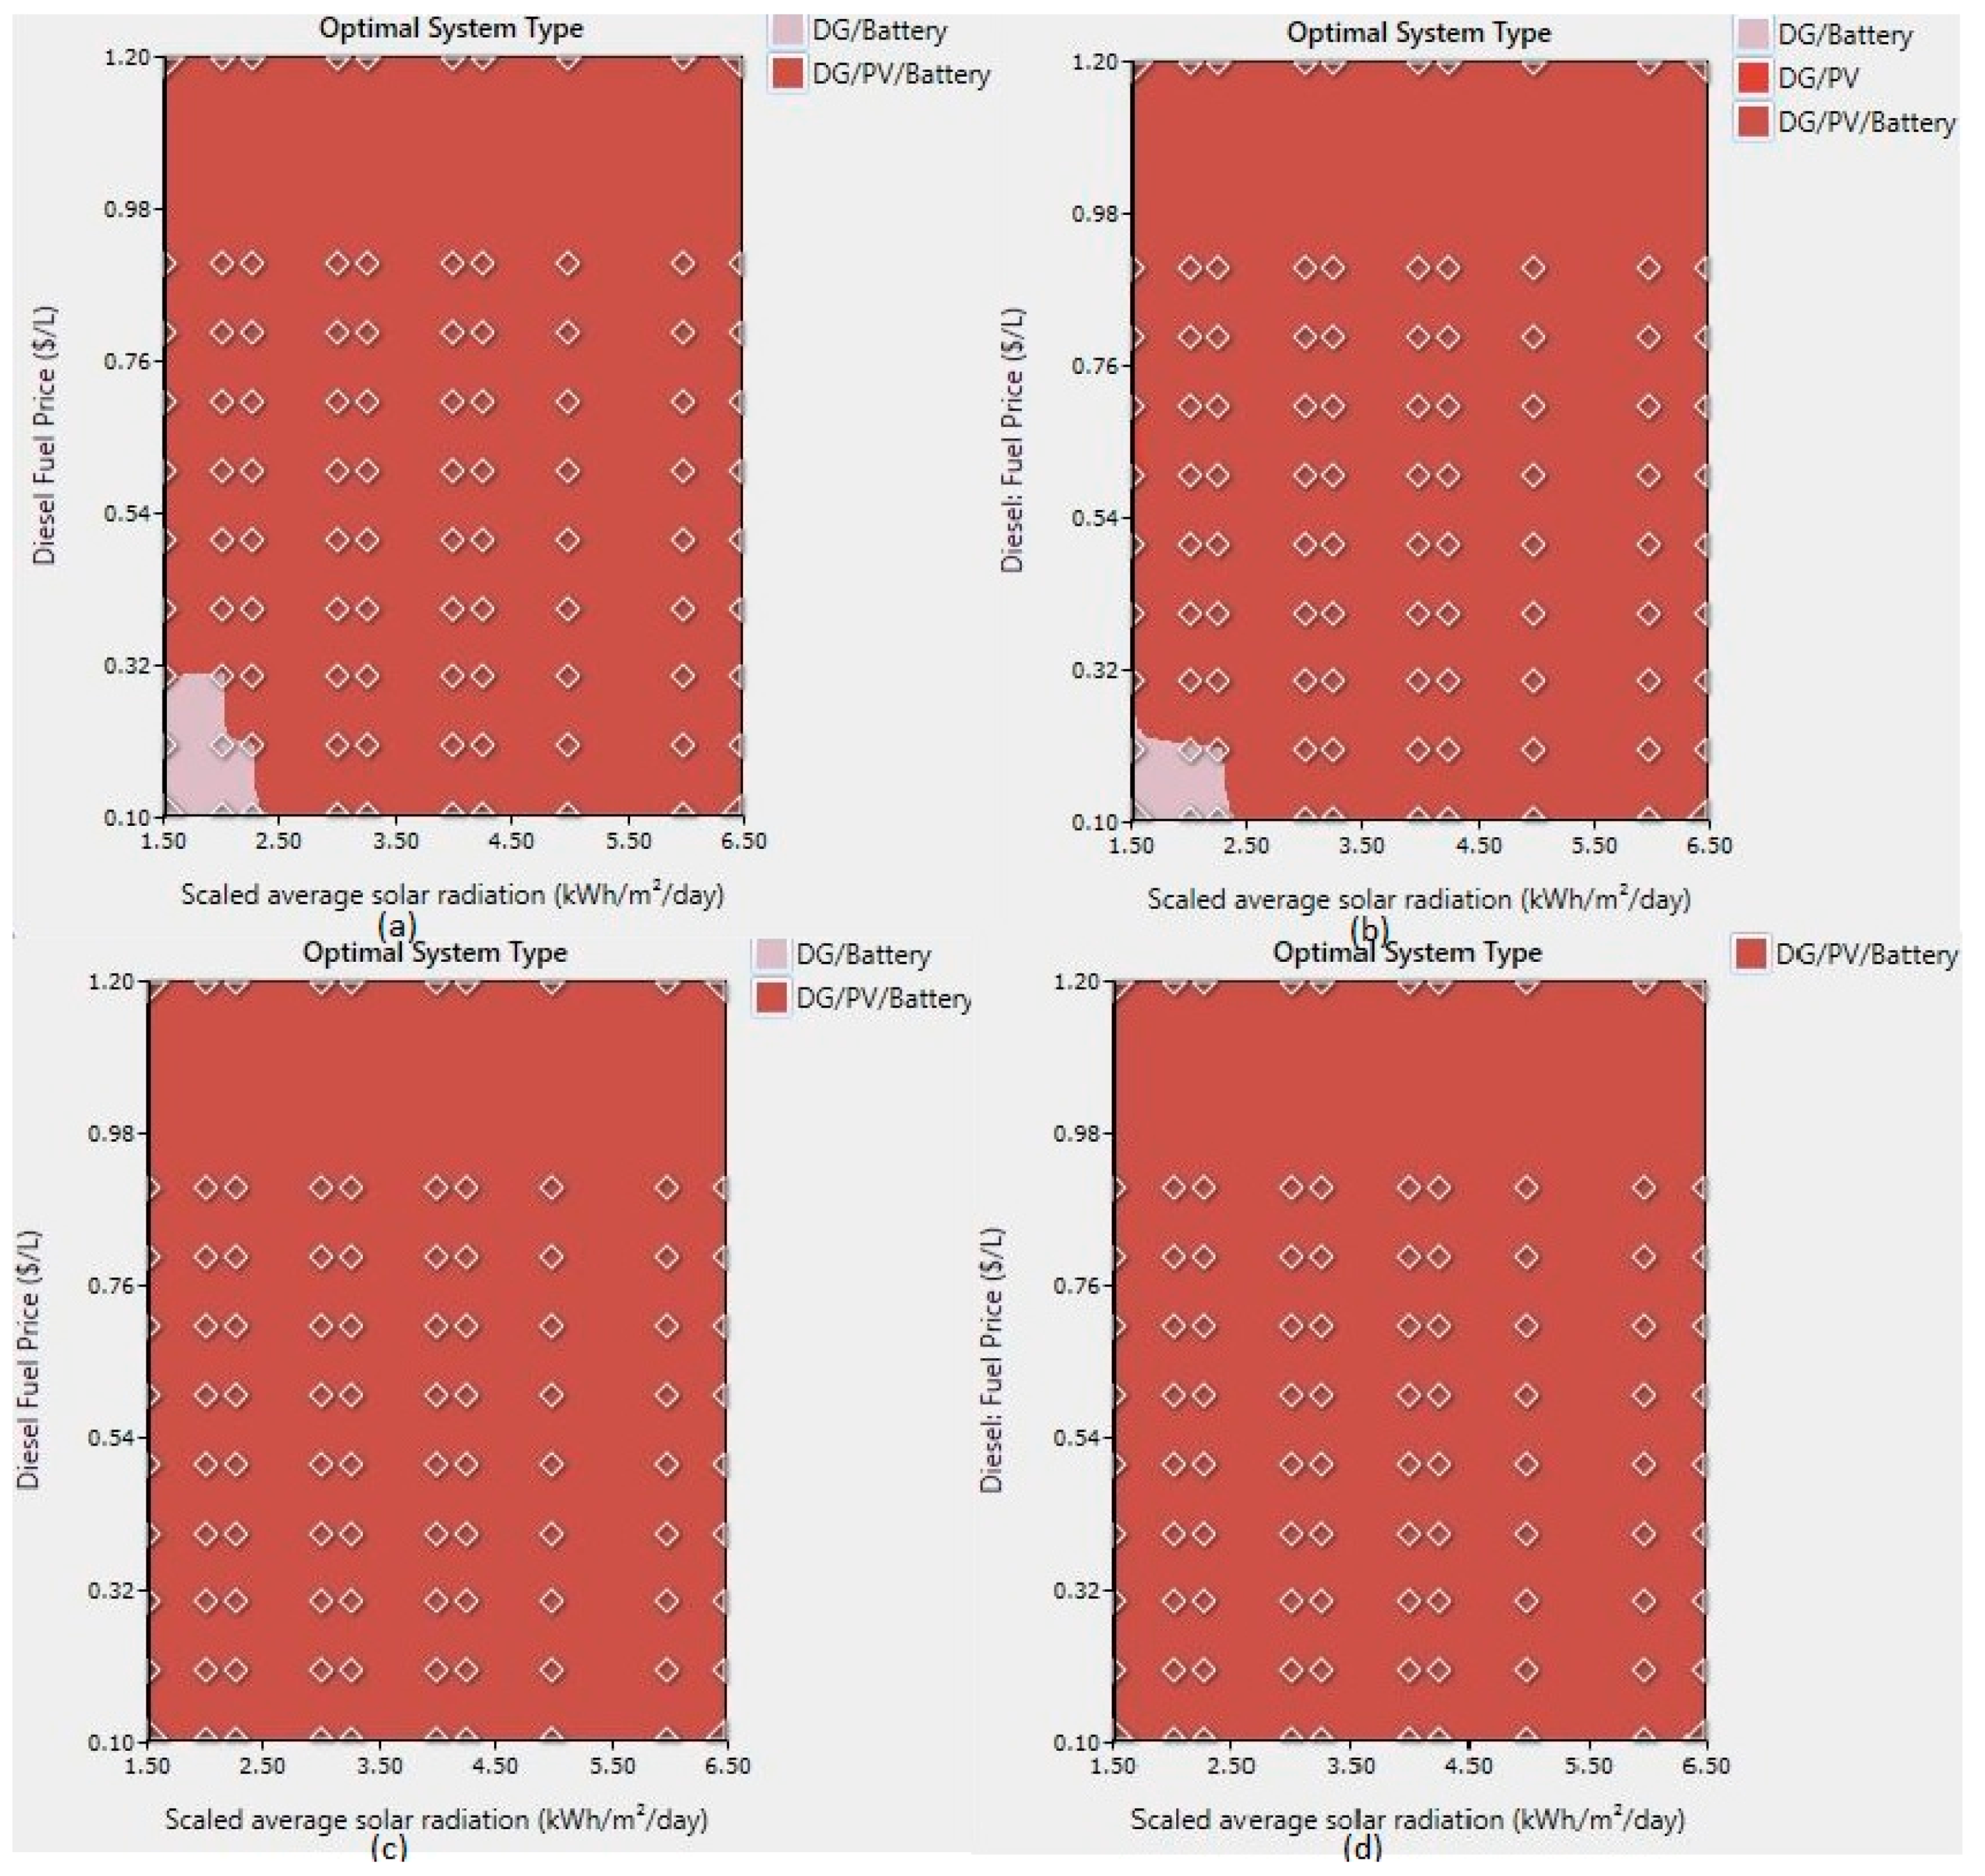
To validate the results, the above parameters need to be simultaneously varied alongside solar insolation levels to assess their impacts on the overall operational behavior of the system. In the meantime, the diesel fuel price is varied between
$0.1/L and
$1.2/L, load demand between 200 kWh/day and 230 kWh/day, and global solar radiation in the range of 1.5 kWh/m
2/day to 6.5 kWh/m
2/day. The results of the sensitivity analysis are reported in
Figure 13 with variations in the diesel fuel price against average solar radiation at different load demands (load growth). The results obtained clearly reveal the potential of the proposed DG/PV/battery design in meeting the load demand despite changes in some major variables that directly influence hybrid system behavior under standalone conditions. However, DG/battery and DG/PV hybrid systems are preferred only when the diesel fuel price reported low values of less than
$0.32/L and the average solar irradiation reached at least 2.41 kWh/m
2/day. Otherwise, the hybrid DG/PV/battery generation system, which corresponds to the optimum solution illustrated in
Section 3.2, is preferred over other system combinations throughout the project’s lifetime. Further increases in the load demand had no significant effect on the optimum solution as the system demonstrated its potential to meet load demand changes, even during the extreme condition of fuel scarcity.
3.3. On-Grid Hybrid Systems
The optimum configuration is connected to the utility grid; hence, all component combinations are expected to remain unchanged to show the level of adaptability of the proposed design, as shown in
Figure 14. Generally, component incompatibility and investment cost are the main factors that affect the transition that occurs between standalone and grid-connected systems. However, changing component specifications at the point of inserting an electric grid to an existing off-grid configuration can lead to a redesign of the entire system, thereby making the system economically and technically infeasible, as well as hampering the establishment of a rural electrification framework due to the anticipated changes in the system architecture and overall cost. A sensitivity analysis was conducted to examine the operational performance of the designed system when changing the key parameters that directly influence the behavior of any grid-connected system.
3.3.1. Sensitivity Evaluation
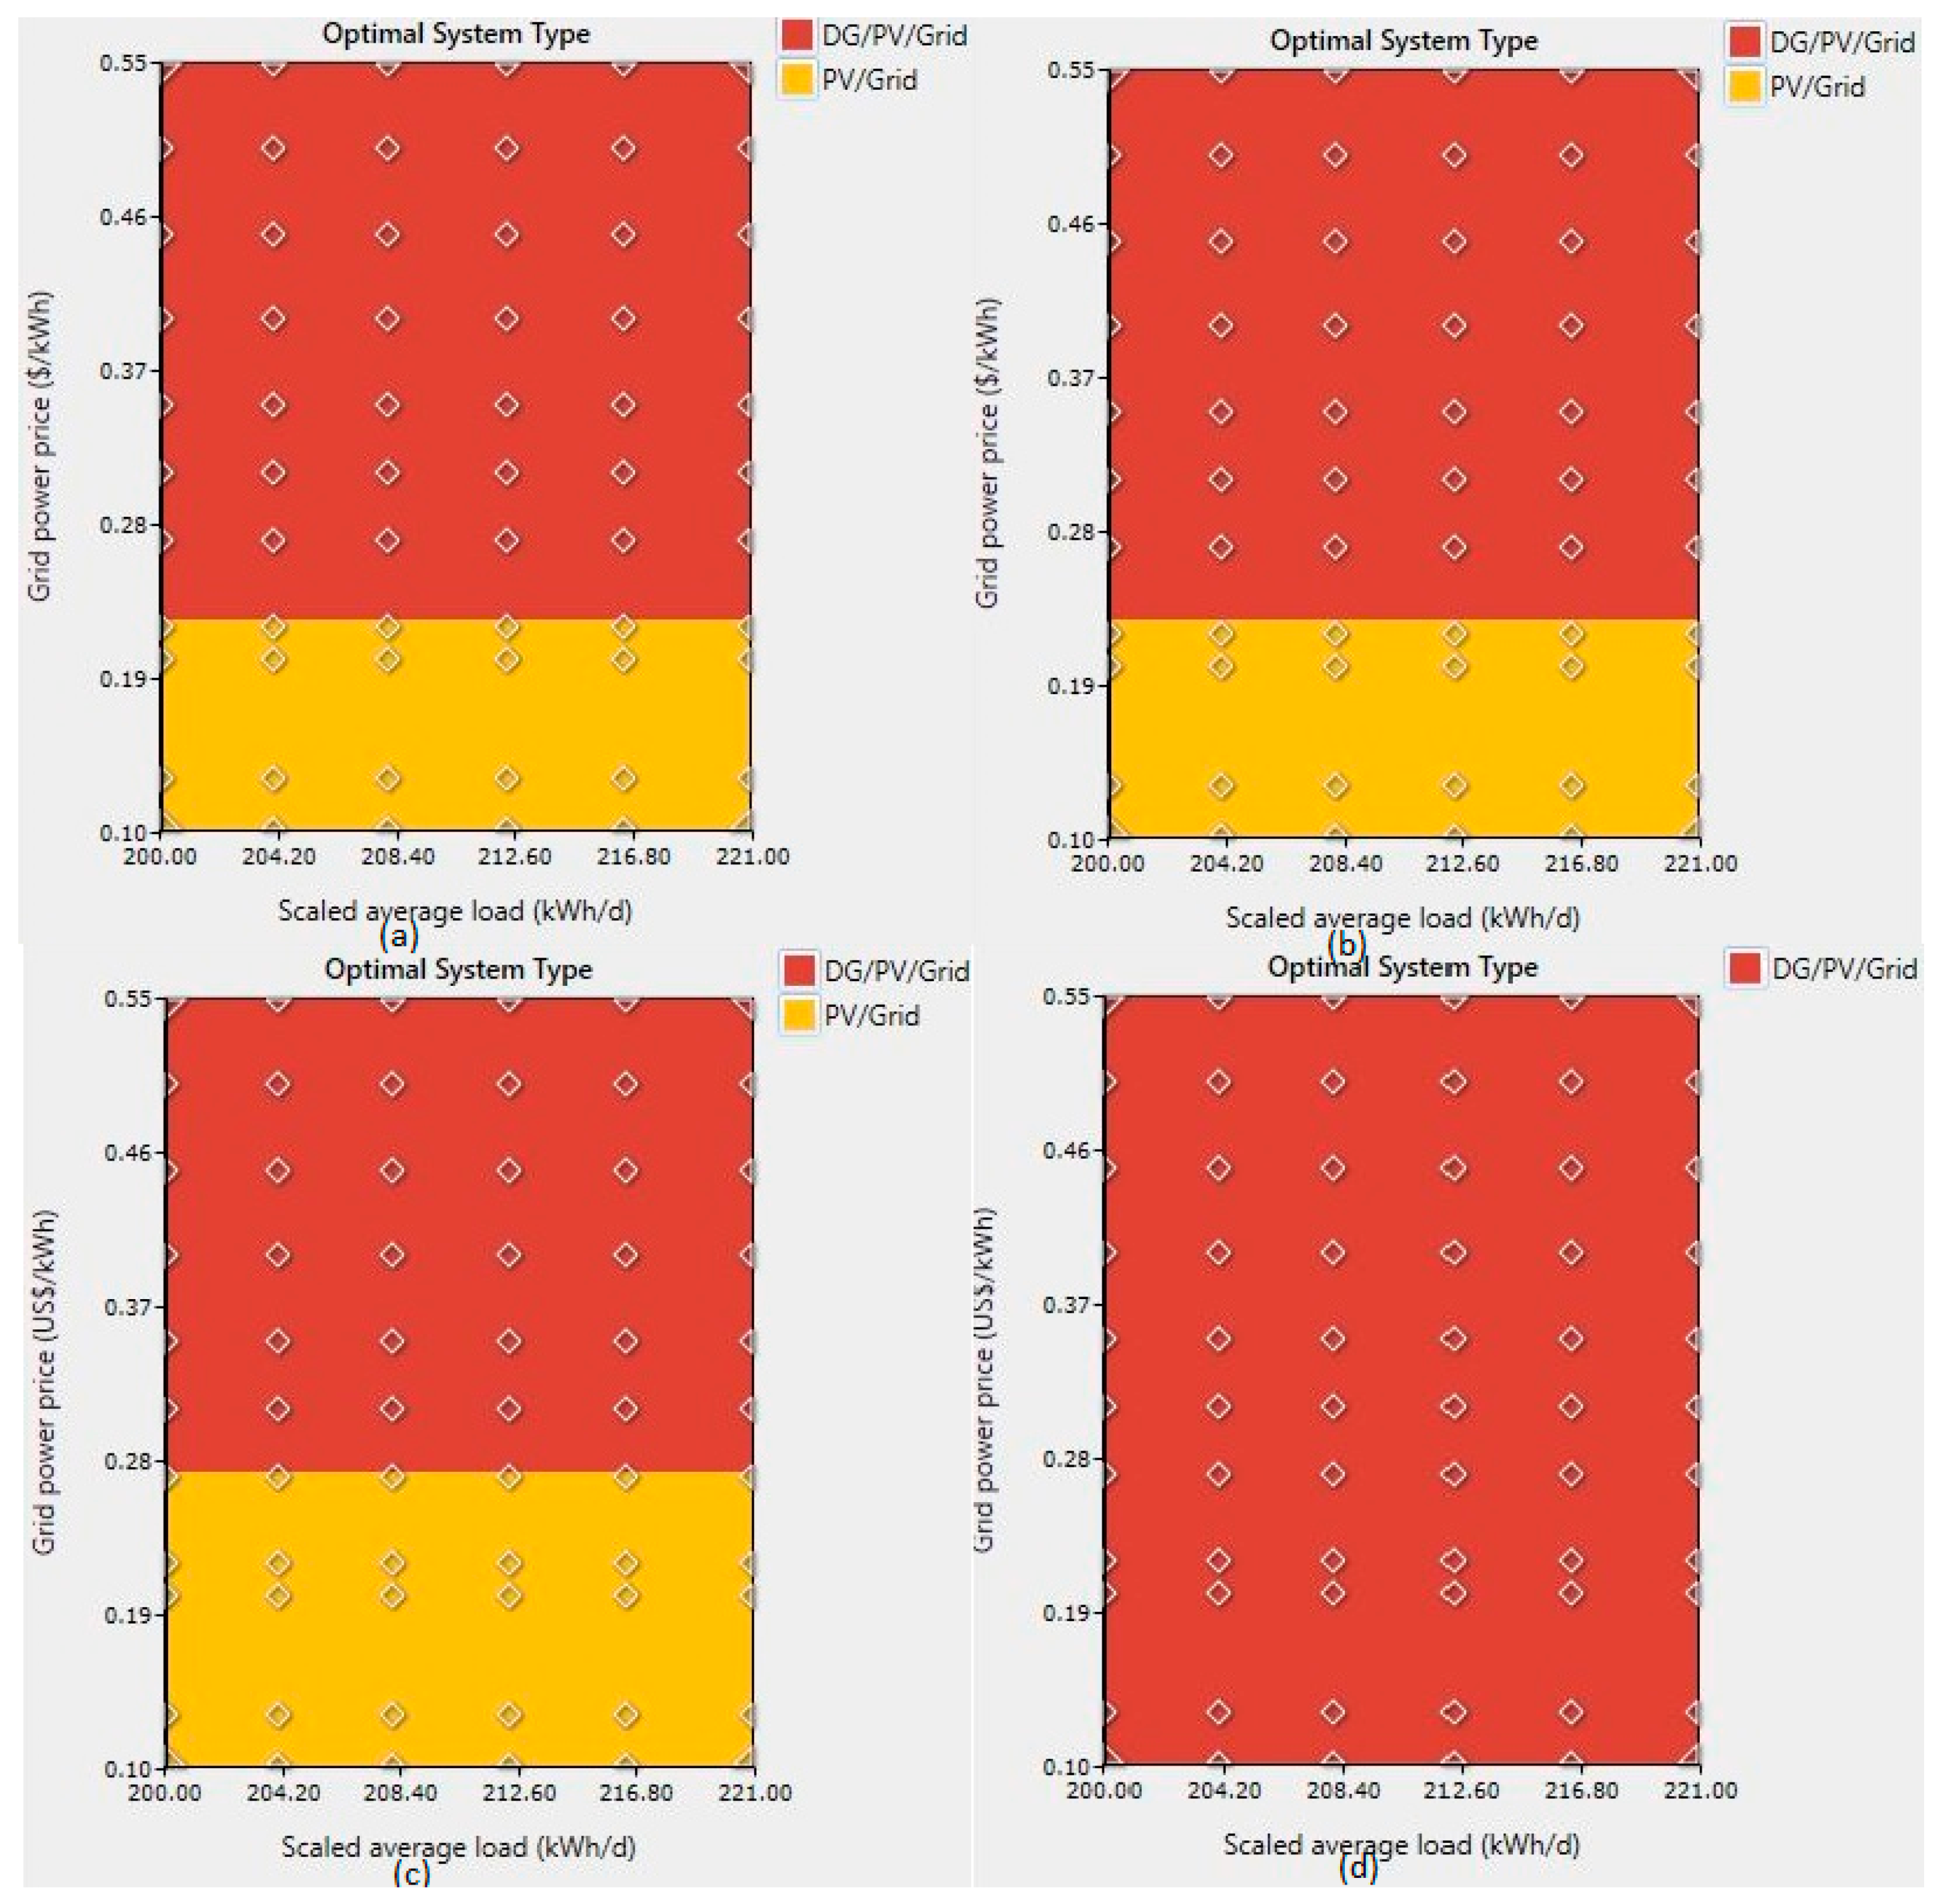
On-grid system operational response to changes in major parameters, including load demand, fuel price, as well as grid power and sell-back prices, are studied and elucidated in this part. The effect of varying the grid power price against the average scaled load (+0.5% per year) at various sell- back and fuel prices on various system configurations is presented in
Figure 15. The outcome shows the impact of these variables on the optimum system design. Also, our results clearly show that the optimum system, in this case, consists of PV, a grid, and a diesel generator, which corresponds to the optimum solution in the off-grid scenario except that the battery bank is replaced by the grid, mainly for economic reasons as well as to ensure reliable and continuous backup operation.
Furthermore, the on-grid configuration prefers to sell back the surplus power to the utility grid rather than store it in the storage system (batteries) in order to minimize the COE and the investment cost. According to
Figure 15a–c, two component combinations are identified as optimal choices by HOMER: the PV/Grid and DG/PV/Grid systems. The PV/Grid configuration tends to be the optimal system choice only if the grid power price is less than
$0.28/kWh and the sell-back and diesel prices rise by up to
$0.26/kWh and
$0.83/L, respectively, while the average load demand keeps increasing. This system configuration is not completely reliable as it is only an optimal choice with limited changes in the major parameters. However, the system depends in a major part on the optimal hybrid DG/PV/Grid system whenever the sell-back price exceeds the grid power price and the fuel price increases to more than
$0.83/L. Further increases in the fuel, sell-back, and grid power prices have no significant impact on the optimum system, as the hybrid configuration remains the best choice among all other hybrid combinations irrespective of any future changes that could affect the system during its operational lifetime.
Therefore, the optimum design of a grid-connected PV/diesel generator is considered to be the best choice under all scenarios, in addition to meeting the design criteria by being a flexible configuration under all operating conditions. This finding underlines the high adaptability of the proposed hybrid system under grid-connected and off-grid conditions.
3.3.2. Economic Analysis of NPC and COE Impact
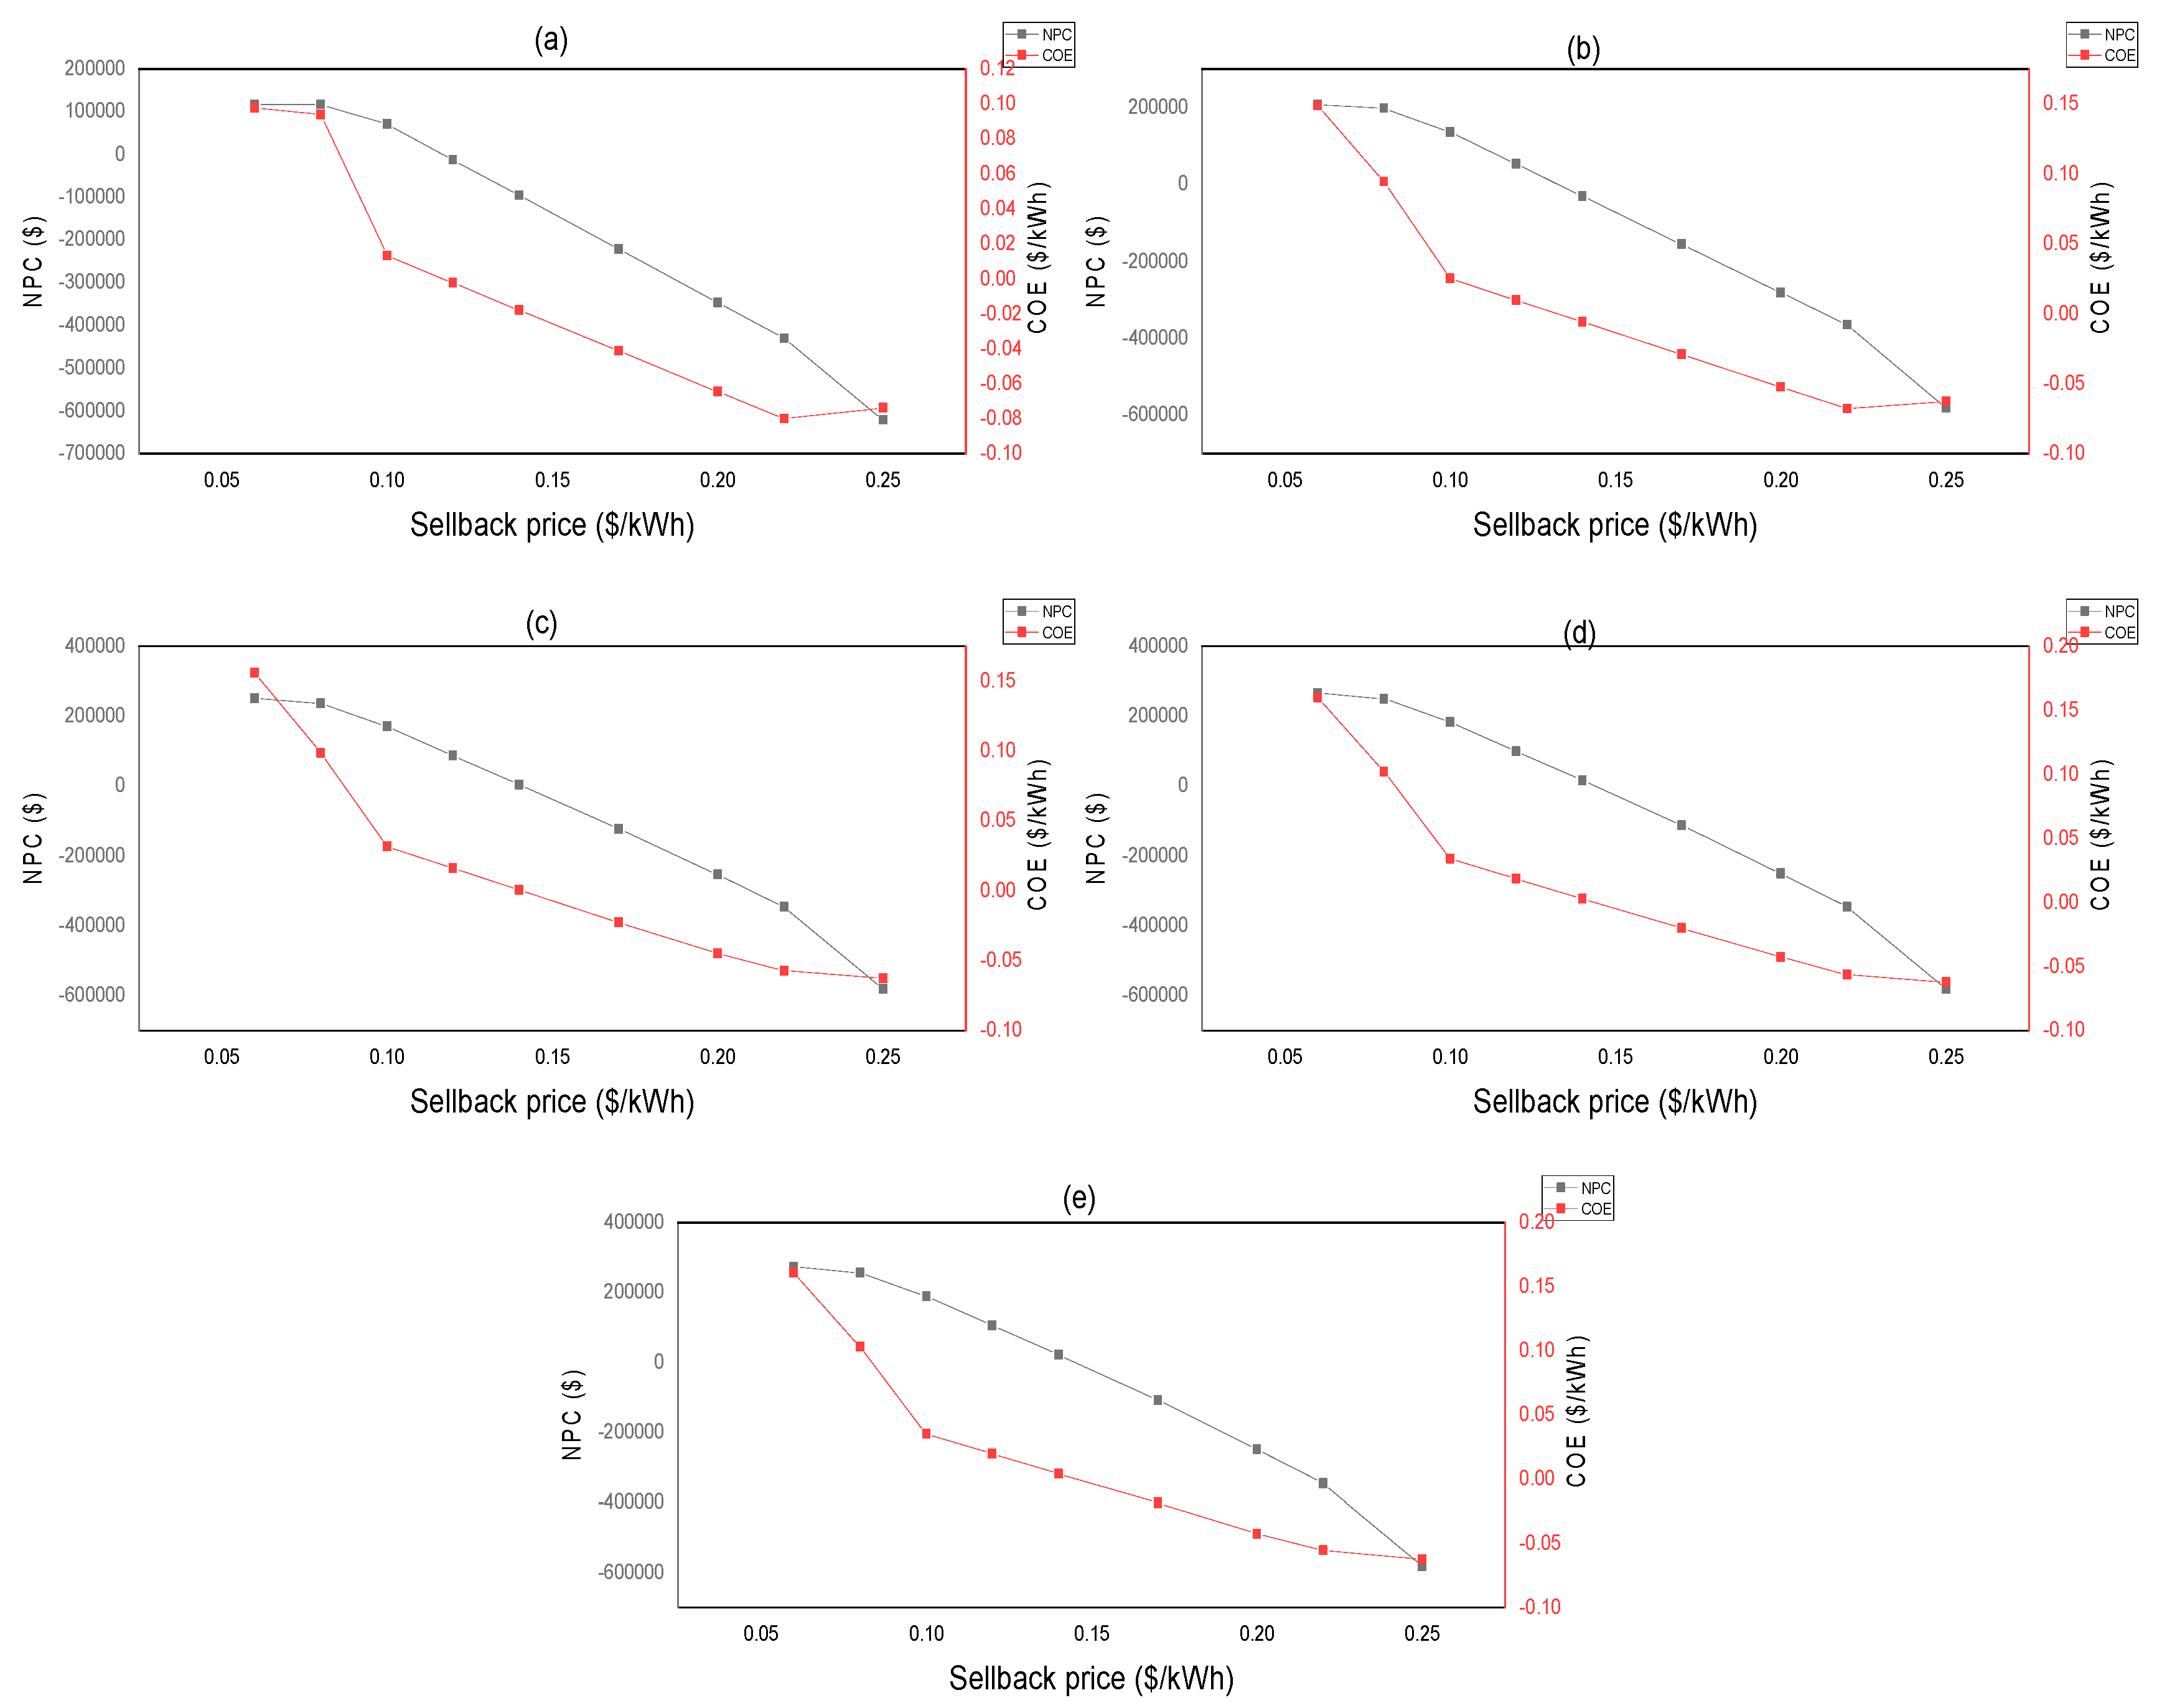
The variation in the value of electricity prices (sell-back and grid power prices) significantly affects the system energy cost and total NPC. The effects of changing the grid power price alongside the sell-back price are presented in
Figure 16. As indicated in this figure, increasing the sell-back price for the same grid power price would result in decreased NPC and COE being generated by the hybrid system. For example, in the simulation conducted for sell-back prices of
$0.04 and
$0.1 per kWh, the COE and NPC are found to be respectively
$0.0983/kWh and
$0.0133/kWh, and
$117,735 and
$71,313.
On the contrary, increasing the grid power price by up to $0.5/Wh increases both NPC and COE. The effect of increasing the grid power price on COE is apparent, as the COE per kWh price increased by 64.3% when the grid power price increased from $0.1/kWh to $0.5/kWh at the base case sell-back price ($0.06/kWh). The effect of changing any of these parameters on the overall system behavior is particularly important to understand and needs to be considered when updating the off-grid system with utility grid connections.
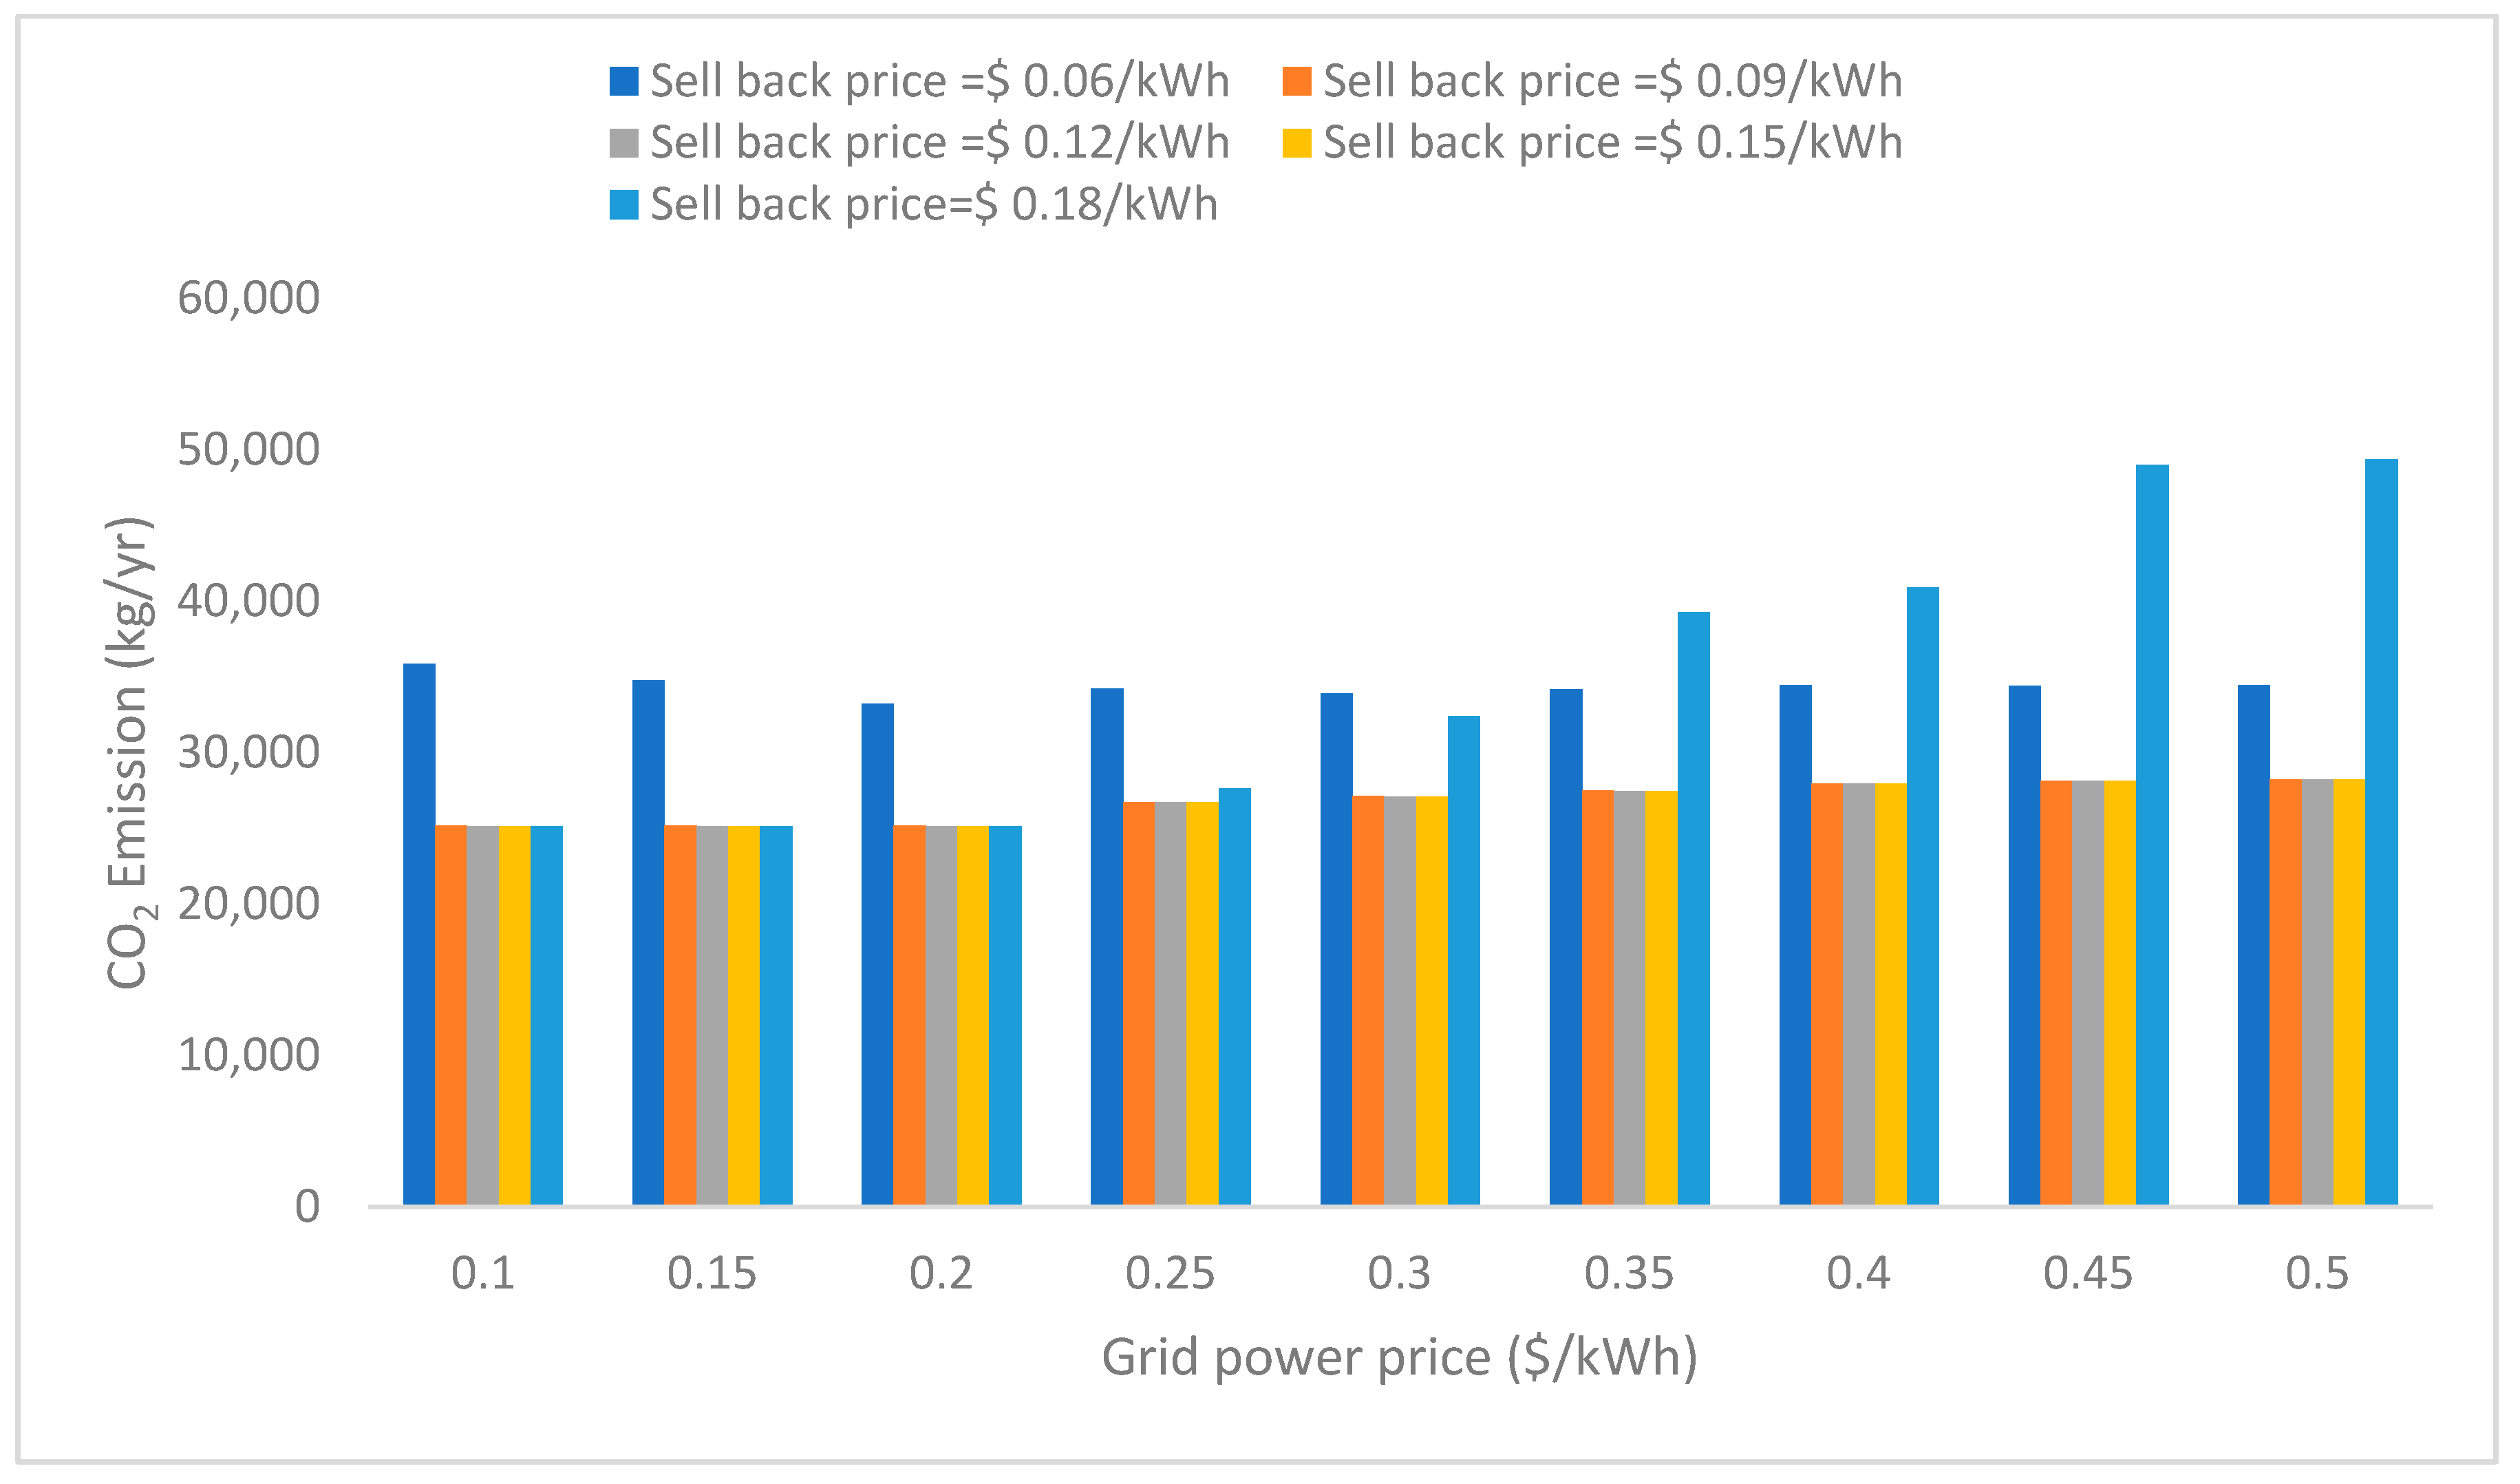
3.3.3. Environmental Analysis of Carbon Emissions
Figure 17 displays the amount of CO
2 emissions for various sell-back and grid power prices. From the results, it is obvious that the CO
2 emissions increase when the grid power price increases. For instance, in the case of a sell-back price of
$0.18/kWh, the CO
2 emissions increased by 96.4% when the grid power price increased from
$0.1/kWh to
$0.5/kWh. The increase in CO
2 is due to the fact that the system prefers to supply the load through the hybrid system (which includes a combination of renewable and conventional energy sources) rather than via the available grid system. Operating the conventional diesel system, in this case, will lead to high combustion of fossil fuel, resulting in the emission of tons of greenhouse gases that harm the environment; hence the large quantity of CO
2 emissions produced. However, a rise in the sell-back price will lead to the system relying more on the grid system to meet its load requirement.


