1. Introduction
The general character of the built environment that makes up a city is a territorial public good. A territorial public good is a good with a fixed location with high exclusion costs and non-rivalry in consumption below a good-specific congestion threshold. It can become a territorial private good as a result of congestion, but it depends on whether the gains from excluding non-payers as reflected in revenues exceed the costs of exclusion. Cities consist of an intricate mixture of territorial public and private goods. The facades of buildings, streets, squares and parks are typical territorial public goods. But the interior of these same buildings and of private gardens are territorial goods that have become private, mostly because the quest for privacy among residents yields a “congestion effect” as soon as an uninvited person enters spaces that are perceived as personal.
Within the city, it is the downtown area that tends to exhibit the strongest publicness characteristics. This is not only because downtowns usually host the most impressive buildings. A downtown exhibits the strongest publicness characteristics for two reasons. First, it is the area with the best general citywide accessibility to all territorial goods, including territorial public goods. Second, many downtown areas have been designed to facilitate human interaction, as in the Grand-Places of Brussels and 19 other Belgian cities.
Residential neighborhoods tend to have a greater proportion of territorial private goods and few people go there with the primary purpose of consuming their public goods. But there are exceptions, such as residential areas of architectural interest. One example is the first Bauhaus neighborhood in Berlin (Großsiedlung Siemensstadt). Another is the Hundertwasser House in Vienna.
The problem of achieving a sustainable city is first and foremost a question of finding a balance between public and private interests in the formation and maintenance of the built environment. Imbalances can lead to economically, socially and environmentally unsustainable development trajectories. An example of an economic sustainability problem is when an inadequate supply of housing leads to a choice between extreme commuting and extreme housing costs, while a social sustainability problem occurs when a group of people that shares one or more attributes is segregated from others in a neighborhood with adverse socio-economic outcomes such as high unemployment and crime rates. Environmental sustainability problems are a bit different from economic or social ones since they may be local or global. Sydney has low levels of local air pollution but contributes more than almost any other city to climate change due to high per capita CO2 emissions (see Table 4). But all combinations are possible: apart from Sydney (low local pollution/high CO2), there is Stockholm (low/low), Delhi (high/low) and Beijing (high/high).
A second aspect of sustainability is the dynamic or structural stability of economic, social or ecological systems. The ecologist Buzz (C.S) Holling [
1] calls this aspect resilience. In other words, sustainability is then related to the systemic ability to overcome adverse events of various types.
A third aspect of sustainability, which is more often focused on in Scandinavia than elsewhere, is the durability of buildings and other physical capital. The importance of this aspect is evident in the most common definition of sustainability in Danish, Norwegian and Swedish, which is “durable” or “long-lasting.”
2. The City as a Collection of Durable Capital
Apart from being complex mixtures of territorial public and private goods, cities are durable assemblies of capital goods, such as streets, squares, shopping centers, entertainment venues, office buildings and an astounding variety of production and consumption sites. The durability of the capital that comprises a city or large neighborhood is rarely homogeneous. A ten-year-old commercial building may be adjacent to an old park from the seventeenth century.
The durability of buildings is closely associated with the quality of the building materials and construction techniques as well as with management and maintenance routines (To ensure a sufficient level of maintenance of buildings with multiple ownership, it is necessary to adopt effective institutions for joint decisions on maintenance-related problems. One example is the practice of condominium associations to hold regular meetings with property-weighted voting rules. Another example is the principle of cooperative housing to schedule regular meetings with one vote per dwelling.). An eighteenth-century palace is much more durable than a 21st-century gas station. Most of the heritage buildings in cities with great numbers of structures from antiquity or the Renaissance, for example Athens, Florence, Miletus, Mycenae and Rome, were built with very durable materials. But there are also more recent cases such as Aberdeen in Scotland, where more than half of all buildings are made of granite from Rubislaw Quarry, which closed in 1971. Aberdeen’s largest and the world’s second largest granite building, Marischal College, is an interesting example of a durable, low-maintenance building. The central Quadrangle was built from 1837 to 1841. The first major renovation took place from 2009 to 2011. It is noteworthy that the renovation was completed on time and significantly under budget [
2]. The world’s largest solid granite building is El Escorial, a combined royal palace and monastery near Madrid that was built from 1563 to 1584. But the best illustration of the longevity of granite is the fact that the oldest structures in each of London, New York and Paris are three similar Egyptian obelisks—known as Cleopatra’s Needle in London and New York and the Luxor Obelisk in Paris—created in Heliopolis (Cairo) in 1475 BC for the Pharaohs Thothmes III and Ramesses II and moved and re-erected as the key orientation points of three large-scale territorial public goods: Victoria Embankment, Central Park, and the Place de la Concorde. Granite is the hardest of the stone groups and thus the most durable building material [
3].
While granite is at one extreme there are also other durable building materials, such as brick or ventilated and backcoated cement siding, which have life expectancies of over 100 years in all climates. Hardboard siding such as Masonite is one the least durable building materials, with a life expectancy of 25 years if ventilated and backcoated, but only 10 years if it is non-ventilated and non-backcoated. In addition, hardboard siding deteriorates even faster and is therefore considered unsuitable for the following climate zones: hot-humid; hot-dry; mixed-humid; mixed-dry; high rain [
4]. In other words, it is a non-durable building material that is only suitable in locations with low mean temperatures and low or moderate precipitation.
The average age of housing units and office buildings is highest in some European cities, and lowest in shantytowns in the developing world. China’s cities also mostly consist of new buildings with low life expectancies. Buildings with long life expectancies have lower maintenance costs, although investment costs are higher. This points to the importance of the rate of time discounting when investors decide whether to build high-quality or low-quality structures.
In this article we propose three principles that cultivate economic, social and environmental sustainability in the very long run:
The sustainability of a city derives from the durability of its past and present built environment. A high life expectancy of the structures that make up the built environment may thus become a criterion of successful urban development.
The economic history of the past millennium shows that cities with a durable built environment are more sustainable than nation states as suppliers of public goods that support economic development. Devolution of political decision-making from the national to the urban level may therefore serve as a second success criterion.
Urban planning for a sustainable built environment implies planning for high and equalized access to public transport. It also implies permissive regulations that allow for high floor area ratios as well as rural-to-urban land use conversions on the periphery of a growing city. Labor markets can only remain dynamic if they are matched by affordable and accessible real estate markets. Short trips on foot or by public transportation result in less energy use than long trips by car. Policymakers may use several criteria to assess the sustainability of urban planning practices. Examples include housing affordability (an economic sustainability factor), accessibility to jobs and services (economic and social sustainability), and per capita energy use (environmental sustainability).
3. The Durability of Capital
Carl Menger [
5] formulated the view—central to all later Austrian economists—that the marginal value to the user is the only factor determining the price of a good. The decision to supply a capital good—whether private or public—is based on expectations of future demand. Production costs are then sunk costs at the time of supply. The only consideration at that time would be the willingness to pay.
An example is the pricing of goods that have long been in existence, such as a heritage building. When sold at an auction, a heritage building would command a price that corresponds to the expected benefits to the highest bidder; the historical cost of production would have no effect at all on the price. The key decision for the seller is instead the timing of the auction.
Knut Wicksell was a mathematician as well as an economist and realized that this question could be resolved as a mathematical optimization problem. His resolution has become known as the maturation problem. Wicksell [
6] investigates the optimal duration of capital preservation (Exponential decay as in Equation (1) is also normally assumed in macroeconomic equilibrium models as well as in the perpetual inventory method used for the calculation of national accounts statistics.). It concerns goods that increase in value over time. One example among many is heritage buildings:
where
K = the present value of the building;
V(T) = the expected value (price of the building) at time T;
r = the discount rate, which equals the real rate of interest plus compensation for uncertainty and political constraints on building and land use.
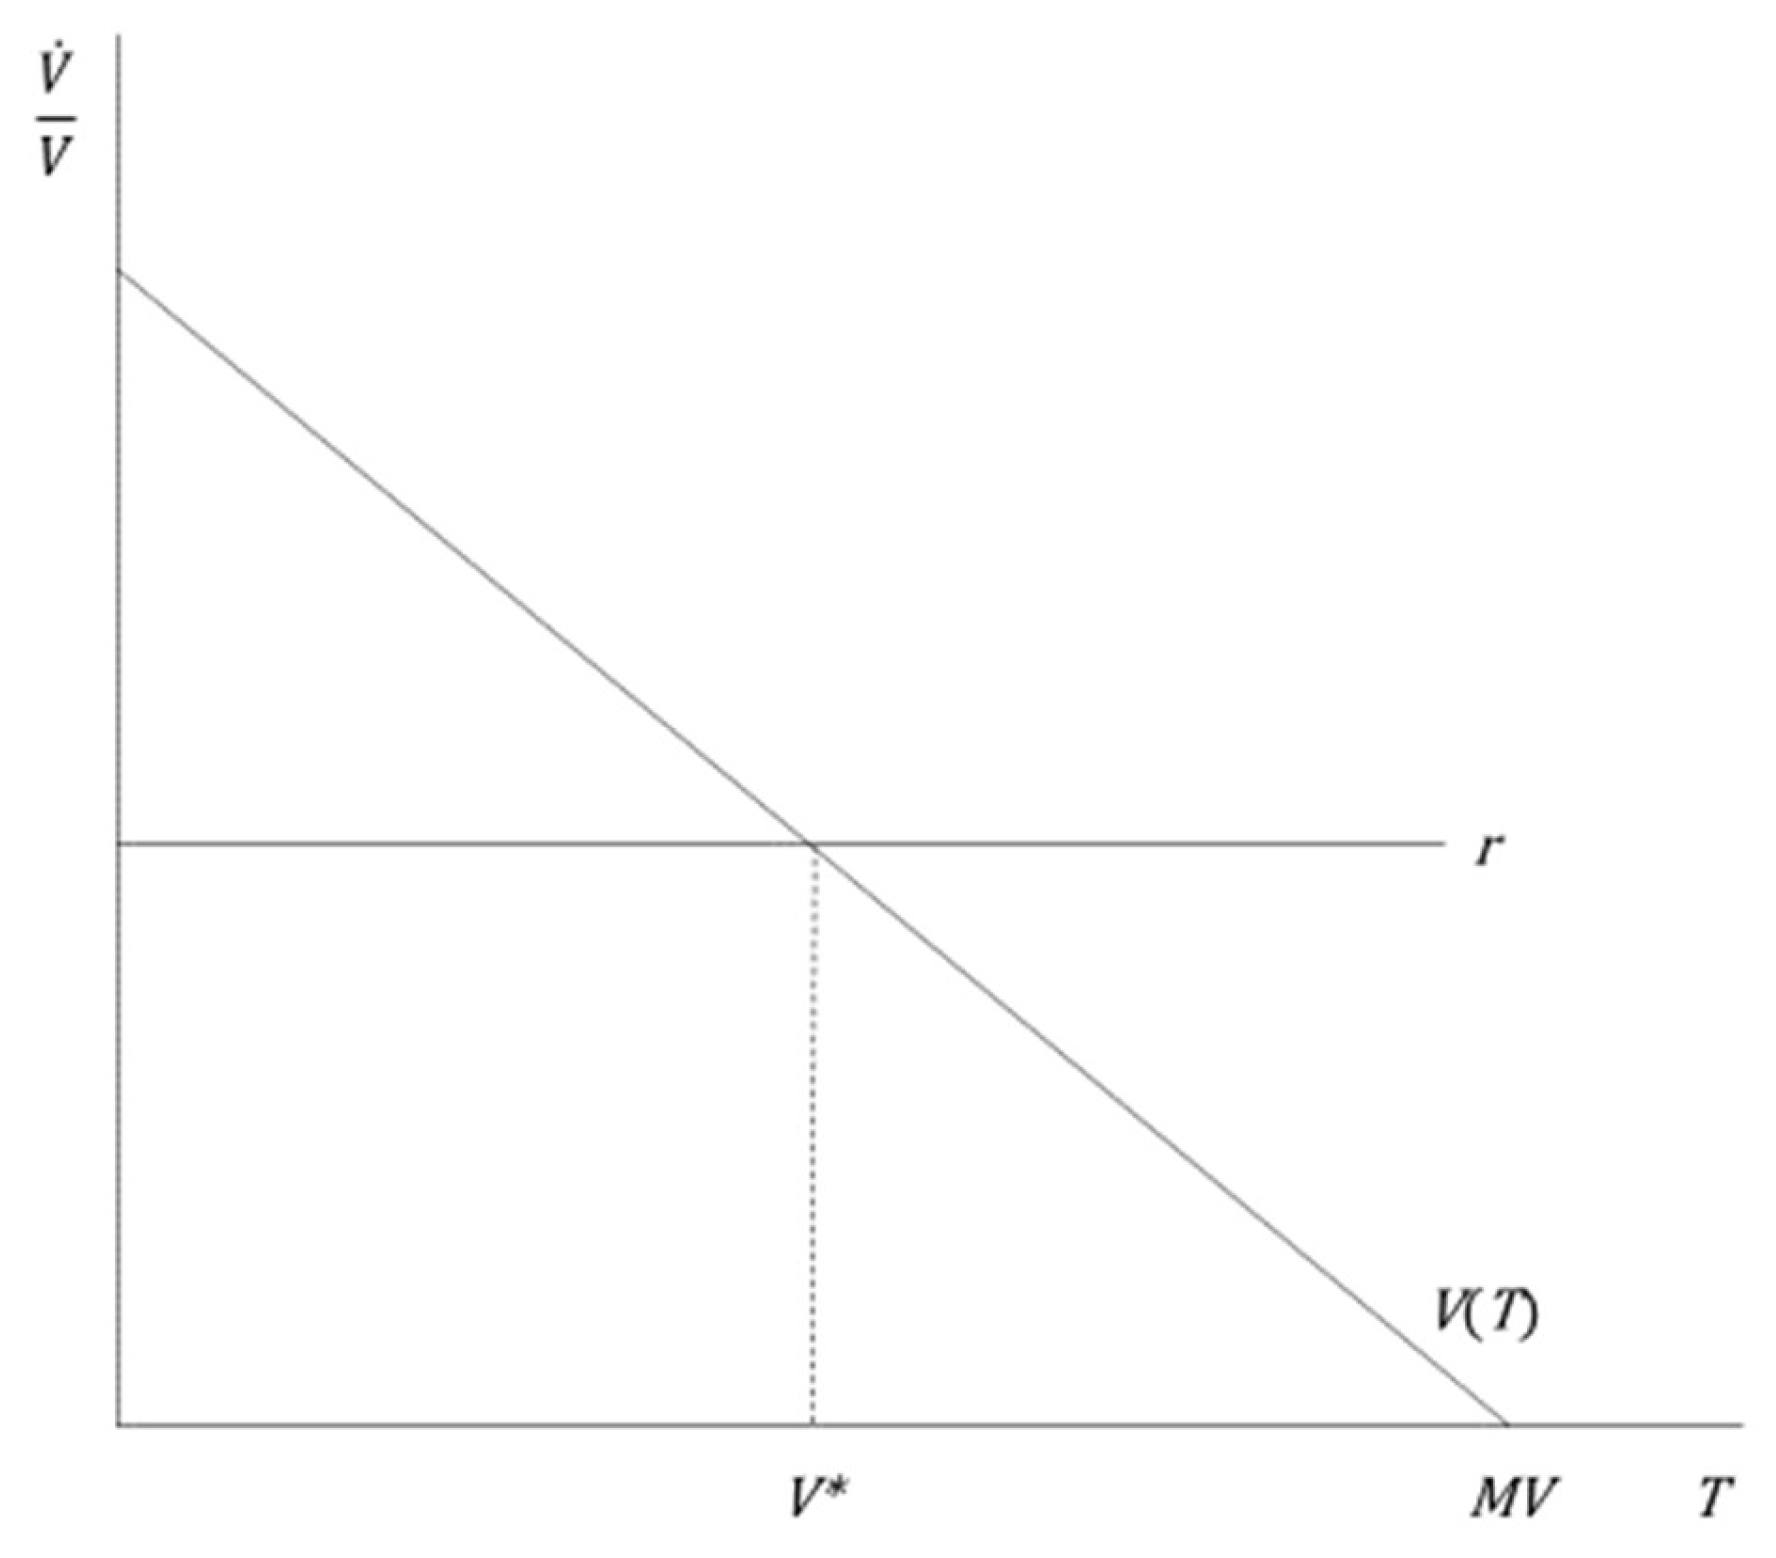
The necessary condition for optimal timing of the sale is that the real value growth rate equals the real discount rate, which happens at
V* in
Figure 1—illustrating this condition for the case of logistic growth of value over time. The growth rate is then a linear function of the attained value. The value or price reaches its maximum value when the growth rate has fallen to zero.
MV is the maximum value, which implies a longer maturation period than the economically optimal duration if the discount rate is positive, usually interpreted as the real interest rate. A zero real rate of interest hence implies that the optimal waiting time equals the time it takes for the good to reach its maximum value. This applies to decision-makers that buy the good as a pure investment good such as real estate speculators and investors in art or vintage wines. The buyer, on the other hand, is someone who gains direct utility from the consumption of the good, such as the utility she derives from living in a heritage building or from drinking a vintage wine.
As an additional hypothetical example, we may consider a museum curator who proposes a dynamic plan for buying paintings from the proceeds from selling one of the museum buildings. The board has made a preliminary decision that the museum should auction off the building immediately, but the curator opposes this decision. He contends that the timing of the sale (
T) should be a key decision variable. Consequently, the building—with an estimated current value of
C(0)—should not be auctioned off immediately but sold at the optimal point in time,
T, which depends on the expected value growth and the rate of discount. Based on historical observations, the curator has formed an expectation that the price of the building is an increasing function of time:
where
C(T) = the value of the building at time T;
C(0) = the initial value of the building;
β and α = estimated positive parameters, with 0 < α < 1.
The capital value must be discounted by the internal rate of interest,
r, which is the sum of the opportunity cost of keeping the building instead of saving the proceeds from the sale in a way that yields zero-risk interest plus compensation for perceived risk that reflects expected deviations from the expected growth rate in the building’s capital value. Risk perceptions vary across individuals, but they always reflect the uncertainty of the future. In the case of buildings, common sources of uncertainty involve business cycle effects, future land use regulations, and the interaction between cyclical and regulatory effects [
7].
Maximization of the present capital value requires the derivative of (2) to be set equal to the internal rate of interest, implying that α (ln ß) − r = 0.
Continuing with our hypothetical example, the curator assumes that C(0) = $200,000, α = 0.67, ß = 1.25 and r = 0.10. With these assumptions, the optimal waiting time—the best “maturation period”—would be 15 years. With this set of assumptions, the curator can calculate that the total expected value after 15 years will be approximately $785,000. At that time, the expected value growth rate equals the internal rate of discounting. If the real interest rate is five instead of ten percent, the optimal waiting period would increase to 28 years if all other assumptions remain unchanged. The alternative to an immediate sale would be to borrow money at the relevant interest rate in order to buy the desired paintings now.
4. Slow and Steady Wins the Race
Economic sustainability refers to the capacity of a city or a macro-economy to grow at a steady rate for a very long time—possibly with an infinite time horizon. Economists such as John von Neumann [
8], John Hicks [
9] and Roy Harrod [
10] analyzed the issue of sustainable growth with constant returns to scale from the 1930s onward.
With real estate capital as the focus of analysis, there must necessarily be a multisectoral representation of the regional economy (i.e., an economy consisting of a city and its suburbs with integrated real estate and labor markets). From the perspective of cities as the natural units of market interaction and public-good provision, most nations states are far too large, with Hong Kong and Singapore as the only sizable examples where the official territory and the real spatial extent of the multisectoral economy coincide.
Harrod’s [
10] one-sector accelerator model of investment assumes that the product of the difference between the expected and realized demand for goods and the capital–output ratio determines investments. The capital–output ratio is measured as the capital value at a point in time divided by the value-of-output flow over a period of time. Hence it is possible to measure the capital value at the end of the year, while output refers to the flow of value during the year. This would imply that the “dimension” of (capital/output) is (value/value/time) and thus that the dimension of (capital–output) is time. As Hawkins [
11], Lange [
12], and Bródy [
13] all point out, an inter-sectoral capital output ratio,
= Δ
, also has the dimension of time or economic durability.
Hence
=
; where
= the economic durability of good
i when used in the production of good
j, and
= the current use of input
i in the production of one unit of good
j. In the highly simplified case of a one-good economy we would then have:
where
The sustainable or long-term equilibrium rate of growth, g*, is (1 − a)/Ta. Preserving equilibrium at a sustainable rate of growth—while increasing durability—requires substitution by reducing the use of current inputs per unit of output. Increased durability thus implies a reduction of the use of goods as inputs. Furthermore, at the sustainable equilibrium growth path.
Thus, economic sustainability in a deterministic setting requires equality of the real rate of interest and the real rate of growth. Leontief [
14] generalizes this result to a multi-good economy, with households supplying working time to producers in exchange for consumption goods, including housing services. Von Neumann [
8] proves that the sustainable equilibrium is a solution where the maximum growth rate equals the minimum interest rate at the saddle point solution for a more general sustainable growth model, allowing for endogenous choice of techniques by substitution and joint production. The rate of depreciation of buildings and other capital goods—which is the reciprocal of economic durability (1/
T)—depends on the choice of production technique (A simple example would be the choice in a small restaurant between cooking on an open fire—to be fully reinvested each period—and investing in a modern electrified kitchen with an economic durability of ten years. Starting off with the first choice of technique when the rate of interest on loans is high, the owner would come to a decision to switch to the second more capital-intensive technique when the rate of interest has dropped to a much lower level than initially.). This implies a simultaneous endogenous determination of the durability of each capital good, the real rate of interest, and the economic growth rate along the sustainable economic path. Some economists call this sustainable path “the turnpike.”
It is now possible to formulate three preliminary conclusions:
Economic durability—a high life expectancy of physical capital—combined with reduced flows of current inputs and outputs is crucial for the long-term economic sustainability of a growing region.
The life expectancy of buildings and other real estate capital depends on the long-term deterministic equilibrium of the real interest rate and the real economic growth rate.
An economically sustainable growth rate implies slow and steady growth. Such growth is compatible with private and public planning for highly durable real estate and comprehensive preservation of the built heritage. High and volatile growth rates, as have been experienced in many East Asian cities after World War II, implies buildings with low life expectancies (see Table 2). High depreciation rates imply low life expectancies. For example, depreciation rate estimates for Chinese physical capital range from 5.0 to 9.6 percent, which correspond to life expectancies of capital of between 10 and 20 years [
15,
16].
5. Estimates of the Durability of the Built Environment
Durability is a key factor for economic sustainability and the preservation of the built environment as assemblies of territorial public goods. It differs greatly between different countries and cities.
Table 1 shows the percentage of buildings that were built before 1964 in several European countries.
The median age of buildings in Western Europe is greater than 50 years, while estimates of the median age of commercial real estate in the United States are in the vicinity of 50 years (CBECS). This age profile implies a slow sustainable real rate of growth of less than three percent annually, taking the productivity growth of the past several decades into account.
Table 2 shows the average age of buildings in Japan and some Asian city regions. The mean durability of buildings is much shorter in Asia than in Europe or North America.
The rapid but unsustainable growth of Asia’s “tiger economies” is a consequence of the combined effects of high savings and investment rates and the low durability of Asia’s real estate capital, as well as high levels of corruption in the construction industry (In many less developed countries, corruption problems have shortened the durability of buildings, such as when regulators turn a blind eye to when politically well-connected contractors use inexpensive but illegal building materials. While Japan, Hong Kong and Singapore are less affected by such problems today than in the past, it remains a serious sustainability problem in China and other Asian countries). While city regions such as Hong Kong (In the case of Hong Kong, with its unusually tight spatial constraints, the main way of dealing with greater demand in the real estate market has been densification-based redevelopment. This may well have shortened the economic life of many concrete buildings beyond what can be explained by the physical life expectancies of the affected buildings.) and Singapore have real estate capital with low durability the situation is the opposite in leading European and North American cities. Old buildings predominate in the downtown cores of these regions, and thus high durability typifies the most accessible localities. The high durability of centrally located buildings is usually combined with continually changing uses. These changes reflect the never-ending entrepreneurial quest for higher-valued location-specific land uses.
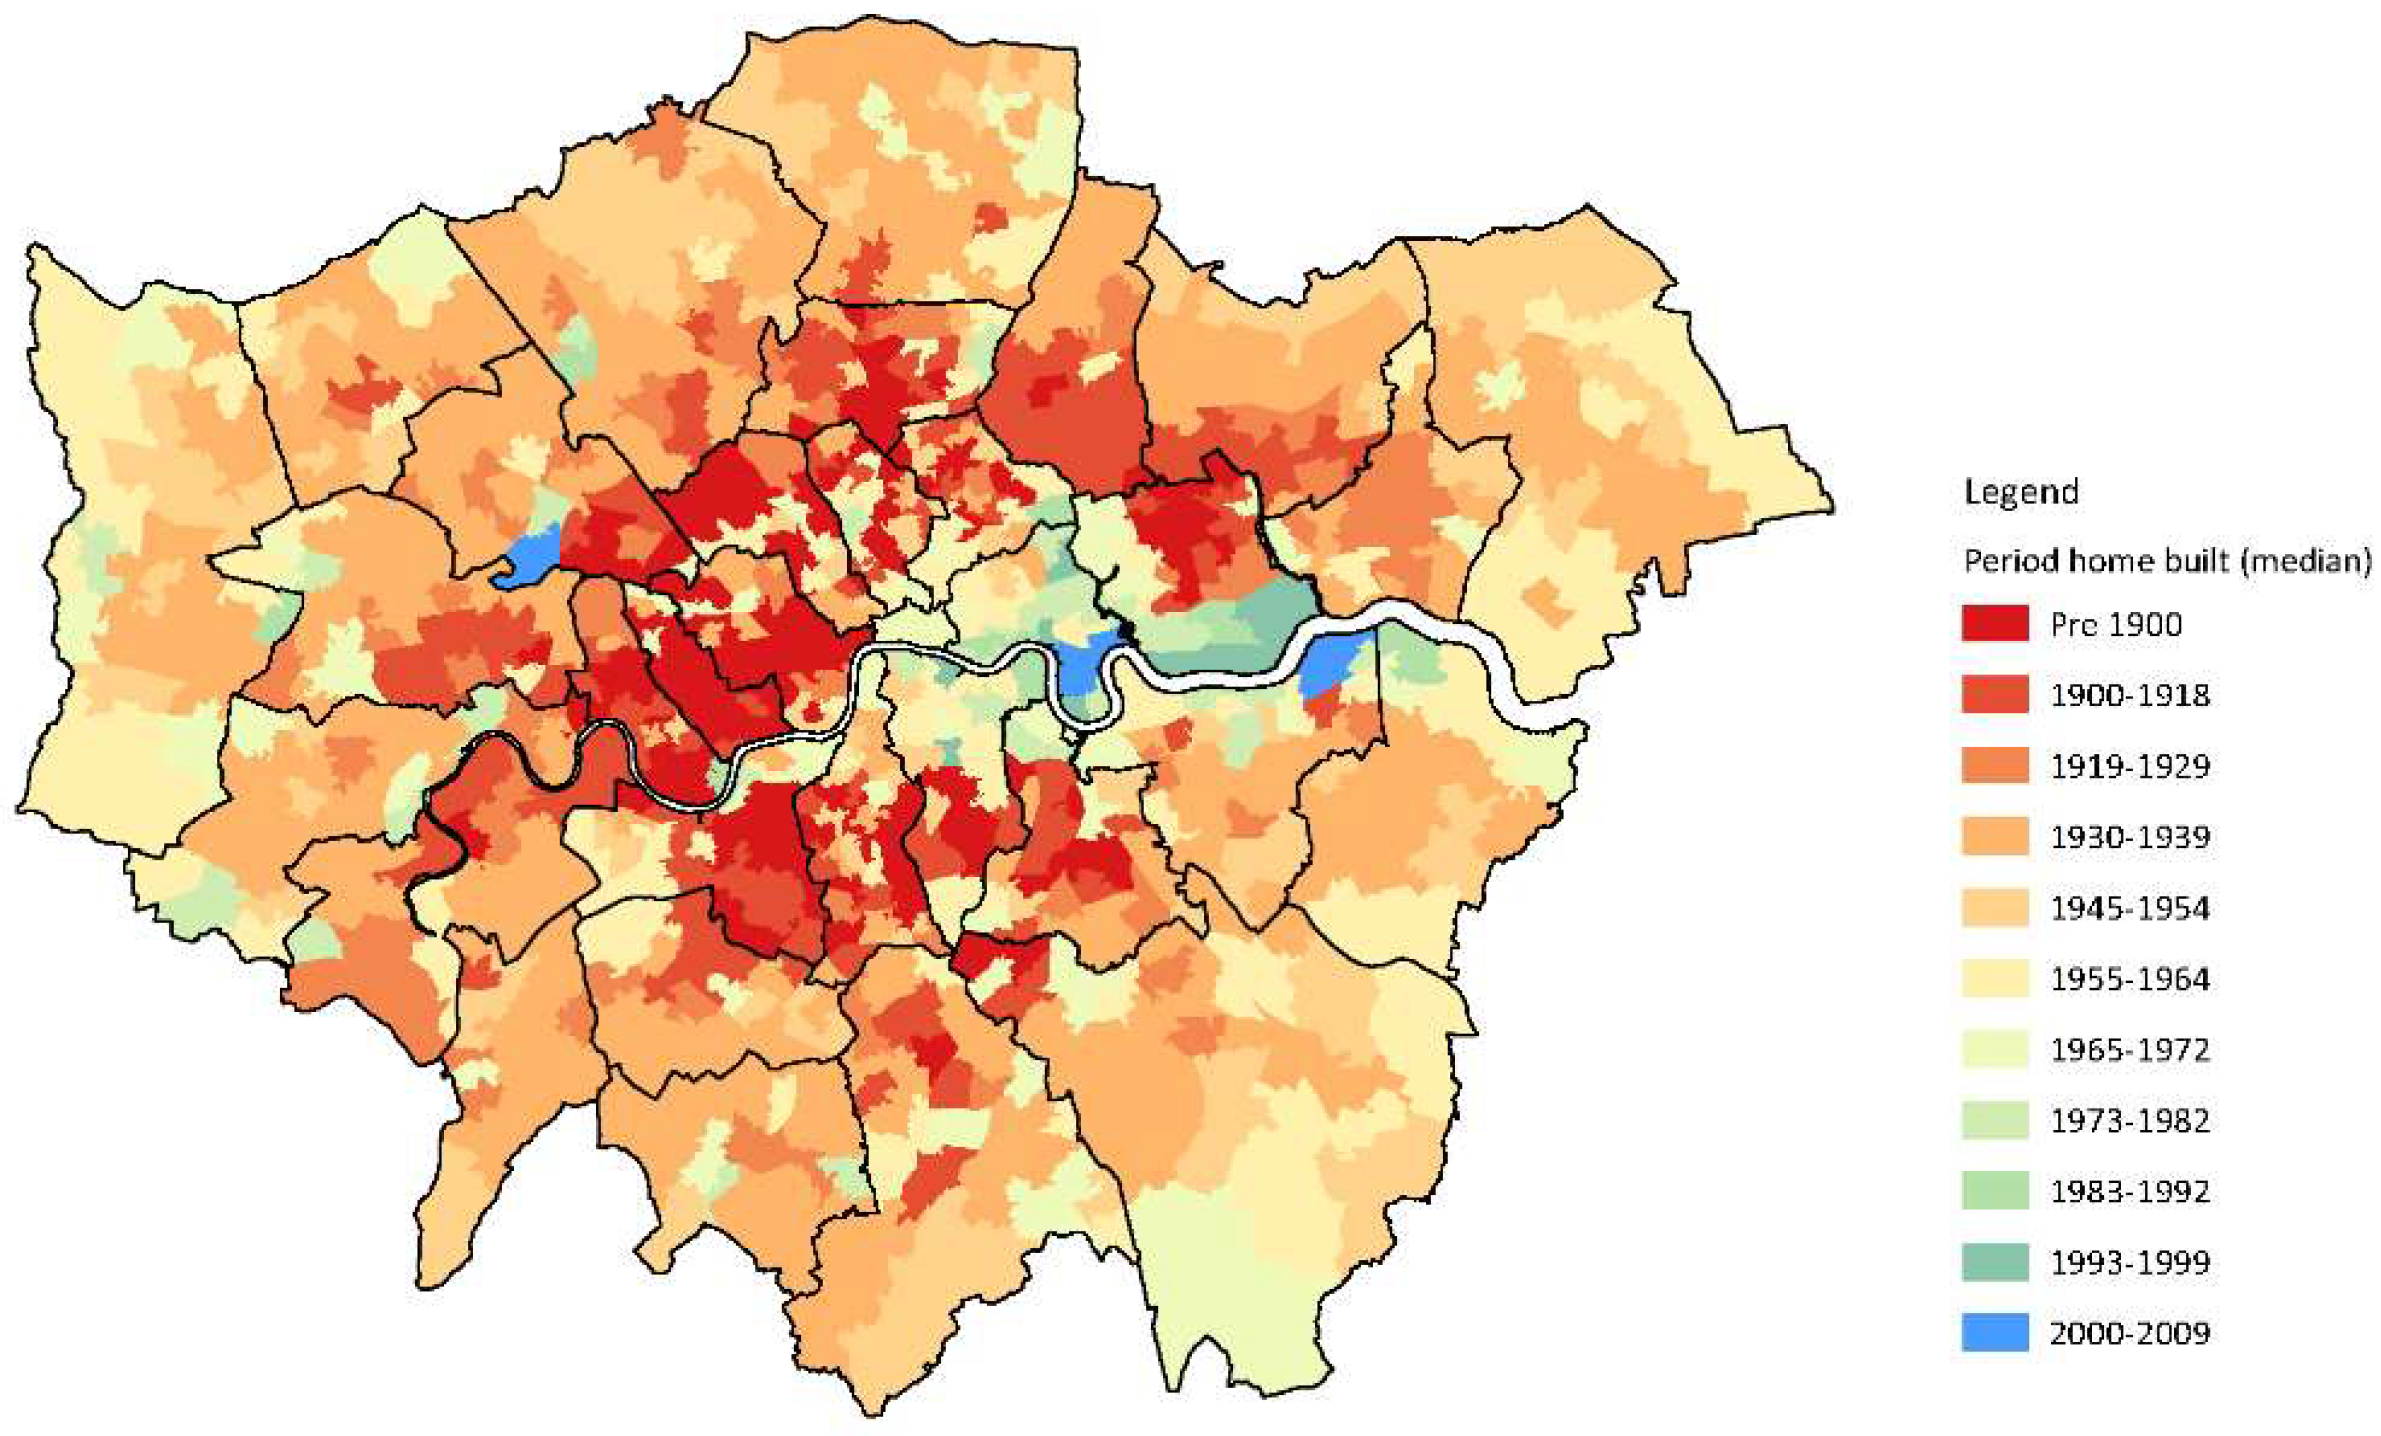
An example is the conversion of old warehouses and factories into fashionable apartments, offices, and specialty stores in London and New York City.
Figure 2 shows how pre-1900 real estate is concentrated in London’s most accessible locations.
The high durability of London’s real estate capital has not constrained productivity growth as compared with other regions. Instead there was a 20 percent higher real income per capita in purchasing-power-parity (PPP) terms in London than in Britain as a whole in 2017 (Office for National Statistics, 2018).
The average age of real estate in New York City is also quite high, if compared to the United States as whole (see
Figure 3).
The median age of New York’s built environment is close to 100 years. This high durability has been compatible with a real per capita income (PPP) which is 14 percent higher than the U.S. average. Paris is similar to London and New York City in these respects. More than 50 percent of Parisian buildings are older than 110 years (see
Table 3).
As in the cases of London and New York, Paris exhibits higher productivity measures than in other parts of the same country. In 2016, the real per capita income (PPP) was 18 percent higher than the French average.
We can thus conclude that above-average durability of the built environment has not prevented productivity gains and economic growth in major cities such as London, New York and Paris. The general strategy has been to build highly durable real estate, which has for the most part been flexible and adaptable enough to allow for changes in the use of buildings in tandem with changes in the economy as a whole. Asian cities have been entirely different in this respect. Usually, buildings are demolished after only two or three decades, after which entirely new brownfield developments respond to changes in the overall structure of the economy.
Many European and North American cities demonstrate that even old but flexible manufacturing buildings can be profitably converted into schools or university campuses. The land use conversions of port areas in cities such as Copenhagen, Hamburg, London, and San Francisco are notable examples of economically successful prolongations of the durability of buildings and townscapes. This is not necessarily limited to Western cities. Over the past 20 years, numerous old warehouses on the waterfront of the Taiwanese city of Kaohsiung have been converted to artists’ studios, specialty stores, restaurants and cafes. The most important necessary condition for such conversions is that the architecture is sufficiently flexible. The general environmental benefit of functional flexibility is avoidance of the waste of materials and energy that is normally associated with demolition work and brownfield redevelopment.
In architecture and planning practice there has in recent years been a trend away from simple-minded functionalist architectural designs and large-scale neighborhood plans. Such designs and plans are intrinsically inflexible due to their focus on unique uses and economies of scale. Instead the focus has been shifting towards buildings and neighborhoods that emphasize economies of scope and flexibility. This trend reflects a more widespread realization that the future is uncertain and involves unpredictable shifts in the market demand for specific land uses. One of many examples of this “flexibility trend” is the shift from specialized concert houses for symphonic music towards general-purpose cultural centers that not only host concerts of more musical genres than in the past, but also art exhibitions, conferences, and sports events.
6. Social Sustainability of Planning and Housing Policies
Cities that experience rapid economic growth tend to receive net population growth from the inflow of migrants from other regions and countries. In many cities around the world, the combination of demographic and economic growth has led to increasing excess demand for housing and urban infrastructure. Planning policies that do too much are often the cause of too little housing, whereas policies that do too little typically cause insufficient infrastructure provision.
In many of the historically most economically successful cities, the supply of housing has a price elasticity of supply that is close to zero. While the nature of housing construction tends to make the short-term supply elasticities somewhat inelastic by necessity, this is at most a secondary cause of the slow response of the supply to shifts in demand. In most cases, land use regulations are to blame. Examples of land use regulations that reduce the responsiveness of supply to demand changes include low floor area ratios, exclusionary zoning, urban growth boundaries, green belts, minimum lot sizes, regulated rents, time-consuming processes for approvals and permits and a host of other regulatory hurdles.
In the United States, the supply of housing is particularly inelastic in California and Hawaii. London and Stockholm are two noted European examples of inflexible land use regulations [
17]. The main consequence has been unaffordable housing-cost-to-income ratios which make it difficult to recruit outsiders—people who do not own homes in the region—through what are often better-functioning labor markets. In the most extreme case, Hong Kong, strict growth boundaries have been supplemented by massive inflows of speculative hot money from China, resulting in a median house price to median household income ratio of 20.9 in 2018, even though the typical household has three people sharing a 45-square-meter apartment [
18].
With near-zero housing supply elasticity, the predictable effect is increasing rents and house prices and a choice for new housing market entrants between spending almost all their income on mortgage payments or rents and locating in housing so far from the urban core that it is not normally considered part of the functional urban region. The outcome of strict land use regulations is often increasing segregation between spatial insiders and outsiders. Insiders are established residents who either bought their homes before their values were—for institutional reasons—inflated or, alternatively, inherited them from parents or relatives residing in the area (In Western Europe, the most overrepresented group of outsiders are immigrants from the Middle East or North Africa. On average, these immigrants have less accumulated financial capital, less education, and give birth to more children than the native insider population. With the exception of the high fertility feature, these observations also apply to outsiders (in-migrants) from poorer regions in the European Union).
It is common for the outsiders to have different socio-economic and demographic characteristics than the insiders. Young and asset-poor immigrants are especially overrepresented among the outsiders in most Western cities (in developing countries such as China outsiders are mostly young and poor rural-to-urban migrants).
There are three typical political responses to this problem:
The “favela solution” typical of rapidly growing city regions in the Global South. Urbanizing migrants are de facto disregarded in urban planning, but at the same time the policymakers turn a blind eye when migrants build shantytowns with no or minimal infrastructure. In Latin America, such shantytowns tend to persist for decades, although in some cases they may be belatedly connected to the electricity grid, as happened in Rio de Janeiro. At the other extreme, governments may decide to demolish shantytowns without advance notice and explicitly deny education and health care services to migrants, as in the case of Beijing.
The “European solution” is a combination of strict land use regulations and rent-controlled public housing. The solution offered to low-income in-migrants and immigrants is to provide them with small apartments in designated housing projects, often in inaccessible or otherwise unattractive areas. Occasionally, rent-controlled apartments exist in attractive downtown locations, but such housing tends to benefit insiders due to long waiting periods and the absence of eligibility criteria. Major European cities such as London, Paris, and Stockholm have adopted slightly different variants of this solution.
The “North American solution” consists of a set of complementary policies. One such policy is to mandate that private property developers set aside a small percentage of proposed residential projects as social housing with below-market rents and strict eligibility criteria. Another policy is to impose rent control with below-market rents on private landlords, with the result that some low-income households tend to live in poorly maintained inner-city neighborhoods. A third variant is to build public housing projects with strict eligibility criteria and low rents. Mixtures of these two policies are also common. Still, the supply is only rarely enough, and these initiatives are often supplemented with non-governmental organizations providing temporary homeless shelters for the worst-off. This solution is common in all cities with urban growth boundaries or strict housing regulations. Examples include New York City and most of the core cities along the west coast of the United States and Canada. At the same time, there are many affluent suburban municipalities that use land use regulations to keep out low-income residents, with minimum lot sizes in neighborhoods zoned for single-family homes being the most widely used strategy [
19].
7. Housing Affordability and Land Use Regulations
Most cities in Europe and North America have adopted land use regulations that constrain market actors when they make decisions about what to invest in and how to use specific plots of urban land. Pennington [
20] claims that these planning constraints are in the most extreme cases akin to land-based adaptations of the type of planning principles that Gosplan used for the nationwide allocation of capital in the Soviet Union. English and Welsh land use planning bear a striking resemblance to central planning in its classic socialist sense.
In addition to the detailed planning principles of the Town and Country Planning Act of 1947, the Town Centre First policy that came into effect in two stages in the 1980s and 1990s tightened the noose further. As an example, proposed new supermarkets must have a downtown location as their first location choice, but the planning authority may only grant permission for a new supermarket if there is a “need” and if it does not jeopardize the profitability of existing stores in the same area [
21]. Consequently, English and Welsh supermarkets tend to offer overpriced goods in cramped and logistically difficult locations. Likewise, relative to the United States and continental Europe, British housing built after 1947 tends to exhibit an unattractive combination of high price, small size, and relatively low quality (British land use regulations have resulted in higher urban land prices than elsewhere, particularly in London. Higher land prices and similar disposable incomes result in smaller dwellings and/or lower quality than in other high-income countries.). Evans [
22] calls the effect “rabbit hutches on postage stamps.”
The excessive use of planning constraints is also popular in the Scandinavian countries, leading to a price elasticity of supply that is close to zero. A recent estimate of the affordability of housing in the Stockholm region shows that the median house price to median household income ratio exceeds 10. Average building costs have also increased to 170 percent of the EU average [
17]. Similar conditions are present in other Nordic cities such as Oslo.
While cities in the United States are less extreme than their British and Scandinavian counterparts, it is still the case that land use regulations have inflated house prices and exacerbated business cycles, especially in the most regulated U.S. cities, which are all in California [
23]. Edward Glaeser and Joseph Gyourko draw the following conclusion:
Our alternative view is that homes are expensive in high-cost areas primarily because of government regulation, that is, zoning and other restrictions on building. According to this view, housing is expensive because of artificial limits on construction created by the regulation of new housing. It argues that there is plenty of land in high-cost areas, and in principle new construction might be able to push the cost of houses down to physical construction costs. This is not to imply that high prices exist in areas with weak demand fundamentals. A strong demand, because of attractive amenities or a thriving labor market, is essential. However, this hypothesis implies that land prices are high, not due to some intrinsic scarcity, but because of man-made regulations. Hence, the barriers to building create a potentially massive wedge between prices and building costs [
24].
8. Planning and the Environmental Sustainability of Cities
Glaeser [
25] contends that there is nothing that is greener than cities. We agree. In developed countries, energy use and greenhouse gas emissions are consistently lower in cities than in rural areas, and cities with high population densities tend to have lower energy use than sprawling ones. The average resident of New York contributes less than half as much to global warming than the average American. Likewise, per capita greenhouse gas emissions are only half as high in Stockholm as in Sweden as a whole [
26].
Environmental sustainability has both local and global dimensions. Climate change is mostly associated with carbon dioxide emissions, but such emissions have little effect on local air quality. Local pollution causes age-specific morbidity and mortality rates to be substantially higher in the dirtiest cities. It may also jeopardize a region’s economic sustainability. High levels of local pollution tend to repel people, particularly mobile entrepreneurs and knowledge workers.
Kennedy et al. [
27,
28] provide some of the most consistent estimates of per capital greenhouse gas emissions for a set of large and medium-sized cities in different parts of the world.
Table 4 shows indexed values of per capita greenhouse gas emissions, as well as indexed values of air quality, with New York City as the benchmark in both cases. The “total pollution index” provides a rough indication of the overall environmental sustainability of each city, with equal weights given to greenhouse gas emissions and local air quality. The air quality averages are annual averages [
29].
The pollution indices in
Table 4 reflect several underlying factors, of which density is one. Another factor is durability. Having more durable buildings implies better building materials and less construction activity in any given year. Better building materials tend to induce better insulation. In badly insulated houses, a substantial portion of heating and cooling energy is lost as it seeps through walls and windows. Small apartments are associated with lower energy use than single-family homes, other things being equal.
The Nordic capital cities have the lowest levels of total pollution per head of population, if one considers all emissions that damage the local or global environment. Like most of Europe, these cities have a highly durable built environment. In addition, superior insulation standards more than compensate for a greater number of heating degree days than in western and southern parts of Europe. Most single-family homes, apartments and offices in Scandinavia and Finland have triple-glazed windows; some even have quadruple-glazed ones.
The low level of energy loss associated with heating indoor spaces is in the Nordics complemented with a host of other policies that lead to low levels of energy use and pollution, such as comprehensive public transport networks, recycling of household waste, reliance on hydroelectricity, nuclear power and wind turbines as primary energy sources, road pricing (in Oslo and Stockholm) and the popularity of cycling and walking for home-to-work commuting. In addition, most residents of the Nordic capitals live in apartments or small single-family homes, and few people live in the type of sprawling mansions that are a common sight in American suburbia.
Based on a study of Toronto census tracts [
30], Hoornweg et al. [
26] note that residents in dense inner-city neighborhoods have the lowest levels of per capita emissions:
A close examination of the GHG (greenhouse gas) attribution by census tract reveals interesting correlations between per capita GHG emissions, urban form and service access. … The neighbourhood with the lowest emissions per capita is a high-density apartment complex within walking distance of a shopping centre and public transit. The average emissions per capita neighbourhood consists of high-density single family homes close to the downtown core and with access to public transit. The highest emissions per capita neighbourhood is located in the suburbs, consisting of large, low-density single family homes, distant from commercial activity.
Both greenhouse gas emissions and other pollution increase with increasing economic output, other things being equal. These other things are however anything but equal from a global perspective. Scandinavia’s capital cities produce at least twice as much output in purchasing-parity-adjusted terms as Beijing on a per capita basis, and yet each person contributes much less to global warming as well as local pollution. Beijing residents may live in small apartments and travel by public transport, but that is of little help when an intrinsically wasteful economic system—state capitalism—guides planning and the allocation of resources.
The built environment of Chinese cities may have the world’s lowest average durability. The predictable consequence of a short time horizon is energy-intensive construction sites all over China’s cities and the use of low-quality building materials, with the effect that much of the energy used up for heating and cooling buildings escapes through single-glazed windows and thin walls. Thus, Beijing’s residents not only live in some of the world’s least affordable apartments; they are also some of the least durable and least insulated ones, in one of the least energy-efficient economies.
In more developed liberal democracies, however, high use of transit systems is associated not only with lower transport-related transit use, but also lower levels of energy use in general, since cost-effective public transport goes hand in hand with a large population size and a high population density. This is particularly true of the greenest public transport system, which is rail transit. In a study of mass rapid transit (MRT) and light rapid transit (LRT) in 97 cities, Shyr et al. [
31] show that rail transit networks exhibit increasing returns. In an econometric analysis, they found that the number of passengers—as the output variable—depended on three input variables: the number of stations, the size of the urbanized area, and population density in the urbanized area. Doubling all three inputs was associated with a passenger volume 2.68 times greater than the initial value.
Increasing returns explains why rail transit networks are sometimes the most popular and sometimes the least popular modal choice. Building one or two lines in a large sprawling city does not make much sense. The only economically sustainable choices seem to be to build an all-encompassing public transport network, or no network at all. Consider the contrast between Los Angeles and Stockholm. In Stockholm, the mean MRT/LRT station has a passenger “catchment area” of 1.15 square kilometers. The corresponding Figure for Los Angeles is 55.15 square kilometers. The effect of this discrepancy is that the average Stockholm resident makes 0.60 trips per day, while the average Angeleno manages less than 0.03 trips per day. While Stockholm is in the same general category as Los Angeles in terms of economic sustainability, it is more environmentally sustainable than Los Angeles as well as than just about everywhere else.
9. Planning for Sustainability
All economic actions require planning. Most of the planning is done at the level of households and firms. In these planning activities uncertain preferences, risk aversion, future prices, budgets and other personal and institutional constraints must be taken into account. As discussed in Hayek [
32], these highly uncertain conditions of planning imply that it is essential that economic decision-making reflects the dispersed local knowledge of all market participants, as is the case in a decentralized market economy. Central planning—whether of the old Soviet socialist type or the current practices of Chinese state capitalism—requires an omnipotent and omniscient planning agency with unlimited access to information about the preferences, skills and personal plans of all affected individuals. Since this is never the case, the pattern prediction is that some goods and services will be a haphazard mixture of gluts and shortages. While the state capitalist variety of central planning makes moderate use of market price formation, serious misallocations of resources remain common. A pertinent example is China’s state-controlled housing market. In 2014, more than 50 million vacant apartments co-existed with mean (note: not median) household price–income ratios that were greater than 15 in Beijing and Shenzhen [
33]. In 2019, the property price to income ratio had increased to between 45 to 47 times median household income for a 90 sq.-m. apartment [
34].
Andersson and Andersson [
35] propose a two-by-two division of goods that reflects relative pace of change (fast vs. slow) and typical impact (individual vs. collective). Using synergetic theory, they show that public policy should focus on those goods that change at a slow pace and that have collective impacts. Other policy interventions tend to misallocate resources, either by causing gluts and shortages or by providing individuals with goods that are inferior to the goods that utility-satisficing and income-constrained households would acquire in unfettered markets.
Table 5 shows how the four categories of goods correspond to four distinct types of regulation. The most comprehensive historical example of comprehensive interventionism is central planning as practiced in the Soviet Union and its satellite states until the fall of state socialism in 1989.
The central planner, as institutionalized by Gosplan in the Soviet Union, intended to plan or regulate all activities in all four parts of the table. It allocated jobs and housing to individuals, while queuing was more important than the administered below-market price for rationing consumer goods. Occasionally, prices were set higher than what would have been the market price, resulting in gluts. The planner also allocated education and health services to individuals according to their assumed needs. A detailed five-year plan pinpointed the exact—but in reality, arbitrary—capital requirements of all industrial plants. Centrally planned propagandists wrote appropriately uplifting accounts of the attainment of political and economic objectives. The central planner also invested in roads and other infrastructure, although the focus was more often on serving the logistical requirements of the armed forces than on supporting households’ self-selected transportation or energy preferences.
Current Chinese practice is a less extreme version of central planning. The state plays a much smaller role in the allocation of consumer goods, where (slightly distorted) market prices serve as the rationing mechanism. State-owned or private state-linked firms that are more independent than under Soviet-style planning make investment decisions, but state-owned banks funnel their funds to well-connected insiders, resulting in budget constraints for individual firms that are either super-soft or draconian. Fast-paced collective goods are as centrally planned as in Stalin’s Soviet Union; China’s so-called “journalists” are propagandists for the Chinese Communist Party.
10. Planning for Sustainability in Liberal Democracies
Modern liberal democracies are milder than totalitarian states. They generally let market interactions guide the allocation of goods, investments, and information, but many countries have specific industries that exhibit the generic characteristics of central planning. In countries such as Sweden and the United Kingdom, catchment areas allocate patients to state hospitals, and a below-market price—zero in the case of Britain—has resulted in rationing by queuing. But it is in the allocation of real estate investments and the pricing of housing that central planning is most common. Government agencies decide the location and design of housing and other real estate, and sometimes they decide rents. Typically, prices in the owner-occupied sector are formed in the market, but they are market responses to planner-imposed scarcity.
Table 6 summarizes the typical mixture of markets and planning in liberal democracies.
The infrastructure is the main concern of the planning and investment process in a well-functioning democratic city region. The arrows in
Table 6 shows how the infrastructure (including formal and informal institutions) provides a foundation for market exchanges of less durable or less collective goods and services. A theorem in
Appendix A shows that the sustainable stable equilibrium properties are consistent with such democratic planning systems.
A consequence of this view of the planning problem is that central planning is as dysfunctional in real estate markets as in the markets for apples or oranges. But because of prohibitive transaction costs, governmental planning remains desirable for a small subset of goods. These goods are mostly large-scale territorial public goods. An improved and more sustainable planning system would have to reflect the synergetic nature of the kind of problem a city is. It is possible to subdivide the urban system into different time–space combinations. Public planning is most appropriate for those goods that are most durable and affect the greatest number of direct or indirect users. Specific examples include commuter networks, mixed-use streets, heritage buildings, and the ecological system.
Economic sustainability requires “nomocratic planning” [
36,
37]. This means that open-ended, transparent, and universal rules govern the creation and exchange of property rights over land in such a way that the supply of specific lots and buildings evolve in tandem with the evolution of demand. Nature, not human planning, is the originator of scarcity. A growing city with an expansive labor market will then become a city that is simultaneously becoming taller, denser, and larger. Unless the city is on a small island, housing will remain sufficiently affordable for people who migrate to the city in response to income opportunities. A permissive planning system also serves as a disincentive to dysfunctional segregation. As Jane Jacobs noted long ago, poor people are more likely to thrive in run-down buildings in downtown locations than in newly constructed social housing on the periphery [
38]. The difference reflects not only access to jobs, but also the profitability potential of small-scale entrepreneurship.
Nomocratic planning that focuses on the infrastructure results in greater economic and social sustainability, other things being equal. But environmental sustainability requires a few modifications. While many rich cities have reduced local air and water pollution to acceptable levels, this is much less true of greenhouse gas emissions. Greenhouse gas emissions such as carbon dioxide reflect energy use, and plans that lead to less per capita energy use or more efficient energy production are thus conducive to environmental sustainability at the global level. Per capita energy use increases with urban sprawl. Large and dense cities tend to have the lowest per capita energy use. A comprehensive public transit network as well as widespread walking and cycling also reduce energy use. Small apartments require less heating or cooling than large single-family homes. Cities in climates with frequent heat waves or cold spells are also less environmentally sustainable for the same reason.
11. Conclusions
We can now formulate the quest for a sustainable city. A sustainable city combines stable long-term economic growth with a resilient ecological system, as well as with the spatial inclusion of different socio-economic groups. In this context, spatial inclusion primarily involves provision of good city-wide access to territorial public goods, whether in the downtown area or elsewhere.
A key variable that affects economic, social and environmental sustainability is the durability of capital and especially the durability of buildings and the physical infrastructure. Some cities exhibit high durability in the topology of transport networks and building stocks, with median durability in excess of one hundred years. London, New York, and Paris are perhaps the most important examples, but there are many others, particularly in Europe. Asian cities are as a rule much less durable, with China’s cities being at the other extreme, along with the informal settlements that house the urban poor in most parts of Africa, Asia and Latin America.
There are several underlying factors that tend to increase the mean durability of the built environment. Examples include a legal system with reliable protection of property rights, stable monetary and fiscal policies, and building codes that mandate durable building materials such as granite, brick and high-quality cement and other building components compatible with low U-values. Such building codes should however not extend to the use of the buildings, where innovation-driven processes of economic development benefit from open-ended adaptability in the use of buildings and the urban infrastructure. The need for a specific building code is related to problems of asymmetric information [
39]. Buyers or renters can observe the height or economic use of a building. It is much more difficult to observe the durability of a building or whether it is a fire hazard [
40].
Combining highly durable capital goods, which includes all types of real estate, with relatively little use of perishable goods and services yields stable but moderate economic growth in the very long run. Low interest rates and low levels of political uncertainty lead to investment in more durable buildings, as has been the case in North America and Western Europe after World War II. There are also some indications that Japanese cities are transitioning towards more durable buildings and infrastructure, due to a combination of more stringent earthquake-related building codes and a lower and more stable economic growth rate.
Many of the advantages of infrastructure planning and durability-inducing building codes are lost when urban planners issue severe constraints on the plot-specific choice of land use or attempt to limit urban population growth or entrepreneurial land use innovations. The British planning system and its imitators in Scandinavia and in some Commonwealth countries are case studies of how not to plan a city. Examples of planning that affects housing markets more than other real estate markets are common in parts of North America, particularly in West Coast cities. Conversely, many continental European markets regulate office and retail space more than housing, for example via building height limitations and regulated opening hours. The overall effect of over-regulation is unaffordable real estate, which causes negative spillovers such as localized labor shortages, greater energy use and longer time distances for commuters. Overly zealous regulators thus make cities less sustainable in economic, social and environmental terms.
Rapid technological development and evolving consumer preferences can lead to a shortening of the planned life span of buildings. But the experience of dynamic old cities such as London, Paris and New York show that it is possible to adapt most old high-quality buildings to new and unanticipated uses. Factories, warehouses, and even churches of declining denominations can transition to accommodate new uses such as open-plan apartments, offices, and specialty stores. This adaptability facilitates the preservation of the built heritage, while keeping the city sustainable in the broadest sense of the term.
A focus on economic sustainability alone have led some economists to single out the cities with the most affordable housing as desirable benchmarks [
23]. Large and growing cities with affordable housing include Dallas and Houston, both of which apply more permissive land use regulations than almost anywhere else. But a focus on other types of sustainability makes it more difficult to pinpoint an ideal city. Dallas and Houston both contribute disproportionately to climate change, which reflects high per capita consumption of housing and office space, and a transportation system that is as suitable for automobiles as it is unsuitable for mass rapid transit.
Interpreting sustainability in environmental terms yields an equally lopsided conclusion. Stockholm and Oslo then become the benchmarks, despite their unaffordable housing markets and virtual prohibition of spontaneous land use innovations.
A focus on social sustainability complicates the picture further. American cities are often segregated along racial, ethnic, and socio-economic lines, with very unequal access to territorial public goods, jobs, and entrepreneurial opportunities as a result—Chicago is a particularly striking specimen of extreme segregation. Similar patterns exist in Europe, but they tend to be a bit more subtle, except for public housing estates in inaccessible peripheral locations. Echoing Jane Jacobs’ comment about small-scale entrepreneurship, a guideline for social sustainability might be that it is better for those on low incomes to start out in tiny old rooms in good locations rather than in big new apartments in some peripheral housing project.
There is therefore no single city that is an overall sustainability benchmark other than in a negative sense. A reasonable sustainability ambition could be to maximize the distance—in some appropriately measured three-dimensional diagram—from the economic, social, and environmental sustainability metrics associated with Beijing.


