Article

The Analysis of the Economic Effects on the Greening and Recovery of the Sludge Waste Resulting from the Biogas Production Activity

by
Constantin Aurelian Ionescu
1,
Mihaela Denisa Coman
2,*,
Elena Liliana Moiceanu Marin
3,
Liliana Paschia
1,
Nicoleta Luminita Gudanescu Nicolau
4,
Gabriel Cucui
5,
Dan Marius Coman
5 and
Sorina Geanina Stanescu
2
1
Faculty of Economics, Hyperion University of Bucharest, 030615 Bucharest, Romania
2
Institute of Multidisciplinary Research for Science and Technology, Valahia University of Targoviste, 130004 Targoviste, Romania
3
IOSUD, Valahia University of Targoviste, 130105 Targoviste, Romania
4
Romanian Academy, Institute of National Economy, 050711 Bucharest, Romania
5
Faculty of Economics, Valahia University of Targoviste, 130004 Targoviste, Romania
*
Author to whom correspondence should be addressed.
Sustainability 2019, 11(18), 4922; https://doi.org/10.3390/su11184922
Submission received: 31 July 2019 / Revised: 30 August 2019 / Accepted: 5 September 2019 / Published: 9 September 2019

Abstract

:
Starting from identifying an upward trend in waste disposal costs at the municipal landfill, the research aims to analyze the viability of investment to integrate a compost platform, which transforms the sludge resulting from the biogas production process into a soil improver for agricultural land. The economic entity analyzed activates agri-food and uses a biogas plant as a management tool for the waste from slaughtering chickens, to obtain biogas, heat, and electricity. The study is carried out through the multi-criteria analysis based on the following variants: The operation of the biogas plant with sludge disposal as waste (V1), the operation with recovery of waste as soil improver (V2), the closure of the biogas plant (V3). The economic effects regarding the greening and capitalization of the sludge waste are quantified from a monetary point of view and based on the analysis the optimal variant, V2, is established. It has been proven that the investment generates: Positive results increased by 70.52%, a positive and upward opportunity cost by 37.96%, and marginal profit growth of 53.17%. The study emphasizes that efficient waste management turns an environmental problem and cost into an economic and ecological advantage for the economic entities.

Graphical Abstract

1. Introduction

Accelerating climate change, exhaustion of natural resources, increasing waste, and carbon emissions are subjects widely debated by researchers [1,2,3], which emphasizes the need to implement sustainable development practices in economic entity activities to ensure their long-term sustainable development protecting the environment and, at the same time, ensuring economic development without affecting the evolution of future generations [4,5]. At European Union level, there is a focus on the transition to a zero greenhouse gas economy that will radically transform the energy system, the land usage, and agricultural sector, industry, transport systems, and cities, changing more and more all the activities of society [6,7,8,9]. This transition implies [10,11,12,13]: (i) The evolution of the energy system based on a secure and sustainable energy supply and on the integration of the electricity and gas supply systems and markets, district heating or cooling, as well as mobility, by using smart grids that place citizens in a central position, (ii) acceleration of technological innovations in the energy, construction, transport, industry, and agriculture sectors, (iii) progress in the areas of digitization, information, and communication technologies, artificial intelligence and biotechnology. The depletion of conventional energy resources requires the obtaining of energy from renewable resources which determines the opportunity of using waste as a raw material to support economic activities, such as methanogenesis processes with the production of biogas (bioenergy) and digestate fertilizer in the case of organic waste [14,15,16]. At the same time, biogas production is the main topic for numerous scientific studies that deal with the subject from an economic and technical point of view. From the economic point of view, the biogas production was analyzed by the researchers as follows: Franchetti [17] compared different types of technological configurations of anaerobic digestion, from an economic and energy point of view. Lin et al. [18] highlighted the economics of solid–state anaerobic digestion and evaluated the composting finding both economically feasible. Yashiazaki et al. [19] evaluated the economic viability of integrated technology of biogas energy and compost production for palm oil mill management. In their studies, Yiridoe et al. [20], Wresta et al. [21] and Klavon et al. [22] found that farms are interested in investing in the necessary technology for biogas production due to significant cost reductions with electricity, waste management, as well as for the recovery of the by-product of anaerobic digestion, namely compost. Gebrezgabher et al. [23] carried out a scenario analysis, based on a linear programming model to identify feedstocks that optimize electricity production and to determine the optimal application of digestate. Akbulut [24] performed a techno-economic analysis of electricity and heat generation from farm-scale biogas plant showing that the biogas produced in a CHP unit is more profitable than the utilization of biogas in a combustion unit that produces only heat. Aui et al. [25] performed a techno-economic analysis and life cycle of a farm-scale anaerobic digestion plant. Singh and Sooch [26] made an economic comparative study for different models of biogas plants.
From the technical studies, biogas production through the anaerobic digestion process reduces the emissions of methane (CH4) and nitrous oxide (N2O) resulting from biomass storage [27,28,29,30,31,32], thus, the greenhouse effect potential of methane is 21 times higher and nitrogen oxide 296 times higher compared to carbon dioxide [33,34,35,36]. Following the anaerobic fermentation of the biogas production process, biogas and a residue, called digestate, result [37]. The elimination of waste and sludge from biogas plants presupposes the proper management of these, both in terms of costs and environmental effects, by identifying alternative solutions for transforming the soil into soil fertilizer [38,39,40]. Numerous authors have used sludge as a starting material for the production of compost and indicated that composting is a technique that converts sludge into a useful product which can generate many opportunities and cost reductions for agri-food entities [41,42,43,44,45,46]. The scale of waste management processes suggests the idea of using, recycling, and composting [47,48,49,50,51,52]. It is obvious that the recovery of waste at the present stage is much more important than its liquidation by destruction or storage in landfills. According to Andreadakis et al. [53] and Chen et al. [54], the sludge can be used in agriculture without other treatments, but it depends on the raw material used and a composting treatment that is beneficial for stabilizing the sludge. Thus, the sludge can be considered as a by-product and not waste if it is to be used as a raw material in agriculture as a soil improviser [55,56,57]. If it cannot be used directly, it must be subjected to special thermal treatments (subjected to temperatures above 60 °C). Research has shown that this compost can bring essential nutrients to the soil, increase the soil’s ability to retain water and stir the soil, accelerate root growth and seed germination, making it an ideal breeder for poor soils [58,59,60].
In Romania, an increase in biogas production is registered in the context of renewable energy legislation [61,62]. Attention to such business is also directed to sludge from methanogenic fermentation for the improvement of poor soils. Restrictions of environmental bodies related to waste management require such waste to be harvested by composting in useful products, such as soil improvers [59,60]. The fermentation sludge contains 3.00–6.00% dry matter and encompasses all the inorganic/organic substance palette of substrates that have entered fermentation. In order to be used as soil improvers, fermentation sludge must meet certain requirements laid down in Romanian [63] and European Union legislation, which mainly relate to the chemical composition of the sludge.
The purpose of the research is to analyze the economic effects of transforming the sludge from the production of biogas into soil improvers for agricultural land, starting from the following hypothesis:
Hypothesis 1.
The correct management of sludge waste from the biogas plant can transform an environmental problem and, implicitly, cost, in an economic advantage and can bring ecological and economic benefits in line with the principles of sustainable development.
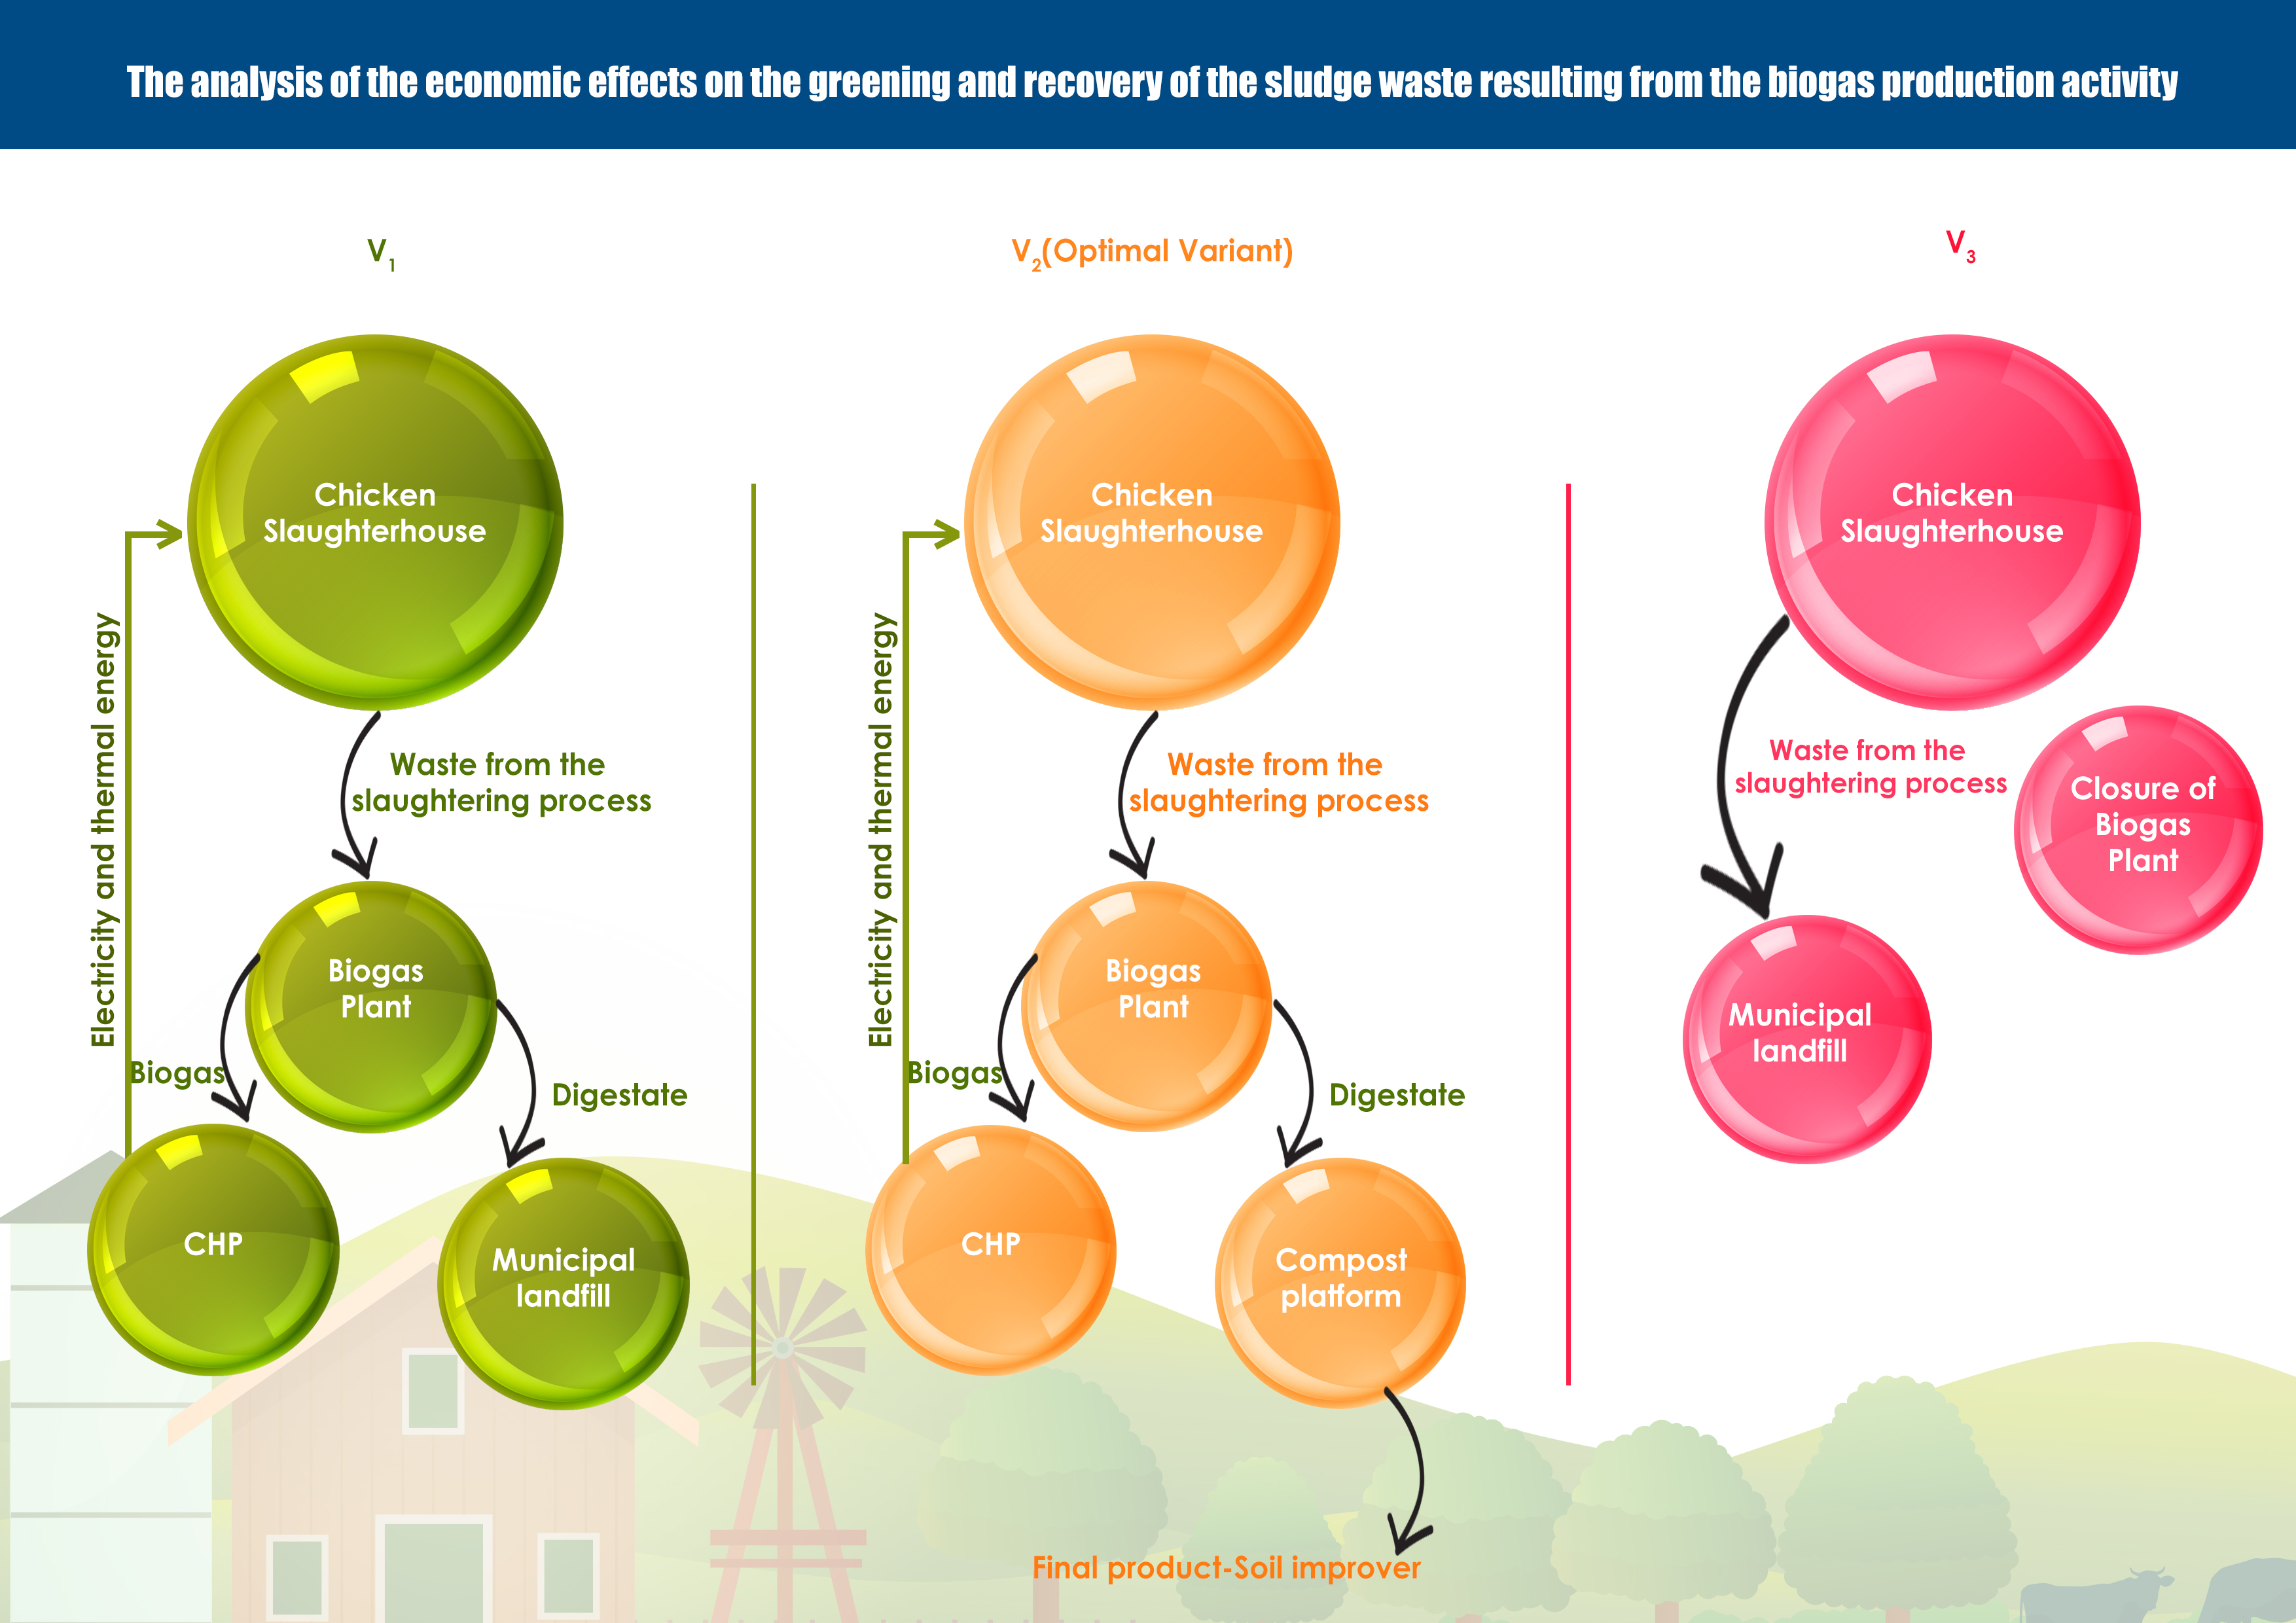
In order to verify the hypothesis, the study is conducted at an agri-food economic entity that uses a biogas plant as a waste management tool from slaughterhouses to obtain electricity and heat. In the present case, the identified problem consists of the treatment of the waste/sludge resulting from the biogas process, which can be removed at the municipal landfill or can be transformed into soil fertilizer. In order to analyse the economic effects on the greening and recovery of the sludge waste, resulting from biogas production, three possible scenarios for the economic parameters, considered for choosing the optimal variant for the greening and recovery of the sludge waste, resulting from the biogas production activity will be taken into account: The current variant of operation for the biogas plant with discharged sludge as waste (V1), the operating variant of the biogas plant with waste recovery as a soil improver (V2), the closure of the biogas plant variant (V3).

2. Materials and Methods

2.1. Materials

According to the existing technology within the economic entity, digestate is subjected to a separation operation by centrifugation of the solid fraction of the aqueous fraction, resulting in: Fermentation sludge (Total solids (TS): 20.00–27.00%; Total organic matter (VS): 14.00–18.00%; salts (ashes): 6.00–10.00%; ammoniacal nitrogen: 7000.00–9000.00 mg/L (average of about 8,000.00 mg/L)), clear digestate in an amount of about 150–200 m3/day (TS: 0.60–3.00%; VS: 0.40–2.00%; salts (ashes): 0.20–1.00%; ammoniacal nitrogen: 6000–8000 mg/L (average of about 8000 mg/L)). The biogas plant of the economic entity from the digestate separating phase produces around 14–20 tons of fermentation sludge per day, with the following composition: TS: 20.00–27.00%; total volatile substances (organic substance): 65.00–70.00% of TS; ashes: 30–35 vs. TS; total nitrogen: less than 2.00%; ammoniacal nitrogen: less than 0.80%; phosphorus, potassium, calcium, magnesium, etc. This sludge is collected in a special dump for final transport and storage on a specially designed platform (Figure 1).
The compost platform is a mini plant for the recovery of organic waste in the form of material for gardening, agricultural use, and re-cultivation. During the controlled microbial degradation process decomposition and biological stabilization are performed [64,65,66]. The aeration of the material is carried out by means of compost return measures [66]. Composting represents the totality of the microbial, biochemical, chemical, and physical transformations that the fermentation sludge suffers from in its initial state until it reaches different humification stages, and the resulting product is known as compost [67,68]. The compost is the product obtained by aerobic, thermophilic, decomposition and microbial synthesis of organic substances in waste products containing 25.00% of relatively stable humus, predominantly of microbial biomass, which is subject to slight decomposition, being sufficiently stable not to reheat or cause problems of smell or insect propagation [69,70]. The sludge composting process is enhanced by conical pile seeding. The temperature inside the compost layer gradually increases, which ensures a high rate of decomposition. This is the “thermophilic” or “hot decomposition” stage. The process should last for at least 10 days at a temperature of 55 °C, followed by the mesophilic stage lasting approximately six weeks at a temperature of 45 °C and 55 °C [71]. During the decomposition process, there is a weight loss and volume caused by the decomposition of the organic compounds in CO2 and H2O. The oxygen intake in the fermentation mass is ensured by the frequent return of the compost layer with the help of a special mechanism. The humidity of the reaction mass must be controlled during the process and this is done by irrigation with the return operation [72,73]. If by precipitation or other causes the water content increases significantly, part of it can be removed in a contaminated water collector from where it is again used for subsequent humidification. At the end of the stage, the compost needs to be transferred to the maturing area and laid again in layers. The biological process for the generation of humid substances continues, but at a much lower rate and the emissions are reduced to a minimum [74]. The final stabilization of the compost is achieved when the compost temperature is kept constant below 30 °C. The total duration of a composting cycle for sludge at the biogas plant is at least six months under ideal conditions [71,72,73,74]. The formation of compost is influenced by the following factors [67,75]: (i) Water—the lack of water blocks the activity of the microorganisms and the decomposition process. Excess of water makes that microorganisms get insufficient air, (ii) air—insufficient ventilation causes the multiplication of microorganisms that prefer humid places and with them, unpleasant odors appear, (iii) heat—the decomposition activity of the microorganisms is maximal when, in addition to sufficient air and water, compost has an optimal temperature for decomposition processes. The composting temperature of 40–60 °C would be ideal, as it is possible to naturally compost and clean unwanted germs, (iv) nutrients—the more varied are the scraps, the more valuable the compost will be.
The sludge composting process takes place in three phases: Phase 1—mesophilic fermentation stage (characterized by the growth of bacteria at temperatures between 25 and 40 °C), phase 2—thermophilic stage (in which bacteria and fungi are present at a temperature of 50–60 °C, the upper limit of the thermophilic stage is 70 °C and it is necessary to keep the raised temperature for at least one day to ensure pathogen destruction and contaminants); phase 3—maturation stage (temperature stabilizes and completes some fermentative processes, the degraded material turns into humus by condensation and polymerization reactions, the final material is stable and can be appreciated by the C/N ratio). If the flow of air in the biodegradation mass even for only a few minutes, anaerobic microbial activity becomes significant [67,74,75]. As a result, odors generated by alcohols and rapidly formed volatile organic acids appear to lower the pH of the system. Restoring aerobic conditions through aeration and porosity for composting can take two to six days. The microbial organisms required for composting appear naturally. At the level of the analyzed economic entity, a test was performed for the transformation of a quantity of sludge into soil improver by composting, resulting in a product (soil improver) that has the following physical-chemical characteristics (Table 1). Since the characteristics obtained exceed the values required by the legislation [69] (for total organic nitrogen (TKN) and phosphor (P2O5)), it is recommended to use correction materials (wheat straw, wood sawdust, sand, etc.).
Suitable compost is considered to have the following characteristics [65,68]: It is a homogeneous dark brown or black product, the smell is of soil without any unpleasant smell, the particle size is less than 1.20 mm, it is a stable product that can be stored for a reasonable amount of time without losing its nutritional characteristics, does not contain viable weed seeds, does not contain phytotoxins or visible contaminants, it has a pH between 6.00 and 8.00. The compost is ready for use if the compost mass stabilizes near ambient and the oxygen concentration in the middle of the pile remains above 5.00% for several consecutive days.

2.2. Methods

In order to achieve the proposed objective, the research method chosen is multi-criteria analysis (AMC). This method is often proposed as an alternative to cost–benefit analysis (CBA) as it addresses a wider range of project impacts, responds more directly to the concerns of decision-makers, and is open to alternative assessments of weights related to various impacts [76]. The main concepts used by AMC are: Variants, criteria, performance matrices, scores, weightings, and standardization methods, followed by choosing the optimal variation. Variants represent the way the goals are met, the best option being the one that closes most to achieving the goals. In the study, they are identified by: The current version of the biogas sludge disposal plant (V1), the operating variant of the biogas plant with waste recovery as a soil improver (V2), biogas plant closure variant (V3). Criteria should be: Able to distinguish between “significant” alternatives and also could support the comparison of performance-related variants; complete, to include all purposes; operational; non-redundant; few in number. The criterion system used was to highlight both quantitative elements such as operating result (OR), gross result (GR), cash flow (CF), as well as qualitative elements, i.e., environmental impact (EI), corporate social responsibility (CSR). Depending on the nature of the criteria, they are considered to be of maximum or minimum importance. The standard tool for AMC is the performance matrix. Each row in this matrix describes a variant and each column describes the performance of the variants according to each criterion. The AMC will be performed for the three proposed variants (V1, V2, and V3) based on the matrix in Table 2. For the two qualitative criteria, scores are given: 0 for minimum impact, 5 for medium impact, and 10 for maximum impact, while taking into account the objective of the maximization/minimization criterion.
The degrees of importance established for the five identified criteria will be considered as having the following values: W1 = 0.16, W2 = 0.06, W3 = 0.22, W4 = 0.31, W5 = 0.25 and proceed to the performance matrix according to Table 3.
In order to determine the analysis criteria, it is necessary to identify the constituents and use the following formulas:
OR = ( I E ) A
where: I = income (categories included in the income: The quantity of waste (slaughtering residues) from the third-party slaughterhouse sold, the quantity of soil improviser for sale, the quantity of electricity produced, the quantity of thermal energy produced, the green certificates obtained), E = expenses (categories included in expenditures: amount of sludge disposed of as waste, green certificates for self-consumption, wages, operating costs, auxiliary materials, packaging costs, biogas, ferrous sulphate treatment (water treatment), and A = amortization.
GR = OR Fc
where, Fc = financing costs
CF = OR + A Fc
The V1 variant analyzed consists of the disposal of the biogas manufacturing waste by depositing it at the landfill site, which is performed at certain disposal costs. Thus, the calculation formula for the total cost of sludge disposal as waste is:
T wdc = A we × C dw
where, Twdc = Total waste disposal cost [EUR]; Awe = Amount of waste eliminated from the biogas process [ton]; Cdw = Cost of disposal of waste [EUR/ton].
The standardization of the performance matrix (the determination of relative magnitude, rij), the process by which the values of the criteria expressed in different units of measurement are transformed into a common scale, is achieved by the linear method of using the scales, which takes into account the type of criteria (maximization, and then, minimization). Thus, for the C1, C2, C3, and C5 criteria, the calculation Formula (5) will be used, and for C4 the calculation Formula (6):
r ij = V ij V j max ,   V j max = max i { V ij }
r ij = 1 V ij V j max = V j max V ij V j max
Continuing the analysis, we shall determine the concordance indices, and then those of discordance. The concordance index c(Vi, Vj) for each pair of ordered variants (Vi, Vj) is calculated according to the formula:
c ( V i , V j ) = 1 k = 1 n W k { k : r k   ( V i ) r k   ( V j ) } W k
where the sum of the weightings of the criteria in the numerator is taken only for the criteria whose values Vi dominate the values Vj.
For the calculation of the discordance index d(Vi, Vj), the following formula is used:
{ 0   if   r k   ( V i ) r k   ( V j )   for   all   k , 1 δ max { r k   ( V i ) r k   ( V j ) } ,   otherwise . ,   where   δ = max { r k   ( V i ) r k   ( V j ) }
In order to combine the two sets of indices for all the variants considered, a concordance threshold c* and a discordance threshold d*, for which c* + d* = 1, is defined.
Once the two indices are known, an offset relationship S is defined by the formula:
V i SV j   if   and   only   if { c ( V i ,   V j ) c * , d ( V i ,   V j ) d * .
where c* and d* are thresholds set by the decision-maker. Thus, a variant Vi is considered optimal if and only if it outperforms the other variants.

3. Results

In V1, the costs of waste disposed of from the biogas production process, starting from the amount of monthly waste disposed from the biogas production process, based on the elimination rates, the total monthly waste disposal costs are in the January interval 2016–December 2018, according to Table 4.
The fees charged for waste disposal consist of fees for the landfill and the landfill tax. According to Law 384/2013 on the approval of the Government Emergency Ordinance (GEO) 31/2013 for the amendment and completion of GEO 196/2005 on the Environment Fund, from 1 January 2017 comes into force, the fee for landfill waste disposal, amounting to 32.89 EUR/ton, which is rather a penalty to reduce the waste stored. This is the reason for the tariff increase in the period of January–June 2017. Emergency Ordinance 48/2017, which amends and supplements the GEO 196/2005 on the Environment Fund, suspends the application of toll taxation to waste until 1 January 2019. By this forced measure, after only a few months of normality, storage in the waste dump is no longer penalized, by 2019 by 34.88 EUR/ton and by 2020 by 43.78 EUR/ton. In V1, the cost of waste disposal in the period 2016–2018 is calculated in Table 4, respectively 2019–2020, the estimate is provided in Table 5. Both in terms of costs and environmental effects generated by storage of the waste from the technological flow of biogas production, the economic entity sought alternative solutions for the disposal of sludge waste. Sludges from biogas plants using organic waste from the slaughtering of chicken as raw material can be considered a by-product by using them as soil improvers for agricultural land. Thus, the waste problem can turn into a source of income from which to cover expenses, transforming certain cost into a new opportunity for gain.
In order to be considered a by-product, the resulting waste must meet certain conditions, comply with certain parameters stipulated in the European legislation, transposed into the Romanian one. Thus, sludge can bring profit to investors, while contributing to the sustainable development of both the economic entity and the area. Thus, economic, ecological, and social valences are shaped by gaining benefits such as: Eliminating waste (fermentation sludge) for final disposal, the use of fermentation sludge as a secondary raw material, providing farmers with products to improve soil quality, obtaining economic benefits by marketing the soil breeder. Thus, we can outline the operation of the biogas plant with waste recovery as a soil improvement agent (V2). In V2, given that from 2019 to 2020 the tax increases according to the legislation in force, based on the information for the period previously analyzed, it will be possible to forecast the total costs of brewery production based on the determinations in Table 6. V2 implies the necessity of an investment for the amelioration platform, worth EUR 1,000,000.00, with an investment recovery period estimated at 10 years and a yield of about 80.00% improvement on a tonne of waste processed. The estimated price of the ameliorator per tonne is EUR 100.00.
The analyzed V3 option involves the closure of the biogas plant, which will generate higher electricity and thermal energy costs, operational waste disposal costs that will no longer be taken over by the biogas plant. This variation has been highlighted in the present analysis precisely to emphasize from an economic point of view the profitability of the biogas plant attached to the agri-food economic entity as a tool for the management of waste from slaughter. It is worth mentioning that operational costs remain in case of stopping the biogas plant as they are made up of long-term service contracts that cannot be cancelled.
The calculations for the financial indicators required by this analysis for the three variants are presented in Table 7, based on the projected technical data for 2019. Continued research with the application of the AMC methodology presented in point 2.2. generated the results presented in Table 8, Table 9, Table 10 and Table 11.
According to AMC carried out, version V2 surpasses variants V1 and V3, and variant V1 surpasses version V3, for all established thresholds. By this method, we can state that the optimal variant is V2, which presupposes the operation of the biogas plant with waste recovery as soil improvement, so the management of the entity considers viable the realization of the investment necessary for the implementation of this variant.
At the same time, the estimation of the investment recovery for the implementation of V2, taking into account that it will have a service life of 15 years, and full amortization in 10 years is presented in Table 12. The opportunity cost is the cost the entity would have to bear for the disposal of waste as sludge, and the marginal result is the result adjusted with the cost savings to remove sludge as waste. According to the analysis, it can be noticed that between five and six years from the commissioning of the equipment, the investment will be fully recovered.

4. Discussion

The research deals with aspects regarding the greening and recovery of sludge waste from the biogas production activity. Trends in the evolution of waste disposal costs are highlighted, which, on the basis of current legislation, leads us to the conclusion that, in the coming period, they will have an upward trend in line with the Europe 2050 strategy. Thus, by restricting legislation, economic entities are encouraged to identify alternative solutions to counteract these costs and to transcend them to sustainable waste management. In the case of an economic entity active in the agri-food sector, the use of biogas as a tool for the management of waste from chickens for the production of electricity and heat is a viable way to manage the slaughterhouse waste. However, the biogas plant also produces waste which, through disposal at the municipal landfill, generates additional costs.
The wastes from the biogas plant resulting from the anaerobic digestion of organic waste have significant potential to be used as soil fertilizer [77,78,79]. At the same time, these need additional treatment (composting) to increase its applicability as fertilizer in agriculture. As a result of the composting treatment, the viscosity and odors of the residue are reduced, as well as its phytotoxicity [80,81,82]. According to studies, the sludge, that can be used in agriculture as liquids (this type of sludge being the best for agriculture), semi-dry or dry, has superior qualities compared to chemical fertilizers and are superior to aerated fermented manure [48,82,83,84,85,86,87]. On the other hand, the sludge from biogas plants has a pesticidal effect, but according to several authors [87,88,89,90], no harmful effects common for chemical products, bringing more microorganisms (bacteria and fungi) into the soil and not endangering human health when they are recycled to farmland [45]. The use of compost in agriculture causes a reduction of soil erosion, makes it easier to plow, improves nutrient retention and increases water retention capacity. At the same time, the soil gains a higher resistance to compaction and crust, allowing a better growth of the roots of the crops, leading to an increase in the yield of the crops [77].
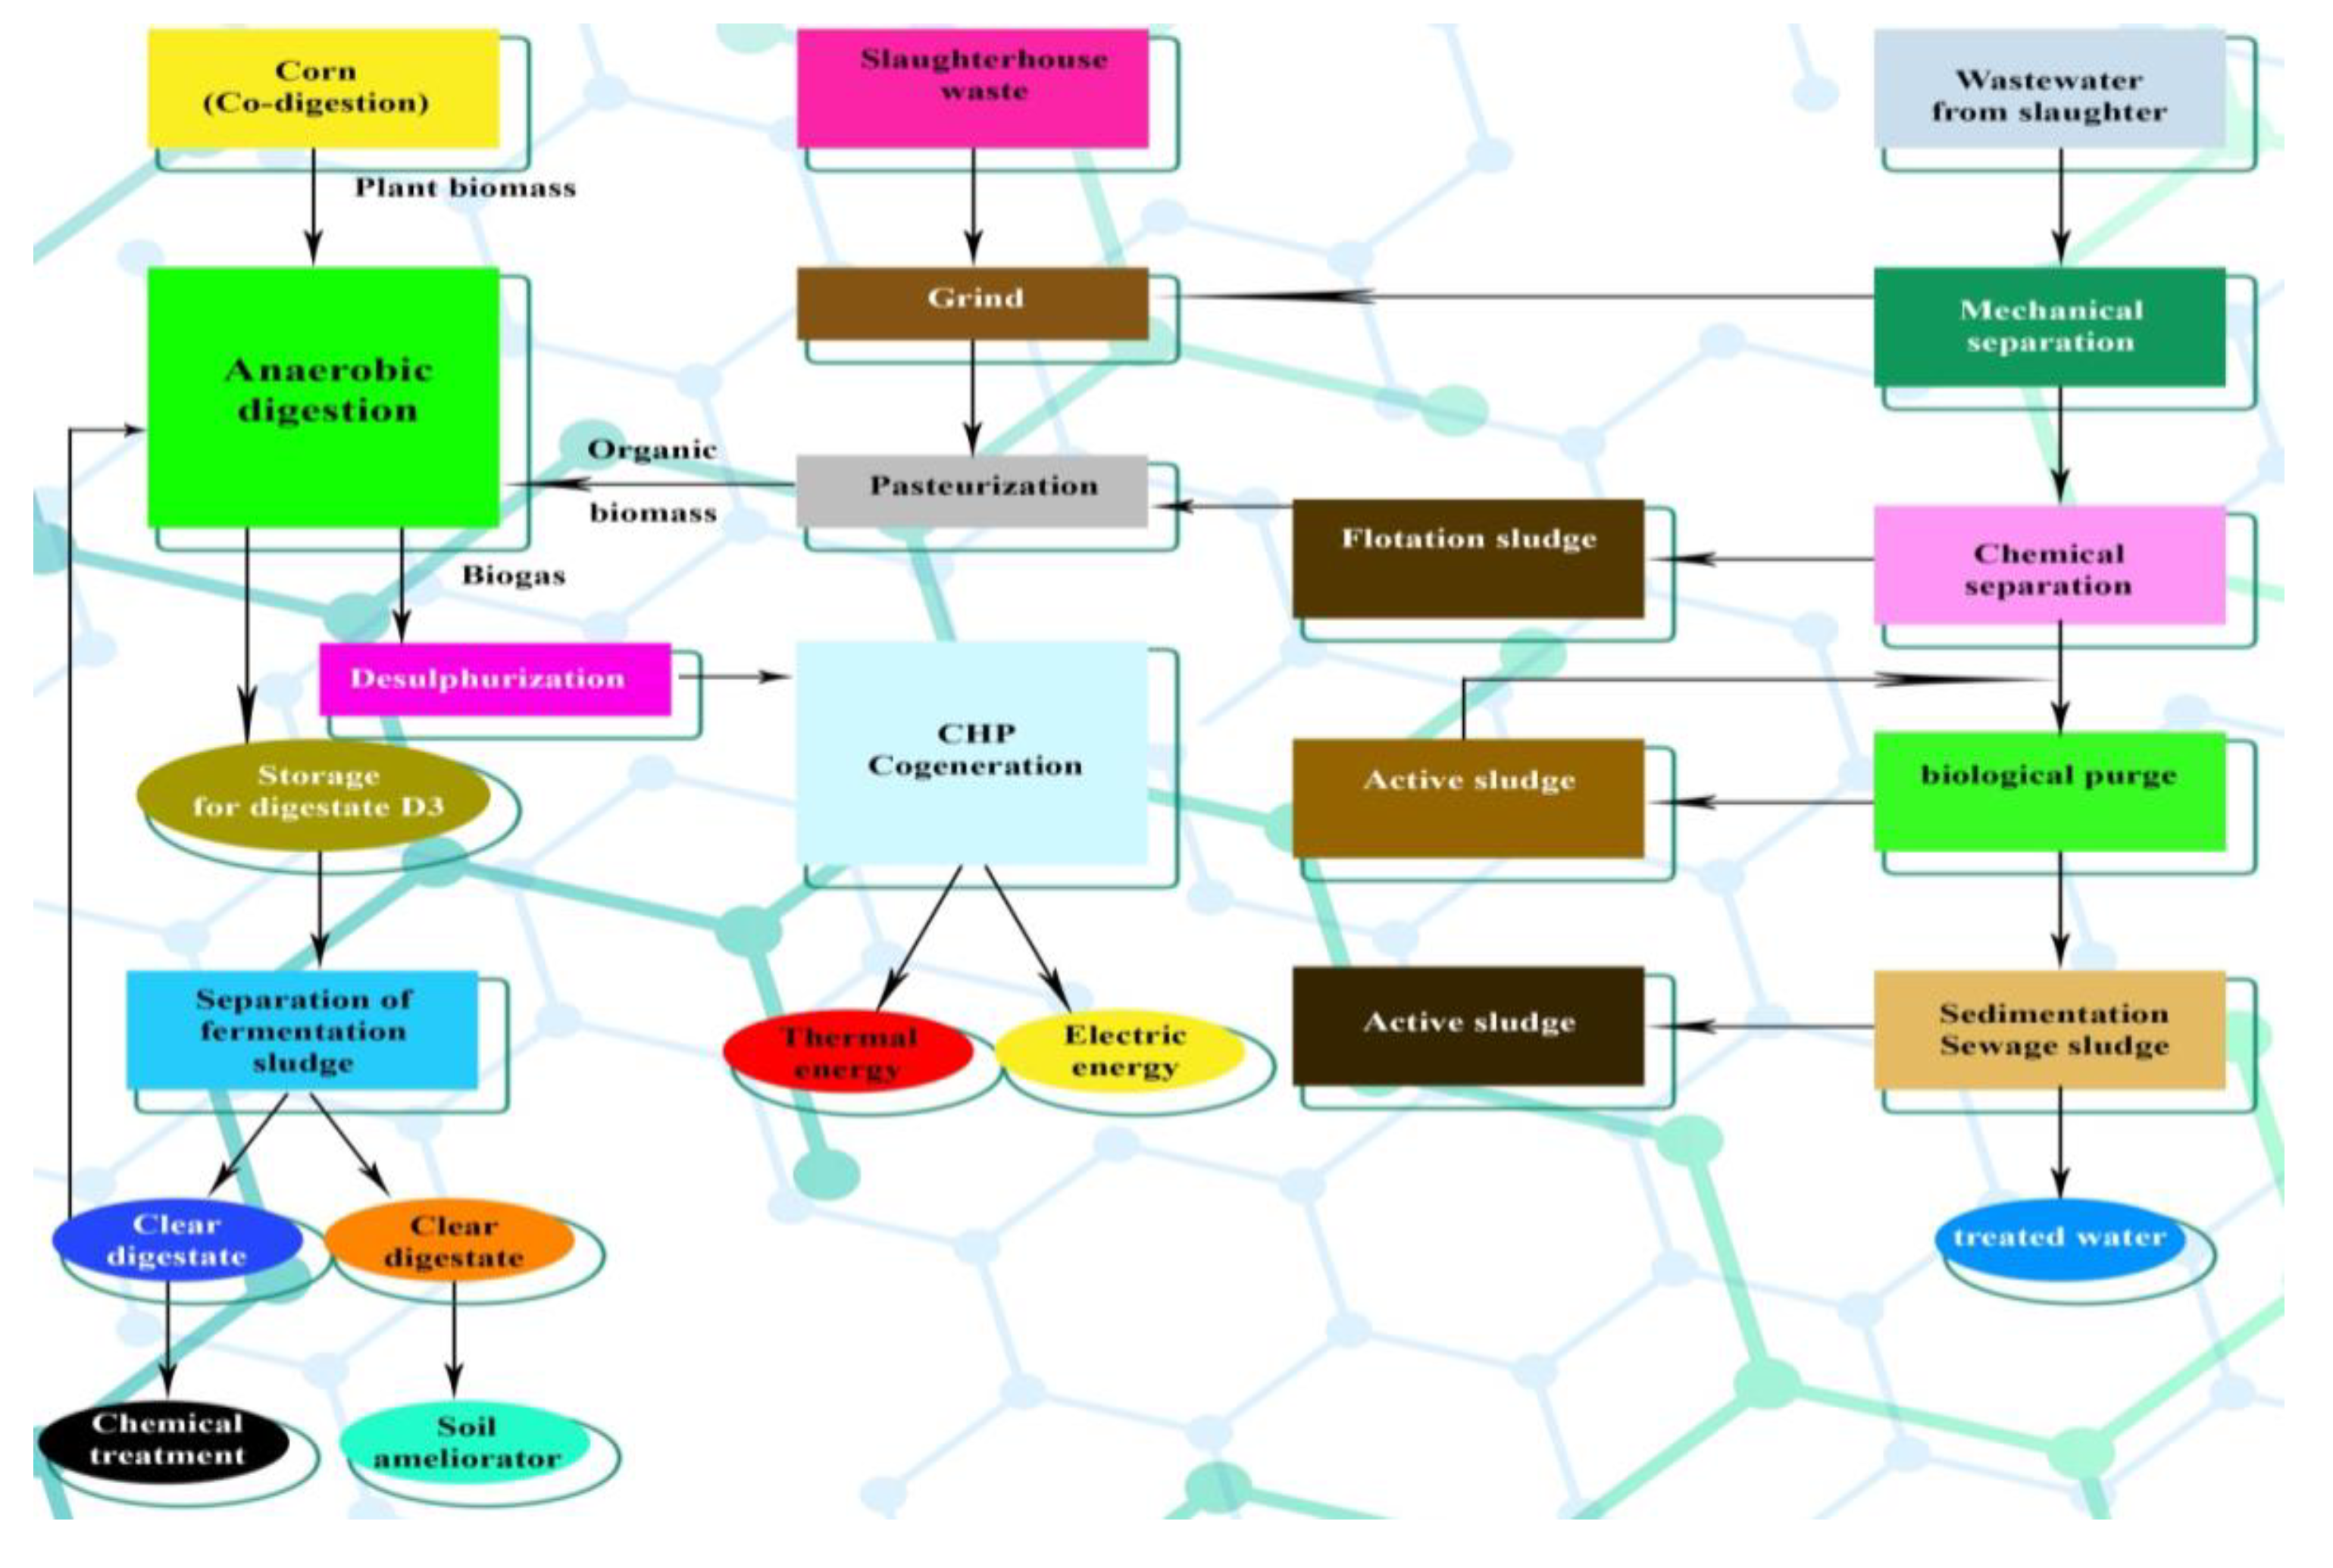
The implementation of a complete waste management system (the integration of a biogas plant for waste disposal in the slaughtering process and the attachment of a composting platform for waste resulting from the biogas plant) within the entities active in the agro-food industry contributes to: From an economic point of view, it transformed cost (cost for disposal of eliminated waste) into a source of profit for the entity (obtaining a product—soil fertilizer), from a social point of view, attaching a composting platform as well as a soil fertilizer packing line will generate new jobs, from the environmental point of view, it is possible to efficiently recycle the waste and turn it into a new product with physico-chemical properties and useful for agriculture. Thus, it can be stated that the analyzed entity represents a business model in accordance with the requirements of the circular economy and by observing the principles of sustainable development. The novelty of the research consists of the economic and environmental analysis of the effects on the greening and recovery of the sludge waste resulting from the biogas production activity that closes the waste management loop according to the principles of the circular economy (design out waste and pollution; keep products and materials in use, regenerate natural systems) [91].
Considering that the research carried out was based only on the management of the waste resulting from the process of slaughtering the chicken meat, by treating it in the biogas station, as well as the waste resulting from the process of obtaining the biogas for its transformation into soil fertilizer, we propose as future research perspectives, the identification and implementation of an efficient waste management resulting from the packaging of chicken meat production (such as plastic, cardboard, metal, and wood).

5. Conclusions

The study has made it possible to identify three possible variants that have been analyzed using AMC decision systems and the financial accounting system (current version of the biogas plant with waste disposal (V1), recovery of waste as soil improver (V2), biogas plant closure variant (V3)). It also takes into account the closure of the biogas plant because there is the possibility of transferring responsibility for waste management from the slaughterhouse to third parties that can process them, but in this case, additional costs are generated with electricity, heat and for the takeover of waste by third parties. At the same time, V3 was highlighted in the analysis to economically highlight the profitability of the biogas plant attached to the agri-food economic entity as a waste management tool from slaughter. An economic forecast was made for the variants analyzed, and for the optimal variant (V2) an investment recovery plan was quantified to obtain the soil improvement product. Thus, AMC can be considered a useful tool in strategic management, as it is possible to include in the analysis abstracting criteria that cannot easily be quantified, such as environmental ones and social responsibility.
In this context, the research undertaken supports the optimization of waste management, the integration of a composting platform for obtaining a soil improvement product, which also requires considerable investment. According to the analyses performed, it is proven that the investment with an estimated amortization period of 10 years and a useful life of 15 years generates positive results (ranging from 181,005.46 to 308,667.05 EUR), a positive and ascending opportunity cost (between 206,607.84–EUR 285,039.57) and, last but not least, a marginal increase from 387,613.30 to 593,707.44 EUR. The platform attached to the biogas plant, in addition to providing a new source of profit for the entity, by selling the soil-improving product, and by minimizing waste collection fees, contributes to the efficient management of sludge waste from the biogas plant, transforming an environmental problem and, implicitly, cost into an economic advantage, validating also the research hypothesis.
Throughout the research, as well as the results obtained, it emphasizes the usefulness of the research as an example of good practices for the economic entities in the agri-food sector, and the optimal variant, i.e., the operation of the biogas plant with recovery of waste as a soil improver determines ecological and economic benefits in concordance with the principles of sustainable development.

Author Contributions

All the authors contributed equally to the elaboration of this research.

Funding

This research received no external funding.

Conflicts of Interest

The authors declare no conflict of interest.

References

  1. Daú, G.; Scavarda, A.; Scavarda, L.F.; Portugal, V.J.T. The healthcare sustainable supply chain 4.0: The circular economy transition conceptual framework with the corporate social responsibility mirror. Sustainability 2019, 11, 3259. [Google Scholar] [CrossRef]
  2. Domenech, T.; Bleischwitz, R.; Doranova, A.; Panayotopoulos, D.; Roman, L. Mapping industrial symbiosis development in Europe: Typologies of networks, characteristics, performance and contribution to the circular economy. Resour. Conserv. Recycl. 2019, 141, 76–98. [Google Scholar] [CrossRef]
  3. Martin-Gómez, A.M.; González, F.A.; Bárcena, M.M. Smart eco-industrial parks: A circular economy implementation based on industrial metabolism. Resour. Conserv. Recycl. 2018, 135, 58–69. [Google Scholar] [CrossRef]
  4. Garcia-Muiña, F.E.; González-Sánchez, R.; Ferrari, A.M.; Settembre-Blund, D. The paradigms of industry 4.0 and circular economy as enabling drivers for the competitiveness of businesses and territories: The case of an Italian ceramic tiles manufacturing company. Soc. Sci. 2018, 7, 255. [Google Scholar] [CrossRef]
  5. Oncioiu, I.; Capuşneanu, S.; Türkes, M.C.; Topor, D.I.; Constantin, D.-M.O.; Marin-Pantelescu, A.; Hint, M.S. The sustainability of Romanian SMEs and their involvement in the circular economy. Sustainability 2018, 10, 2761. [Google Scholar] [CrossRef]
  6. European Commission. A Clean Planet for all A European Strategic Long-Term Vision for a Prosperous, Modern, Competitive and Climate Neutral Economy; European Commission: Brussels, Belgium, 2018; Available online: https://eur-lex.europa.eu/legal-content/EN/TXT/PDF/?uri=CELEX:52018DC0773&from=EN (accessed on 2 July 2019).
  7. European Parliament. A European Strategic Long-Term Vision for a Prosperous, Modern, Competitive and Climate Neutral Economy in Accordance with the Paris Agreement; European Commission: Brussels, Belgium, 2019; Available online: http://www.europarl.europa.eu/doceo/document/TA-8-2019-0217_EN.pdf (accessed on 2 July 2019).
  8. United Nations Environment Programme, Emissions Gap Report 2018. Available online: http://wedocs.unep.org/bitstream/handle/20.500.11822/26895/EGR2018_FullReport_EN.pdf (accessed on 2 July 2019).
  9. Rentschler, J.; Bazilian, M. Policy monitor-principles for designing effective fossil fuel subsidy reforms. Rev. Environ. Econ. Policy 2017, 11, 138–155. [Google Scholar] [CrossRef]
  10. Rentschler, J.; Kornejew, M.; Bazilian, M. Fossil fuel subsidy reforms and their impacts on firms. Energy Policy 2017, 108, 617–623. [Google Scholar] [CrossRef]
  11. OECD. OECD Companion to the Inventory of Support Measures for Fossil Fuels 2018; OECD Publishing: Paris, France, 2018. [Google Scholar]
  12. Bauer, N.; Mouratiadou, I.; Luderer, G.; Baumstark, L.; Brecha, R.J.; Edenhofer, O.; Kriegler, E. Global fossil energy markets and climate change mitigation—An analysis with REMIND. Clim. Chang. 2016, 136, 69–82. [Google Scholar] [CrossRef]
  13. Aldy, J.E.; Pizer, W.A. The competitiveness impacts of climate change mitigation policies. J. Assoc. Environ. Resour. Econ. 2015, 2, 565–595. [Google Scholar] [CrossRef]
  14. ECA. Wind and Solar Power for Electricity Generation: Significant Action Needed if EU Targets to be Met. 2019. Available online: https://www.eca.europa.eu/lists/ecadocuments/sr19_08/sr_photovoltaic_en.pdf (accessed on 2 July 2019).
  15. Voicea, I.; Gageanu, I.; Matache, M.; Vladut, V. Innovative technology for obtaining bioenergy through the process of advanced anaerobic digestion. In Proceedings of the 16th International Scientific Conference: Engineering for Rural Development, Jelgava, Latvia, 24–26 May 2017; pp. 181–186. [Google Scholar]
  16. Martínez-Amariz, A.D.; Garrido-Silva, G. Uso de la biomasa de residuos orgánicos para el diseño de una estación eléctrica. Rev. UIS Ing. 2019, 18, 167–176. [Google Scholar]
  17. Franchetti, M. Economic and environmental analysis of four different configurations of anaerobic digestion for food waste to energy conversion using LCA for: A food service provider case study. J. Environ. Manag. 2013, 123, 42–48. [Google Scholar] [CrossRef] [PubMed]
  18. Lin, L.; Shah, A.; Keener, H.; Li, Y. Techno-economic analyses of solid-state anaerobic digestion and composting of yard trimmings. Waste Manag. 2019, 85, 405–416. [Google Scholar] [CrossRef] [PubMed]
  19. Yoshizaki, T.; Shirai, Y.; Hassan, M.A.; Baharuddin, A.S.; Abdullah, N.M.R.; Sulaiman, A.; Busu, Z. Improved economic viability of integrated biogas energy and compost production for sustainable palm oil mill management. J. Clean. Prod. 2013, 44, 1–7. [Google Scholar] [CrossRef] [Green Version]
  20. Yiridoe, E.K.; Gordon, R.; Brown, B.B. Nonmarket cobenefits and economic feasibility of on-farm biogas energy production. Energy Policy 2009, 37, 1170–1179. [Google Scholar] [CrossRef]
  21. Wresta, A.; Andriani, D.; Saepudin, A.; Sudibyo, H. Economic analysis of cow manure biogas as energy source for electricity power generation in small scale ranch. Energy Procedia 2015, 68, 122–131. [Google Scholar] [CrossRef]
  22. Klavon, K.H.; Lansing, S.A.; Mulbry, W.; Moss, A.R.; Felton, G. Economic analysis of small-scale agricultural digesters in the United States. Biomass Bioenerg. 2013, 54, 36–45. [Google Scholar] [CrossRef] [Green Version]
  23. Gebrezgabher, S.A.; Meuwissen, M.P.; Prins, B.A.; Lansink, A.G.O. Economic analysis of anaerobic digestion—A case of Green power biogas plant in The Netherlands. NJAS Wagen. J. Life Sci. 2010, 57, 109–115. [Google Scholar] [CrossRef]
  24. Akbulut, A. Techno-economic analysis of electricity and heat generation from farm-scale biogas plant: Çiçekdağı case study. Energy 2012, 44, 381–390. [Google Scholar] [CrossRef]
  25. Singh, K.J.; Sooch, S.S. Comparative study of economics of different models of family size biogas plants for state of Punjab, India. Energy Convers. Manag. 2004, 45, 1329–1341. [Google Scholar] [CrossRef]
  26. Meegoda, J.N.; Li, B.; Patel, K.; Wang, L.B. A review of the processes, parameters, and optimization of anaerobic digestion. Int. J. Environ. Res. Public Health 2018, 15, 2224. [Google Scholar] [CrossRef]
  27. Li, Y.; Park, S.Y.; Zhu, J. Solid-state anaerobic digestion for methane production from organic waste. Renew. Sustain. Energy Rev. 2011, 15, 821–826. [Google Scholar] [CrossRef]
  28. Kovács, E.; Wirth, R.; Maróti, G.; Bagi, Z.; Rákhely, G.; Kovács, K.L. Biogas production from protein-rich biomass: Fed-batch anaerobic fermentation of casein and of pig blood and associated changes in microbial community composition. PLoS ONE 2013, 8, 77265. [Google Scholar] [CrossRef] [PubMed]
  29. Callaghan, F.J.; Wase, D.A.J.; Thayanithy, K.; Forster, C.F. Continuous co-digestion of cattle slurry with fruit and vegetable wastes and chicken manure. Biomass Bioenerg. 2002, 22, 71–77. [Google Scholar] [CrossRef]
  30. Loughrin, J.H.; Lovanh, N.; Antle, S.W.; Bryant, M.D.; Berry, Z.P. Sound enhances wastewater degradation and improves anaerobic digester performance. SN Appl. Sci. 2019, 1, 533. [Google Scholar] [CrossRef] [Green Version]
  31. Golimowski, W.; Krzaczek, P.; Marcinkowski, D.; Gracz, W.; Wałowski, G. Impact of biogas and waste fats methyl esters on NO, NO2, CO, and PM emission by dual fuel diesel engine. Sustainability 2019, 11, 1799. [Google Scholar] [CrossRef]
  32. Oladejo, J.; Shi, K.; Luo, X.; Yang, G.; Wu, T. A review of sludge-to-energy recovery methods. Energies 2018, 12, 60. [Google Scholar] [CrossRef]
  33. Muñoz, C.; Paulino, L.; Monreal, C.; Zagal, E. Greenhouse gas (CO2 and N2O) emissions from soils: A review. Chil. J. Agric. Res. 2010, 70, 485–497. [Google Scholar] [CrossRef]
  34. Paolini, V.; Petracchini, F.; Segreto, M.; Tomassetti, L.; Naja, N.; Cecinato, A. Environmental impact of biogas: A short review of current knowledge. J. Environ. Sci. Health A 2018, 53, 899–906. [Google Scholar] [CrossRef] [Green Version]
  35. Cecchi, F.; Cavinato, C. Anaerobic digestion of bio-waste: A minireview focusing on territorial and environmental aspects. Waste Manag. Res. 2015, 33, 429–438. [Google Scholar] [CrossRef]
  36. Capodaglio, A.G.; Callegari, A.; Lopez, M.V. European framework for the diffusion of biogas uses: Emerging technologies; acceptance; incentive strategies; and institutional-regulatory support. Sustainability 2016, 8, 298. [Google Scholar] [CrossRef]
  37. Winquist, E.; Rikkonen, P.; Pyysiäinen, J.; Varho, V. Is biogas an energy or a sustainability product?—Business opportunities in the Finnish biogas branch. J. Clean. Prod. 2019, 233, 1344–1354. [Google Scholar] [CrossRef]
  38. Abubaker, J.; Risberg, K.; Pell, M. Biogas residues as fertilisers—Effects on wheat growth and soil microbial activities. Appl. Energy 2012, 99, 126–134. [Google Scholar] [CrossRef]
  39. ADAS. SAC Nutrient Value of Digestate from Farm-Based Biogas Plants in Scotland. 2007. Available online: https://www2.gov.scot/Resource/Doc/1057/0053041.pdf (accessed on 2 July 2019).
  40. Pöschl, M.; Ward, S.; Owende, P. Evaluation of energy efficiency of various biogas production and utilization pathways. Appl. Energy 2010, 97, 3305–3321. [Google Scholar] [CrossRef]
  41. Joo, S.H.; Monaco, F.D.; Antmann, E.; Chorath, P. Sustainable approaches for minimizing biosolids production and maximizing reuse options in sludge management: A review. J. Environ. Manag. 2015, 158, 133–145. [Google Scholar] [CrossRef] [PubMed]
  42. Latare, A.M.; Kumar, O.; Singh, S.K.; Gupta, A. Direct and residual effect of sewage sludge on yield, heavy metals content and soil fertility under rice-wheat system. Ecol. Eng. 2014, 69, 17–24. [Google Scholar] [CrossRef]
  43. Dolgen, D.; Necdet Alpaslan, M.; Delen, N. Agricultural recycling of treatment-plant sludge: A case study for a vegetable-processing factory. J. Environ. Manag. 2007, 84, 274–281. [Google Scholar] [CrossRef] [PubMed]
  44. Alburquerque, J.A.; De la Fuente, C.; Campoy, M.; Carrasco, L.; Nájera, I.; Baixauli, C.; Caravaca, F.; Roldán, A.; Cegarra, J.; Bernal, M.P. Agricultural use of digestate for horticultural crop production and improvement of soil properties. Eur. J. Agron. 2012, 43, 119–128. [Google Scholar] [CrossRef]
  45. Alvarenga, P.; Mourinha, C.; Farto, M.; Santos, T.; Palma, P.; Sengo, J.; Morais, M.C.; Cunha-Queda, C. Sewage sludge, compost and other representative organic wastes as agricultural soil amendments: Benefits versus limiting factors. Waste. Manag. 2015, 40, 44–52. [Google Scholar] [CrossRef]
  46. Himanen, M.; Hänninen, K. Composting of bio-waste, aerobic and anaerobic sludges—Effect of feedstock on the process and quality of compost. Bioresour. Technol. 2011, 102, 2842–2852. [Google Scholar] [CrossRef]
  47. Insam, H.; Gómez-Brandón, M.; Ascher, J. Manure-based biogas fermentation residues—Friend or foe of soil fertility? Soil Biol. Biochem. 2015, 84, 1–14. [Google Scholar] [CrossRef]
  48. Odlare, M.; Pell, M.; Svensson, K. Changes in soil chemical and microbiological properties during 4 years of application of various organic residues. Waste Manag. 2008, 28, 1246–1253. [Google Scholar] [CrossRef] [PubMed]
  49. Ghanavati, H. Biogas production systems: Operation, process control, and troubleshooting. In Biogas Fundamentals, Process, and Operation; Tabatabaei, M., Ghanavati, H., Eds.; Springer International Publishing: Cham, Switzerland, 2018; Volume 6, pp. 199–219. [Google Scholar]
  50. Khoshnevisan, B.; Rafiee, S.; Tabatabaei, M. Waste management strategies: Life Cycle Assessment (LCA) approach. In Biogas Fundamentals, Process, and Operation; Tabatabaei, M., Ghanavati, H., Eds.; Springer International Publishing: Cham, Switzerland, 2018; Volume 6, pp. 305–331. [Google Scholar]
  51. Tsapekos, P.; Khoshnevisan, B.; Alvarado-Morales, M.; Symeonidis, A.; Kougias, P.G.; Angelidaki, I. Environmental impacts of biogas production from grass: Role of co-digestion and pretreatment at harvesting time. Appl. Energy 2019, 252, 113467. [Google Scholar] [CrossRef]
  52. Sehgal, K. Current state and future prospects of global biogas industry. In Biogas Fundamentals, Process, and Operation; Tabatabaei, M., Ghanavati, H., Eds.; Springer International Publishing: Cham, Switzerland, 2018; Volume 6, pp. 449–472. [Google Scholar]
  53. Andreadakis, A.D.; Mamais, D.; Gavalaki, E.; Kampylafka, S. Sludge utilisation in agriculture: Possibilities and prospects in Greece. Water Sci. Technol. 2002, 46, 231–238. [Google Scholar] [CrossRef] [PubMed]
  54. Chen, Y.; Yu, F.; Liang, S.; Wang, Z.; Liu, Z.; Xiong, Y. Utilization of solar energy in sewage sludge composting: Fertilizer effect and application. Waste Manag. 2014, 34, 2014–2021. [Google Scholar] [CrossRef] [PubMed]
  55. Diacono, M.; Montemurro, F. Long-term effects of organic amendments on soil fertility. In Sustainable Agriculture; Lichtfouse, E., Hamelin, M., Navarrete, M., Debaeke, P., Eds.; Springer: Dordrecht, The Netherlands, 2011; Volume 2, pp. 761–786. [Google Scholar]
  56. Tambone, F.; Scaglia, B.; D’Imporzano, G.; Schievano, A.; Orzi, V.; Salati, S.; Adani, F. Assessing amendment and fertilizing properties of digestates from anaerobic digestion through a comparative study with digested sludge and compost. Chemosphere 2010, 81, 577–583. [Google Scholar] [CrossRef] [PubMed]
  57. Pascual, J.A.; Morales, A.B.; Ayuso, L.M.; Segura, P.; Ros, M. Characterisation of sludge produced by the agri-food industry and recycling options for its agricultural uses in a typical Mediterranean area, the Segura River basin (Spain). Waste Manag. 2018, 82, 118–128. [Google Scholar] [CrossRef] [PubMed]
  58. Dickson, N.; Richard, T.; Kozlowski, R. Composting to Reduce the Waste Stream-A Guide to Small Scale Food and Yard Waste Composting; Northeast Regional Agricultural Engineering Service: Ithaca, NY, USA, 1991. [Google Scholar]
  59. Larsen, A.B.; Funch, F.H.; Hamilton, H.A. The use of fermentation sludge as a fertilizer in agriculture. Water Sci. Technol. 1991, 24, 33–42. [Google Scholar] [CrossRef]
  60. Moser-Engeler, R.; Udert, K.M.; Wild, D.; Siegrist, H. Products from primary sludge fermentation and their suitability for nutrient removal. Water Sci. Technol. 1998, 38, 265–273. [Google Scholar] [CrossRef]
  61. EBA. EBA Statistical Report 2017; Annual Report; European Biogas Association: Brussels, Belgium, 2017; Available online: http://european-biogas.eu/wp-content/uploads/2017/12/Statistical-report-of-the-European-Biogas-Association-web.pdf (accessed on 3 July 2019).
  62. Cucui, G.; Ionescu, C.A.; Goldbach, I.R.; Coman, M.D.; Marin, E.L.M. Quantifying the economic effects of biogas installations for organic waste from agro-industrial sector. Sustainability 2018, 10, 2582. [Google Scholar] [CrossRef]
  63. Judgment No. 184/20.07.2018 for the Approval of GEO 24/2017 Regarding the Modification and Completion of the Judgment No. 220/2008 Establishing the System for the Promotion of Renewable Energy Production Energy and for Amending Some Normative Acts. OM 635/20.07.2018. Available online: https://www.anre.ro/ro/legislatie/surse-regenerabile/legislatie-primara-esre (accessed on 15 June 2019).
  64. Saracevic, E.; Koch, D.; Stuermer, B.; Mihalyi, B.; Miltner, A.; Friedl, A. Economic and global warming potential assessment of flexible power generation with biogas plants. Sustainability 2019, 11, 2530. [Google Scholar] [CrossRef]
  65. Bachert, C.; Bidlingmaier, W.; Wattanachira, S. Open Windrow Composting Manual. ORBIT. 2008. Available online: https://www.orbit-online.net/images/orbit-downloads/5_Literature/5_1_Compost_handbook/ro/5_1-Handbook-on-composting_rumaenisch.pdf (accessed on 25 June 2019).
  66. Rusu, T.; Bejan, M. Deşeul-Sursa de Venit; Mediamira: Cluj Napoca, Romania, 2006. [Google Scholar]
  67. Haug, R. The Practical Handbook of Compost Engineering; CRC Press: Routledge, UK, 2018. [Google Scholar]
  68. Lukehurst, C.T.; Frost, P.; Al Seadi, T. Utilisation of Digestate from Biogas Plants as Biofertiliser. IEA Bioenergy. 2010. Available online: http://www.centri-force.co.uk/wp-content/uploads/2014/07/Utilisation-of-Digestate-as-Biofertiliser-V2.0.pdf (accessed on 2 July 2019).
  69. Government Decision no. 176/12 February 2004 on the Establishment of Ecolabel Criteria for the Group of soil Improvers and Cultivation Substrates; Official Gazette of Romania: Bucharest, Romania, 2004; Volume 169, Available online: https://lege5.ro/Gratuit/gq4dqmrt/hotararea-nr-176-2004-privind-stabilirea-criteriilor-de-acordare-a-etichetei-ecologice-pentru-grupul-de-produse-amelioratori-de-sol-si-substraturi-de-cultura (accessed on 3 July 2019).
  70. Regulation (EC) No 66/2010 of the European Parliament and of the Council of 25 November 2009 on the EU Ecolabel. Available online: https://eur-lex.europa.eu/legal-content/EN/ALL/?uri=CELEX%3A32010R0066 (accessed on 3 July 2019).
  71. Zupančič, G.D.; Grilc, V. Anaerobic treatment and biogas production from organic waste. In Management of Organic Waste; Kumar, S., Ed.; Intech: London, UK, 2012; Available online: http://www.intechopen.com/books/management-of-organic-waste/anaerobic-treatment-and-biogas-productionfrom-organic-wastes (accessed on 3 July 2019).
  72. Polprasert, C.; Koottatep, T. Organic Waste Recycling; IWA Publishing: London, UK, 2007. [Google Scholar]
  73. Gómez-Brandón, M.; Juárez, M.F.D.; Domínguez, J.; Insam, H. Animal manures: Recycling and management technologies. In Biomass Now-Cultivation and Utilization; Miodrag, D.M., Ed.; IntechOpen: Rijeka, Croatia, 2013; pp. 237–272. [Google Scholar]
  74. Larney, F.J.; Sullivan, D.M.; Buckley, K.E.; Eghball, B. The role of composting in recycling manure nutrients. Can. J. Soil Sci. 2006, 86, 597–611. [Google Scholar] [CrossRef]
  75. Al Seadi, T.; Rutz, D.; Prassl, H.; Köttner, M.; Finsterwalder, T.; Volk, S.; Janssen, R. Biogas Handbook; University of Southern Denmark: Esbjerg, Denmark, 2008; Available online: https://www.lemvigbiogas.com/BiogasHandbook.pdf (accessed on 3 July 2019).
  76. Baker, D.; Bridges, D.; Hunter, R.; Johnson, G.; Krupa, J.; Murphy, J.; Sorenson, K. Guidebook to Decision-Making Methods; US Department of Energy: Washington, DC, USA, 2001. Available online: https://www.researchgate.net/publication/255621095_Guidebook_to_Decision-Making_Methods (accessed on 5 July 2019).
  77. Arthurson, V. Closing the global energy and nutrient cycles through application of biogas residue to agricultural land–potential benefits and drawback. Energies 2009, 2, 226–242. [Google Scholar] [CrossRef]
  78. Smet, E.; Van-Langenhore, H.; De-Bo, I.Z. The emission of volatile compounds during the aerobic and the combine anaerobic/aerobic composting of biowaste. Atmos. Environ. 1998, 33, 1295–1303. [Google Scholar] [CrossRef]
  79. Abdullahi, Y.A.; Akunna, J.C.; White, N.A.; Hallett, P.D.; Wheatley, R. Investigating the effects of anaerobic and aerobic post-treatment on quality and stability of organic fraction of municipal solid waste as soil amendment. Bioresour. Technol. 2008, 99, 8631–8636. [Google Scholar] [CrossRef] [PubMed]
  80. Dahlin, S.; Kirchmann, H.; Kätterer, T.; Gunnarsson, S.; Bergström, L. Possibilities for improving nitrogen use from organic materials in agricultural cropping systems. AMBIO 2005, 34, 288–295. [Google Scholar] [CrossRef]
  81. Montemurro, F.; Canali, S.; Convertini, G.; Ferri, D.; Tittarelli, F.; Vitti, C. Anaerobic digestates application on fodder crops: Effects on plant and soil. Agrochimica 2008, 52, 297–312. [Google Scholar]
  82. Petersen, S.O.; Henriksen, K.; Mortensen, G.K.; Krogh, P.H.; Brandt, K.K.; Sørensen, J.; Madsen, T.; Petersen, J.; Grøn, C. Recycling of sewage sludge and household compost to arable land: Fate and effects of organic contaminants, and impact on soil fertility. Soil Tillage Res. 2003, 72, 139–152. [Google Scholar] [CrossRef]
  83. El Hammoudani, Y.; Dimane, F.; El Ouarghi, H. Characterization of sewage sludge generated from wastewater treatment plant in relation to agricultural use. Environ. Water Sci. Public Health Territ. Intell. J. 2019, 3, 47–52. [Google Scholar]
  84. Mtshali, J.S.; Tiruneh, A.T.; Fadiran, A.O. Characterization of sewage sludge generated from wastewater treatment plants in Swaziland in relation to agricultural uses. Resour. Environ. 2014, 4, 190–199. [Google Scholar]
  85. Nicolás, C.; Kennedy, J.N.; Hernández, T.; García, C.; Six, J. Soil aggregation in a semiarid soil amended with composted and non-composted sewage sludge—A field experiment. Geoderma 2014, 219, 24–31. [Google Scholar] [CrossRef]
  86. Tsachidou, B.; Scheuren, M.; Gennen, J.; Debbaut, V.; Toussaint, B.; Hissler, C.; George, I.; Delfosse, P. Biogas residues in substitution for chemical fertilizers: A comparative study on a grassland in the Walloon Region. Sci. Total Environ. 2019, 666, 212–225. [Google Scholar] [CrossRef] [PubMed]
  87. Bengtsson, M.; Tillman, A.M. Actors and interpretations in an environmental controversy: The Swedish debate on sewage sludge use in agriculture. Resour. Conserv. Recycl. 2004, 42, 65–82. [Google Scholar] [CrossRef]
  88. Litterick, A.; Harrier, L.; Wallace, P.; Watson, C.A.; Wood, M. Effects of Composting Manures and Other Organic Wastes on Soil Processes and Pest and Disease Interactions. 2003. Available online: http://orgprints.org/6694 (accessed on 2 July 2019).
  89. Smith, S.R. Organic contaminants in sewage sludge (biosolids) and their significance for agricultural recycling. Philos. Trans. R. Soc. A 2009, 367, 4005–4041. [Google Scholar] [CrossRef] [PubMed] [Green Version]
  90. Clarke, B.O.; Smith, S.R. Review of ‘emerging’ organic contaminants in biosolids and assessment of international research priorities for the agricultural use of biosolids. Environ. Int. 2011, 37, 226–247. [Google Scholar] [CrossRef] [PubMed]
  91. Ellen MacArthur Foundation. Towards the Circular Economy. Economic and Business Rationale for an Accelerated Transition; Ellen MacArthur Foundation: Cowes, UK, 2013; Available online: http://circularfoundation.org/sites/default/files/tce_report1_2012.pdf (accessed on 28 August 2019).
Figure 1. Technological flow for platform sanitation.
Sustainability 11 04922 g001
Table 1. Physical and chemical characteristics of compost (soil improver).
IndicatorValues
Total solids (TS) [%]45.43 ± 2.05
Water [%]54.57 ± 2.82
Total organic matter 1 (VS) [%]60.98 (toward TS)) ± 3.25
Ashes 1 [%]39.02 (toward TS) ± 1.65
Granulation, residue on the sieve of 2 mm [%]0.03 ± 0.01
Ammoniacal nitrogen [%]0.67 (toward TS) ± 0.02
Total organic nitrogen (TKN) [%]5.20 (toward TS) ± 0.25
Phosphor (P2O5) [%]10.40 (toward TS) ± 0.55
Potassium (K2O) [%]0.23 ± 0.01
pH (22 °C)6.00
Organic carbon 1 [%]35.4 (toward VS) ± 1.95
Ratio C/N6.81 ± 0.21
Content of solid saltslow
1 Values are relative to dry matter.
Table 2. Matrix of criteria and degrees of importance.
Criterion (Ci)ObjectiveDegree of Importance (Wi)V1V2V3
C1 (OR)maxW1C11C12C13
C2 (GR)maxW2C21C22C23
C3 (CF)maxW3C31C32C33
C4 (EI)minW4maxminmed
C5 (CRS)maxW5medmaxmin
Table 3. Performance matrix.
ViC1C2C3C4C5
V1V11V12V13V14V15
V2V21V22V23V24V25
V3V31V32V33V34V35
Table 4. Cost for disposal of eliminated waste from the biogas process.
MonthAwe [ton]Cdw [EUR/ton]Twdc [EUR]
201620172018201620172018201620172018
January253.76448.30513.0314.2032.8915.113603.3914,744.097752.45
February308.64403.86418.5214.2032.8917.114382.6913,282.517161.34
March444.22444.14490.1814.2032.8917.116307.9214,607.278387.59
April367.22273.78434.7014.2032.8917.115214.529,004.327438.20
May479.74352.98443.7615.1132.8917.117248.8711,609.127593.23
June449.02372.40423.8515.1132.8917.116784.6912,247.827252.56
July439.88441.20430.3515.1115.1117.116646.596667.027363.75
August464.52429.96454.1715.1115.1117.117018.906497.177771.28
September355.33329.70417.5415.1115.1117.115369.044982.137144.57
October422.50385.50436.2015.1115.1117.116384.025825.337463.87
November348.48346.04458.2015.1115.1117.115265.535229.057840.31
December279.48472.88453.4015.1115.1117.114222.947145.747758.18
Total4612.794700.745373.9014.8423.7916.9268,449.11111,841.5890,927.34
Table 5. Estimated cost for disposal of waste from biogas plant for 2019–2020.
MonthAwe [ton]Cdw [EUR/ton]Twdc [EUR]
201920202019202020192020
January547.40548.3234.8843.7819,093.4224,003.13
February446.56447.3134.8843.7815,576.0419,581.29
March523.03523.9034.8843.7818,243.1622,934.24
April463.82464.6034.8843,7816,178.2120,338.31
May473.49474.2834.8843.7816,515.4020,762.20
June452.25453.0034.8843.7815,774.4519,830.72
July489.95498.1334.8843,7817,089.3721,806.13
August517.06525.7034.8843.7818,035.1623,012.95
September475.36483.3034.8843.7816,580.7221,157.08
October496.61501.9134.8843.7817,321.7221,971.51
November521.66527.2234,8843.7818,195.3523,079.66
December516.19521.7034.8843,7818,004.7422,837.88
Total5923.395969.3734.88 *43.78206,607.74261,315.10
* Cost of removing sludge as waste taken into account for the year 2019. For 2020, it increases to 43.78 EUR/ton.
Table 6. Estimate cost of ameliorator manufacturing in 2019.
MonthQuantity of Processed Waste [ton]Quantity of Resulted Ameliorator [ton]Cost of Auxiliary Materials [EUR]Cost of Workmanship [EUR]Cost of Packing [EUR]Other Operating Expenses [EUR]Total Cost of Manufacturing [EUR]Amortization [EUR]Cost of Storage [EUR]Cost of Delivery [EUR]Total cost of Complete Ameliorator [EUR]Total cost of Ameliorator [EUR/ton]Estimated Selling Price [EUR/ton]Total Turnover [EUR]Result [EUR]
January-19547.40437.922761.342384.245352.382718.7713,216.748333.331565.573041.1326,156.7859.73100.0043,792.2417,635.47
February-19446.56357.252252.651945.024366.372217.9210,781.968333.331277.162480.8922,873.3564.03100.0035,724.8712,851.51
March-19523.03418.422638.382278.075114.042597.7012,628.188333.331495.862905.7025,363.0760.62100.0041,842.1116,479.04
April-19463.82371.062339.742020.224535.182303.6611,198.798333.331326.542576.8123,435.4763.16100.0037,105.9913,670.52
May-19473.49378.792388.502062.324629.702351.6811,432.208333.331354.192630.5123,750.2362.70100.0037,879.3514,129.12
June-19452.25361.802281.351969.804421.992246.1710,919.308333.331293.432512.5023,058.5763.73100.0036,179.9313,121.37
July-19489.95391.962471.512133.994790.602433.4111,829.518333.331401.252721.9324,286.0361.96100.0039,195.8114,909.78
August-19517.06413.652608.302252.105055.732568.0812,484.208333.331478.802872.5725,168.9060.85100.0041,365.0416,196.14
September-19475.36380.292397.952070.484648.012360.9811,477.428333.331359.542640.9123,811.2162.61100.0038,029.1814,217.97
October-19496.61397.292505.122163.014855.732466.4911,990.358333.331420.302758.9424,502.9261.68100.0039,728.7115,225.79
November-19521.66417.322631.462272.105100.632590.8912,595.098333.331491.942898.0925,318.4460.67100.0041,732.4516,414.01
December-19516.19412.952603.902248.305047.202563.7512,463.148333.331476.312867.7325,140.5160.88100.0041,295.2716,154.76
Total 20195923.394738.7129,880.2025,799.6457,917.5629,419.49143,016.89100,000.0016,940.8932,907.71292,865.4861.80100.00473,870.95181,005.48
Table 7. Gross estimated result in 2019.
IndicatorQuantityUnitary Price [EUR]V1V2V3
Income [EUR]Expenses [EUR]Income [EUR]Expenses [EUR]Income [EUR]Expenses [EUR]
Quantity of waste (slaughter residues) processed in the biogas plant [ton/year]15,500.00317,750.00
Quantity of waste (slaughtering remains) sold by third parties [ton/year]15,500.0020.50317,750.00317,750.00317,750.00
Quantity of sludge removed as waste [ton/year]5923.0034.880.00206,594.240.0041,308.050.000.00
Quantity of obtained ameliorator [ton/year]4738.71100.000.000.00473,870.950.000.000.00
Quantity of produced electricity [Mw/year]8500.0082.50701,250.000.00701,250.000.000.00701,250.00
Green certificates obtained [Number/year]16,320.0029.40479,808.000.00479,808.000.000.000.00
Green certificates for self-consumption [Number/year]2720.0029.400.0079,968.000.0079,968.000.000.00
Quantity of produced thermal energy [Mw/an]5100.0028.50145,350.000.00145,350.000.00
Wages [EUR/year]0.0018,500.000.0044,300.000.001,500.00
Operational costs [EUR/year]0.00288,092.000.00288,092.0075,000.00
Auxiliary materials [EUR/year]0.000.000.0029,880.000.000.00
Packaging costs [EUR/year]0.000.000.000.000.0057,918.00
Biogas substances [EUR/year]154,379.110.00154,379.1177,189.56
Ferrous sulfate treatment (water treatment) [EUR/year]199,144.42199,144.4235,143.13
Total1,644,158.00946,677.772,118,028.95837,071.59635,500.00948,000.69
Result before amortization [EUR/year]697,480.231,280,957.36−312,500.69
Amortization: Biogas plant [EUR/year]−309,235.33−309,235.33−309,235.33
Amortization of investment ameliorator platform [EUR/year]−100,000.00
Operating result (after amortization) [EUR/year]388,244.89971,722.03−621,736.02
Financing costs [EUR/year]−52,000.00
Gross result: Biogas plant [EUR/year]388,244.89919,722.03−621,736.02
Table 8. Estimated values of criteria variants.
CriterionObjectiveDegree of ImportanceVariants
V1V2V3
ORmax0.16388,244.89971,722.03−621,736.02
GRmax0.06388,244.89919,722.03−621,736.02
CFmax0.22697,480.231,328,957.36−312,500.69
EImin0.315010
CRSmax0.255100
Table 9. The normalized performance matrix.
CriterionVariants
V1V2V3
OR0.401.00−0.64
GR0.421.00−0.68
CF0.521.00−0.24
EI0.501.000.00
CRS0.501.000.00
Table 10. Matrix of concordance and discordance.
ViConcordanceDiscordance
V1V2V3V1V2V3
V1-0.001.00-0.600.00
V21.00-1.000.00-0.00
V30.000.00-1.101.68-
Table 11. Over-classing variants and choosing the best option.
ViV1V2V1V3V2V1V2V3V3V1V3V2
c(Vi, Vj)0.001.001.001.000.000.00
d(Vi, Vj)0.600.000.000.001.101.68
c* = 1, d* = 0NYYYNN
c* = 0.9, d* = 0.1NYYYNN
c* = 0.8, d* = 0.2NYYYNN
c* = 0.7, d* = 0.3NYYYNN
c* = 0.6, d* = 0.4NYYYNN
c* = 0.5, d* = 0.5NYYYNN
c* = 0.4, d* = 0.6NYYYNN
c* = 0.3, d* = 0.7NYYYNN
c* = 0.2, d* = 0.8NYYYNN
Table 12. Ameliorator investment recovery analysis.
YearQuantity of Processed Waste [ton]Quantity of Resulted Ameliorator [ton]Total Cost of Manufacturing [EUR]Amortization [EUR]Cost of Storage [EUR]Cost of Delivery [EUR]Total Turnover [EUR]Results [EUR]Cost of Opportunity [EUR]Marginal Result [EUR]
20195923.394738.71143,016.89100,000.0016,940.8932,907.71473,870.95181,005.46206,607.84387,613.30
20205969.374775.50144,127.00100,000.0017,072.4033,163.17477,549.60183,187.04261,339.02444,526.05
20216009.364807.49145,092.65100,000.0017,186.7833,385.36480,749.18185,084.39263,089.99448,174.38
20226049.634839.70146,064.77100,000.0017,301.9333,609.04483,970.20186,994.45264,852.69451,847.15
20236090.164872.13147,043.41100,000.0017,464.3633,924.56487,212.80188,780.47266,627.21455,407.68
20246130.964904.77148,028.60100,000.0017,581.3734,151.85490,477.13190,715.30268,413.61459,128.91
20256172.044937.63149,020.39100,000.0017,699.1734,380.67493,763.32192,663.10270,211.98462,875.07
20266213.394970.72150,018.82100,000.0017,817.7534,611.02497,071.54194,623.94272,022.40466,646.34
20276255.025004.02151,023.95100,000.0017,937.1334,842.92500,401.92196,597.92273,844.95470,442.87
20286296.935037.55152,035.81100,000.0018,075.3235,111.35503,754.61198,532.13275,679.71474,211.84
20296339.125071.30153,054.450.0018,196.4335,346.59507,129.77300,532.30277,526.77578,059.06
20306381.595105.28154,079.920.0018,318.3435,583.41510,527.54302,545.86279,386.19581,932.06
20316424.355139.48155,112.250.0018,441.0735,821.82513,948.07304,572.92281,258.08585,831.00
20326467.395173.92156,151.500.0018,564.6336,061.83517,391.52306,613.56283,142.51589,756.07
20336510.735208.58157,197.720.0018,689.0136,303.44520,858.05308,667.87285,039.57593,707.44

