Article

GIS Crime Mapping to Support Evidence-Based Solutions Provided by Community-Based Organizations

Department of Geography Education, Dongguk University-Seoul, Seoul 100715, Korea
Sustainability 2019, 11(18), 4889; https://doi.org/10.3390/su11184889
Submission received: 16 June 2019 / Revised: 30 August 2019 / Accepted: 30 August 2019 / Published: 6 September 2019

Abstract

:
This study explored geospatial technologies to support efforts of community organizations and of the Chicago Gun Violence Research Collaboration to reduce gun-related crimes. It entailed (1) identification of spatial trends in gun-related crimes during 2012 to 2017 in each of the following four areas: Austin, East Garfield, North Lawndale, and Englewood; (2) investigation of changes in crime patterns near safe school zones in the areas before and after the establishment of the city’s safe passage routes in 2009 to protect the youth from street violence when traveling to school; and (3) development of a web-enabled mobile application to provide researchers and residents with spatial information on local crime incidents and to enable community members to collect and share their information in a GIS environment. The results of this research revealed that, although the number of safe passage routes has increased in these areas over the past several years, hotspot trends for gun-related crimes have intensified in most of the communities in these areas, which include school zones and safe passage routes. Accordingly, it turned out that GIS can serve as an ideal platform supporting collaborative efforts between communities and researchers.

1. Introduction

1.1. Background

America’s gun homicide rate is 25 times higher than other comparable nations [1]. In 2015, 2988 people lost their lives to gun violence. Wertz et al. (2018) stated that for their protection, about 1 million firearms play a critical role in domestic violence; approximately 21% of gun-owning households have children; and 83% of criminal offenders cited self-defense as their primary motivation for carrying a gun [2,3,4]. Moreover, 300,000–600,000 guns are stolen every year [4]. In the USA, the number of new gun owners is increasing each year [2]. One of the major cities in the United States, Chicago, is also one of its most violent cities. Guns, including semi-automatic rifles, have spread into nearby communities, thus fueling more than 700 homicides and over 4000 shooting victims in 2015 and even larger numbers in subsequent years [5]. The Chicago crime rate began rising dramatically in 2016, and the 2017 crime incident rate per 100,000 people was higher in Chicago than in New York City [6]. The city’s 762 homicides exceeded those committed in New York and Los Angeles combined [7]. Overall, more than ten Chicagoans are killed or wounded from gunshots each day. Furthermore, Chicago has long been highly segregated, and violence in the city disproportionately influences its most vulnerable and disadvantaged community areas [8]. Gun-related crimes are particularly prevalent in Austin, East Garfield, North Lawndale, and Englewood [5,7]. According to the 2016 Schwab Rehabilitation Hospital’s Community Health Needs Assessment report and the Sinai Health System (SHS) study, homicide rates in West Englewood is three times higher than Chicago average and ten times higher than the national rate [9]. Each year, SHS cares for over 2700 trauma victims, approximately 800 of whom were victims of non-fatal gun violence injury.
Figure 1 presents the four community neighborhoods: Austin (1), East Garfield (2), North Lawndale (3), and Englewood (4). These communities are highly segregated, and local organizations identify them as having the highest rates of violence [9].
In addition to severe gun-related crimes, more challenging concerns are that city schools experience high rates of violence and other criminal activity, and children have faced dangers because of having to pass through gang territories on their way to school. As of 2013, approximately 50 Chicago public schools (CPS) were closed during the first decade of the century because of several reasons such as low-income families, poor academic performances of schools, crime rates, and serious under-enrollment rates [10,11]. In 2009, the CPS created the Safe Passage Program, including 37 safe routes, to protect children from street violence on their way to and from schools. In 2013, an anti-violence program was created, and the safe routes were mapped through collaborative efforts between the Chicago Police and neighborhood residents [12]. As of January 2018, there were 146 safe routes to approximately 159 schools in the CPS district [13]. Mayor Emanuel and CPS recently announced that safe routes have experienced a 32% decrease in crime since 2012 [14]. Nonetheless, in 2017, approximately 860 gunshots were documented as having occurred around safe passage routes during school hours.
Regarding the gun-related violence around the safe passage routes, the Chicago Gun Violence Research Collaborative (CGVRC) was formed in 2017 as a consortium to find the root causes of violence as well as what works to stop the violence. The primary goals of the consortium include promoting the active involvement of local residents in developing a community-driven research framework, establishing data-driven decision-making, and making research and evaluation findings more easily accessible to residents. Another of its main objectives is to investigate research methods to help community residents and researchers understand the root causes of gun violence. Accordingly, the activities are to reassure the residents in the four community areas and provide law enforcement agencies with evidence-based information. During its first year of existence, the CGVRC team built an organizational structure comprising a leadership team and workgroups devoted to research, community engagement, and philanthropy and media; its activities included providing listening sessions and questionnaire interviews, building on research models, and developing the first annual CGVRC fellowship program for eight faculty fellows (including the author) in multiple disciplines. The listening sessions and interviews enabled the organization to gather citizens’ opinions on the underlying causes of gun violence.

1.2. The Current Study and Research Objectives

As the primary researcher in this consortium, the author led a GIS mapping team in the CGVRC fellowship program. By the end of June 2018, the CGVRC research team had produced remarkable outputs to aid its efforts to support Chicago communities. For instance, in response to “What do you think causes gun violence in your community?”, five factors underlying the root causes of gun violence were identified: (1) socioeconomic factors, (2) generational and historical violence and trauma, (3) societal and cultural trends, (4) city policies, and (5) the Chicago Police Department’s practices [15]. In addition to the outputs, through the fellowship program, student fellows had an insightful experience in understanding the community areas. They collected data through interviews and identified the so-called “bright spots” in each area that are historically valuable sites and can be used for community assets or tourism attractions. One of the student fellows stated that the activity enabled the student fellows to explore popular sites like barbershops [16]. The sites can be used as valuable assets to economically revitalize the community area using tourism resources. During the fellowship program, researchers (including the author) and student fellows engaged in deep discussion to conceptualize community-driven approaches to researching gun violence and developed the research framework to reflect community needs such as evaluating current practice methods, supporting new research opportunities for the youth in these communities, creating trustworthy connections with community members, and so on [15].
However, there are certain limitations in reflecting the following. First, in response to the questions “How do you feel about researchers in your communities?”, “How has research been done in your community in the past?”, and “What has and has not worked?”, residents responded that “There needs to be a responsive form of research that responds to the community’s need”; “Researchers need to know what they are going to get out of it”; and “Make it easy for people to understand and access the research information”. Second, with regard to the output produced in this research, most of the results are documented as numbers or descriptions in academic reports and are thus not highly accessible to most community members. Statistical approaches using survey data have been traditionally used, but they do not include location-based information or knowledge. In other words, the current study needs to embed spatial information and knowledge in space and time to explore the questions of who, what, when, why, and how. Furthermore, current research approaches are not sufficient to promote the engagement of the community residents and active researchers. Even though the CGVRC fellows have produced remarkable outputs by interviewing the community residents, it is hard to visually create, assemble, and disseminate such information. Michel Goodchild emphasized volunteered geographic information (VGI), stating that it plays a critical role in promoting citizens’ participation [17,18,19]. Citizens can act as observers and participate in a community-driven project. Thus, web-enabled GIS applications are crucial in that they enable the public to voluntarily create, assemble, and disseminate geographic information [17,20]. Sarah Elwood also stated that VGI had the potential to gather, visualize, produce, and share information on a scale that was never achieved from millions of potential contributors [21]. It can encourage us to act as data producers and to improve relations between researchers and community residents [21,22]. She stated that a community benefits from resources of citizen-generated information on web-enabled GIS applications. Therefore, community-engaged and generated information has potential benefits to help understand community problems and their societal impacts.
In line with the aforementioned limitations and potential benefits of the VGI, it was essential for the author to improvise or use another way for improving spatial perceptions of community issues and for helping research groups and residents. Thus, in this study, the author decided to extend the information-gathering research into more targeted and actionable outputs by exploring proper geospatial technologies to support CGVRC’s efforts to reduce gun-related crimes and provide spatial information for both community residents and research groups. In particular, the author raised the following questions: (1) How can GIS experts contribute to communities’ efforts to collect, use, and create community resources? (2) What kinds of visualization techniques can assist in spatially understanding hotspot trends of gun-related crimes and to investigate changes in safe passage routes in the city of Chicago? (3) What are the best geospatial approaches to share a community’s spatial information or knowledge and promote researchers and community residents’ engagement in supporting evidence-based solutions for current challenges? To address these questions, the study aimed to provide thematic maps with geospatial information regarding the distribution of gun-related crimes to community residents and research groups as a means to help them to better identify and understand hotspot trends of the gun-related crimes and community resources such as locations of schools, parks, and safe passage routes. It spatially investigated changes in crime patterns near the safe school zones before and after the establishment of the safe passage routes. In addition, the study also aimed to develop a web-enabled mobile application to provide researchers and residents with spatial information concerning local issues, particularly crime incidents, as well as to enable the collection and sharing of community members’ input in a GIS environment.

2. Materials and Methods

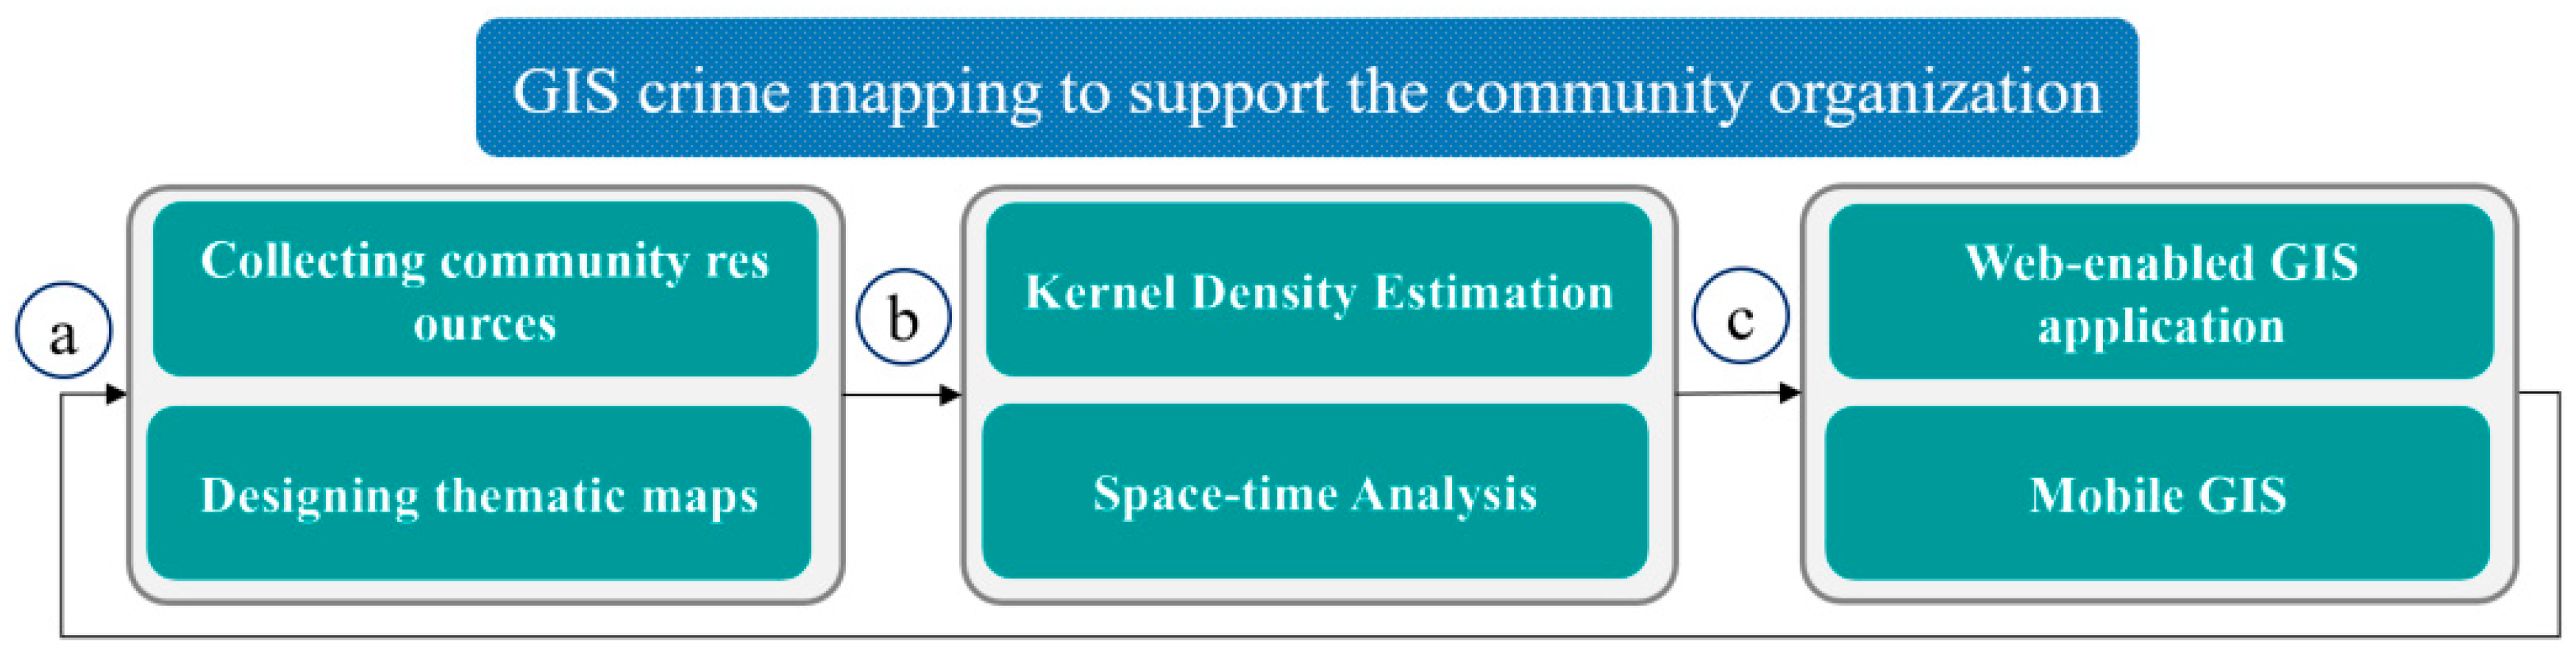
2.1. Schematic Design

The schematic design employed in this study comprises three steps. First, information on crime incidents and community resources in the four community areas was collected. It is important for researchers and community residents to explore exactly where the assets of the community exist. Hence, community resources are mapped, and gradual changes in safe passage routes are represented in the GIS environment (Figure 2a). Second, spatial analysis was conducted on spatial distributions of gun-related crimes over time (Figure 2b). Third, a web-enabled mobile GIS application was developed that collects and shares spatial information between researchers and community residents (Figure 2c). Spatial information such as mapping outputs can be used as new community resources and has a recurring event. The following sub-sections detail these three major steps.

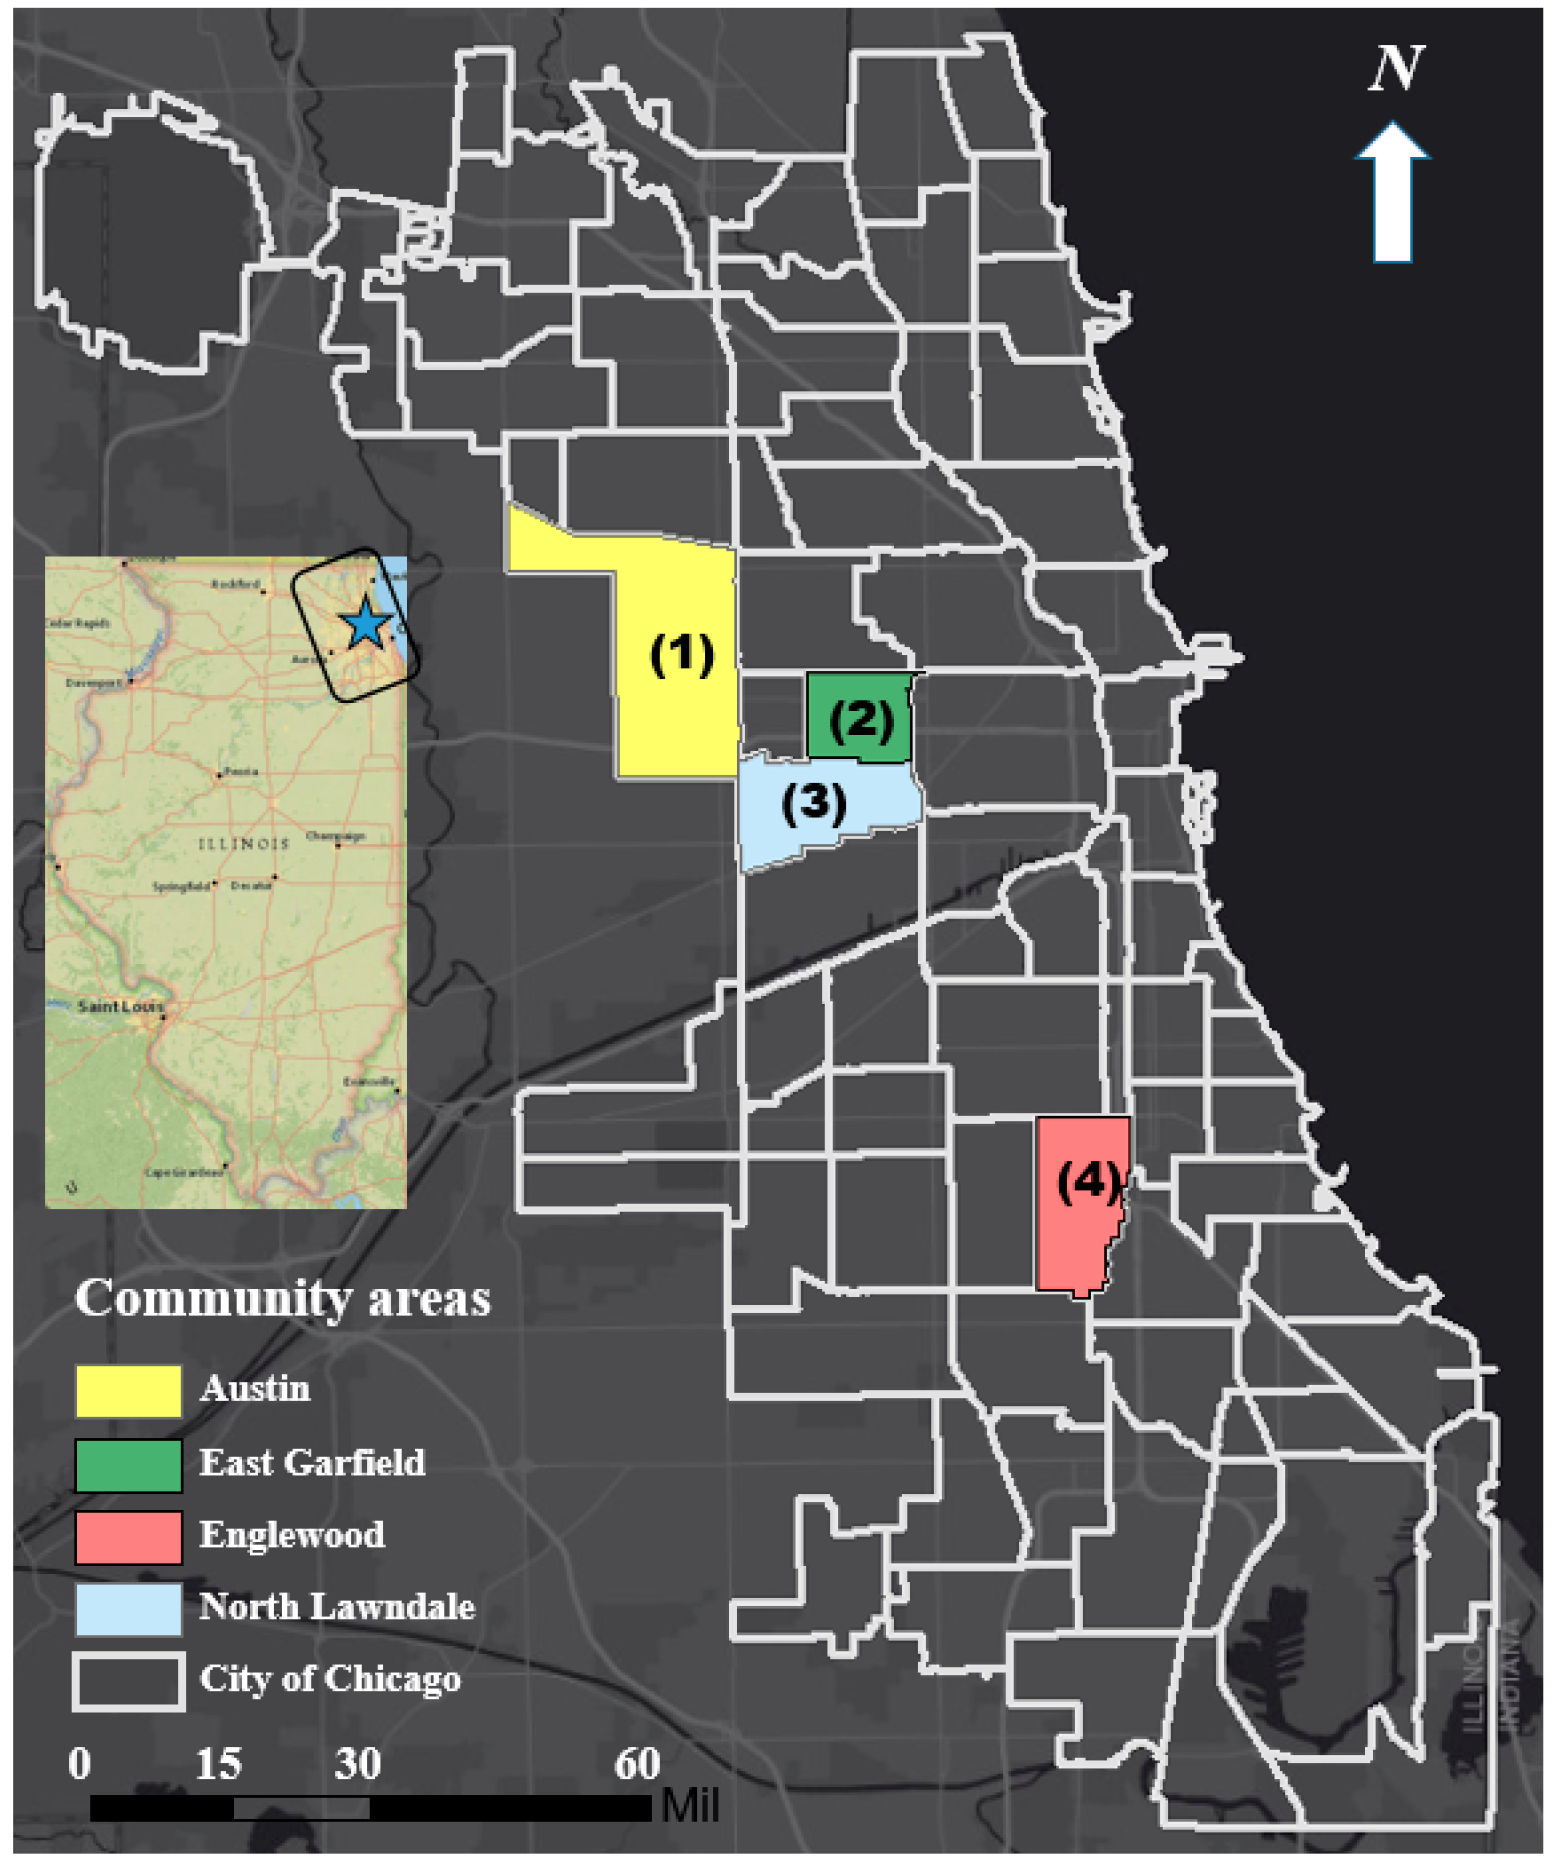
2.2. Data Collection and Mapping

In a community-engaged GIS mapping project, it is critical to collect resources including demographic and socioeconomic data, crime, and ethnic- or minority-group datasets to help residents spatially identify local assets and problems. As a part of this process, the study incorporated aggravated handgun data on assault, battery, and sexual assault crimes from 2012 to 2017 downloaded from the city of Chicago’s data portal [23]. The three types of aggravated handgun data were defined and classified as per the Uniform Crime Reporting codes derived from the National Incident-Based Reporting System of the Federal Bureau of Investigation (FBI) [24]. The City of Chicago Data Portal provides crime incidents from the year 2001 to date (as of 2018 when this research was being conducted); the author collected data on crime incidents from 2012 to 2017 to identify changes in crime patterns related to the establishment of safe passage routes. The data were extracted from the Chicago Police Department’s CLEAR (Citizen Law Enforcement Analysis and Reporting) system. To protect the privacy of the victims, the crime incident locations were shown at the block level, and specific locations are concealed [23]. The crime datasets were saved in the CSV file format, including x and y coordinates. Furthermore, schools, safe passage routes, public parks, and lakes were represented in the GIS environment. All of the GIS layers used in this research were referenced to NAD 1983 State Plane Illinois East FIPS 1201 Feet.

2.3. Spatial Analysis and Statistics

GIS-based maps translate numeric data with locational information into spatial information with geographic coordinates [25]. GIS is an ideal platform to support the needs of both local communities and researchers; it provides a spatial representation of community relationships and significant hotspots, including local resources and crime data [26,27]. GIS specialists can investigate the relationships between environmental conditions and human-oriented factors in a place that enhances community organizations’ and research groups’ understanding of local issues, thus delivering improved communication by providing visualized spatial information that informs decision-making [28].
GIS has frequently been used in crime mapping analysis, which enables urban planners to identify spatial patterns to gain a better understanding of the major issues affecting communities [26,27,28]. Furthermore, it helps to identify atypical locations and discover patterns of spatial association or clusters, thus detecting spatial patterns and trends within the gun-related crime data over time [29,30,31].
This research used data of crime incidents in the city of Chicago to conduct spatial analyses and gather statistics based on Kernel density, optimized hotspot analysis, and emerging hotspot analysis to explore general patterns of gun-related violence in the specified communities and investigate changes in crime patterns related to the establishment of safe passage routes. First, Kernel density maps (one of the most common techniques in crime mapping) were produced to calculate the density of point features and accordingly approximate the locations of crime hotspots throughout the city [32,33]. Moreover, optimized hotspot analysis was used to aggregate gun-related crime incidents into weighted features and to assess their distribution to identify a proper scale of analysis and determine significant areas [34,35,36]. The optimized hotspot analysis also considers temporal data to identify hot and cold spot trends in the gun-related crime incidents and thus observes shifts in crime patterns over time. The optimized hotspot analysis uses the Getis-Ord Gi* statistics evaluating the characteristics of crime data to produce optimal results, which are then represented in fishnet polygons that are smaller than census blocks. The technique utilized in emerging hotspot analysis is similar to the optimized method; however, it can reveal hot- or cold-spot trends in the clustering of point densities over time [37,38]. More specifically, emerging hotspot analysis creates space–time cubes that aggregate crime points and thus determines where clustering is statistically significant. This analysis can detect eight trends in the emerging hot-/cold-spot analysis: new, consecutive, intensifying, persistent, diminishing, sporadic, oscillating, and historical [39].

2.4. Developing an Interactive Map and Mobile GIS Applications

This study investigated gun-related incidents by location in the four community areas. To that end, diagrams for gun-related crime count were created in ArcGIS Online, a cloud-based mapping platform. It is important to share the research outputs or geospatial information with the public because it can allow them to participate in ongoing studies related to their community areas. Thus, this research developed an interactive map including community resources and outputs of the spatial analysis and statistics. The visual representation on maps helps the community understand spatial distribution of the community resources such as the locations of school, gun-related crimes, public parks, and lakes. This also helps us understand the spatial trends of gun-related crime patterns.
A mobile application was developed using Survey123 for ArcGIS. Developing a GIS-based mobile application to enhance volunteers’ ability to participate in the community-engaged mapping projects was the final step of this project. As introduced by quantitative geographers, mobile or web-enabled GIS applications lead the public to be involved in community-engaged projects [19]. Participation in GIS is termed as VGI [17], participatory GIS [21], public participation GIS [20], or geoparticipation [40]. For instance, a GIS-based mobile application enables the public to issue information such as 311-service requests to report problems like road damage or graffiti, as well as more serious events. Citizens can report where and when they have seen highly dangerous suspects. Accordingly, citizens can voluntarily disseminate geographic information, and the mobile application can empower them to create geospatial data in their community areas [17]. However, it is important for them to carefully disseminate geographic information because of privacy issues, wrong information, or less accurate geolocations of the geographic data. Thus, the crowd-sourced data should be judiciously used or managed by the police or local authorities. Despite this concern, such technology not only helps citizens identify where crime events have occurred but also assists police officers in conducting initial assessments of such incidents.

3. Results

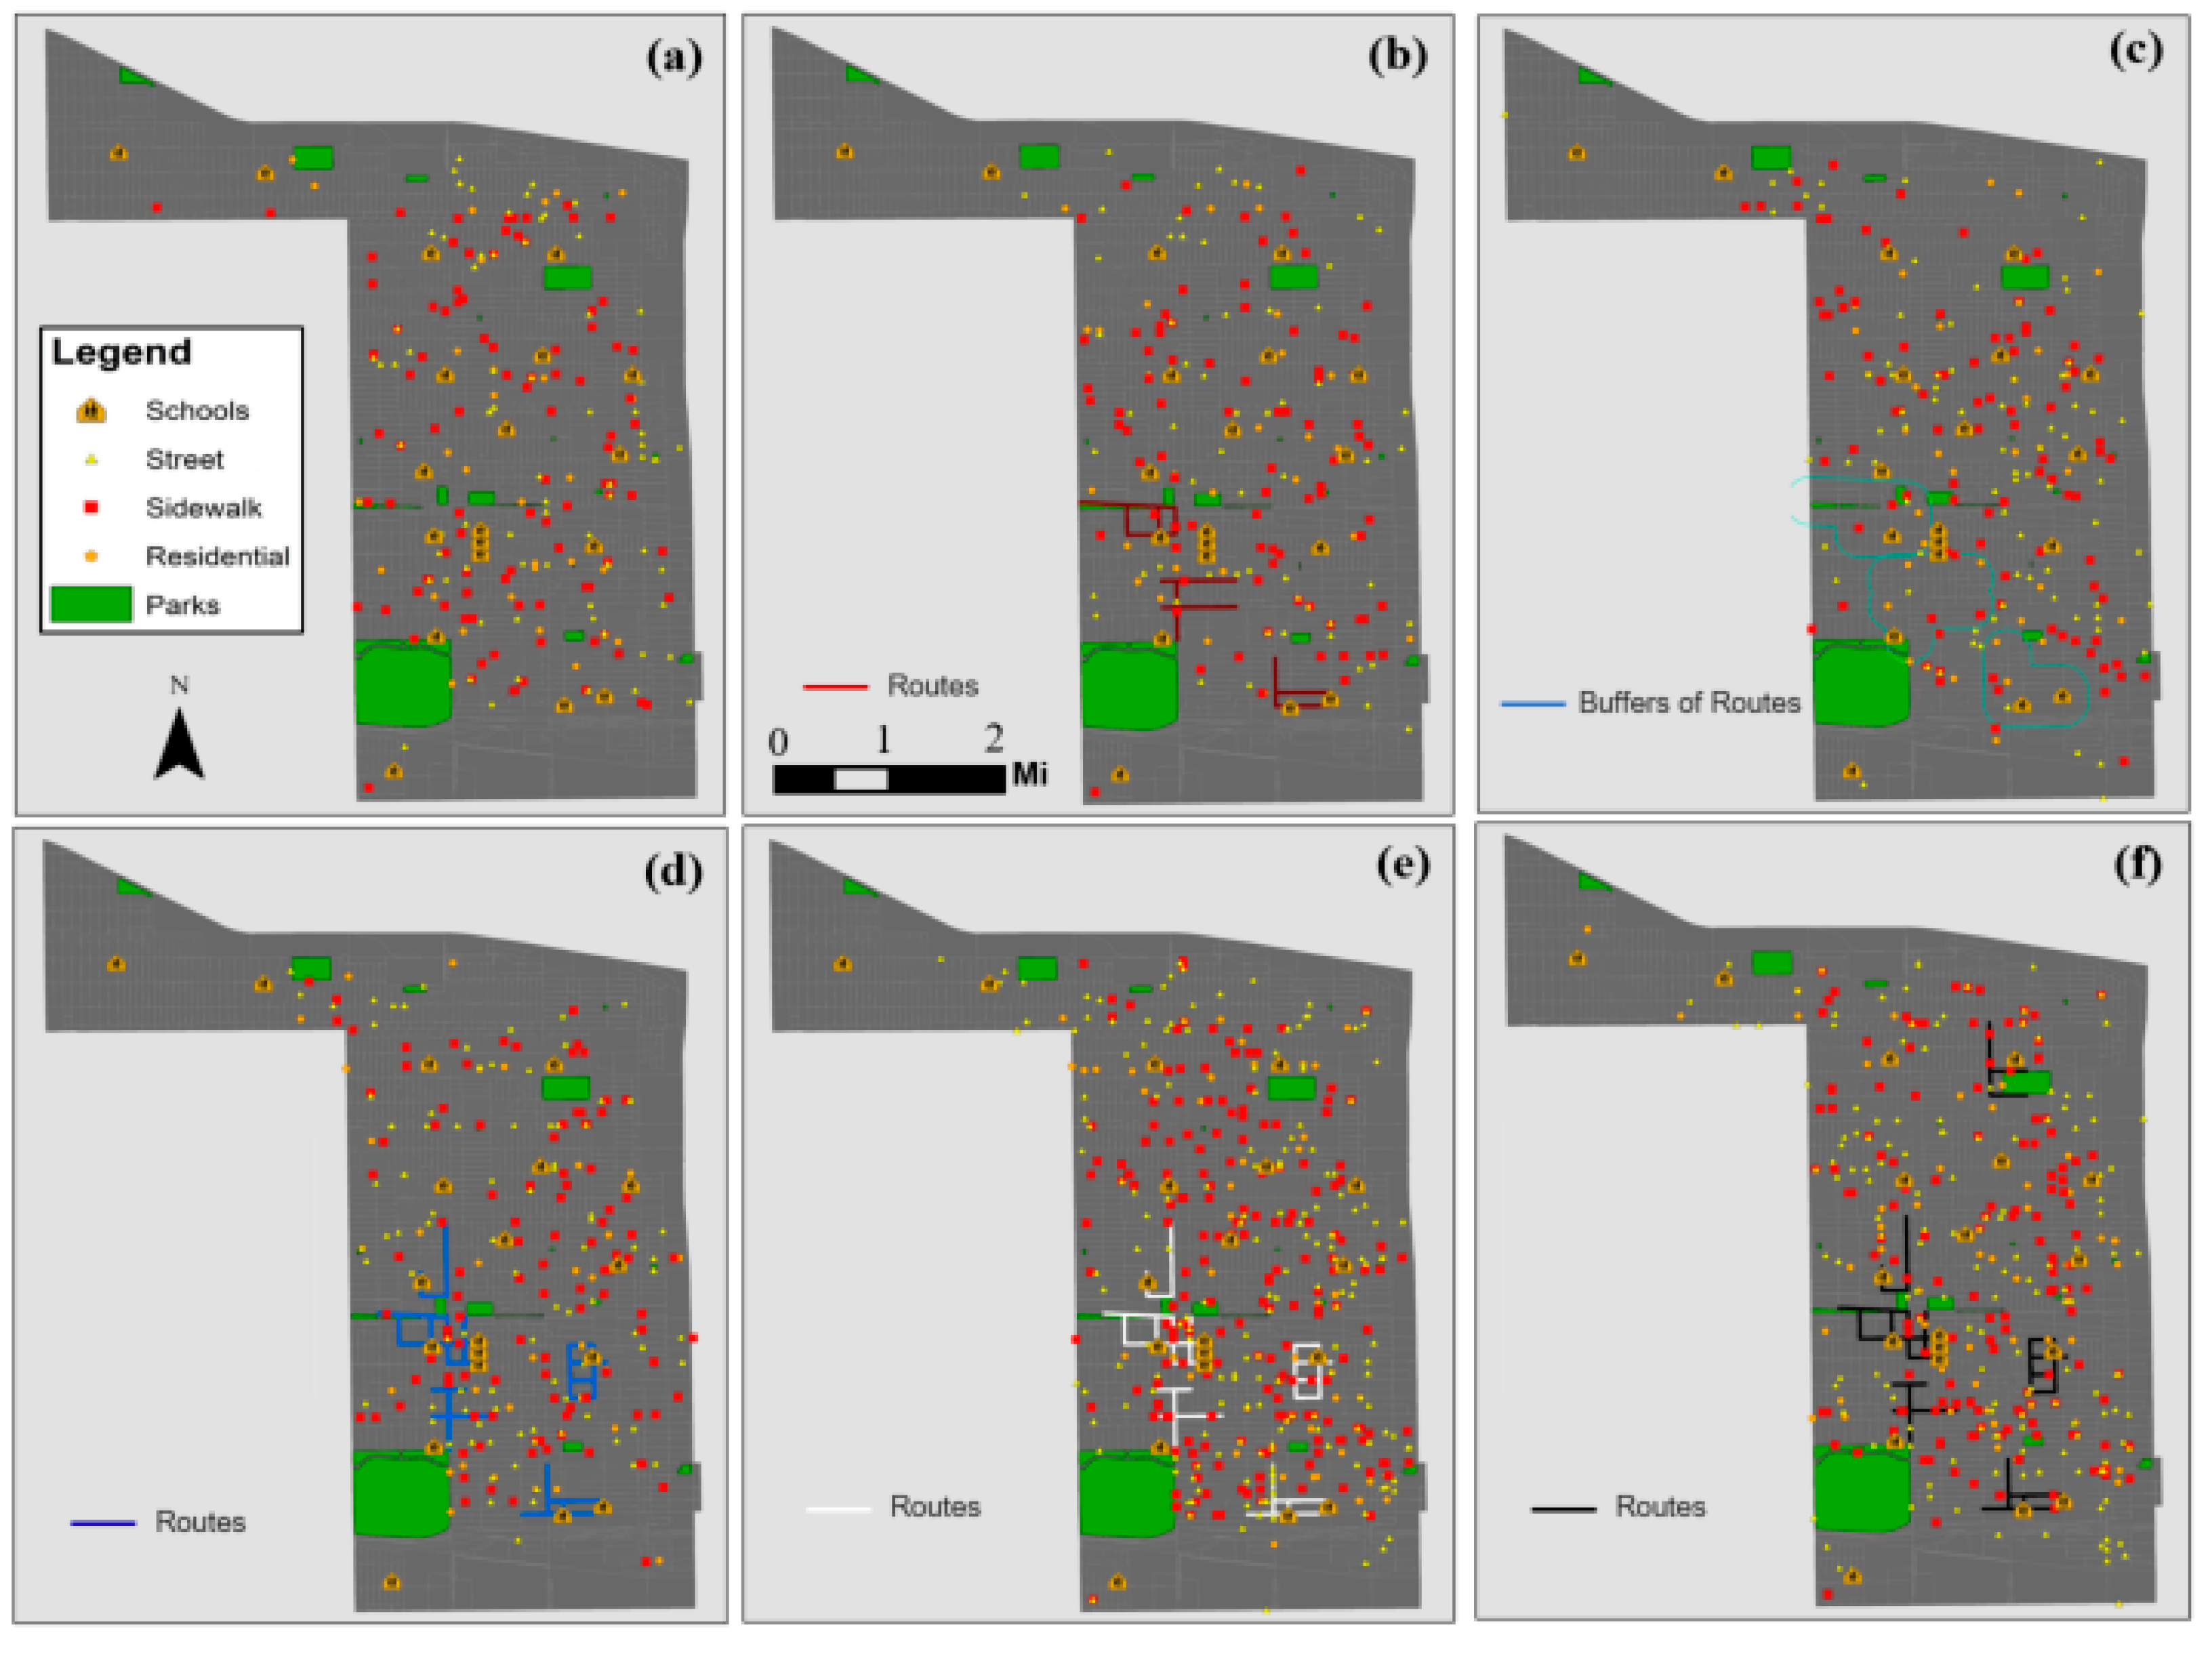
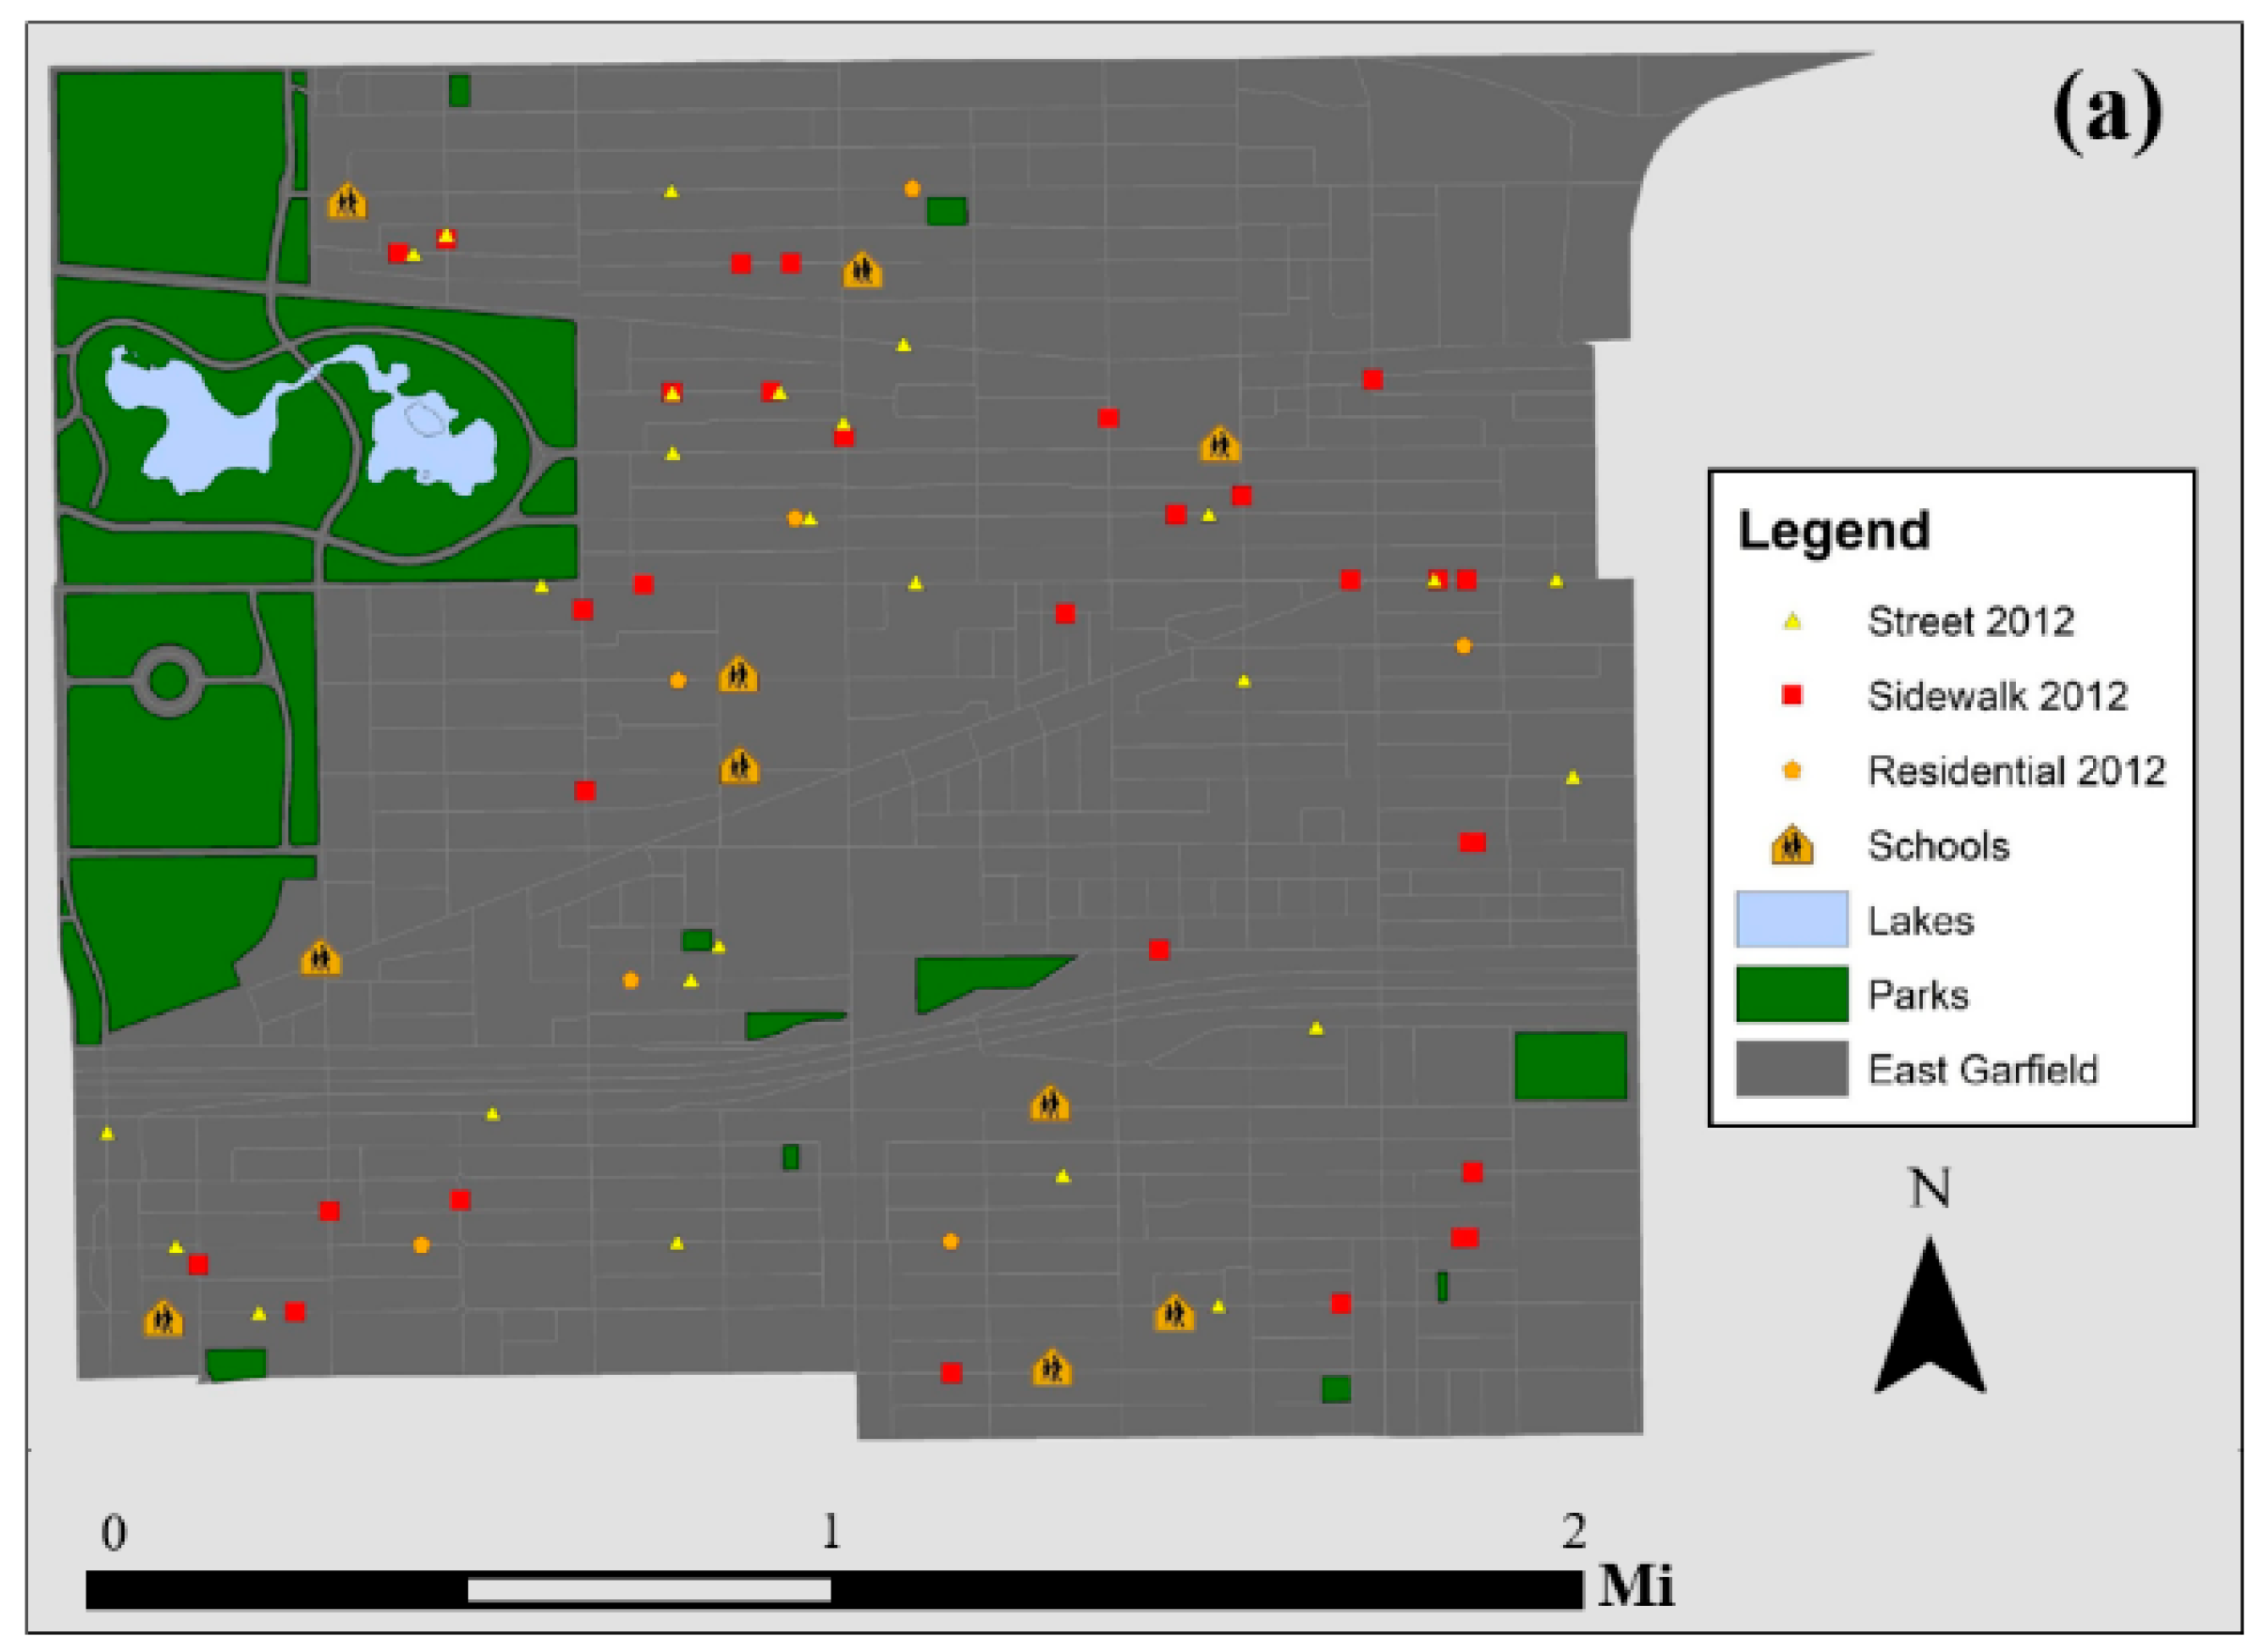
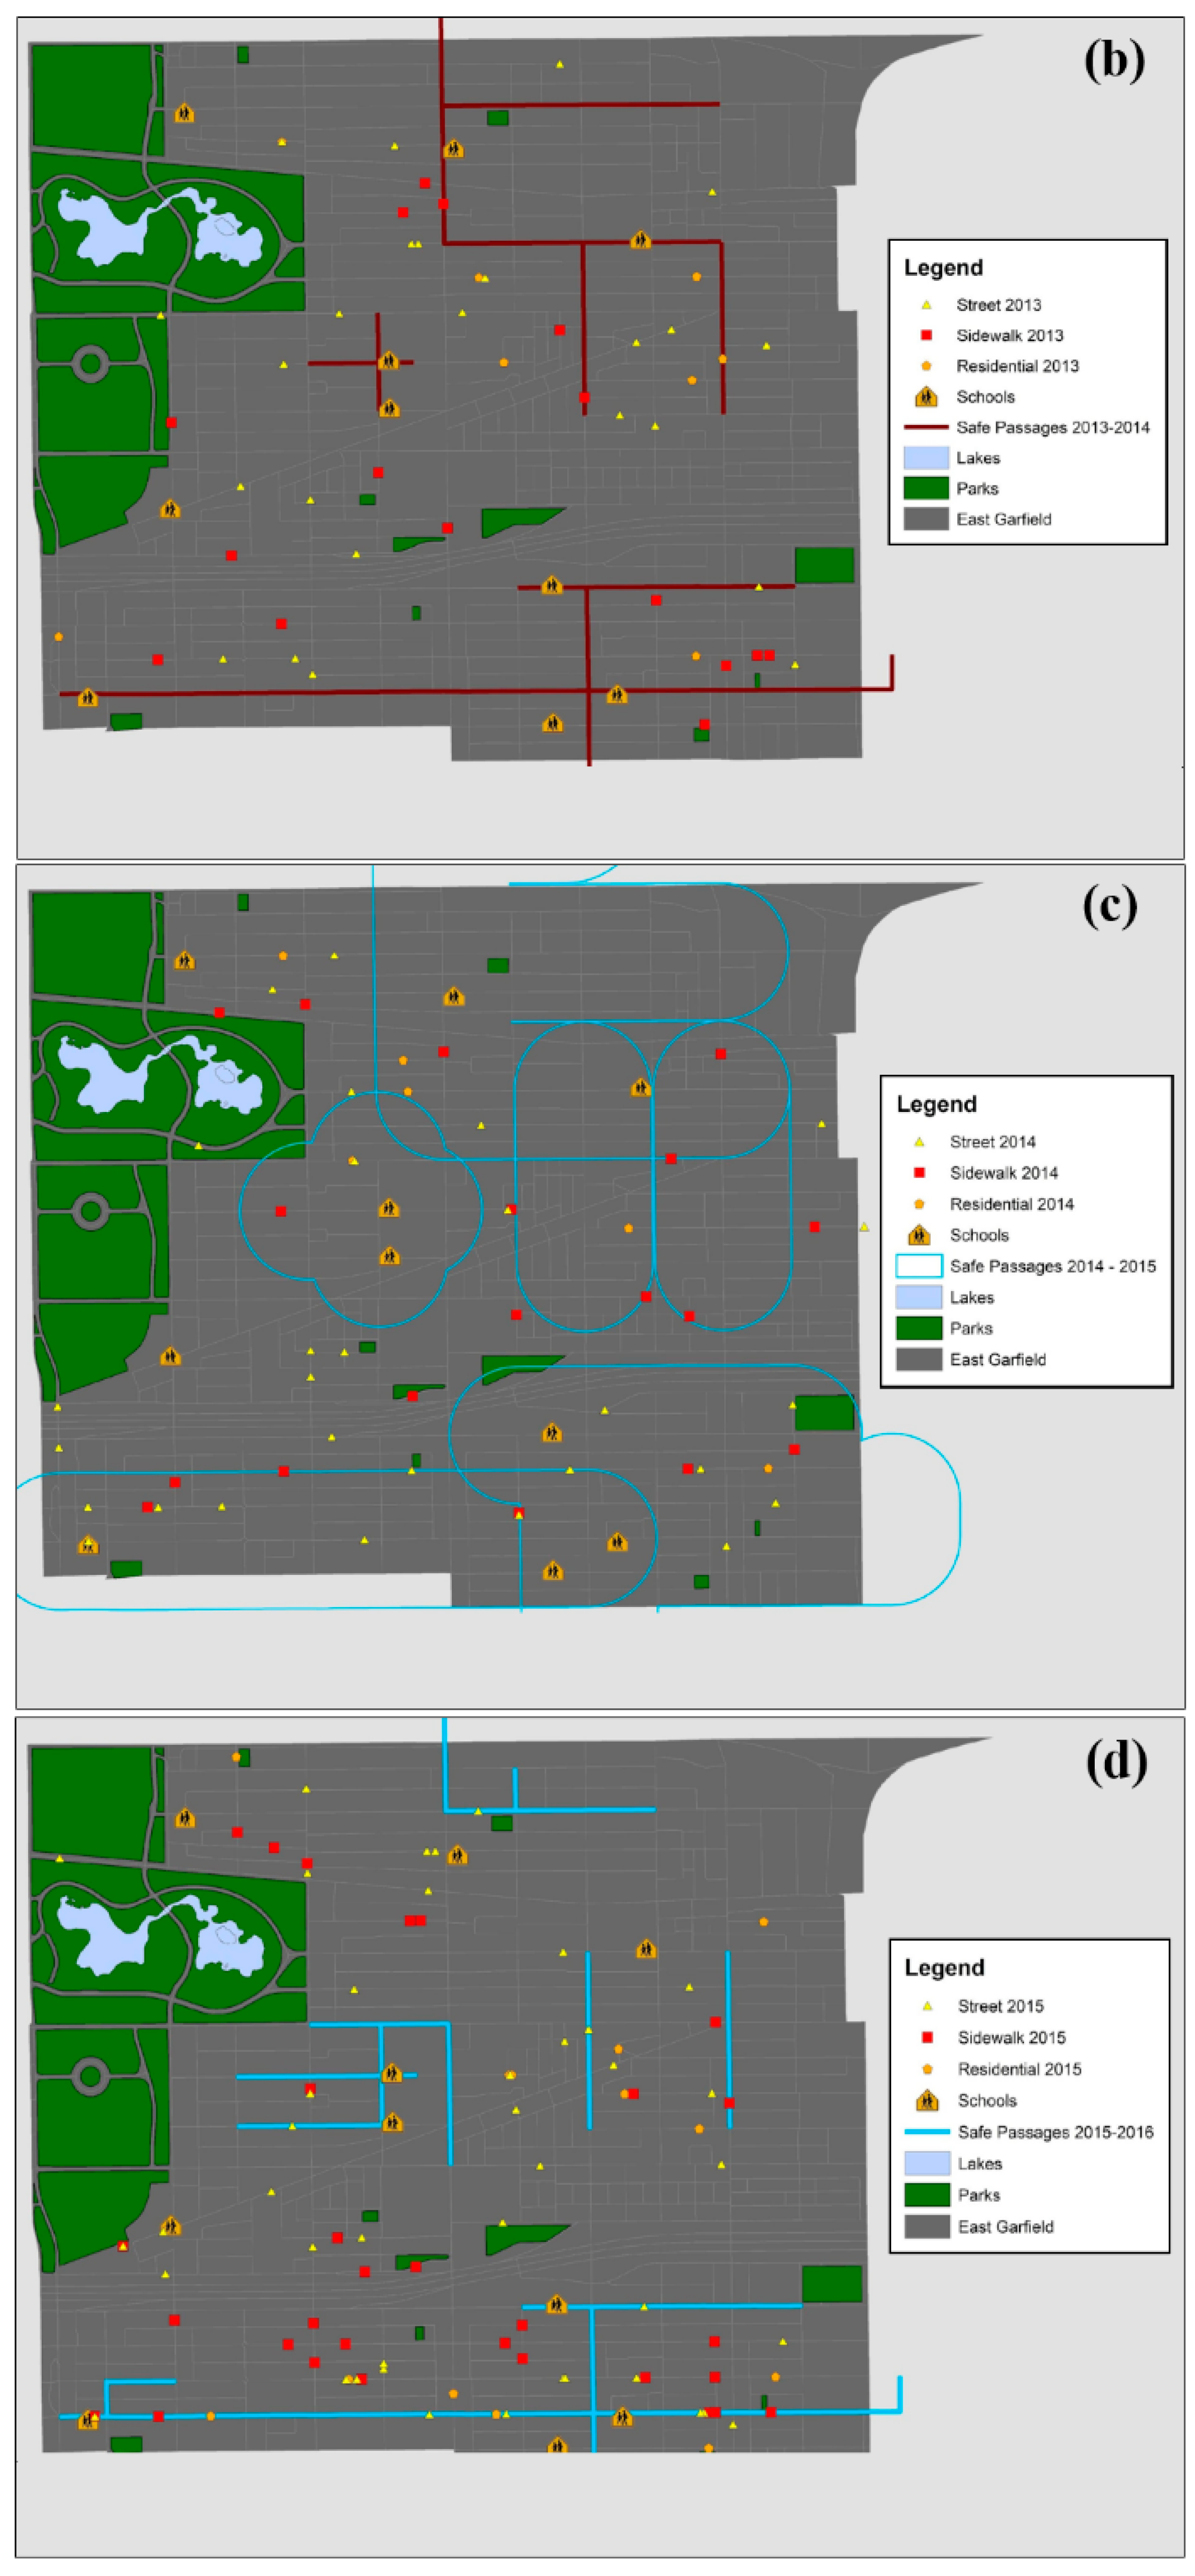
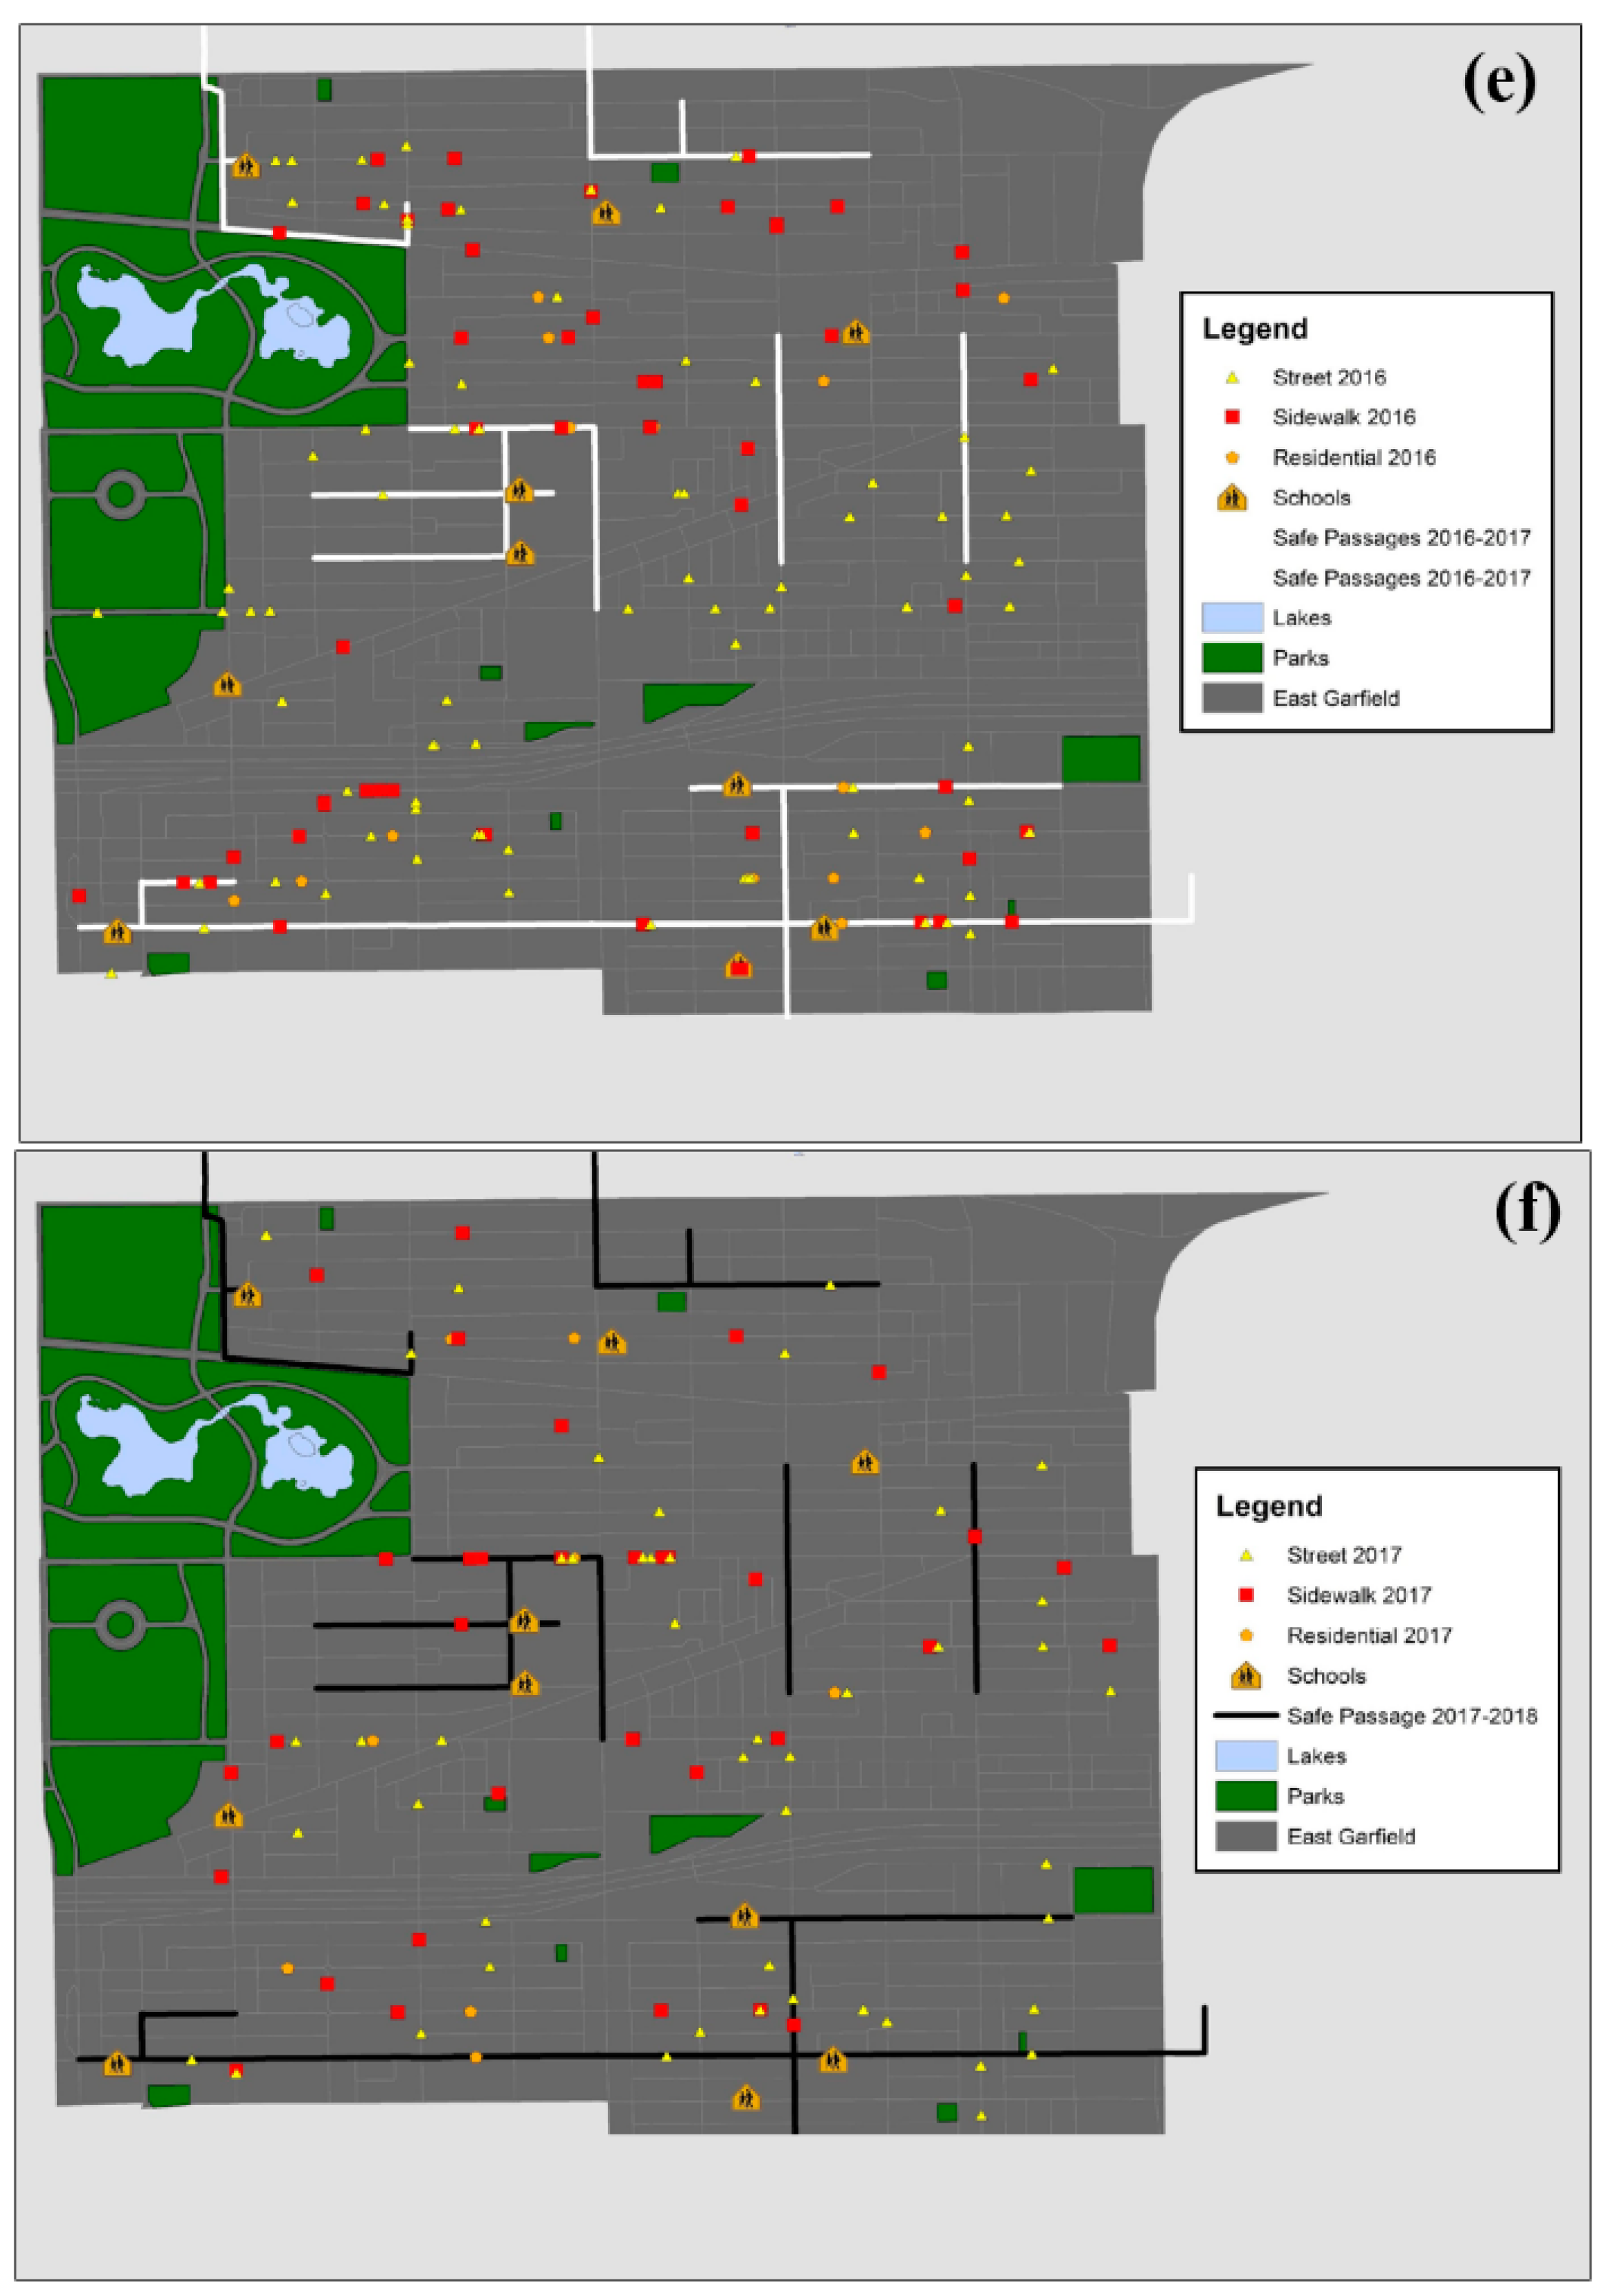
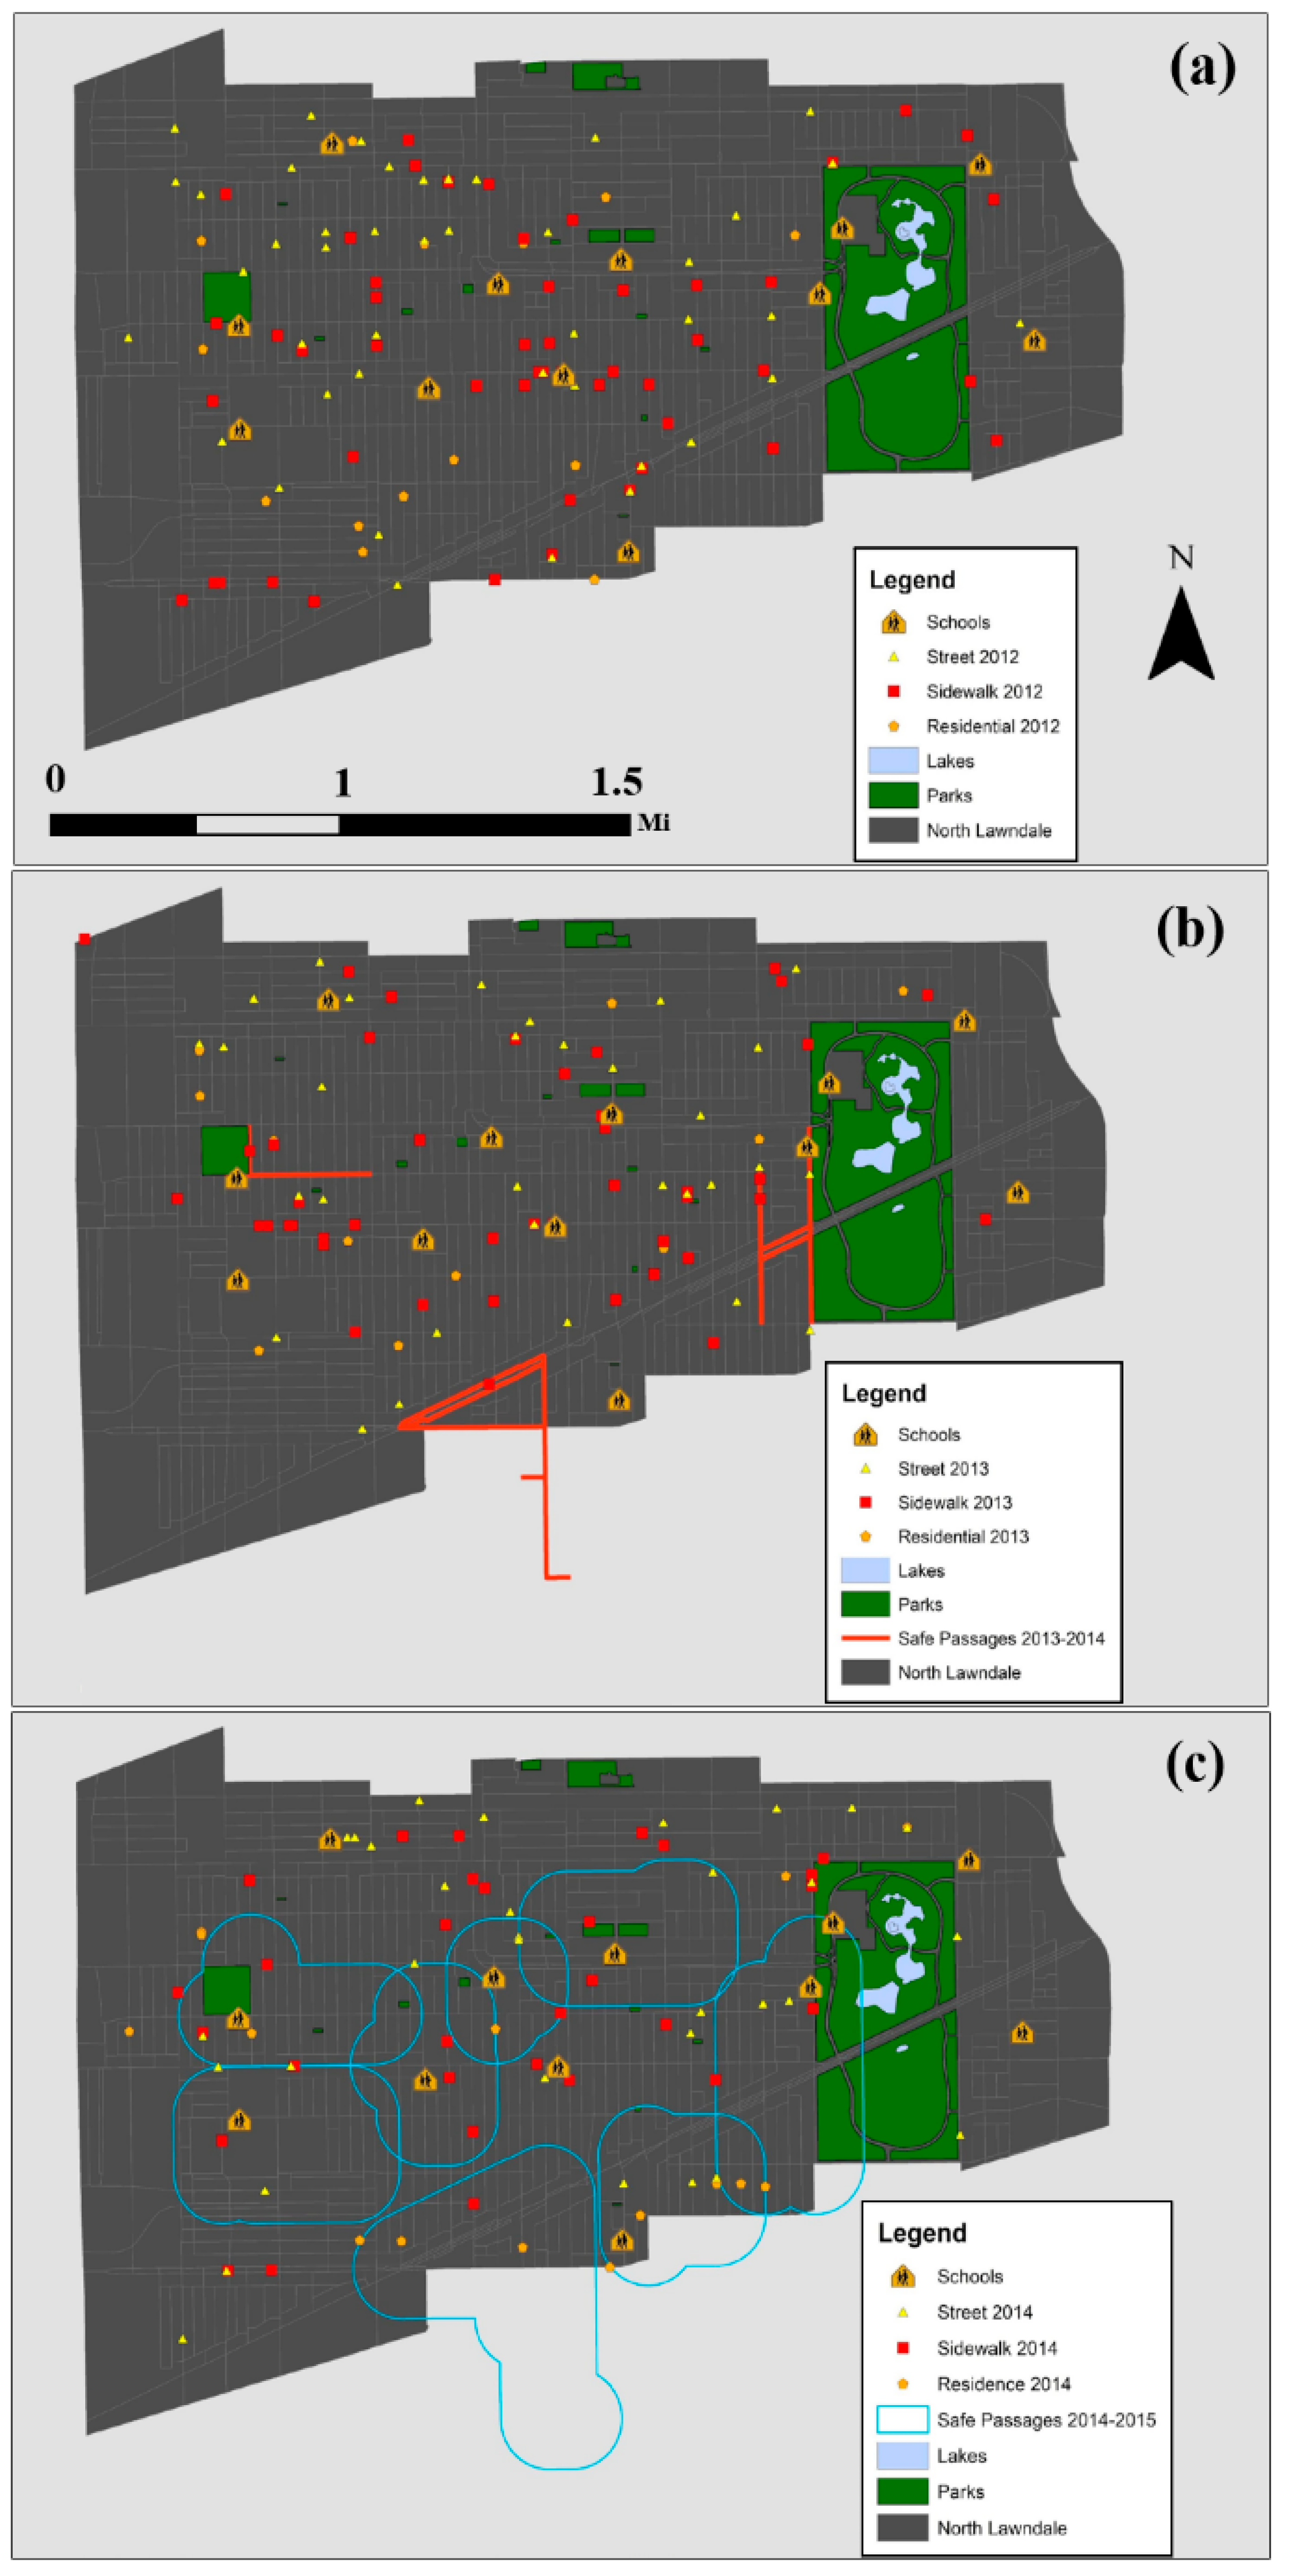
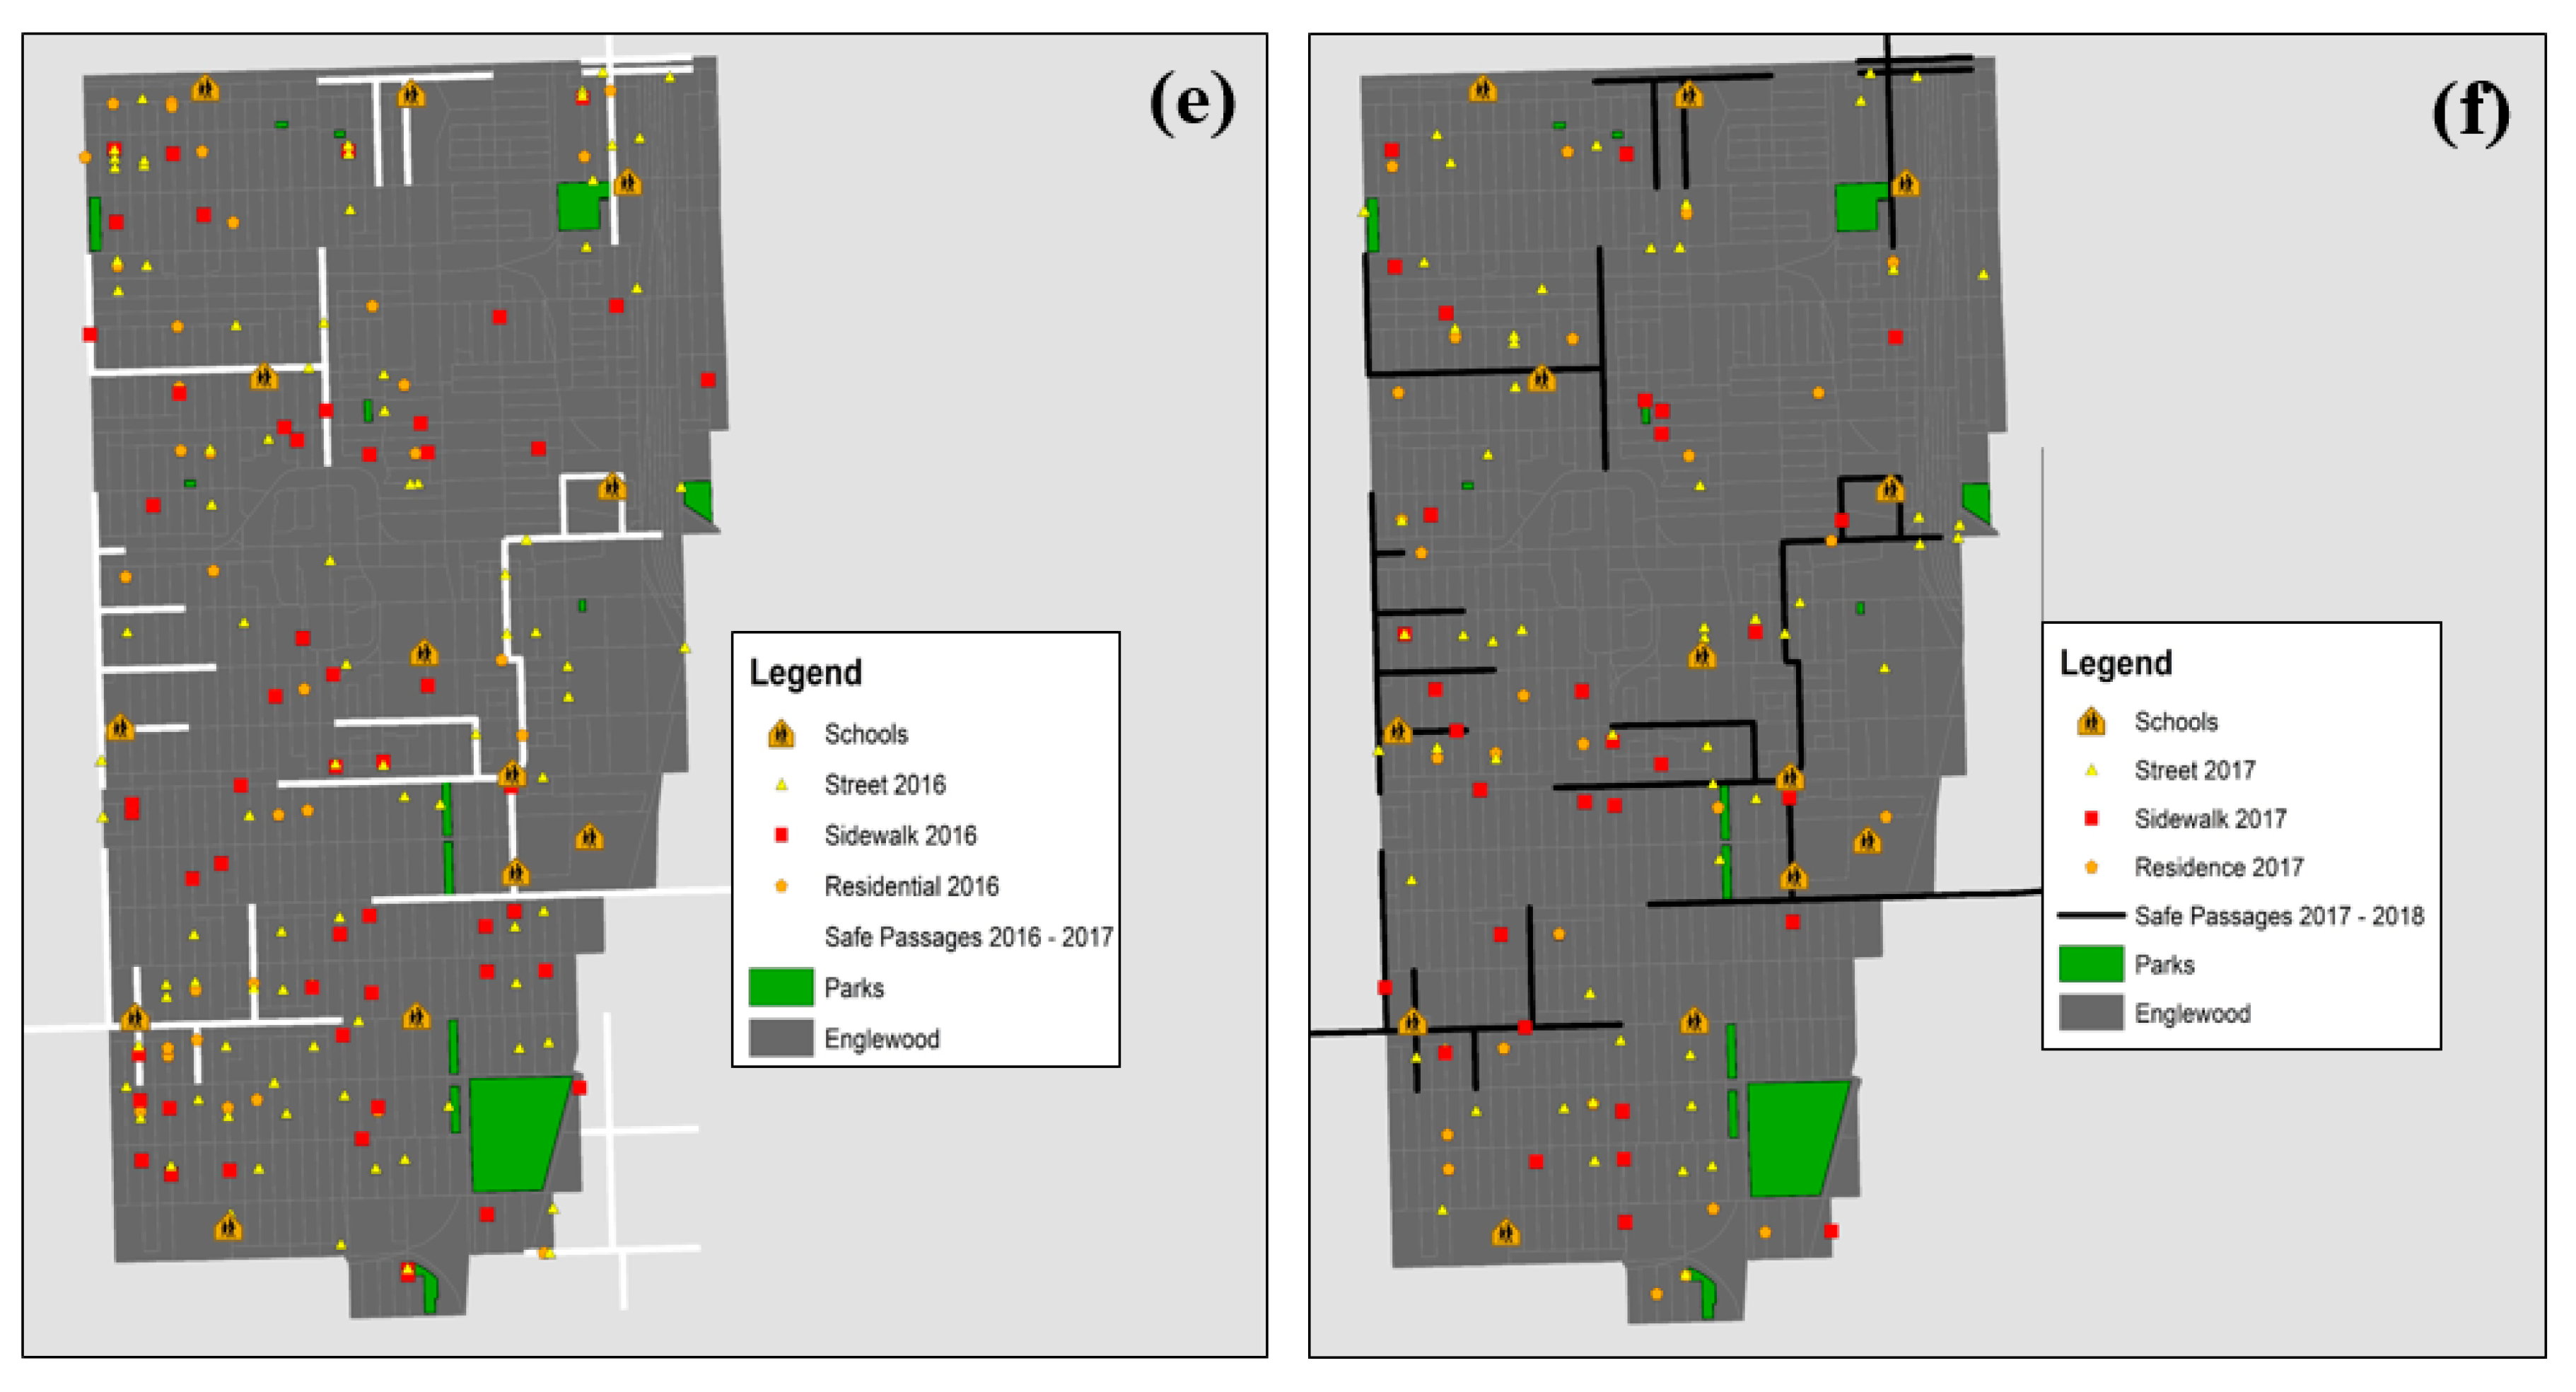
3.1. Safe Passage Routes and Gun-Related Incidents by Location

3.1.1. Safe Passage Routes

Table 1 shows the number of the safe passage routes in the four community areas from 2013 to 2017, as extracted from the raw data of the Chicago safe passage routes collected from the Chicago Data portal website [23]. As shown in Table 1, the numbers of safe passage routes have been slightly expanded over the past several years.

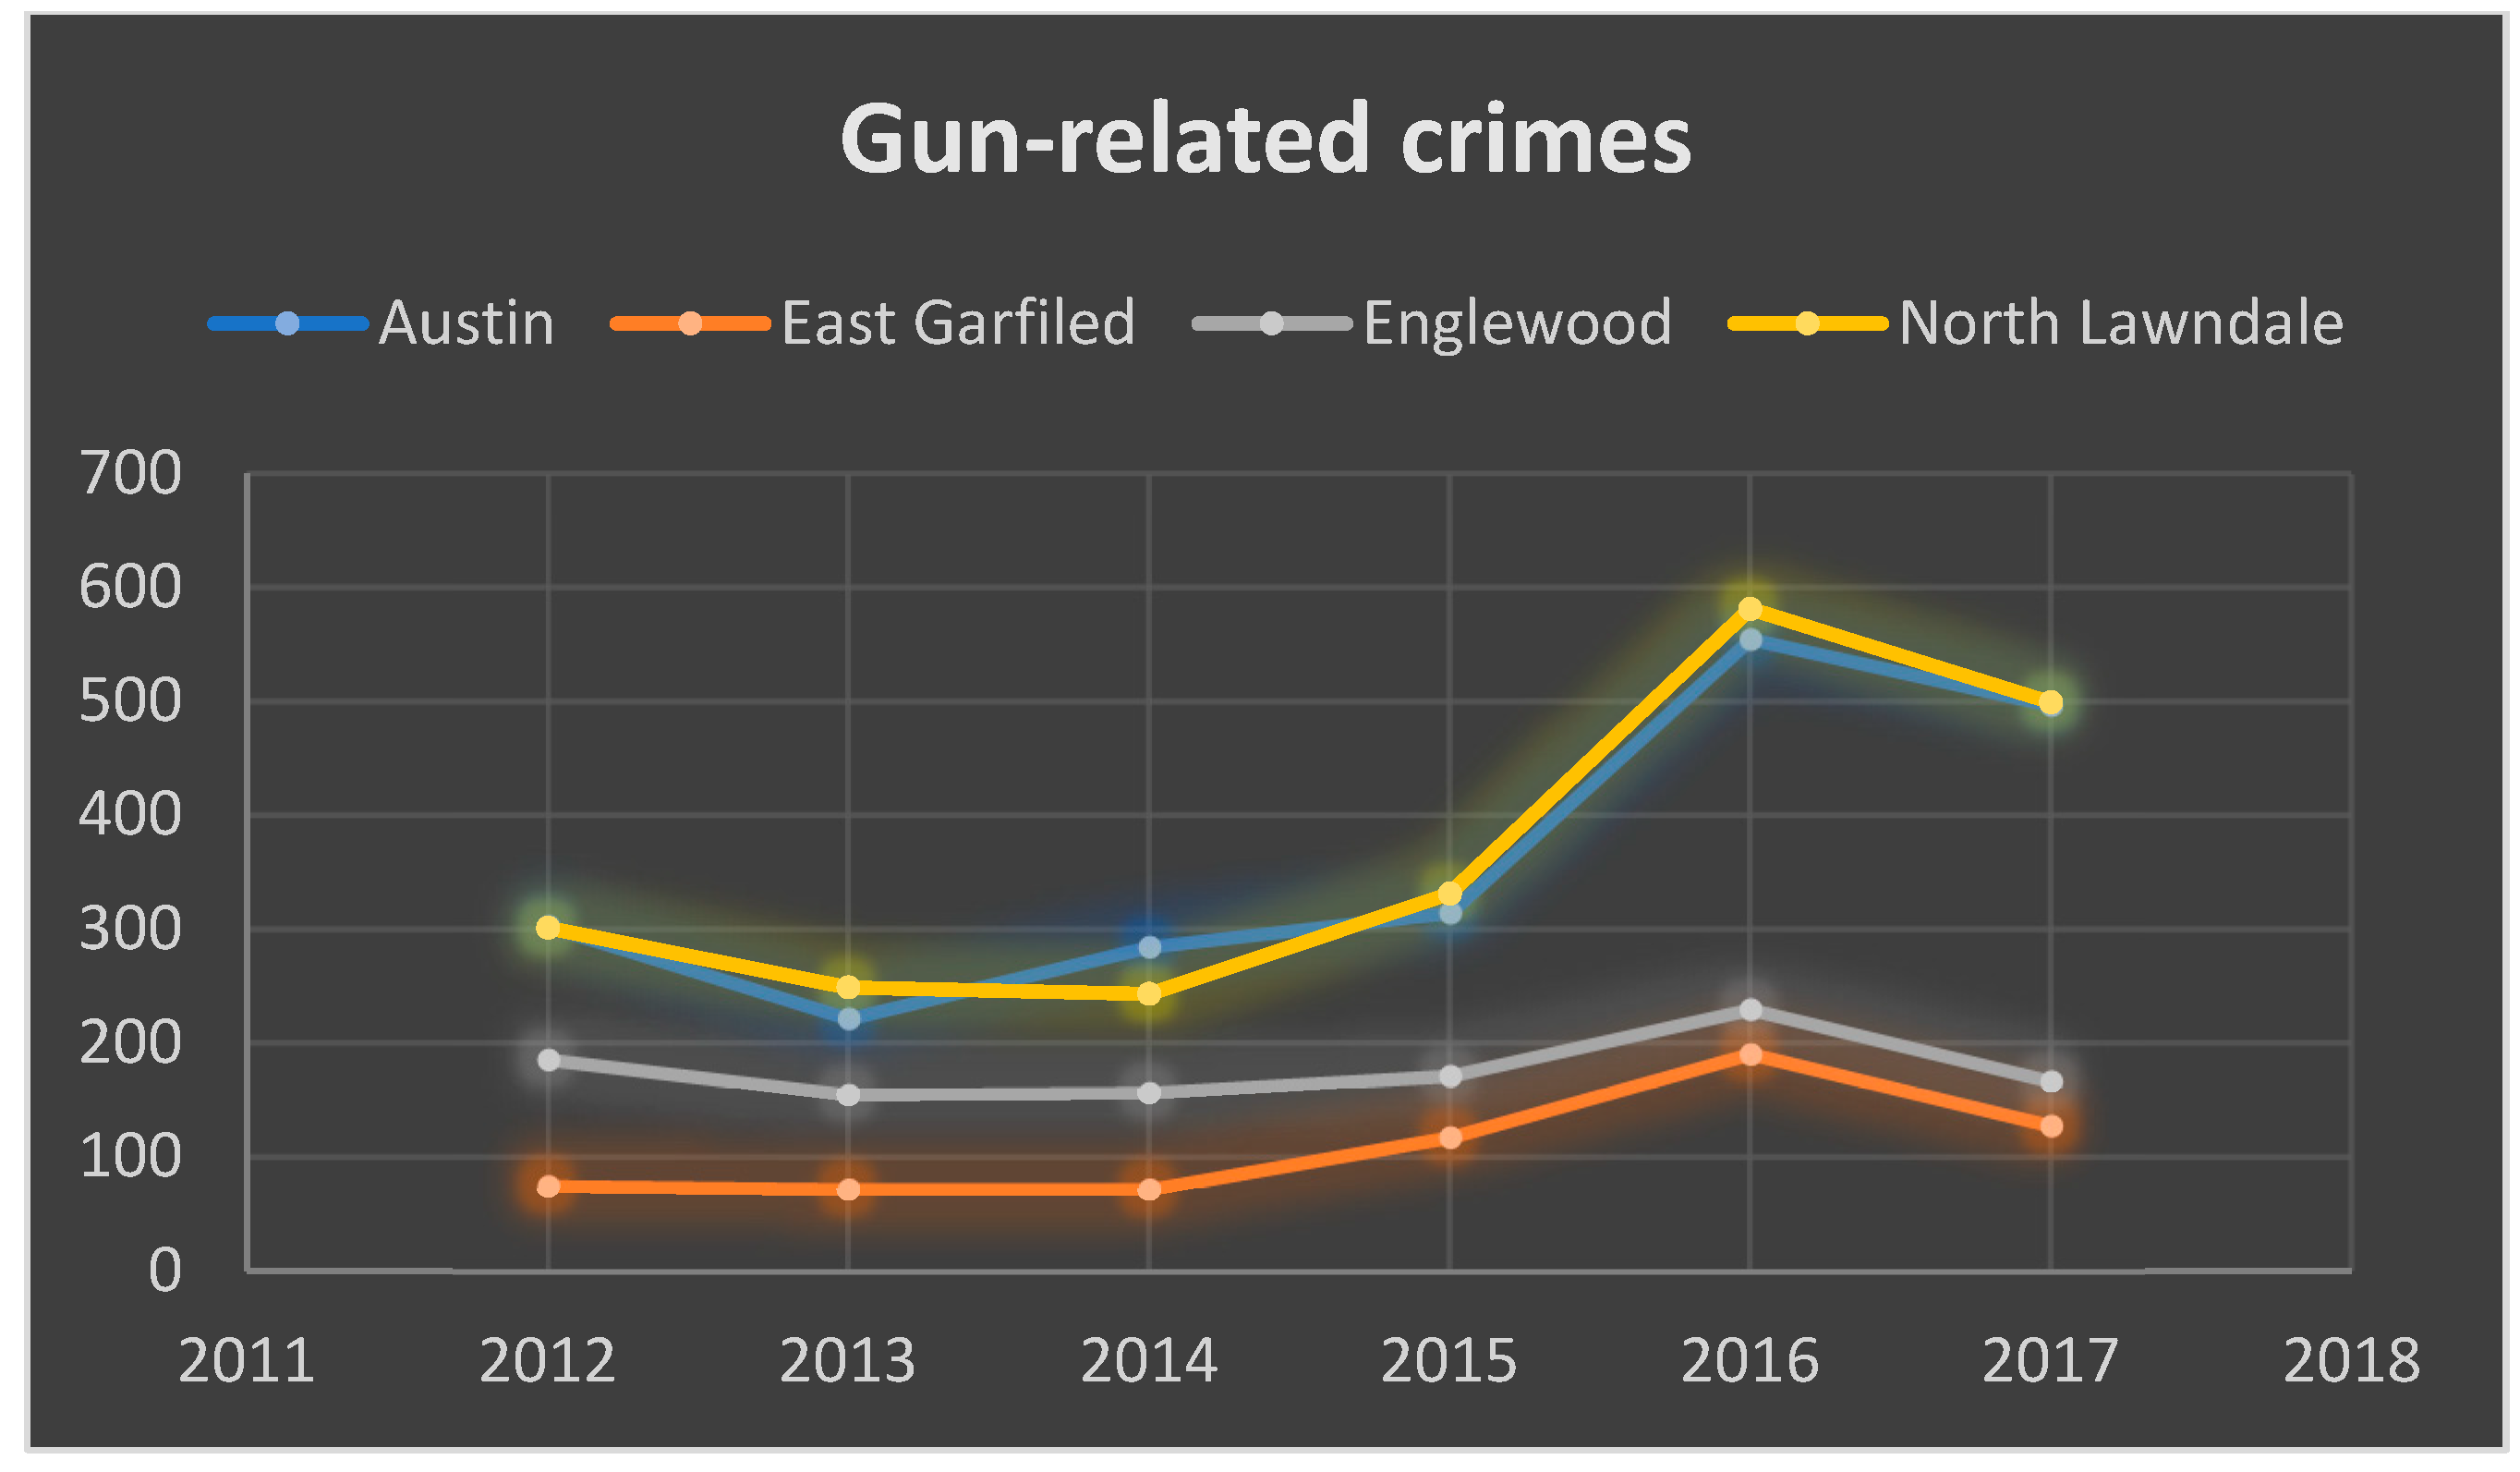
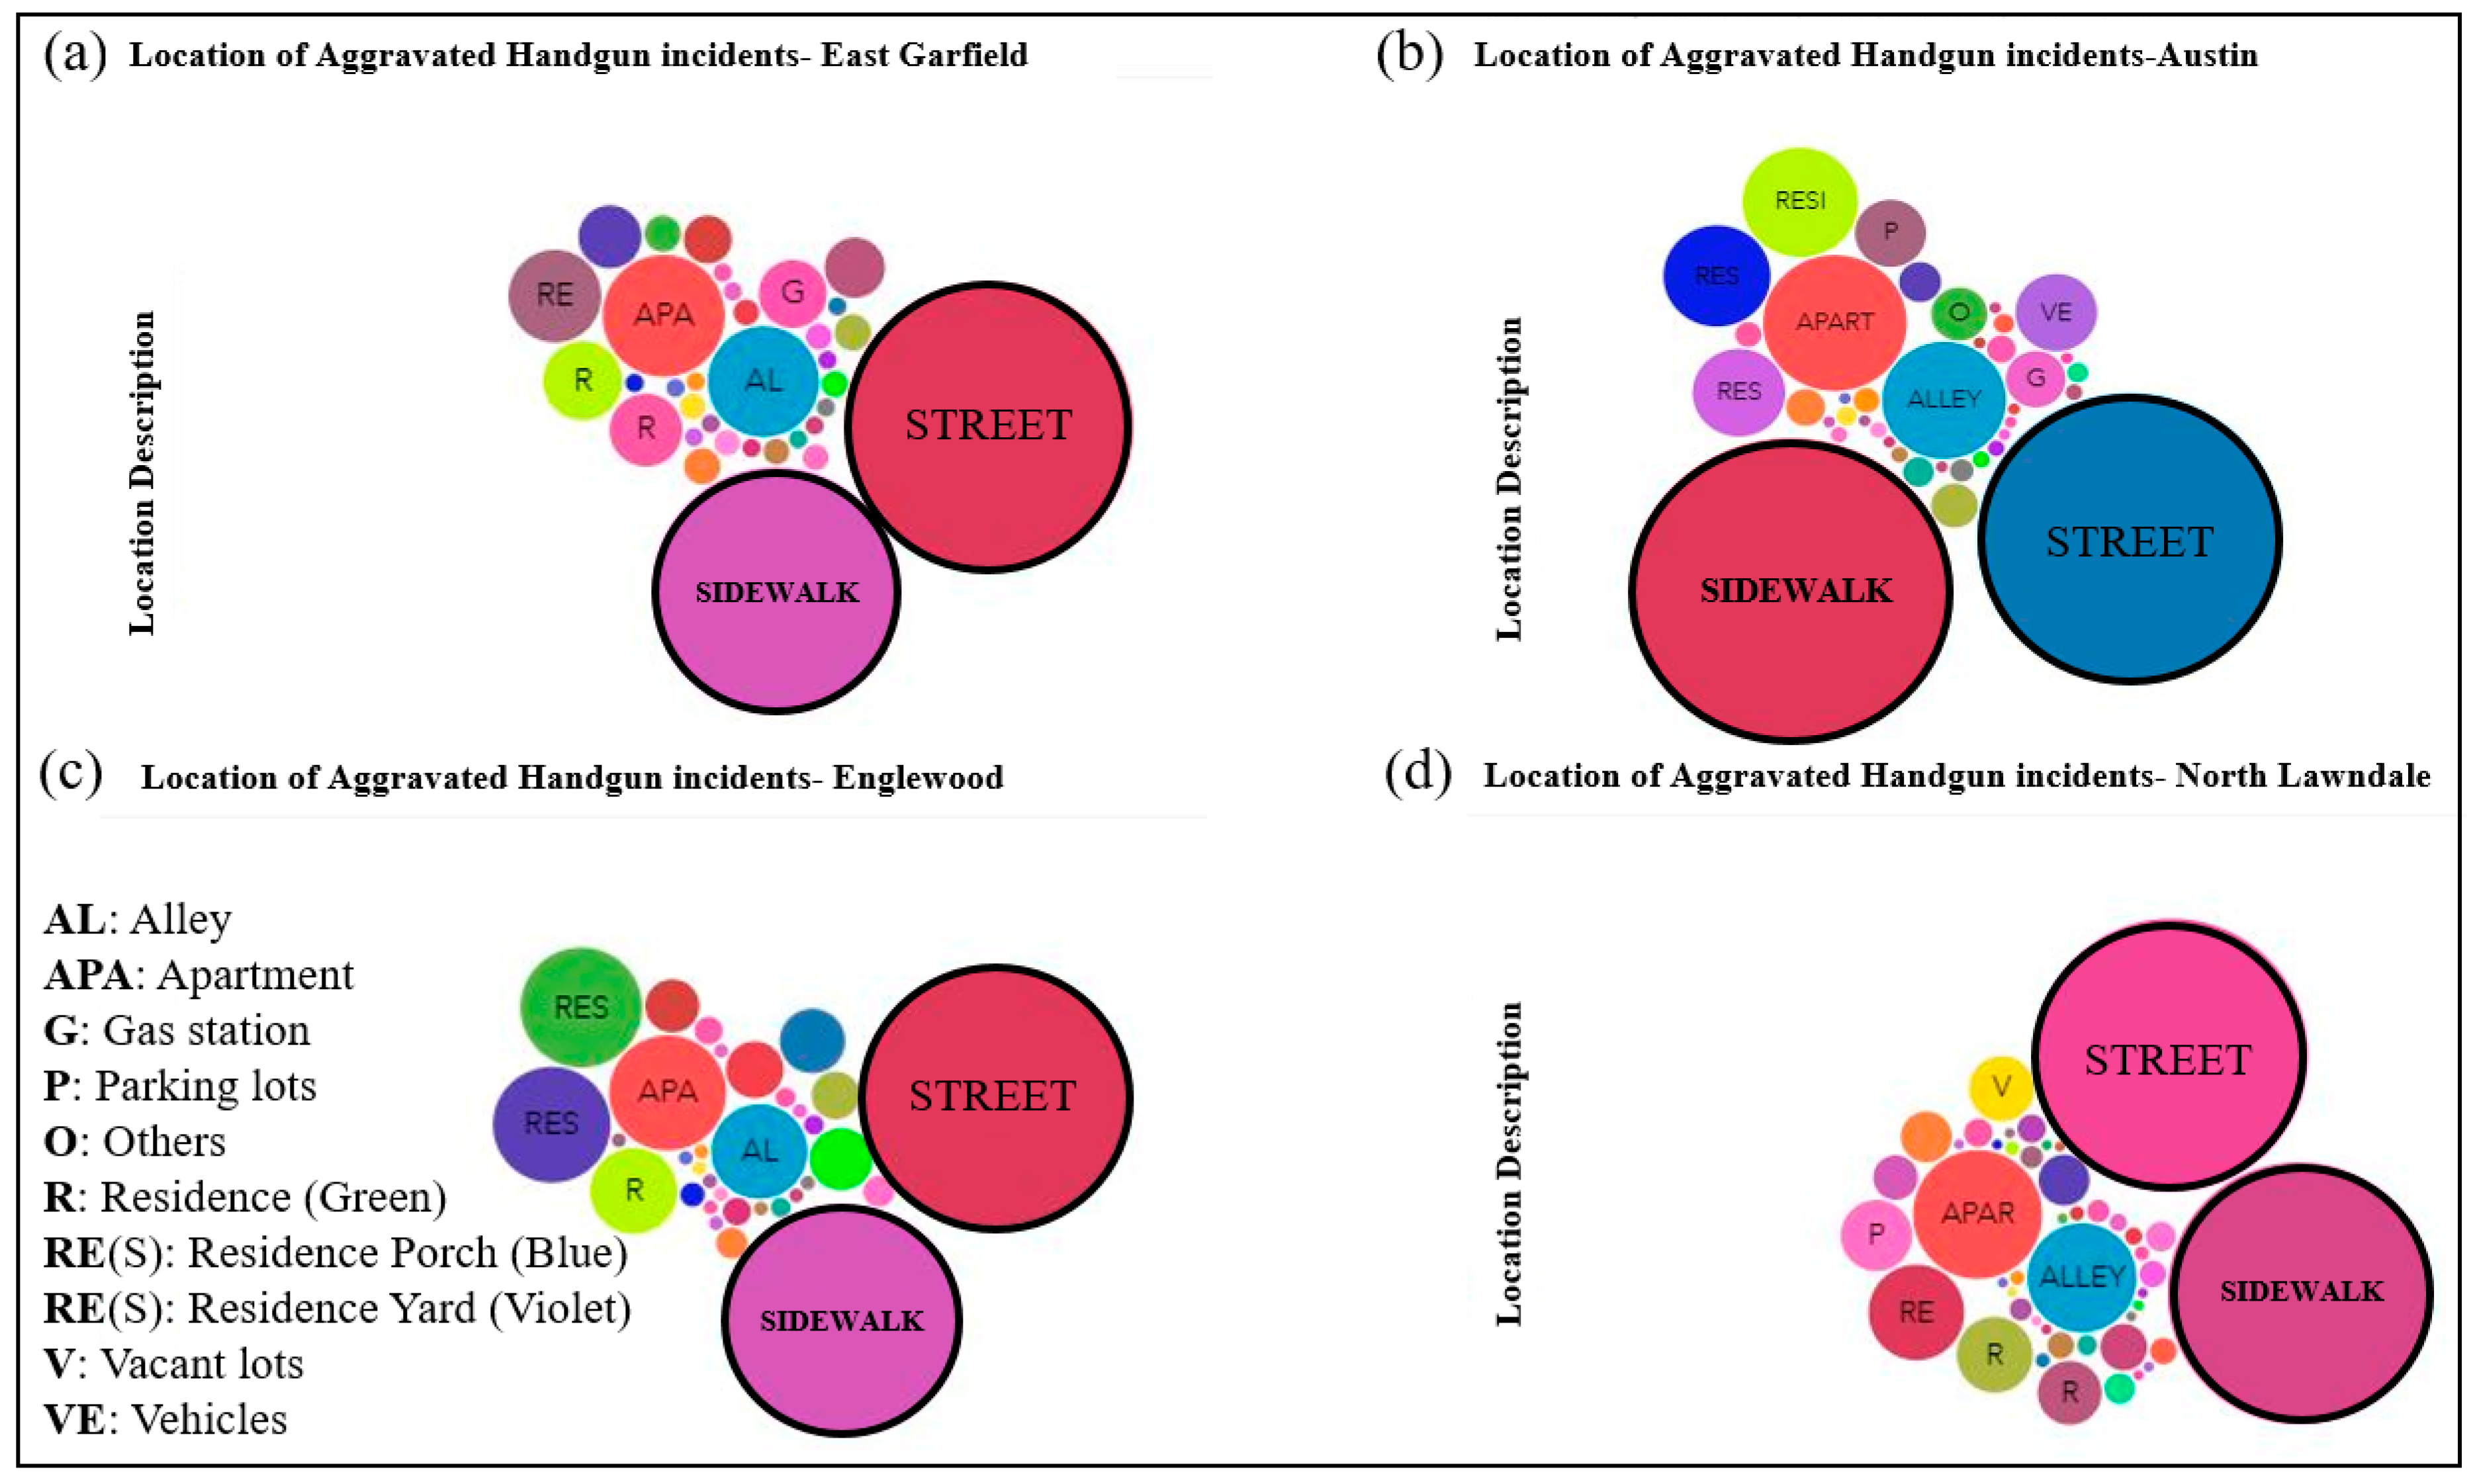
3.1.2. Gun-Related Incidents by Location

As illustrated in Figure 3, along with the increase in safe passage routes in the four community areas over the last six years, aggravated handgun incidents have also gradually increased. The number of gun-related crimes was particularly high in 2016. The total number of gun-related crimes in North Lawndale (Yellow line) and Austin (Blue line) during 2012–2017 exceeded 2000, whereas Englewood (Gray line) experienced over 890 incidents, and East Garfield (Orange line) was relatively safer than the other community areas because the total number of gun-related crimes in this area over the past six years was approximately 650 incidents. Thus, it appears that the increase in safe passage routes has not resulted in a decrease of crime incidents in the study area.
Figure 4 presents the number of gun-related incidents by location in the four community areas.
As illustrated in Figure 4, aggravated handgun incidents mainly occurred around streets and sidewalks, followed by residence, apartments, and alleys. A relatively low number of handgun incidents occurred near vacant lots, vehicles, and schools.

3.2. Spatially Visualizing Gun-Related Crimes and Safe Passage Routes

Figure 5, Figure 6, Figure 7 and Figure 8 show safe passage routes in the study area from 2012 (Figure 5a) to 2017 (Figure 5f), as well as the aggravated handgun incidents reported in the four community areas during that period. The safe passage routes in Figure 5c indicate buffer zones used to identify the schools that are along the safe passage routes. These buffer zones are created by 0.5-mile walkable distance. The data reflect incidents in which police responded and completed case reports. The symbols on the maps reflect the occurrence of aggravated handgun incidents according to location: Red color indicates sidewalks; yellow denotes streets; orange represents incidents in residential areas; and green denotes parks in the four community areas.
As of 2017, safe passage routes in the Austin community area are built near approximately ten schools (Figure 5f). The safe passage routes have been expanded to north and east over the last six years. Three routes were established in 2013 near the Frederick Douglass and Edward K. Duke Ellington elementary schools, Austin College and Career Academy High School, and George Leland Elementary School.
Figure 6 shows the safe passage routes in East Garfield. In 2013, five routes were established in the East Garfield community area to the Faraday Elementary School, Marshall Metropolitan High School, Jacob Beidler Elementary School, Willa Cather Elementary School, Jensen Elementary Scholastic Academy, Bethune Elementary School, and Manley Career Academy High Schools. By 2018, three routes were expanded near Al Raby High school, Faraday Elementary School, and Marshall Metropolitan High School.
Figure 7 illustrates the safe passage routes. In North Lawndale, three routes were established near Johnson School of Excellence, Hughes Elementary School, and Historic U.S. 66 and W Cermak Rd in 2013. As of 2018, seven more routes have been added near Smith School, KIPP Ascend Middle School, Roswell B Mason School, and Chicago West Side Christian School.
Figure 8 shows the safe passage routes in Englewood. Four routes were initially established near Holmes and Paul Roberson High Schools. Later, six more routes were added such that the routes now encompass nearly all of the schools in the community area.

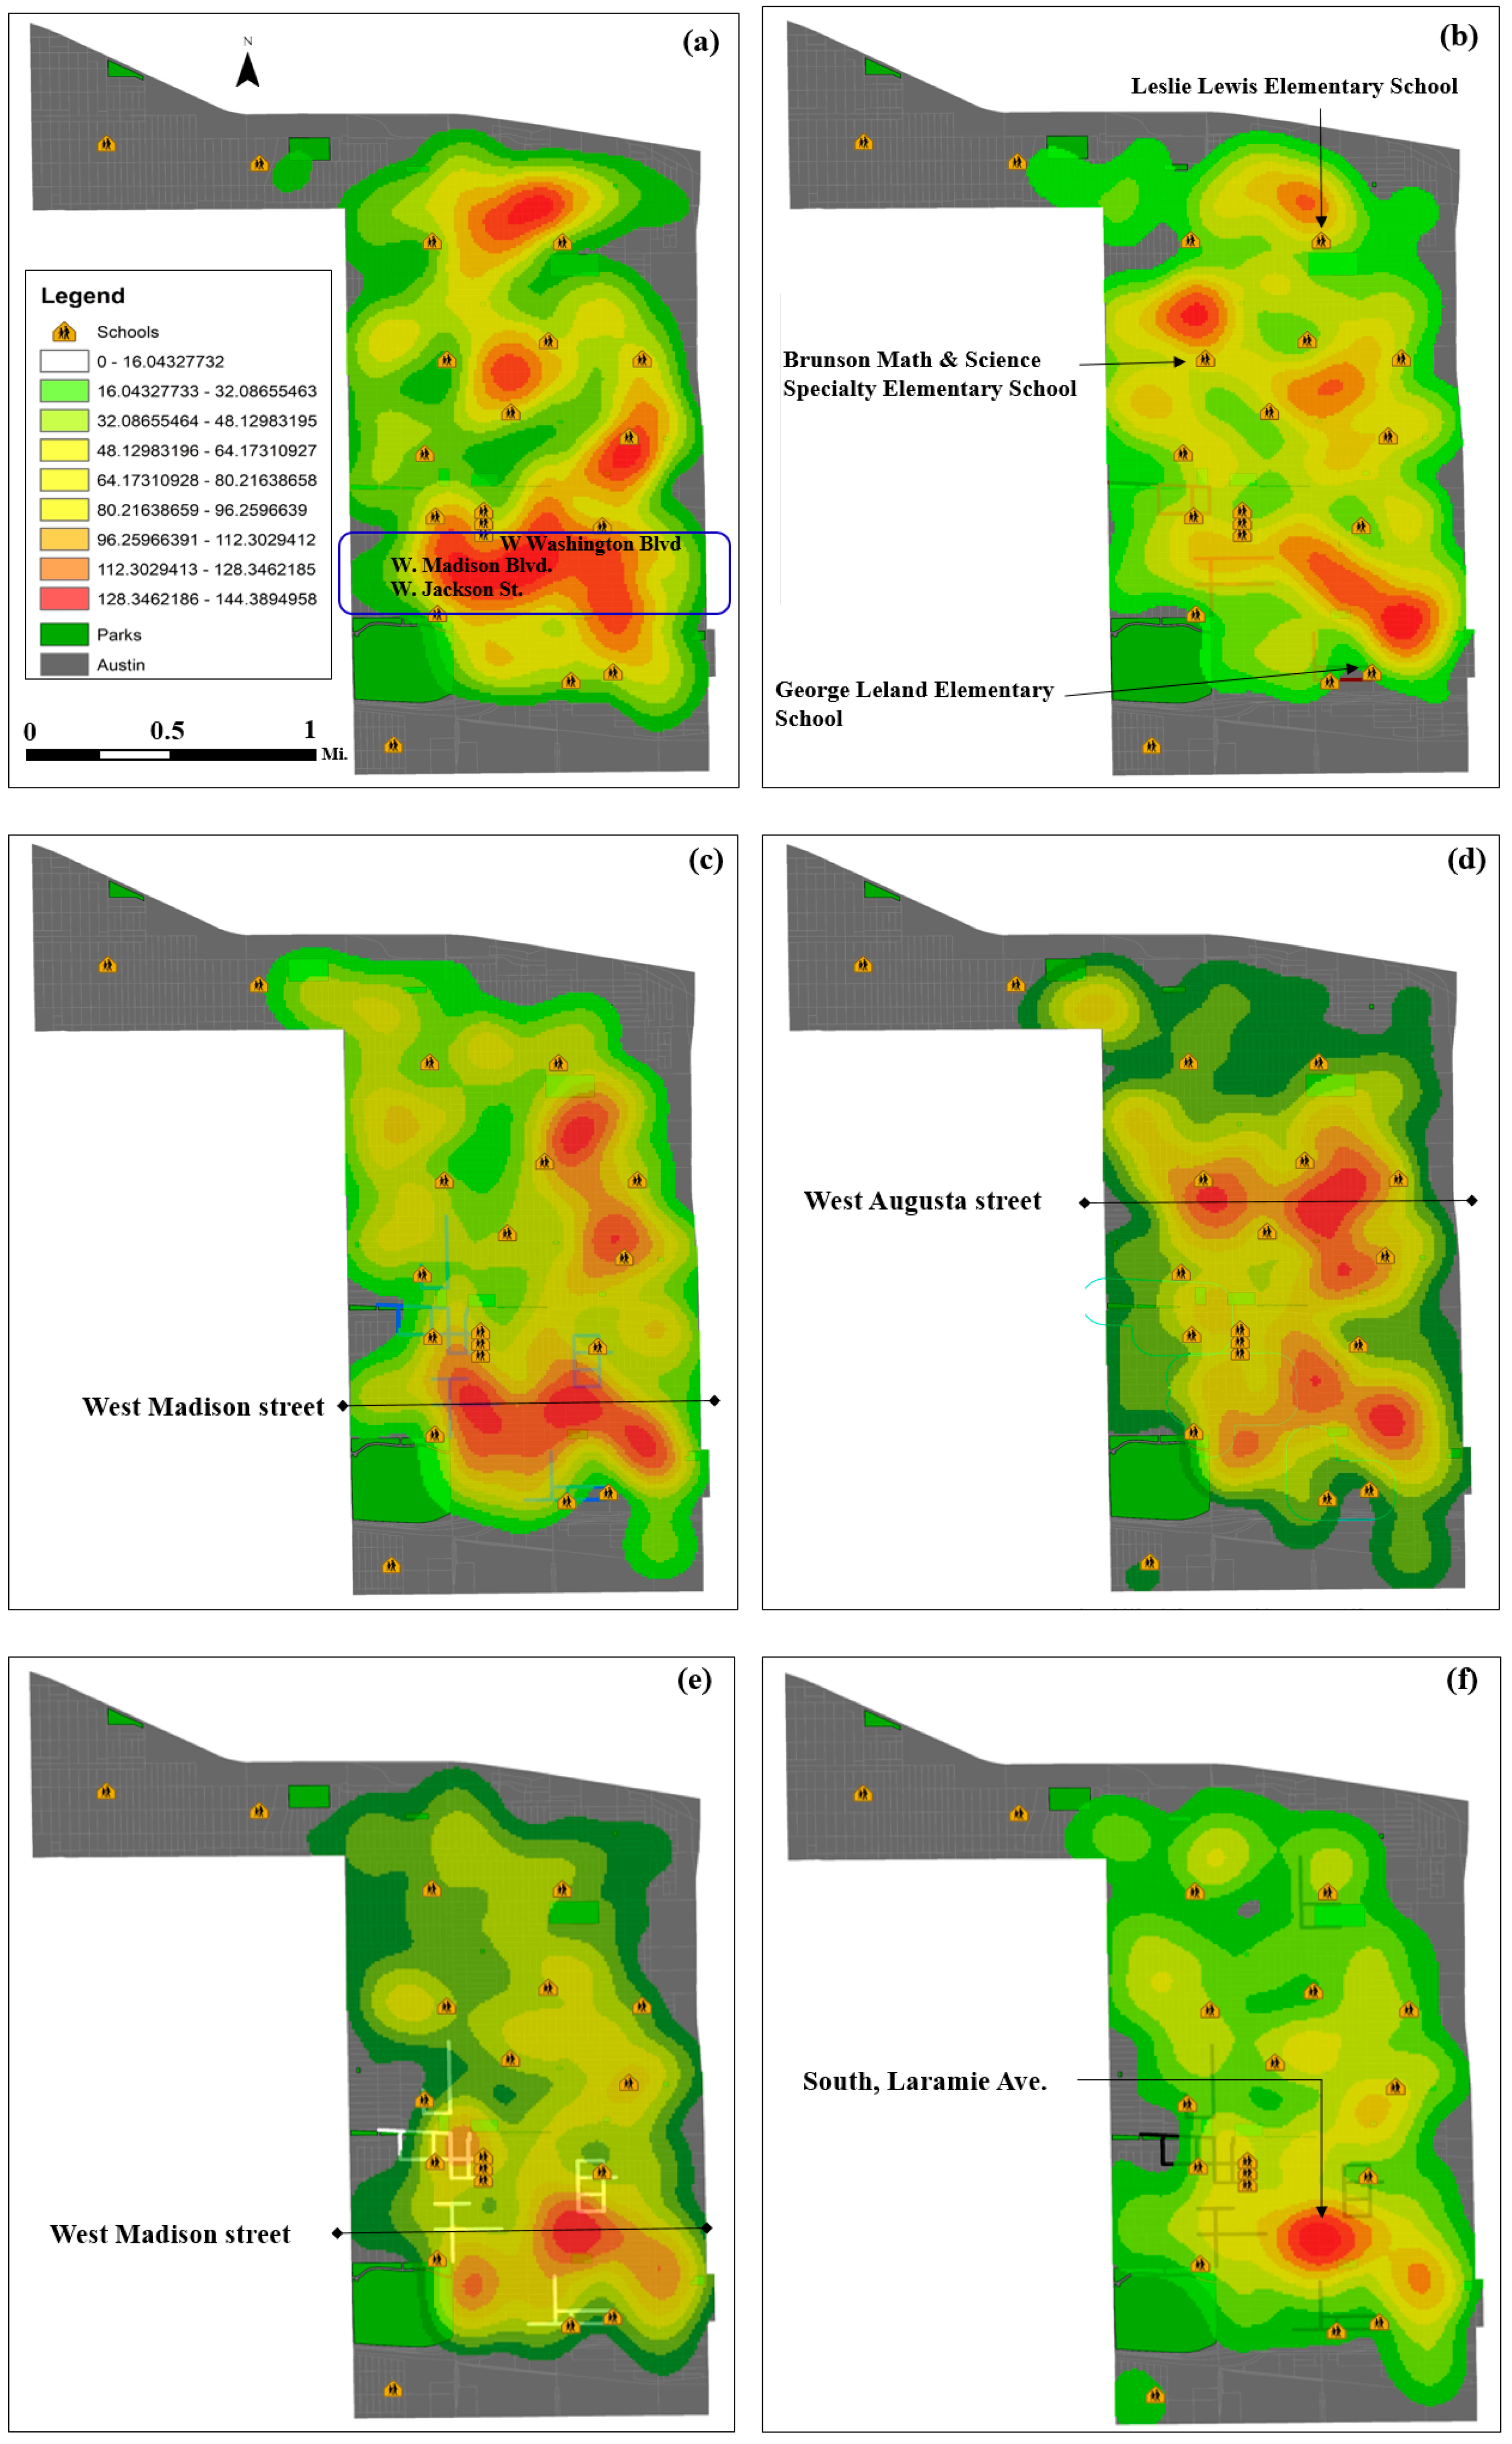
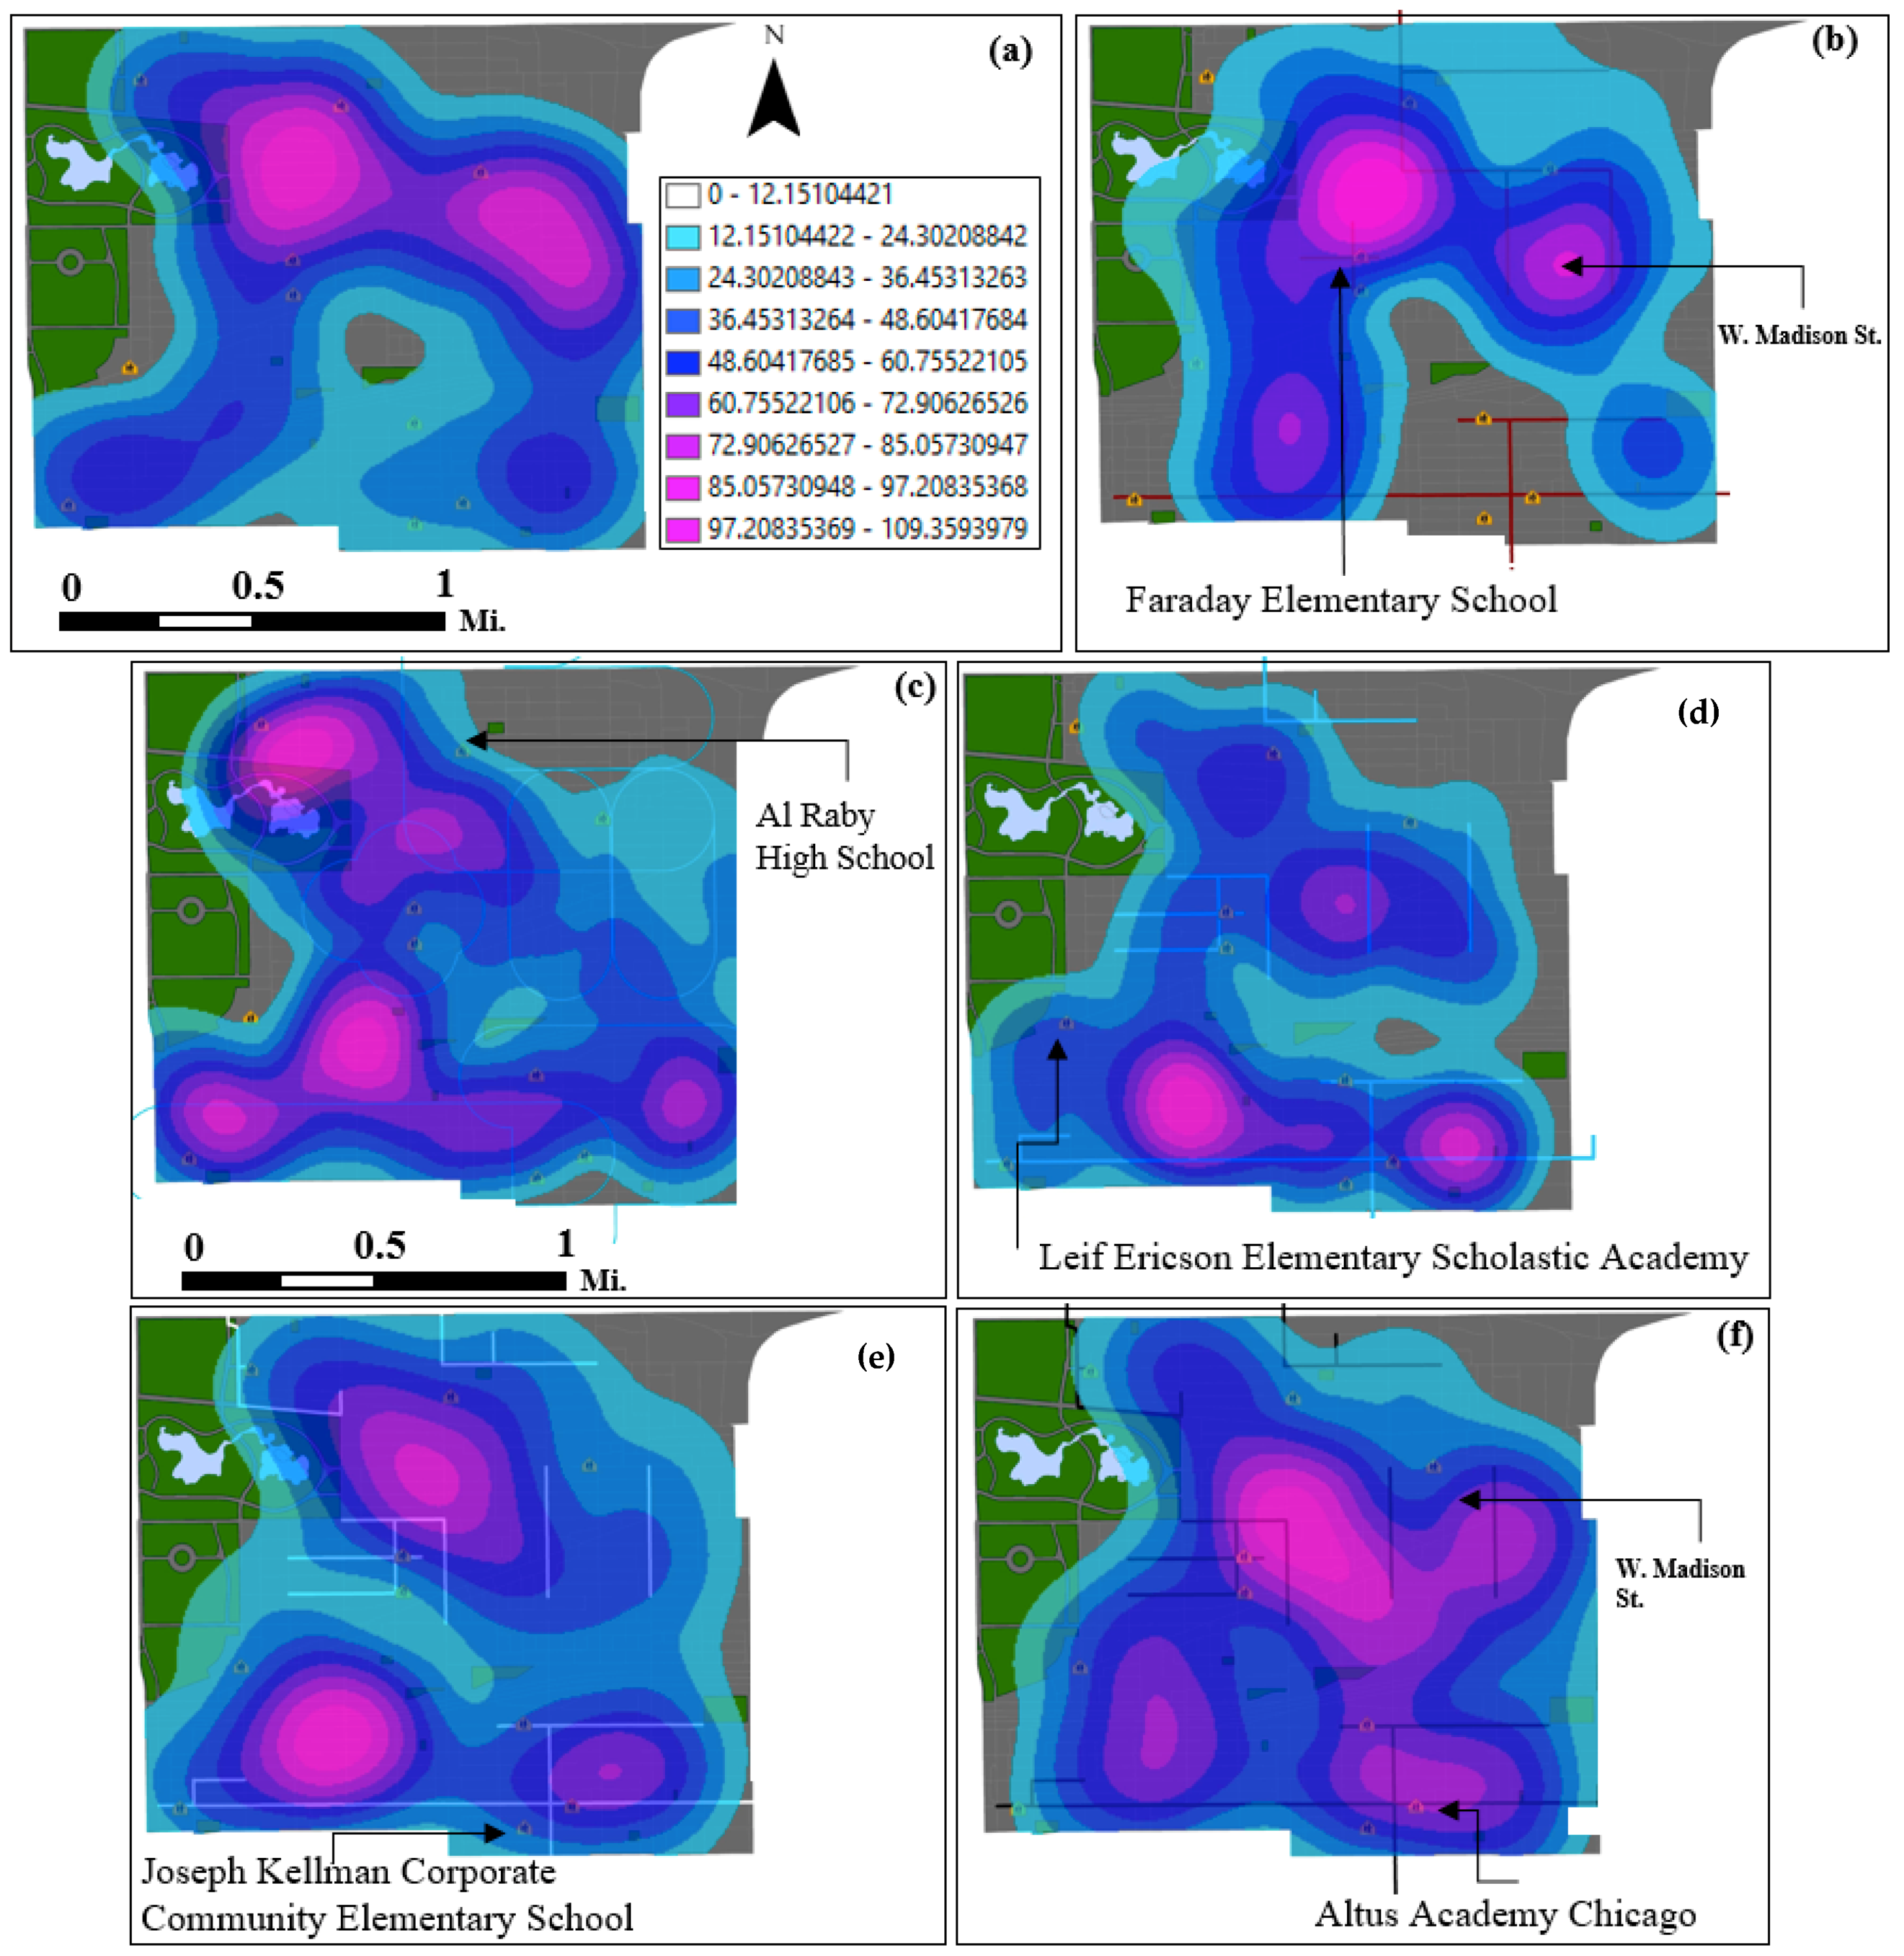
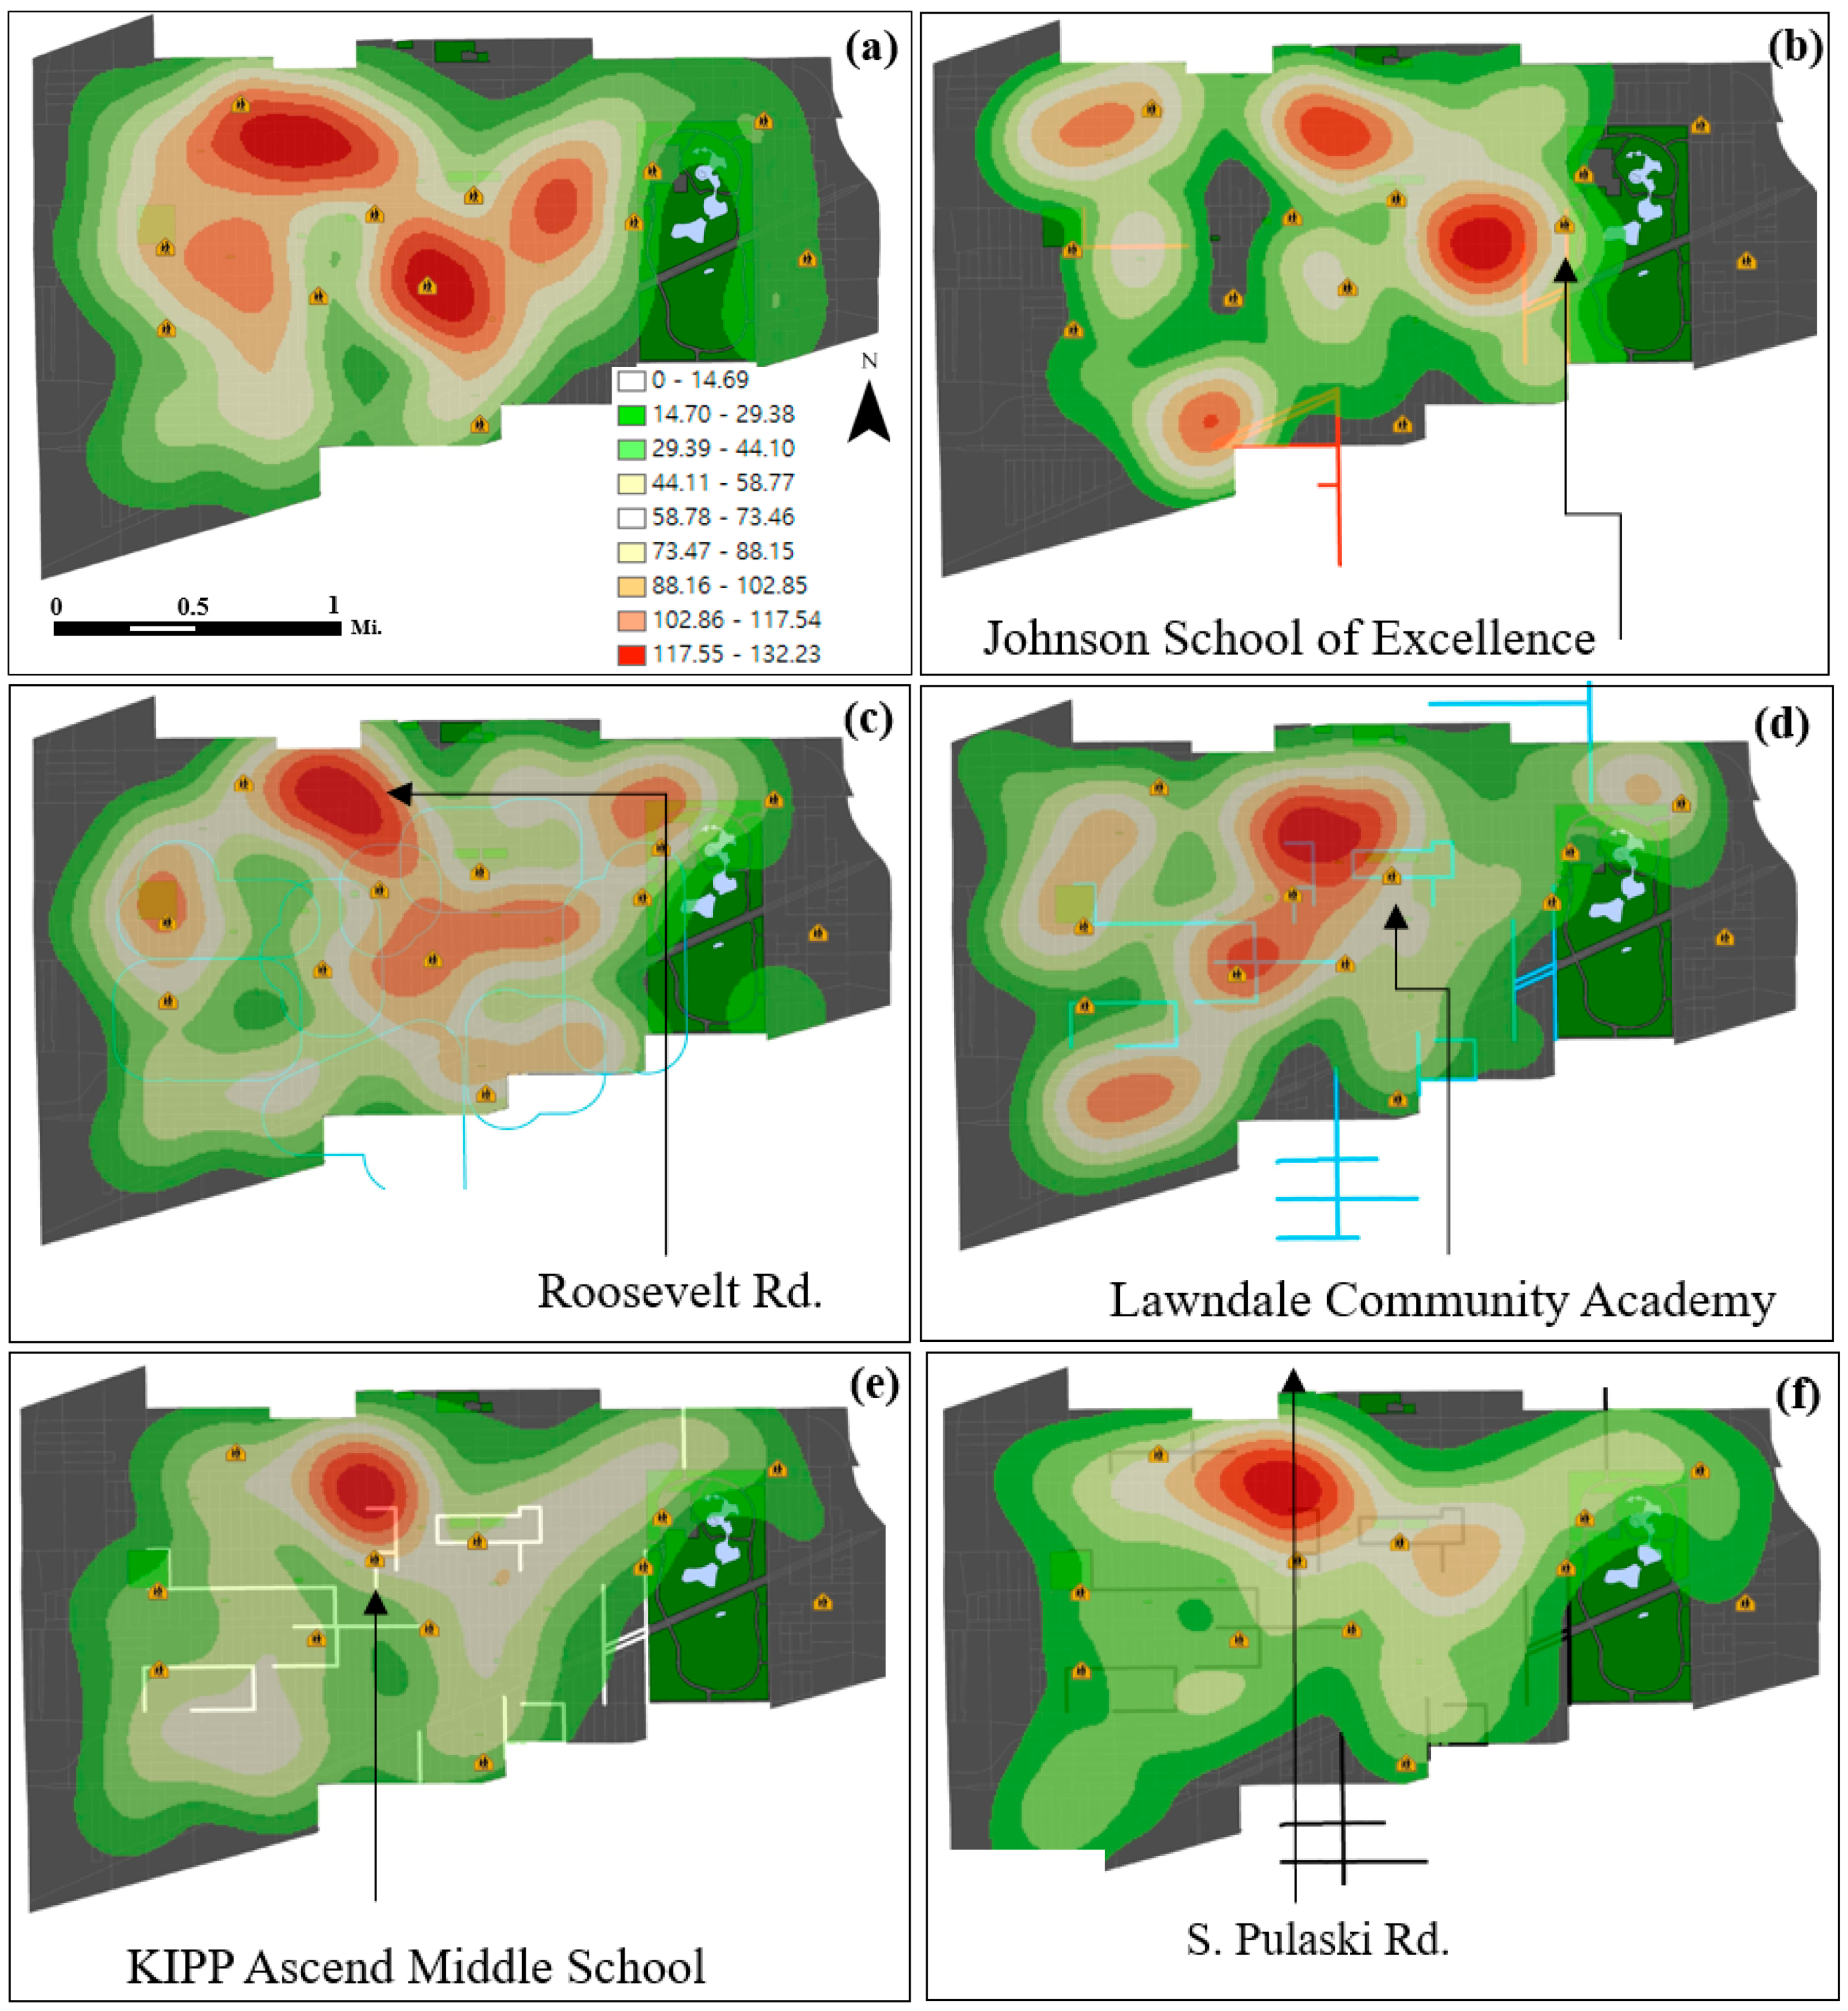
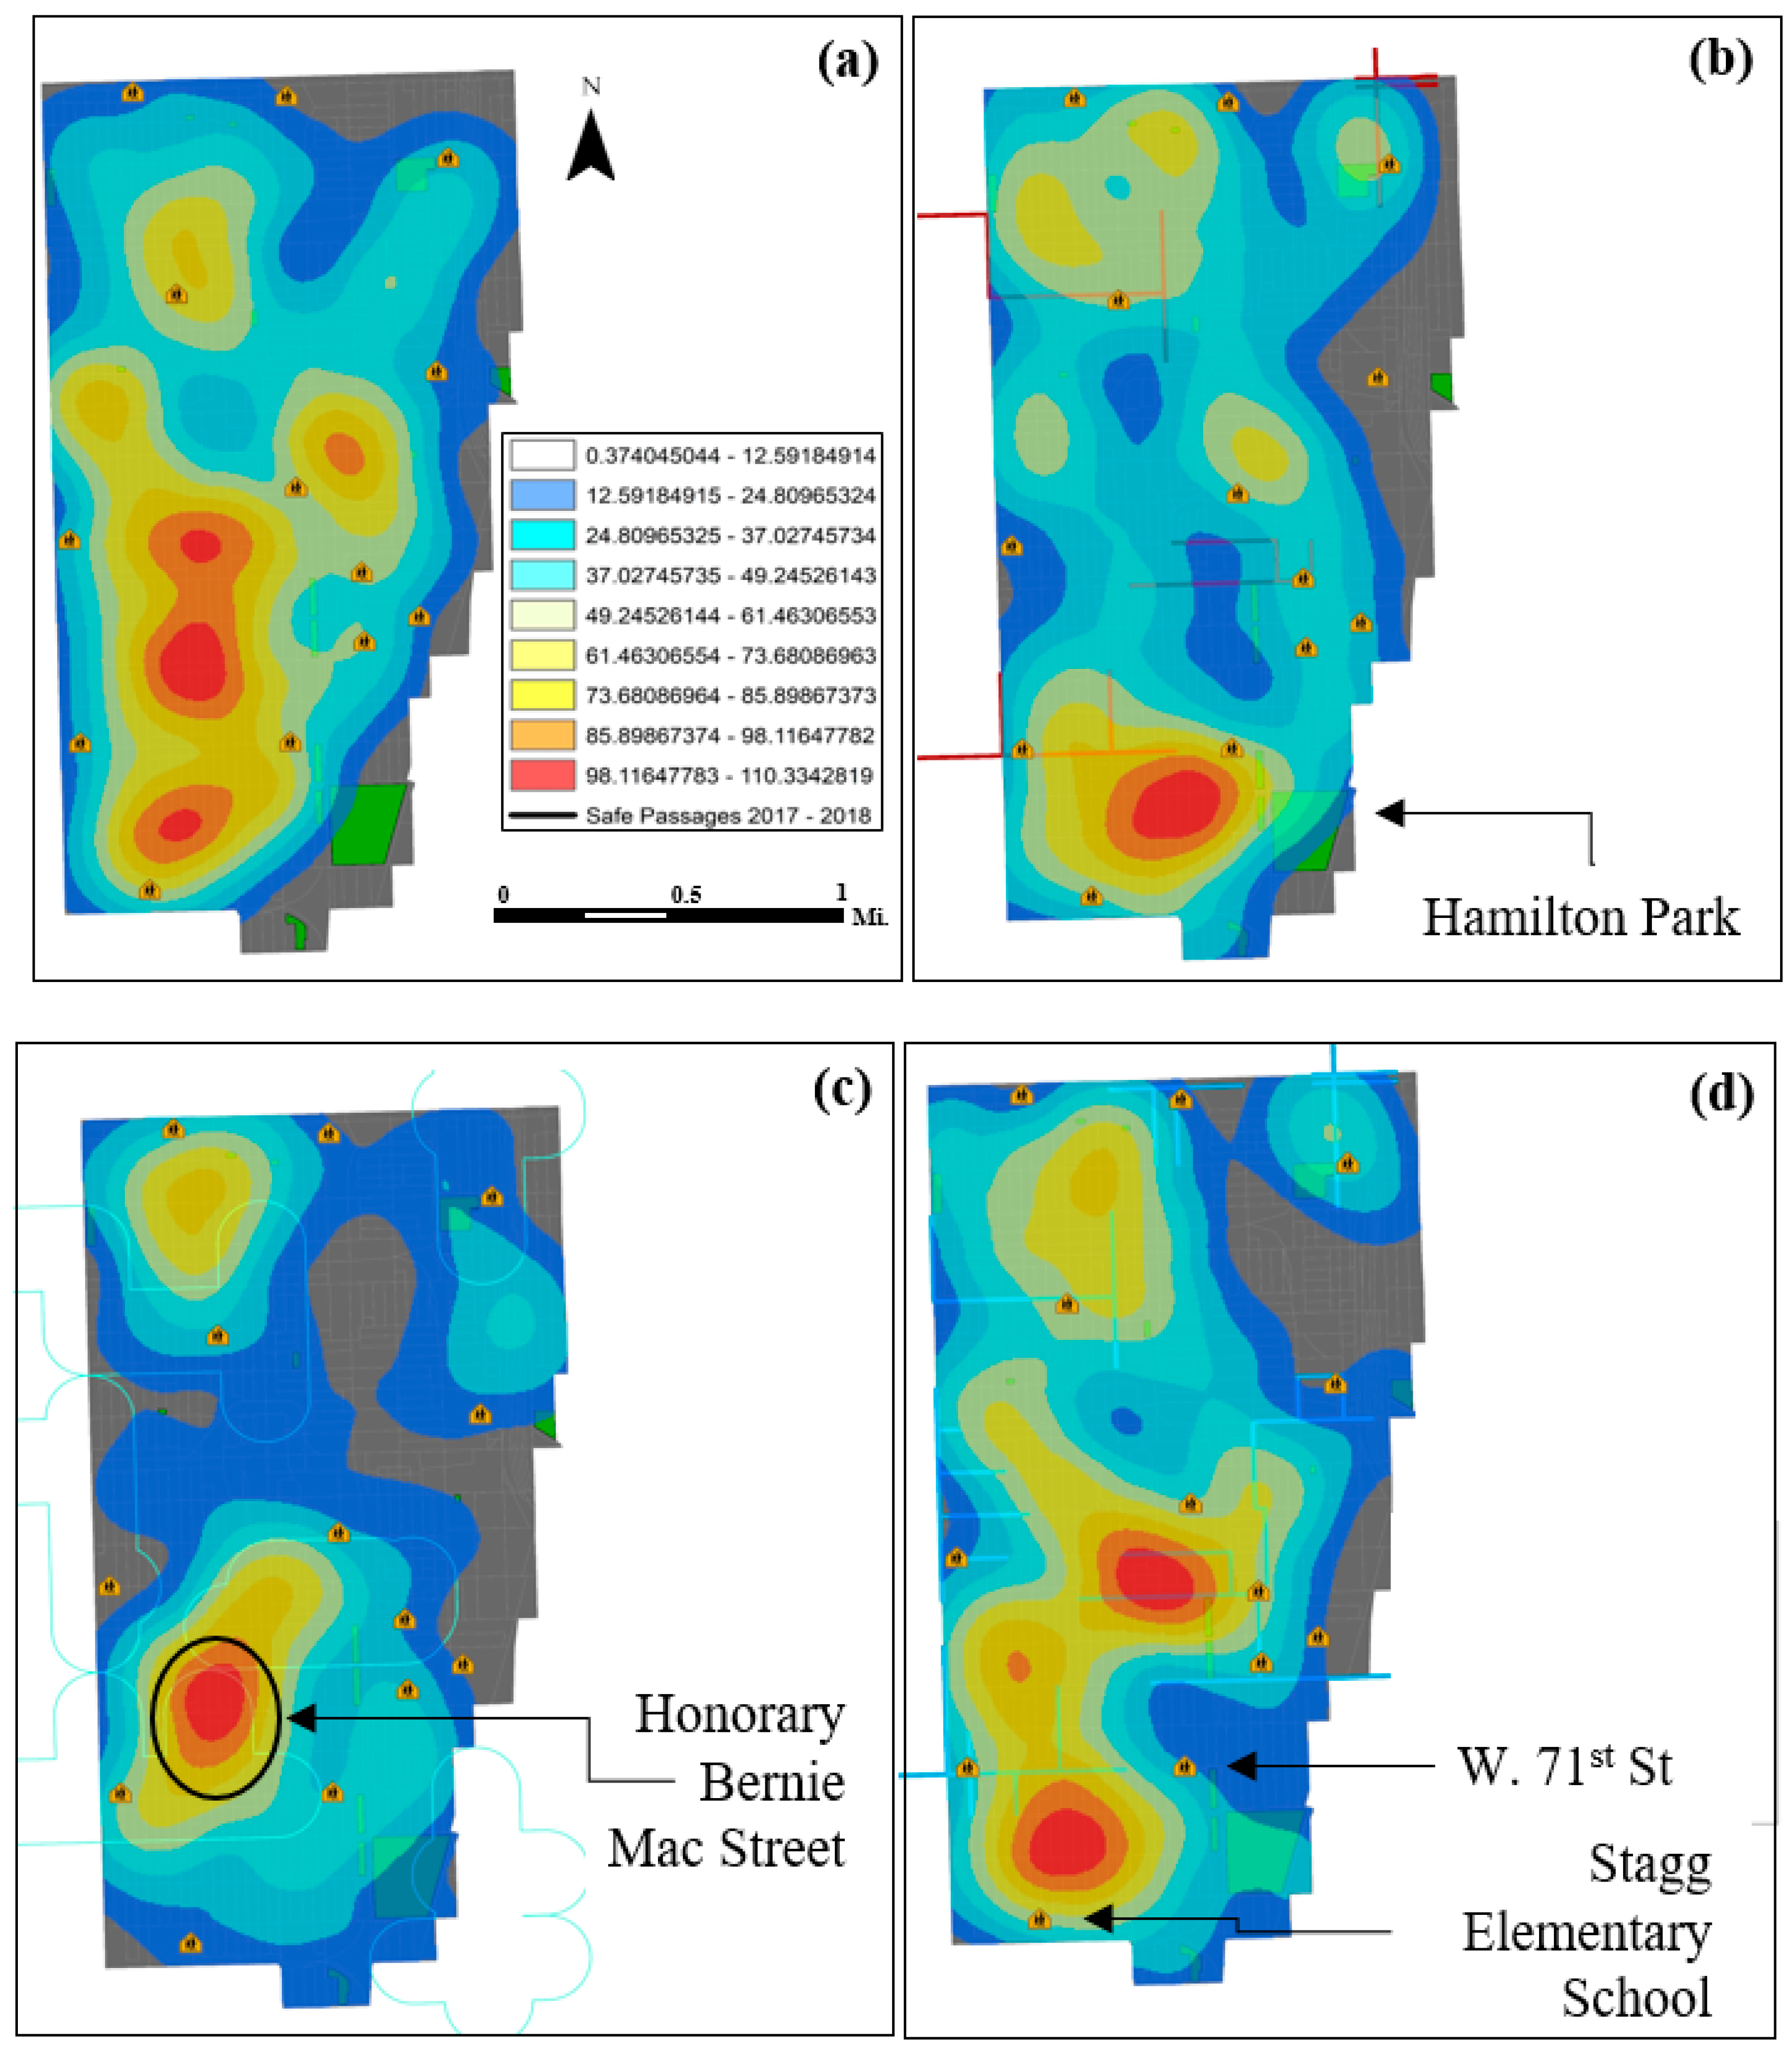
3.3. Density Mapping

This study analyzed Kernel density estimation to investigate patterns of gun-related crime in the four community areas. The Kernel density maps display the highest number of aggravated handgun incidents reported in each area, and each map represents a different year from 2012 to 2017. Dark red represents areas with an intense clustering of the highest number of the aggravated handgun incidents in the area. The Kernel density layer was integrated with data regarding public school locations and safe passage routes.
As shown in Figure 9, Austin has seen a noticeable change in aggravated handgun assault incidents from 2012 to 2017. The year 2012 was characterized by an intense, yet sporadic clustering of crimes; however, the pattern of gun-related crimes has shifted since the establishment of the safe passage routes. With the exceptions of 2014 and 2015 (Figure 9c,d), the number of crimes has decreased near the routes; however, high values have remained steady in the areas surrounding W Madison St., W Jackson Blvd, and W Washington Blvd (in the blue box in Figure 1).
As shown in Figure 10, East Garfield did not experience remarkable changes over the last five years. The clusters (with ticker violet color) have been randomly distributed in the entire area regardless of the construction of safe passage routes. The clusters have been estimated on the basis of the current locations of gun-related crimes. That being said, over the last five years, as the safe passage routes have been constructed, the general patterns of the areas with high density have been more expanded. This implies that the construction of safe passage routes has not influenced the decrease in crime incidents.
As demonstrated in Figure 11, the Kernel density changed once the safe passage routes were expanded in North Lawndale, such that the dark red areas representing high values decreased from 2013 to 2014; however, the areas between Roosevelt Rd. and S. Independence Blvd. have persistently experienced a high number of gun-related crimes.
As shown in Figure 12, with the exception of 2017, the dense areas denoting high values have largely decreased since the establishment of the safe passage routes in Englewood. As stated in Section 2.3, Kernel density is one of the most common techniques in crime mapping; however, it can only briefly map where high-density areas may appear. The appearance of Kernel density surfaces depends on the choice of the Kernel bandwidth and the output cell size. Thus, observing the Kernel density data depicted in Figure 9, Figure 10, Figure 11 and Figure 12 does not provide sufficient information to determine if the construction of the safe passage routes can be attributed for the changes in crime patterns in the study area. Accordingly, as described in the following sub-sections, we used optimized and emerging hotspot analysis to statistically identify significant hotspots in each community of the study area.

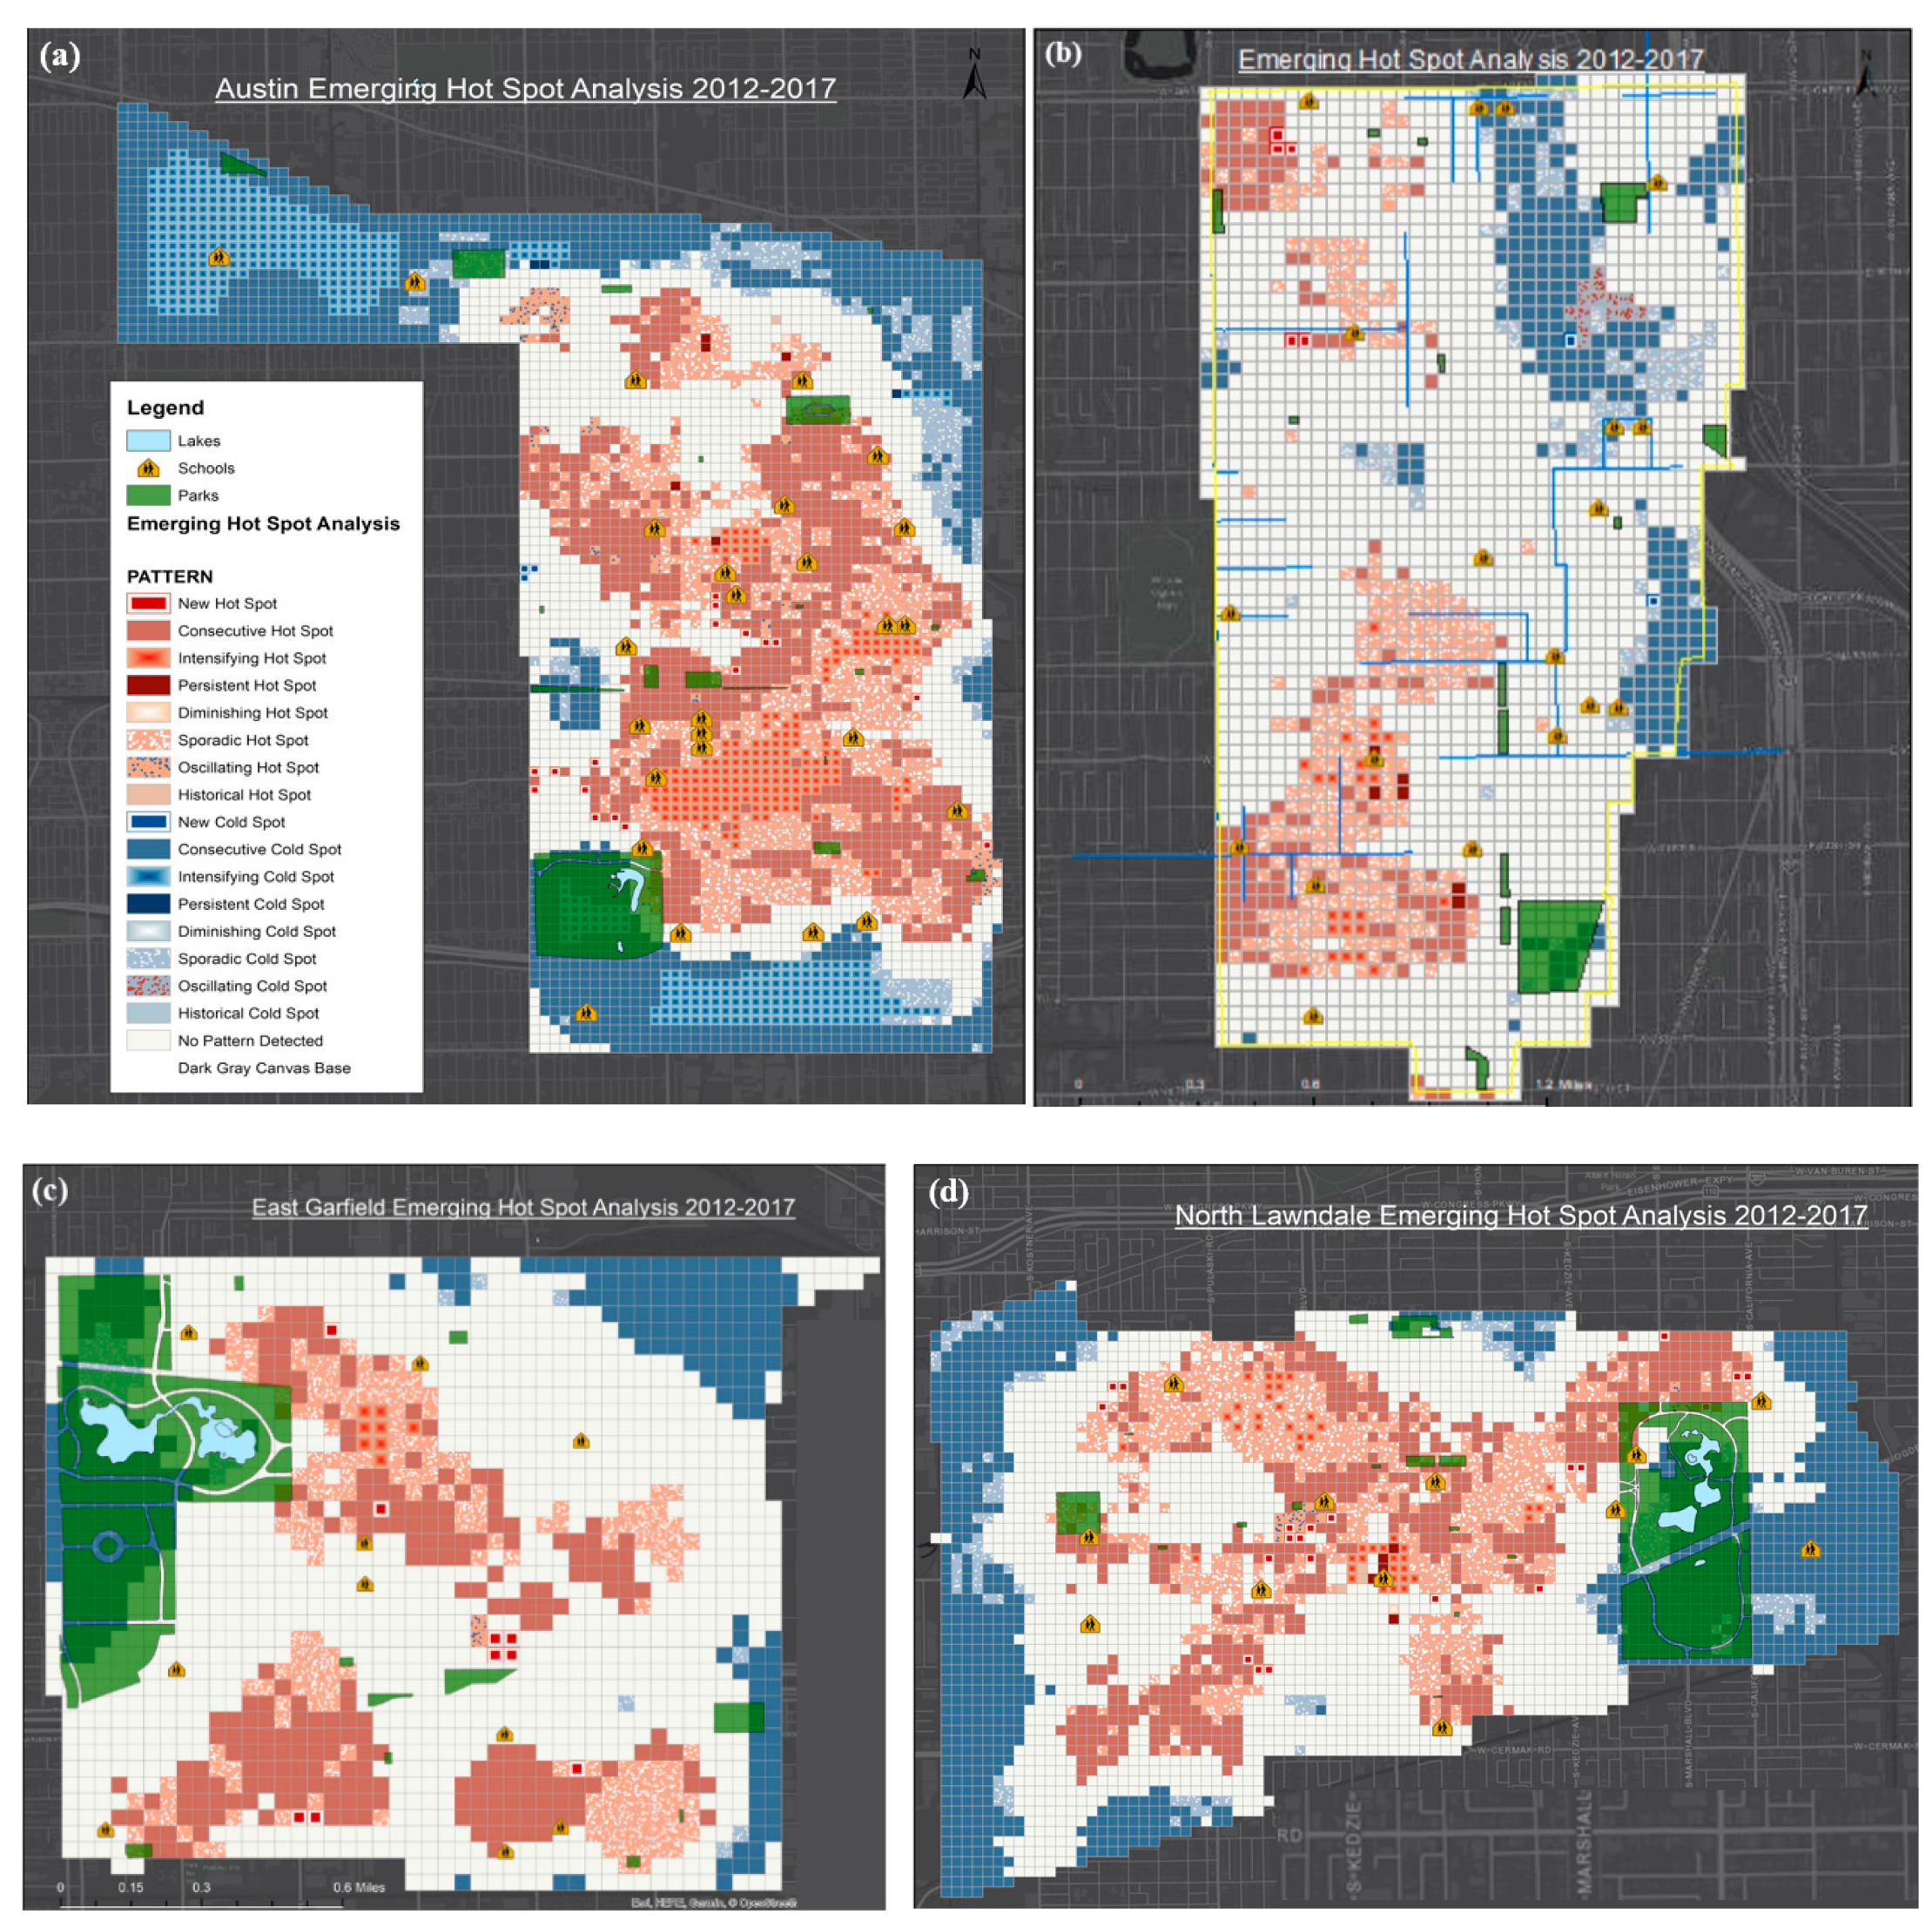
3.4. Optimized and Emerging Hotspot Analysis

This research conducted emerging hotspot analyses to identify statistically significant changes in hot- or cold-spots for gun-related crimes from 2012 to 2017. The trends include 17 spatial patterns, including no pattern detected, new, consecutive, intensifying, persistent, diminishing, sporadic, oscillating, and historical hot- or cold-spots.
Intensifying hotspot trends indicate a statistically significant overall increase of clustering high counts in each time step, whereas diminishing hotspots signify a statistically significant overall decrease in the intensity of clustering in each time step, and sporadic hotspot trends indicate that a location that is an on-again then off-again hotspot.
As shown in Figure 13, in contrast to other areas, the hotspot trends in Englewood are diminishing and sporadic and gun-related crimes have not been happening near the routes. In the other community areas, the hotspot trends are consecutive or intensifying. For example, compared with the maps created using the density and interpolated surfaces techniques, the emerging hotspot analysis demonstrated intensifying hotspot trends over time in all but the most marginal zones of Austin. Most of the gun-related crimes occurred in areas surrounding schools and safe passage routes, and many intensifying hotspot trends were identified in the southern part of the community.

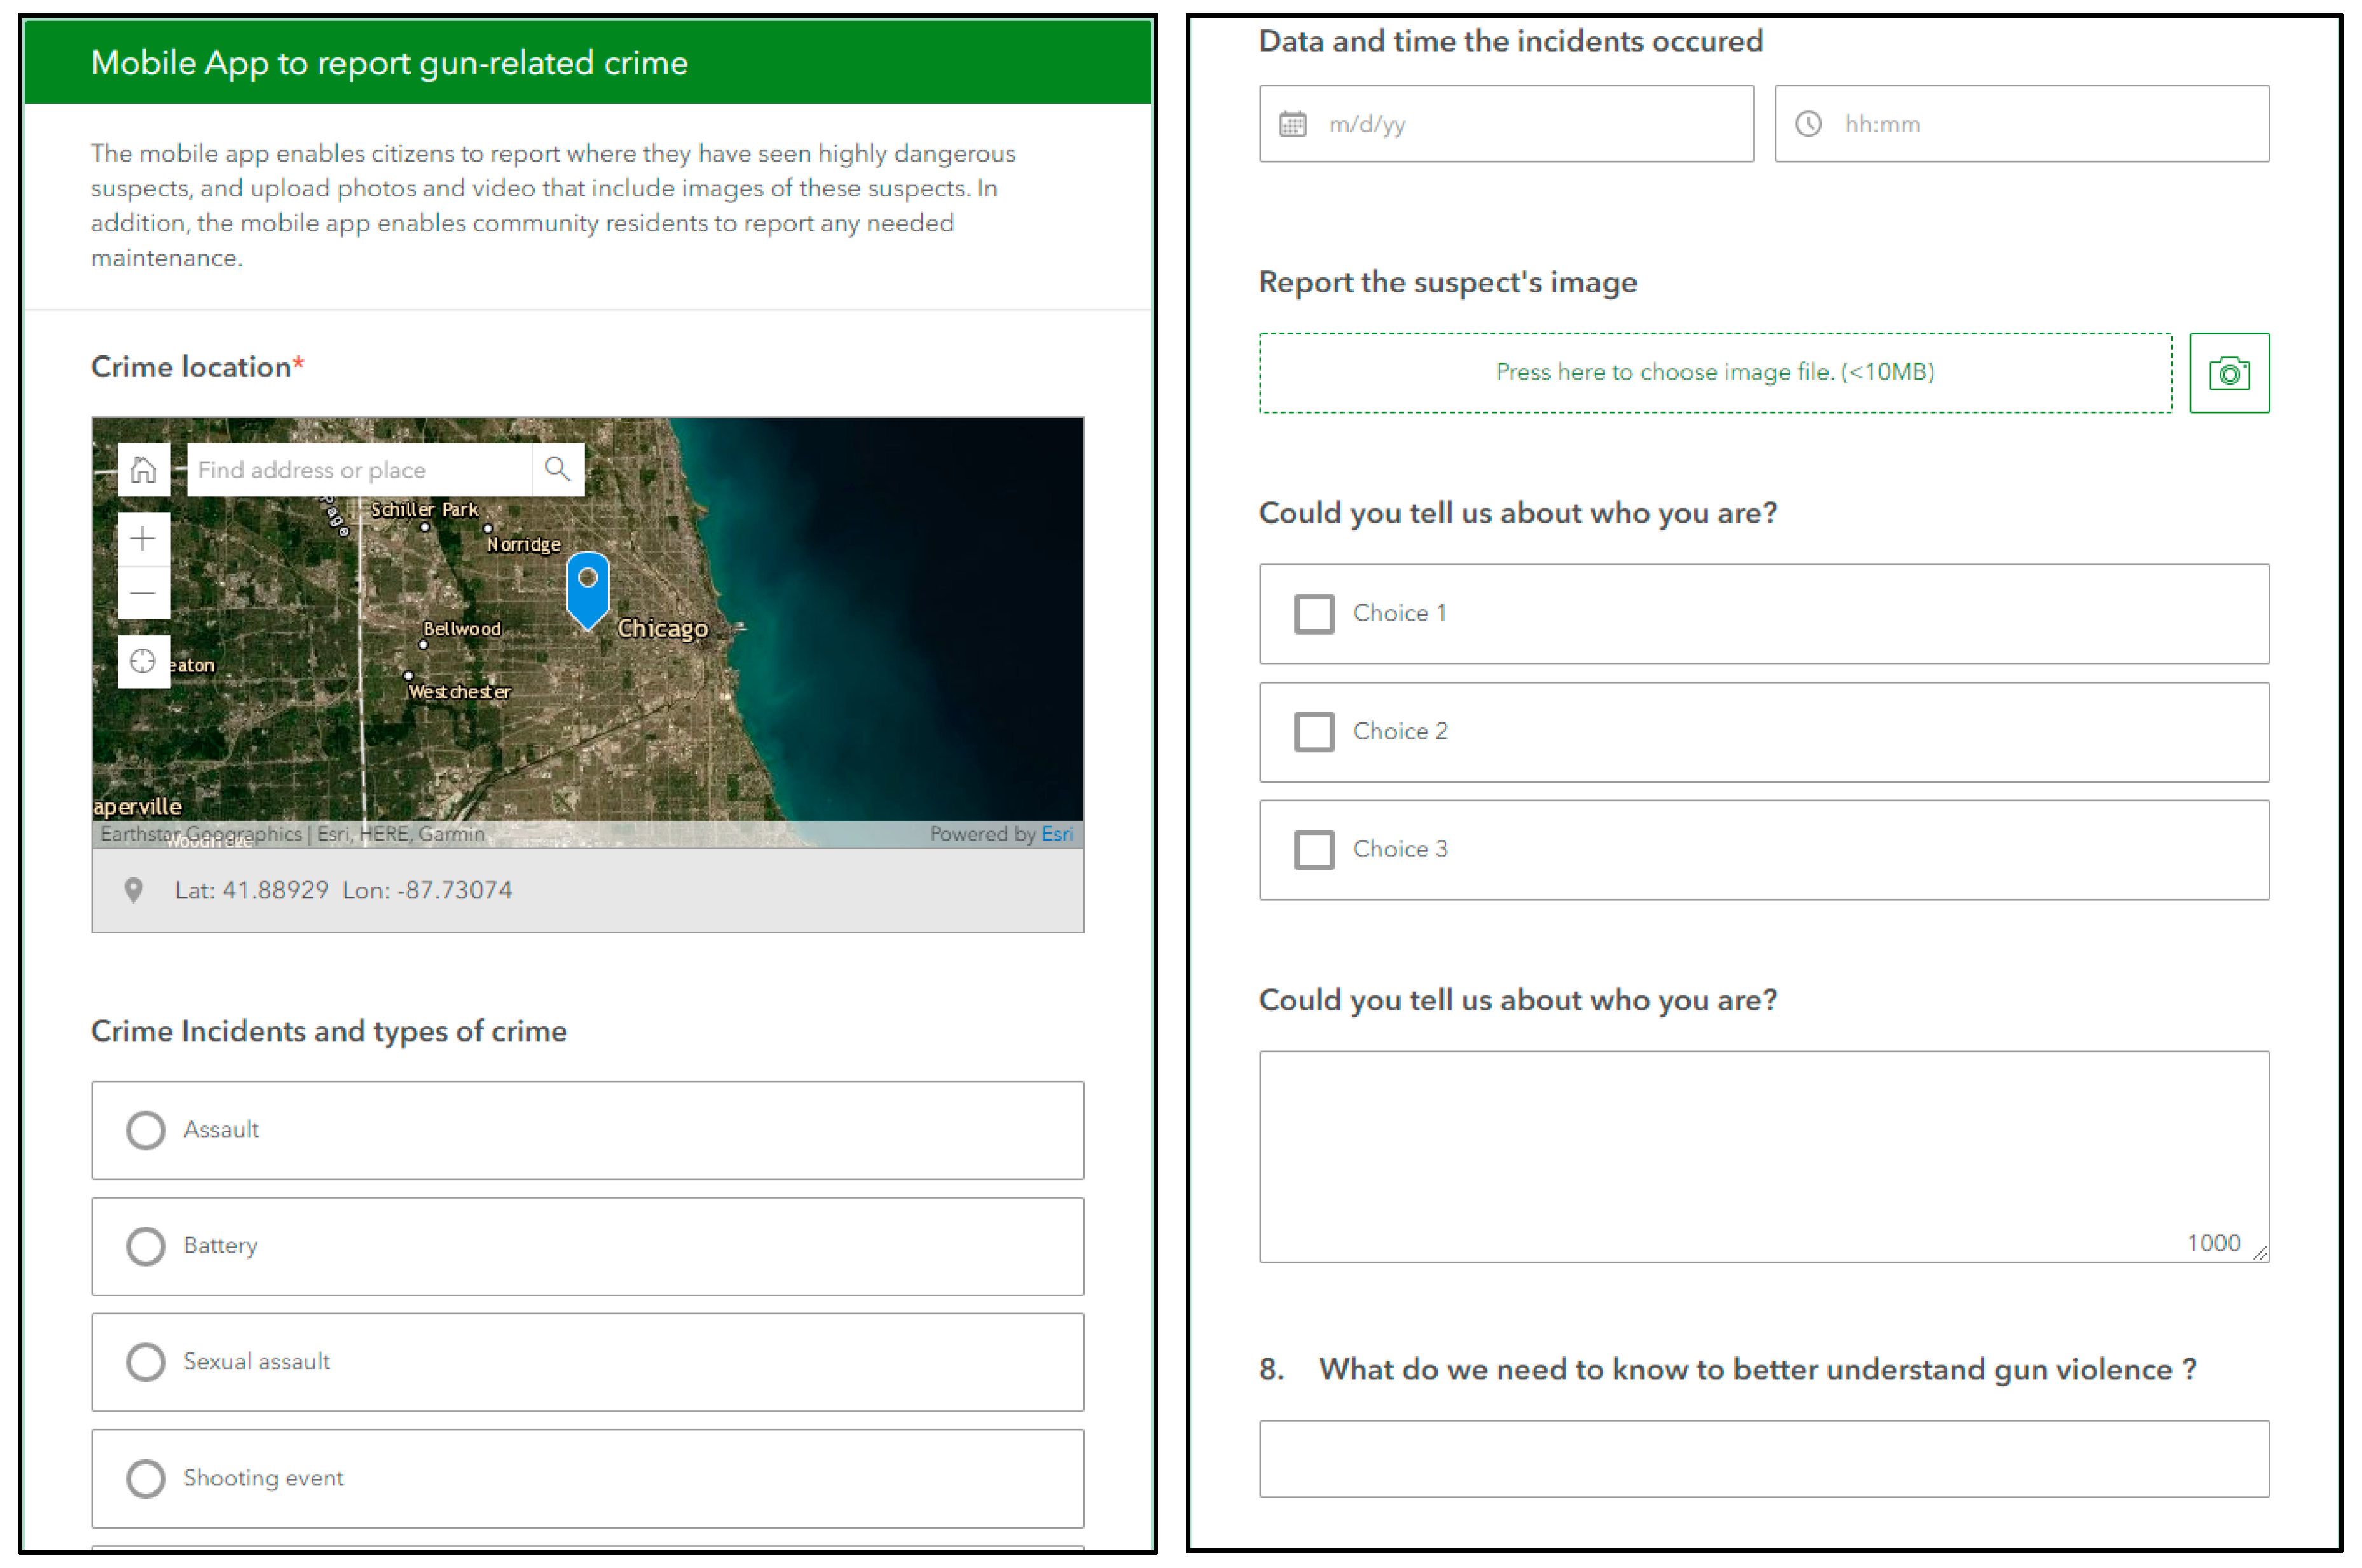
3.5. Developing Web-Enabled and Mobile GIS Applications

The story maps depicted in Figure 14 combine integrative maps (Figure 14b), multimedia, contents (Figure 14a), and user experiences to tell stories of gun-related crimes in the study area. The two interactive maps include mapping outputs, pictures of the study community areas, and an animated map for time–space analysis. In the story maps, each slide contains the demographics in attribute tables of the interactive maps, such as the total population, race/ethnicity, median income, median age, and education. Furthermore, the interactive maps include an animated map for the results of emerging hotspot analysis and Kernel density maps. Thus, the interactive maps allow the public to view the spatial patterns of gun-related crimes and related outputs. Furthermore, they also enable the users to control the maps and are used as ancillary data for the researchers and community residents.
The mobile app illustrated in Figure 15 enables community residents to report any needed maintenance or crimes, including where they have seen highly dangerous suspects, and upload photos and videos that include images of these suspects. For instance, individuals can report the type of handgun crime, the date and time when the incidents occurred, images of the suspect, and personal information provided via the mobile GIS application. When an event occurs, the reported information is automatically transferred to a GIS server, and the event location is displayed on the interactive maps. The maps can be available for the public or privately visible to police officers. This mobile app can be deployed and updated in real time with the community’s assistance, and it can be operated to alert individuals within the study areas or within a specific range of a crime’s occurrence. Thus, this technology allows residents or researchers to represent the community in which they live and share information with each other as well as researchers and community partners.

4. Discussion

Chicago has long been highly segregated in terms of crime, and schools in the city are closed often. Additionally, city schools have experienced high rates of gun-related crimes, and children face danger every day because of having to pass through gang territories on their way to school. Crime is a long-standing assignment in the four community areas examined in this study. Although researchers in the CGVRC research team and policy makers have made efforts to reduce crime rates and to protect children, finding the best possible ways to help the communities in these areas remains difficult. Hence, in this study, the author raised some of the most challenging limitations of the current research groups in the Introduction. First, community residents want to easily understand and access research information. Second, current research outputs are documented as numbers and descriptions in academic reports. Such data should be easily accessible and understandable to researchers and community residents. Third, it is crucial for researchers to use, create, and disseminate spatial information to promote community residents’ engagement. Thus, extracting location-based information is essential for researchers and community residents to identify the community assets that exist in these areas. Figure 16 shows how we collected and classified interview data in terms of the root causes of gun violence, which was one of the challenges that we experienced.
Accordingly, this research raised the following three questions: (1) How can GIS experts contribute to communities’ efforts to collect, use, and create community resources?; (2) what kinds of visualization techniques can assist us to spatially understand the hotspot trends of gun-related crimes and to investigate changes in safe passage routes in the city of Chicago?; and (3) what are the best geospatial approaches to share the community’s spatial information or knowledge and promote the engagement of researchers and community residents in supporting evidence-based solutions for current challenges?
As for the first question, this research created thematic maps with geospatial information regarding community resources, safe passage routes, and locations of crime incidents. The thematic maps are useful for community residents and research groups to better identify and understand where community resources exist and crime incidents happen. As for the second question, the GIS spatial analysis and statistics used in this research helped us to visualize the hotspot trends of gun-related crimes and changes in safe passage routes. In particular, the study entailed identifying the spatial trends in gun-related crimes during 2012–2017 in the neighborhoods of Austin, East Garfield, North Lawndale, and Englewood, investigating changes in crime patterns near safe school zones in these areas before and after the establishment of the city’s safe passage routes in 2009. As for the third question, this research proposed the use of a web-enabled GIS mobile application that provides researchers and residents with spatial information about local crime incidents and enables community residents and researchers to collect and share their inputs with each other. During this study, the mobile application could not be used directly by the community residents and researchers because of privacy issues. However, it showed the potential benefits of collecting and sharing community resources created by the public. This application will be used for the following CGVRC project.
The overall patterns of gun-related crimes in the four community areas were explored in this study. Despite the increase in safe passage routes in these areas, most of them (except Englewood) demonstrate a pattern of intensifying gun violence, including in schools or in safe passage zones. The web-enabled application provided the spatial information and knowledge about gun-related crimes and safe passage routes. The mobile app allowed citizens and researchers to participate in community-engaged mapping projects. Accordingly, this study concludes that GIS applications can be used as means to establish relationships and build trust with local residents by providing them with spatial information, collecting information on the communities’ needs, and creating direct and immediate line of communication for the members to share information with each other as well as with community partners, including researchers and law enforcers.
While working with the CGVRC on this research, the author learned that community efforts and collaborative research work that can quickly respond to residents’ needs are critical for enhancing gun violence research. Embracing community-driven research frameworks with GIS applications can lead to the development of interventions that advance equity and social justice and have a significant impact on gun violence incidents in Chicago. Another lesson learned from this research was that researchers working on projects involving GIS focus on hard data provided by censuses and similar sources. However, this project allowed the author to more closely collaborate with community residents and other local partners, including police. By working with the CVGRC, the author could utilize the organization’s ability to directly meet with community partners and residents and strengthen the author’s research and background knowledge on the study areas. Furthermore, as is known, GIS is an ideal platform to support such efforts because spatial representation increases community awareness of the surrounding environment. GIS-based spatial analysis and statistics are the best scientific approaches to understand regional problems such as gun-related violence, resource disparities, and other issues relevant to social justice and quality of life. This study is highly valuable because the resultant outputs provide us with a direct line of communication between the areas we are studying and the residential community. In other words, the resulting outputs can integrate academic and civic learning in this consortium and will be used to demonstrate how community-based or engaged GIS research can work. This research activity gave researchers and student fellows very interesting experiences, which will inform our ability to build successful collaborations that effectively use methods to identify and mobilize local communities and city assets toward the aim of protecting youth and preventing gun violence.

5. Conclusions

In this research project, the author produced a schematic diagram for developing research approaches that promote collaborative participation of community partners, residents, and non-GIS experts regarding community issues. Ultimately, this study aimed to develop a GIS platform that provides spatial information to residents and present evidence-based solutions for reducing gun-related violence, better understanding community needs, establishing relationships, and building trust. The spatial information generated and presented in a GIS environment can facilitate advanced communication between community residents and research groups and urban policy makers, and help all stakeholders better understand community needs and resources. Through the outputs produced in this project, research groups and community residents will be able to see and create spatial information through web-enabled mapping applications. These results will be used to inform neighborhood program initiatives aimed at reducing gun violence and strengthening youth programs that build economic opportunity, civic engagement, and youth resiliency. A remaining need is another web-enabled application that will facilitate the collection of public input. Thus, future studies will use forms of big data such as Twitter data that conveys public opinion concerning gun-related crimes in the city of Chicago.

Funding

This work was supported by the Dongguk University Research Fund of 2019.

Acknowledgments

This work was supported by the Dongguk University Research Fund of 2019. Viviana Camacho participated in this project as a research assistant. She mainly collected demographic data, built GIS database, analyzed the geographic data in the four community areas, and developed an interactive map for this project.

Conflicts of Interest

The author declares no conflict of interest.

References

  1. Grinshteyn, E.; Hemenway, D. Violent death rates: The US compared with other high-income OECD countries, 2010. Am. J. Med. 2016, 129, 266–273. [Google Scholar] [CrossRef]
  2. Wertz, J.; Azrael, D.; Hemenway, D.; Sorenson, S.; Miller, M. Differences between new and long-standing US gun owners: results from a national survey. Am. J. Public Health 2018, 108, 871–877. [Google Scholar] [CrossRef]
  3. Sierra-Arévalo, M. Legal cynicism and protective gun ownership among active offenders in Chicago. Cogent Soc. Sci. 2016, 2, 1227293. [Google Scholar] [CrossRef]
  4. Simonetti, J.A.; Azrael, D.; Rowhani-Rahbar, A.; Miller, M. Firearm storage practices among American veterans. Am. J. Prev. Med. 2018, 55, 445–454. [Google Scholar] [CrossRef]
  5. University of Chicago Crime Lab. Gun Violence in Chicago. 2016. Available online: https://urbanlabs.uchicago.edu/attachments/c5b0b0b86b6b6a9309ed88a9f5bbe5bd892d4077/store/82f93d3e7c7cc4c5a29abca0d8bf5892b3a35c0c3253d1d24b3b9d1fa7b8/UChicagoCrimeLab%2BGun%2BViolence%2Bin%2BChicago%2B2016.pdf (accessed on 10 April 2019).
  6. Federal Bureau of Investigation. Uniform Crime Reporting Program. Available online: https://www.opendatanetwork.com/entity/1600000US1714000-1600000US3651000/Chicago_IL-New_York_NY/crime.fbi_ucr.rate?crime_type=All%20Crimes&year=2017 (accessed on 10 May 2019).
  7. Chicago News. Dick Durbin Says Railway Must Do More to Prevent Gun Thefts. Available online: https://chicago.suntimes.com/news/durbin-says-railway-must-do-more-on-gun-thefts/ (accessed on 15 March 2018).
  8. Paddock, E.; Samuels, J.; Vinik, N.; Overton, S. Federal Actions to Engage Communities in Reducing Gun Violence; Urban Institute: Washington, DC, USA, 2017. Available online: https://www.urban.org/sites/default/files/federal_actions_to_engage_communities-in-reducing-gun-violence.pdf (accessed on 10 March 2019).
  9. Sinai Health System (SINAI). Community Health Needs Assessment Schwab Rehabilitation Hospital. 2016. Available online: https://www.sinai.org/sites/default/files/HCH%20CHNA_final_revised_%20(1).pdf (accessed on 11 November 2018).
  10. Chicago Tribute. School Board Votes to Close 49 Schools. 2013. Available online: http://graphics.chicagotribune.com/school_utilization/ (accessed on 11 May 2019).
  11. De la Torre, M.; Gwynne, J. When Schools Close: Effects on Displaced Students in Chicago Public Schools. Research Report; Consortium on Chicago School Research: Chicago, IL, USA, 2009. [Google Scholar]
  12. Chicago Tribute. CPS Release Maps of ‘Safe Passage’ Routes. 2013. Available online: https://www.chicagotribune.com/news/ct-xpm-2013-08-09-chi-cps-releases-maps-of-safe-passage-routes-20130809-story.html (accessed on 11 January 2019).
  13. Hartz, T. Safe Passage Program Expands to 14 More Schools. Available online: https://chicago.suntimes.com/education/chicago-public-schools-safe-passage-expanded/ (accessed on 21 January 2018).
  14. Chicago Public School. CPS Expand Safe Passage to 14 Additional Schools. Available online: https://www.chicago.gov/city/en/depts/mayor/press_room/press_releases/2018/january/SafePassageExpansion.html. (accessed on 21 January 2018).
  15. Camille, W.; Leah, B.; Jess, L. Community Listening Session Report; SUHI: Chicago, IL, USA, 2018; Available online: https://docs.wixstatic.com/ugd/fbbfe0_c877589d54ed4e47914d0c41453fa9bb.pdf (accessed on 11 September 2018).
  16. Routliffe, K. Student researchers see Chicago communities as partners in gun violence research. Chicago Trubuen. 29 March 2018. Available online: https://www.chicagotribune.com/suburbs/wilmette/ct-wml-gun-violence-researchers-tl-0405-story.html (accessed on 20 November 2018).
  17. Goodchild, M.F. Citizens as sensors: The world of volunteered geography. GeoJournal 2007, 69, 211–221. [Google Scholar] [CrossRef]
  18. Goodchild, M.F. Neo Geography and the nature of geographic expertise. J. Locat. Based Serv. 2009, 3, 82–96. [Google Scholar] [CrossRef]
  19. Goodchild, M.F.; Li, L. Assuring the quality of volunteered geographic information. Spat. Stat. 2012, 1, 110–120. [Google Scholar] [CrossRef]
  20. Sui, D.; Goodchild, M. The convergence of GIS and social media: Challenges for GIScience. Int. J. Geogr. Inf. Sci. 2011, 25, 1737–1748. [Google Scholar] [CrossRef]
  21. Elwood, S. Volunteered geographic information: Future research directions motivated by critical, participatory, and feminist GIS. GeoJournal 2008, 72, 173–183. [Google Scholar] [CrossRef]
  22. Elwood, S.; Goodchild, M.F.; Sui, D.Z. Researching Volunteered Geographic Information: Spatial Data, Geographic Research, and New Social Practice. Ann. Assoc. Am. Geogr. 2012, 102, 571–590. [Google Scholar] [CrossRef]
  23. City of Chicago. Chicago Data Portal. 2018. Available online: https://data.cityofchicago.org/ (accessed on 1 December 2018).
  24. Federal Bureau of Investigation. Uniform Crime Reporting (UCR) Program. 2019. Available online: https://www.fbi.gov (accessed on 20 June 2019).
  25. Bolstad, P. GIS Fundamentals. A First Text on Geographic Information Systems; Eider Press: Paris, France, 2005. [Google Scholar]
  26. Spencer, C.; Ratcliffe, J. GIS and Crime Mapping; John Wiley & Sons: Hoboken, NJ, USA, 2013. [Google Scholar]
  27. Dewan, A.M.; Haider, M.R.; Amin, M.R. Exploring Crime Statistics. In Dhaka Megacity; Dewan, A., Corner, R., Eds.; Springer: Dordrecht, The Netherlands, 2014; pp. 257–282. [Google Scholar]
  28. Elwood, S. Critical issues in participatory GIS: Deconstructions, reconstructions, and new research directions. Trans. Gis 2006, 10, 693–708. [Google Scholar] [CrossRef]
  29. Breetzke, G.D. The concentration of urban crime in space by race: Evidence from South Africa. Urban Geogr. 2018, 39, 1195–1220. [Google Scholar] [CrossRef]
  30. Breetzke, G.D.; Edelstein, I.S.; Secur, J. The spatial concentration and stability of crime in a South African township. Secur. J. 2019, 32, 63–78. [Google Scholar] [CrossRef]
  31. Anselin, L. Exploring Spatial Data with GeoDaTM: A Workbook. 2005, pp. 138–147. Available online: http://www.csiss.org/clearinghouse/GeoDa/geodaworkbook.pdf (accessed on 20 June 2019).
  32. Goodchild, M.F. Spatial thinking and the GIS user interface. Procedia-Soc. Behav. Sci. 2011, 21, 3–9. [Google Scholar] [CrossRef]
  33. De Smith, M.J.; Goodchild, M.F.; Longley, P. Geospatial Analysis: A Comprehensive Guide to Principles, Techniques and Software Tools; Troubador Publishing Ltd.: Leicester, UK, 2007. [Google Scholar]
  34. Wang, D.; Ding, W.; Lo, H.; Stepinski, T.; Salazar, J.; Morabito, M. Crime hotspot mapping using the crime related factors—A spatial data mining approach. Appl. Intell. 2013, 39, 772–781. [Google Scholar] [CrossRef]
  35. Getis, A.; Ord, J.K. The Analysis of Spatial Association by Use of Distance Statistics. Geogr. Anal. 1992, 24. [Google Scholar] [CrossRef]
  36. Ord, J.K.; Getis, A. Local Spatial Autocorrelation Statistics: Distributional Issues and an Application. Geogr. Anal. 1995, 27, 286–306. [Google Scholar] [CrossRef]
  37. Monsuru, A.; Rosser, G.; Cheng, T. Novel evaluation metrics for sparse spatio-temporal point process hotspot predictions—A crime case study. Int. J. Geogr. Inf. Sci. 2016, 30, 2133–2154. [Google Scholar]
  38. Gorr, W.L.; Kurland, K.S.; Dodson, Z.M. GIS Tutorial for Crime Analysis; Esri Press: Redlands, CA, USA, 2012. [Google Scholar]
  39. Coyan, J.A.; Zientek, M.L.; Mihalasky, M.J. Spatiotemporal Analysis of Changes in Lode Mining Claims Around the McDermitt Caldera, Northern Nevada and Southern Oregon. Nat. Resour. Res. 2017, 26, 319–337. [Google Scholar] [CrossRef] [Green Version]
  40. Pánek, J. From mental maps to GeoParticipation. Cartogr. J. 2016, 53, 300–307. [Google Scholar] [CrossRef]
Figure 1. Study areas: Austin (1), East Garfield (2), North Lawndale (3), and Englewood (4).
Sustainability 11 04889 g001
Figure 2. Schematic diagram for this study. (a) addresses designing community resources in thematic maps. (b) Introduces spatial analysis used in this research. (c) Web-enabled GIS applications.
Sustainability 11 04889 g002
Figure 3. Aggravated handgun incidents by year in the four community areas.
Sustainability 11 04889 g003
Figure 4. Handgun incidents by location in the four community areas: (a) East Garfield, (b) Austin, (c) Englewood, and (d) North Lawndale.
Sustainability 11 04889 g004
Figure 5. Mapping safe passage routes and gun-related crimes in Austin: (a) 2012, (b) 2013 (c) 2014, (d) 2015), (e) 2016, and (f) 2017.
Sustainability 11 04889 g005
Figure 6. Mapping safe passage routes and gun-related crimes in East Garfield: (a) 2012, (b) 2013, (c) 2014, (d) 2015), (e) 2016, and (f) 2017.
Sustainability 11 04889 g006aSustainability 11 04889 g006bSustainability 11 04889 g006c
Figure 7. Mapping safe passage routes and gun-related crimes in North Lawndale: (a) 2012, (b) 2013, (c) 2014, (d) 2015, (e) 2016, and (f) 2017.
Sustainability 11 04889 g007aSustainability 11 04889 g007b
Figure 8. Mapping safe passage routes and gun-related crimes in Englewood: (a) 2012, (b) 2013, (c) 2014, (d) 2015, (e) 2016, and (f) 2017.
Sustainability 11 04889 g008aSustainability 11 04889 g008b
Figure 9. Kernel density estimation in the Austin community area: (a) 2012, (b) 2013, (c) 2014, (d) 2015, (e) 2016, and (f) 2017.
Sustainability 11 04889 g009
Figure 10. Kernel density estimation in the East Garfield community area: (a) 2012, (b) 2013, (c) 2014, (d) 2015, (e) 2016, and (f) 2017.
Sustainability 11 04889 g010
Figure 11. Kernel density estimation in the North Lawndale community area: (a) 2012, (b) 2013, (c) 2014, (d) 2015, (e) 2016, and (f) 2017.
Sustainability 11 04889 g011
Figure 12. Kernel density estimation in the Englewood community area: (a) 2012, (b) 2013, (c) 2014, (d) 2015, (e) 2016, and (f) 2017.
Sustainability 11 04889 g012aSustainability 11 04889 g012b
Figure 13. Emerging hot-/cold-spot trends in the four community areas.
Sustainability 11 04889 g013
Figure 14. Story maps (an example of the Web GIS application): https://arcg.is/1GyvHa and https://arcg.is/0Xzyfq. (a) shows an interactive map containing thematic maps and outputs of spatial analysis produced in this research. (b) illustrates multimedia contents such as pictures and video with the interactive map.
Sustainability 11 04889 g014
Figure 15. Mobile application to engage community residents’ participation in the gun-related crime project: https://arcg.is/yquKO.
Sustainability 11 04889 g015
Figure 16. Sorting interview results with the author and multiple interview groups (left) (image courtesy of CGVRC).
Sustainability 11 04889 g016
Table 1. Safe passage routes in the four community areas.
YearChicagoAustinEast GarfieldNorth LawndaleEnglewood
2013–2014523534
2014–2015653586
2015–20161267799
2016–20171277899
2017–2018145881010

