Article

The Impact of Big Data Analytics on Company Performance in Supply Chain Management

by
Ionica Oncioiu
1,*,
Ovidiu Constantin Bunget
2,
Mirela Cătălina Türkeș
3,
Sorinel Căpușneanu
1,
Dan Ioan Topor
4,
Attila Szora Tamaș
4,
Ileana-Sorina Rakoș
5 and
Mihaela Ștefan Hint
4
1
Faculty of Finance-Banking, Accounting and Business Administration, Titu Maiorescu University, 040051 Bucharest, Romania
2
Faculty of Economics and Business Administration, West University of Timisoara, 300223 Timisoara, Romania
3
Faculty of Finance, Banking and Accountancy, Dimitrie Cantemir Christian University, 040051 Bucharest, Romania
4
Faculty of Economic Sciences, 1 Decembrie 1918 University, 510009 Alba-Iulia, Romania
5
Faculty of Sciences, University of Petrosani, 20 Universitatii, 332006 Petrosani, Romania
*
Author to whom correspondence should be addressed.
Sustainability 2019, 11(18), 4864; https://doi.org/10.3390/su11184864
Submission received: 8 August 2019 / Revised: 2 September 2019 / Accepted: 3 September 2019 / Published: 5 September 2019

Abstract

:
Big data analytics can add value and provide a new perspective by improving predictive analysis and modeling practices. This research is centered on supply-chain management and how big data analytics can help Romanian supply-chain companies assess their experience, strategies, and professional capabilities in successfully implementing big data analytics, as well as assessing the tools needed to achieve these goals, including the results of implementation and performance achievement based on them. The research method used in the quantitative study was a sampling survey, using a questionnaire as a data collection tool. It included closed questions, measured with nominal and ordinal scales. A total of 205 managers provided complete and useful answers for this research. The collected data were analyzed with the Statistical Package for the Social Sciences (SPSS) package using frequency tables, contingency tables, and main component analysis. The major contributions of this research highlight the fact that companies are concerned with identifying new statistical methods, tools, and approaches, such as cloud computing and security technologies, that need to be rigorously explored.

1. Introduction

Massive data has become the most important resource for future company wealth against the background of the continuous development of information technology and Industry 4.0 [1]. Growing exponentially [2], this explosion of big data is focused on several areas of activity, contributing to the intensification of global innovation in science and technology. Companies across the globe face numerous market expansions and strict quality standards, and they are overwhelmed by the massive amount of information coming from different customers and suppliers, and must manage it as efficiently as possible. Data management and integration becomes critical in addressing the challenges of linking supply-chain management systems between producers and suppliers as well as between their partners. Addressing supply-chain management challenges at each level and activity, data management and integration ensures the visibility of both producers and suppliers as well as their partners, thus contributing to improved relationships of trust and long-term collaboration. The provenance of structured and unstructured data makes it somewhat more difficult to analyze and generate information, but with supply-chain management systems, they are transformed and tailored to end user requirements. The supply chain covers all activities from the development of production to production and logistics to maximize customer value and achieve sustainable competitive advantages.
Many companies still do not understand how to apply analytical techniques to achieve superior performance within the supply chain. Through this study, undertaken within Romanian companies, we consider that we are making an important contribution to clarifying the aforementioned aspects. First, we identified the companies’ experience in implementing big data analytics (BDA) in supply-chain management (SCM) and the difficulties encountered in this process, followed by the adoption of company strategies for implementing BDA in SCM. The two issues investigated are also related to the existence of professional capacities needed to develop information through BDA and to identify the supply-chain analysis tools used by companies and their future intention to implement new tools and technologies. Second, the paper article provides an in-depth understanding of the benefits and performance of companies after implementing BDA in SCM. Also, there have been some challenges, such as the acceptance and use of new technologies, as well as their regulation.
This study consists mainly of six parts. In Section 2, the evolution of big data (BD) and BDA for SCM are mentioned as they are presented in the literature, accompanied by the importance and applications of BDA for SCM, along with drivers of and barriers to its implementation. In Section 3, the method used in the quantitative marketing study is presented. In Section 4, we present the results obtained by applying the method and their interpretation. Section 5 presents the conclusions and future directions of research.

2. Literature Review

2.1. Big Data and Big Data Analytics

New challenges in capturing, collecting, analyzing, archiving, sharing, transferring, and processing large datasets in organizations led to the emergence of the BD concept. The determinant factor behind this concept is digitalization, with increased social and media popularity among electronic device users [3,4]. The big data concept has been applied to datasets that are very large and difficult to handle by traditional database management systems. In other words, their size exceeds the current capacity of software tools and storage systems for capturing, storing, managing, and processing data in an acceptable time [5].
According to specialists, the BD concept has different approaches, such as the “3Vs”: volume (the volume of current datasets in big data is a significant attribute, since such data is considered to be excluded from the traditional management techniques of databases); velocity (the rate at which data is collected); and variety (unstructured data are generated by sources such as social media, e-mails, and communication) [6,7].
Based on the 3V concept, other specialists define big data as follows: (1) “High-volume, high-speed, and/or large-scale computer equipment that requires cost-effective and innovative forms of information processing to enable improved understanding, decision-making and process automation” [8]; (2) “big data as volume, high speed and data of great variety used in decision-making and requiring innovative management techniques” [8]; and (3) “special type of large-scale data that cannot be stored, manipulated, and analyzed by means of a conventional system together with an anonymous source, various dimensions and its relationship cannot be easily measured due to its complexity and dynamic nature” [9].
The big data concept is expanded to “5Vs” by adding two more features (veracity, or reliability of collected data, and the value of datasets involving substantial investments). BDA is defined as a holistic approach for managing, processing, and analyzing data sizes (volume, variety, velocity, veracity, and value) that are needed to create action-oriented information for sustained delivery, performance measurement, and competitive advantage [10,11,12]. The 5Vs can be explained as follows: (1) volume refers to the magnitude of data that requires increased storage devices [13]; (2) variety is reflected by generating data from heterogeneous sources Internet of Things (IoT), online social networks, and structured, semi-structured, and unstructured formats) [14]; (3) velocity is given by the time to access, process, and use data in real time [11]; (4) veracity reflects the importance of data quality and confidence in the data used [15,16]; and (5) value is reflected by revealing unused data in big data and can support decision-making [17,18].
BDA involves the use of advanced analytical techniques for extracting important information from large volumes of data to facilitate decision-making [19]. Developed from the field of operational research, advanced analysis has had various classifications [20], among which descriptive, predictive, and prescriptive analysis are considered representative [21]. Descriptive analysis is based on the analysis of data describing past business situations, trends, patterns, and exceptions. The techniques used for descriptive analysis can be characterized as [22] standard reports and scoreboards, ad hoc reporting, query drilldown (OLAP) alerts, and viewing.
Predictive analysis is based on real-time data analysis and historical data to predict the likelihood of future events. This technology learns from existing data using machine learning techniques and computational algorithms [23], including (1) advanced time series and advanced predictions used in SCM for marketing measures such as stockpiles or sales forecasts (ARIMA, ARMA); (2) supervised learning including linear and logistic regressions, statistical algorithms (K-NN, Naive Bayes, Bayes Network, CART, random vector trees, Neural networks); (3) clustering; and (4) size reduction. Prescriptive analysis is based on data-based predictions to inform and suggest proposed action sets that can be advantages or avoid certain results and may include: (1) studies addressing the variability of expected outcomes by analyzing the scenario game theory; and (2) optimization and simulation under conditions of special relevance in the context of uncertainty based on computational stochastic programming of random variables (Monte Carlo).

2.2. Big Data Analytics in Supply-Chain Management

The SCM concept has been debated by specialists around the world. It has been defined as “management alongside and within a network of upstream and downstream organizations, both of which have relationships and flows of material, information and resources” [24]. The supply chain can be considered to be a combination of four independent and interconnected entities (marketing, sourcing, inventory management, and transport). SCM is responsible for creating and maintaining links between the different entities in a business responsible for purchasing raw materials for final delivery of the product [25]. New technologies such as big data analytics synchronize SCM in a separate stream [26] and allow organizations to capture, process, analyze, store, and exchange data about their operations [27].
An extended supply chain is a multilayered system that connects organizations through collaboration and integration, as competition between supply chains is perceived as higher than between individual firms [28]. Among the computer systems used for this purpose are Electronic Data Interchange (EDI), Vendor Managed Inventory (VMI), Efficient Consumer Response (ECR), Collaborative Planning Forecasting and Replenishment (CPFR), Collaborative Planning System (CPS), Sales Force Automation (SFA), Point of Sale (POS) data, and Customer Relationship Management (CRM) [29]. Among all SCM information flows, big data analytics focuses on data analysis and tools are included in the “analytics” domain. Analytics applies mathematics and statistics to large amounts of data. Big data without analytics is just a lot of data, and analytics without big data is simply math, statistical tools, and applications [30].
Thus, a first attempt to define BDA is based on the 3V framework: (1) weekly generated data volume greater than 300 TB classifies companies in the BDA category; (2) the velocity of data creation and transmission plays a key role in transferring data from batch processing to real-time operation; and (3) the variety of data provided to users can include, in addition to classical SQL or XML formats, digital information such as video, text, or images [7]. Starting from this attempt to define BDA within the supply chain, some specialists have presented other approaches: (1) the process of extracting and presenting supply-chain information to ensure measurement, monitoring, forecasting, and supply-chain management [31]; (2) a broad and unique view of the entire supply chain to disclose component or full production, including analyses and key performance indicators (KPIs) [32]; (3) using quantitative methods to obtain prospective information from data in order to understand in depth what is going upstream and downstream, in order to assess the operational decision-making impact of the supply chain [33]; (4) the operational leap from data response management models that can help specialists analyze larger datasets using proven analytical and mathematical techniques [34]; and (5) the combination resulting from the application of quantitative and qualitative methods to SCM theory to solve SCM problems and predict results, taking into account the quality and availability of data [35].
Studies on the impact of Big Data (BD) on sustainable investment in a supply chain (SC) have indicated the following aspects: (1) stimulation of the co-creation of value by reducing risks, with BD helping to shorten SC stages by extending economic marginalization and facilitating sustainable planning of smart investments in health care [36]; (2) a positive impact between the number of observations of market information and increased profit by using the updating information Bayesian approach of [37]; and (3) perfection of SC through investments made by both parties (suppliers and traders) in the profit generating BD and regulated by revenue distribution contracts between them [38].
An essential factor in motivating members within a SC to make sustainable investments in innovative technologies is related to equity concerns. They can promote and coordinate members of the SC, without the problem of advantageous inequity in view of the considerable investment in new sustainable innovative technologies [39]. A study was also conducted to explore the application of BDA in mitigating the social risk of a SC and how it can contribute to achieving ecological, economic, and social sustainability. The results indicated that companies can predict various social problems (labor safety, fuel consumption monitoring, health of the workforce, security, physical condition of vehicles, ethical behavior, theft, speed and traffic violations through big data analysis) that can be managed through the information provided, thus contributing to the mitigation of social risks [40].
The influence of block-chain technology on the exchange of information between participants in a SC is highlighted with the help of mean-Conditional Value at Risk (CVaR) to characterize the risk-aversion behavior of the traders. The CVaR-based revenue distribution contract is used to coordinate the SC and profit distribution. Research carried out by specialists indicated that profits from the SC system are higher in a centralized than a decentralized decision-making process. Through block-chain technology, transaction costs between SC members can be reduced, information exchange can be achieved, and benefits can be improved [41].
Using game theory, another study dedicated to investigating the risk-aversion behavior of producers and traders within a closed-loop SC examined making optimal decisions about wholesale, retail, and recycling prices in centralized and decentralized decision scenarios. By analyzing some parameters that influence the revenue distribution contract, a new contract model was proposed to increase the SC members’ profits by identifying the optimal income distribution ratio [42].
Other equally interesting studies were devoted to the research and development of a new model based on the Decision-Making Trial and Evaluation Laboratory (DEMATEL) method called the KTT-GSCM (Knowledge-Technology Transfer–Green Supply-Chain Management) multicriteria model which demonstrated the mutual influences between GSCM, KTT, and technological innovation [43]. Based on a relational vision of inter-organizational competitive advantage, another study focused on empirical research of drivers and their results in integrating a low-carbon supply chain (logistics service providers (LSPs) with supply-chain integration (SCI)). The results of the study highlighted the fact that between the corporate environmental responsibility of the LSP and the environmental requirements of the clients, there are positive relationships with SCI with the low-carbon emissions of the LSP, and the latter is positively related to the financial and environmental performance of the LSP [44].
To ensure environmentally sustainable logistics, companies must have an environmentally sustainable logistics performance management (ESLPM) process. Transposing the integration of processes within the SC to increase performance was achieved by developing a framework aimed at integrating the ESPLM process and third-party logistics (3PL). This framework can provide guidance for practitioners in identifying the degree of integration of logistics performance management processes and decision-making at the senior level [45].
Large companies (with more than 250 employees) are already using supply-chain analytics tools such as KPMG Spectrum Third-Party Intelligence, Deloitte Supply-Chain Solutions, Halo Supply-Chain Analytics and Business Intelligence Software, Tableau, and Neubrain Supply-Chain and Logistics Analytics Software. Numerous software solutions are also in use, such as Relax, FusionOps, Blue Ridge Supply-Chain Analytics and Inventory Analytics Software, IMI Supply-Chain Analytics, and Qlik Supply-Chain Analytics [29]. These companies manage large volumes of data of thousands of Small and medium-sized enterprises (SMEs).

2.3. Importance and Application of BDA in SCM

The technological advances recorded by supply-chain entities, the volume of data generated, and the speed of distribution have led to significant increases in structured and unstructured data analysis to get a clearer picture of customer needs and improve cost-related aspects of supply-chain processes. Big data analytics can make significant contributions to areas such as product development, market demand prediction, supply decisions, distribution optimization, and customer feedback. Companies with a disciplined strategy of using big data analytics have had better results with investments [46]. In other words, a clear and systematic strategy of big data analytics can provide a better return on investment (ROI) in certain areas of the supply chain, such as marketing, purchasing, shipping, and storage [47].
Other specialists have demonstrated the importance and contribution of BDA to SCM by: (1) improving manufacturing performance by linking IoT and BD to manufacturing systems to minimize bottlenecks by developing forecasting techniques [48]; (2) observing current trends in supply-chain management by using Twitter and developing a new conceptual framework in this regard [49]; (3) investigating the potential use of TD for the management of product life cycles [50]; (4) measuring the sustainability of supply chains using BD prediction analysis [15]; and (5) establishing a relationship between sustainable supply-chain management and logistics operations in the food industry [51], and developing a methodology for analyzing social data for supply-chain analysis and logistics operations in the food industry [52].
From the above approaches we can see that: (1) the information from SCM analysis should be presented and extracted in a way that will help end users; (2) enhanced data integration and SCM analysis have helped to increase visibility across the supply chain; (3) data retrieval methods and their permanent updates have helped to improve the speed of data processing, with real-time capability for various decision situations; (4) data analysis has been forward-looking and the impact assessment of prospective decisions has led to the emergence of a new advanced supply-chain management using proactive models; and (5) there is a need to include knowledge in the use and analysis of data. In other words, BDA is the natural evolution of big data in SCM [53].

2.4. Benefits and Constraints of BDA for SCM

Due to the upsurge of unstructured data in complex processes across entities, big data analytics has become the biggest challenge for the supply chain. The competitive position on the market is maintained under the conditions of proper management of the entities in the supply chain. Entities are interconnected through material flows, financial flows, and significant electronic information exchanged simultaneously among all supply-chain partners. Connections between different parts or elements of the supply chain may be direct or indirect, and significant interactions between them determine the complexity of the system.
To understand this impact, we need to take into account the following key features: (1) the number of entities in the supply chain; (2) the diversity of entities; (3) the existing interdependence between items, products, and supply-chain partners; (4) the dynamics of the system, represented by variety; and (5) the existence of uncertainties. The great interest of specialists is shown by the empirical studies undertaken, which highlight several advantages of BDA within EMS, such as reducing operational costs, increasing customer satisfaction, and increasing SC agility [35,54,55,56].
In previous studies of specialists, numerous benefits related to SCM information technology (IT) optimization have been identified, such as (1) the exchange of information between SC stakeholders [57,58,59,60]; (2) the transformation of intra- and inter-organizational business processes (cancellation, redesign, automation) [61,62,63], operational efficiency [64] and revenue growth [59], profitability, and improvement of stakeholder relations [65,66]; and (3) improving relational and contractual governance by effectively mitigating the opportunism of partners [67]. In addition, BDA could also generate future opportunities for stakeholders such as obtaining a competitive advantage [68] and reducing exposure to fraud or other malfunctions [69,70].
According to specialist studies, several constraints have been identified in the adoption/implementation of BDA in SCM: technological barriers, expertise, and investment barriers, data barriers, organizational barriers, etc. In the category of technological barriers, the following issues were identified as the basis for BDA implementation in SCM: (1) a lack of understanding of the implementation of new technologies or a lack of tools needed to implement BDA in SCM [54]; (2) a lack of infrastructure facilities [71,72,73]; (3) low acceptance, routine, and BDA assimilation by SCM organizations and partners [73,74]; and (4) data security [35,75].
With regard to expertise and investment barriers, specialist studies have shown interesting aspects of BDA in SCM: (1) a lack of qualified IT staff and high investment cost [72,73]; and (2) a lack of funds and facilities for research and development of BDA instruments [70]. Data barriers have highlighted interesting aspects of the implementation of BDA in SCM, such as: (1) complexity of data integration and data quality [72,73,76]; and (2) data security, confidentiality, performance, and scalability [72,73]. Organizational barriers have been identified as negative limits in implementing BDA in SCM: (1) the absence of a data-sharing policy between organizations and a lack of thinking in terms of large data [69]; and (2) a lack of training facilities and time constraints [72,77].

2.5. Big Data Analytics and Supply-Chain Management in Romania

Studies in Romania related to the implementation of BD and BDA are scarce. The most significant studies were in the fields of health and information and communication technology. BD can help physicians choose treatments more correctly and faster, based on information collected by health care professionals. Thus, patients can benefit from appropriate treatment in due time, and will be better informed about health care providers [78]. In the field of information and communication technology, the themes of large data management and management and analysis (big data) have been analyzed in terms of their relevance for the solutions they offer to increase competitiveness in intelligent specialization at a national level [79].
On the other hand, the role of Research, Development and Innovation (RDI) in information and communication technology (ICT) in supporting the development of the economy and society, focusing on the business environment, identifies among the four priorities e-commerce, research and development (R&D) and innovation in ICT [80].
In line with these priorities, in the Digital Agenda for Romania Program, the electronic services section includes the project “ICT Research and Development and Innovation: Developing innovative products and services serving the 10 sectors (tourism and ecotourism, wood and furniture, creative industries, automotive and components, information and communication technology, food and beverage processing, health and pharmaceuticals, energy and environmental management, bio-economy, biopharmaceutics, and biotechnology) identified in smart specialization” (TIC-SI), with the objective of investigating and implementing this role.
In Romania, the SC concept is widely used, having being given more meanings, such as: (1) the variation and nonexistence of a uniform designation between SC and SCM [81]; and (2) the use of synonyms for SC (supply network, logistics network, supply-chain management, supply-chain provision) [82,83,84,85,86,87,88]. Supply-chain management involves challenges such as building trust, sharing information on market needs, developing new products and services, and meeting customer requirements as efficiently as possible [89,90].
The starting point of research regarding the stage of implementation, expansion, and development of SCM in Romanian companies is the logistics sector. Despite with a background of poor transport infrastructure and public policy and an economic crisis [91], this sector managed to make some progress, justified by the presence of large companies and international groups in Romania. This can also be noticed by tracking foreign investments in the economy following the large central areas (Bucharest, Cluj-Napoca, Arad, Constanta, and Ploiesti) compared to the performance level of logistics platforms of large companies in developed countries such as the US or European countries. Romanian logistics activities are carried out internally with specialized companies, as well as externally (the tendency is increasing, with outsourcing to specialized suppliers) [92]. During 2008, the stage of development of SCM was low, with only extension and integration of companies with suppliers and distributors [93].
The implementation of SCM within Romanian companies is influenced by two major factors: (1) physical capital (technology not updated) and poor human capital (reduction of wage costs); and (2) limited vision of the inter-organizational structure [94]. The directions for improvement have been investment in new technology and human capital, assimilation of new values by managers and continuous adaptation, and improvement of employees’ skills and their adaptation to new technologies.
The implementation of SCM within Romanian companies requires organizational changes based on the “Eight I’s that Create We’s” approach, which considers the following characteristics: individual excellence, importance, interdependence, investment, information, integration, institutionalization, and integrity [95]. Unlike later research in Romania, our paper aims to explore aspects related to the state of implementation of BDA for SCM, the adoption of BDA strategies in SCM, the identification of BDA’s capabilities and tools in SCM, and the measurement of future intentions of Romanian companies regarding the implementation of other BDA tools for SCM.

3. Research Methodology

Given the importance of using Industry 4.0’s new tools and technologies, which make a substantial contribution to improving business performance, we conducted a study of companies in Romania. Industry 4.0 represents the fourth industrial revolution with a major impact on the production of the future, which integrates innovative elements and technologies such as big data analytics, Internet of things and others, and which ensures constant communication and connection in addressing customer services. Through this study, we wanted to find out the future intention of companies to implement new tools and technologies that impact their performance. The quantitative market research had the following objectives:
Objectives 1: Identify the companies’ experience in implementing analytics in supply chain and the difficulties encountered in this process.
Objectives 2: Identify strategy adoption by companies for implementing large data analytics (including the supply chain) and determine its main development priorities.
Objectives 3: Identify the existence of professional capabilities needed to develop insights through BDA.
Objectives 4: Identify the supply-chain analytics tools used by companies and the future intended implementation of new tools and technologies to gain valuable supply-chain insights.
Objectives 5: Highlight the results obtained by companies following the use of BDA in the supply chain.
Objectives 6: Measure the influence of experience, strategies, professional capabilities, annual sales revenues, and industry on the future intention of companies to implement new tools and technologies to gain valuable supply-chain insights.
Taking into account the objectives of the study, we formulated the following research hypotheses:
Hypotheses 1: There is no link between the size of the company and its experience in implementing analytics in supply chain.
Hypotheses 2: There is a link between the size of the company and its strategy for implementing BDA.
Hypotheses 3: There is a link between years of operating experience and professional capabilities to develop insights through BDA.
Hypotheses 4: Most of the Romanian companies intend to implement new tools and technologies to gain valuable supply-chain insights.
Hypotheses 5: The company’s experience influences its future intention to implement new tools and technologies to gain valuable supply-chain insights.
Hypotheses 6: The strategies adopted by companies to implement BDA influences their future intention to implement new tools and technologies to gain valuable supply-chain insights.
Hypotheses 7: Professional capabilities influence the future intention of companies to implement new tools and technologies to gain valuable supply-chain insights.
Hypotheses 8: Annual sales revenue influences the future intention of companies to implement new tools and technologies to gain valuable supply-chain insights.
Hypotheses 9: Industry influences the future intention of companies to implement new tools and technologies to gain valuable supply-chain insights.
To achieve the above-mentioned objectives, but also to test the model proposal, it was necessary to collect data from different companies. The study was conducted between January and March 2019. The relevant population for our study (www.insse.ro) was identified in the metadata database of the National Institute of Statistics in Romania. Starting from the information provided, the sampling base was defined and built. The process ended with a cross-listing of 550 companies. In view of some errors (such as inactive, noncontact, or already dissolved), the sampling base (list) was reduced to 460 enterprises. After companies were identified, contact with their managers was established to receive the survey agreement and know which managers were to get the online questionnaire, included in an e-mail link to be completed later.
The research method used in the quantitative study was a survey by sampling, using the questionnaire as the data collection tool. It included closed questions, measured with nominal and ordinal scales. The study was carried out with the support of six interviewers with experience in the field. Managers who agreed to participate in the survey received an electronic link via e-mail for the online questionnaire. The process ended with the conclusion of participation agreements with 226 companies included in the list. The response rate was 90.7%, i.e., 205 managers provided complete and useful answers for this research (Appendix A, Table A1). The collected data were analyzed with the SPSS package, using the frequency and contingency tables, the hi-square test, the Student’s t-test, factorial correspondence analysis, and the binary logistic regression model.
In this respect, the binary logistic regression model was used, which indicates the relation between a nominal variable Y (value 1 = success; 0 = failure) and k factorial variables. Factorial variables are quantitative or categorical, while Y is a binary variable that has a Bernoulli type distribution, with the parameter p = P (Y = 1). The general equation underlying the linear logistic regression model is [96]:
P ( y = 1 / x 1 , x 2 , x 3 ,   x k ) = exp ( β 0 + β 1 x 1 + β 2 x 2 + β 3 x 3 + + β k x k 1 + exp ( β 0 + β 1 x 1 + β 2 x 2 + β 3 x 3 + + β k x k
where P is the probability of getting a certain behavior or intent (yes answer); x1, x2, x3, …, xk are independent variables included in the model; and β0, β1, β2, …, βk are the model coefficients obtained according to the dependence of the values of the variables.

4. Results and Discussions

The first research goal (O1) was to identify the companies’ experience in implementing BDA in SCM and the difficulties encountered in this process. Using the chi-square test, we can see the distribution of companies according to the experience gained in implementing BDA in the SC in five size categories in Table 1. In total, there are more than four times as many experienced companies (164) as companies with no experience (41).
From the analysis of the differences between observed and expected frequencies, it can be seen that there are differences in the levels of all subgroups formed by the crossing of two variables. In the subgroups of companies with more than 250 employees, observed experience is higher than expected (58 > 48.8 and 46 > 36.8), and in companies with lack of experience in implementing analytics in the supply chain, expected frequency is higher than observed (12.2 > 3 and 9.2 > 0).
As can be seen in Table 2, the critical report has a value of 68,226, and for number of degrees of freedom df = 4. Since the significance level is 0.000, which is less than α = 0.05, the hypothesis is rejected, and the alternative hypothesis is accepted, according to which there is a connection between the size of the company and the experience accumulated in the implementation of BDA in SC.
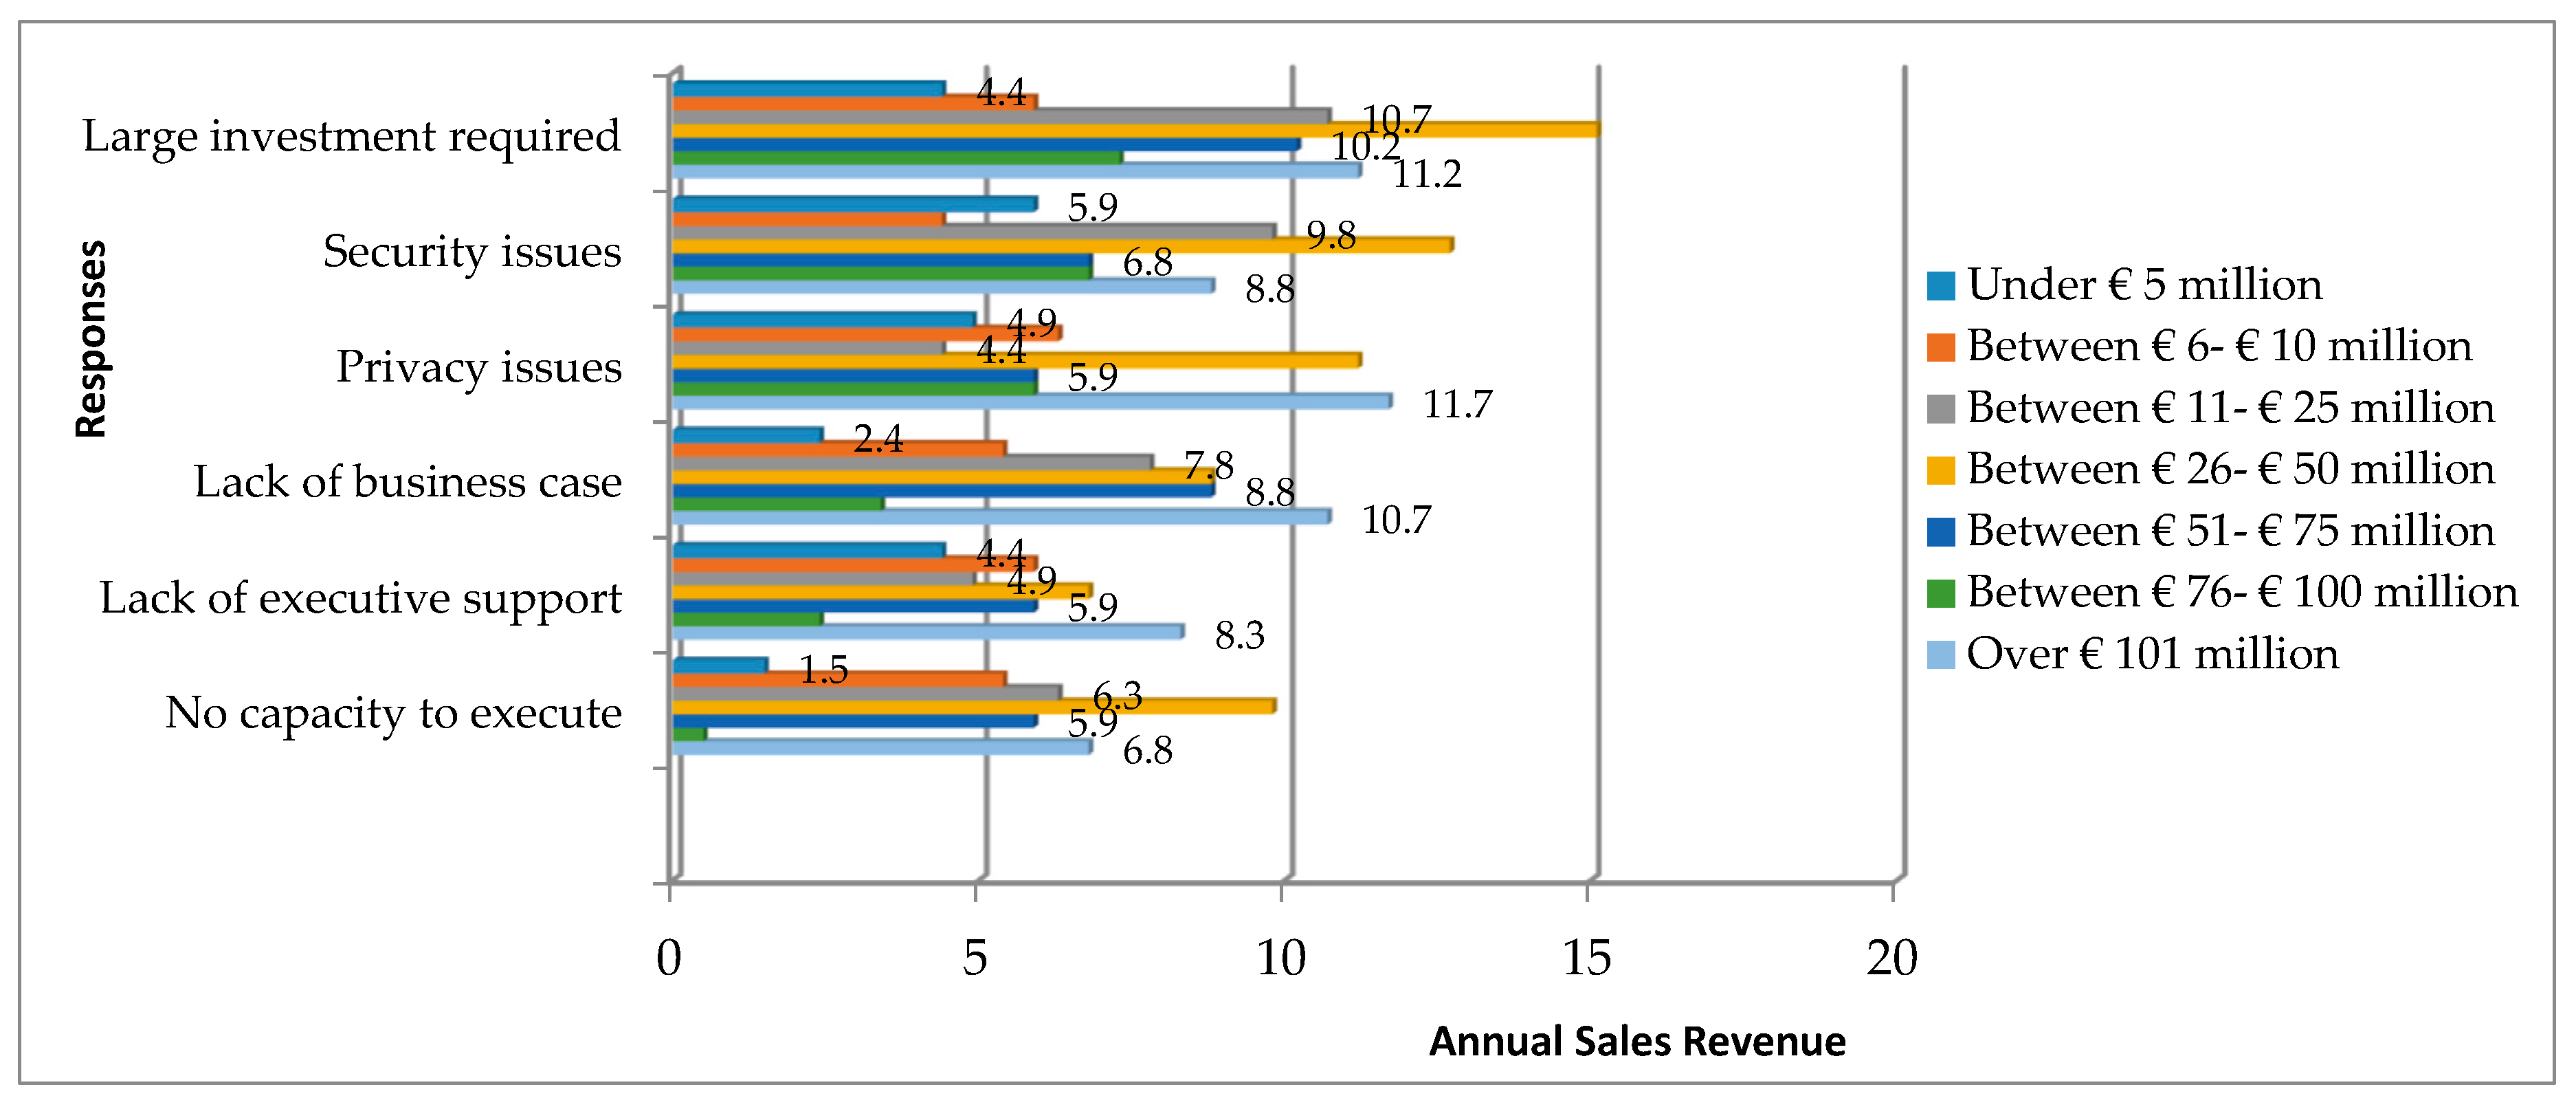
From the analysis of the answers, it can be seen that there are certain differences between companies (grouped by income-based size) regarding the difficulties encountered in the process of BDA implementation in SCM. Managers of companies with annual sales revenue up to €10 million said that the first three potential barriers to implementation were “Large investment required” (10.3%), “Security issues” (10.3%), and “Lack of executive support” (10.3%). Companies with annual sales revenues of over €11 million encountered obstacles related to “Large investment required” (54.6%), “Security issues” (44.8%), and “Privacy issues” (39%). All respondents faced difficulties involving “Lack of business case” (47.3%), “Lack of executive support” (38.5%), and “No capacity to execute” (36.1%) (Figure 1).
The second research goal (O2) was to identify companies adopting a strategy for implementing BDA in SCM and determining their main development priorities. Using the same chi-square test, some differences can be seen between company size and BDA implementation strategy. Study results indicate that 9 out of 10 companies adopted a strategy for implementing BDA that also involved the SC; 23 companies of the sample (with up to 249 employees) had not yet adopted a strategy (Table 3). In the subgroups of companies with more than 50 employees, the observed strategy is higher than expected (51 > 48.8, 61 > 54.2, and 46 > 40.8) and in the absence of BDA strategy the expected frequency is higher than the observed (6.2 > 4, 6.8 > 0, and 5.2 > 0).
From the data presented in Figure 2, it is noted that 38.5% (79) of the managers of companies included in the survey sample stated that they adopted an enterprise-wide strategy that includes, among other things, the SC. Only 35.6% (73) of surveyed companies had adopted a supply-chain-specific strategy for BD, while only 11.2% (23) had applied a BD strategy in some form for some processes.
The difference is also confirmed by applying the chi-square (X2) test, which means the existence of a link between two variables (Table 4). The calculated value of X2calc is 65,002, higher than X20.05;4 = 9.49, so hypothesis H2 is accepted, which means that we can guarantee with 95% probability that there is a connection between the variables company size and strategy for implementing BDA.
It is noted that all calculated coefficients (Phi, Cramer’s and Contingency Coefficient) have small values (close to zero) and the significance levels are less than 0.05, so we can identify a weak link between company size and adoption of a strategy for implementing BDA (Table 5).
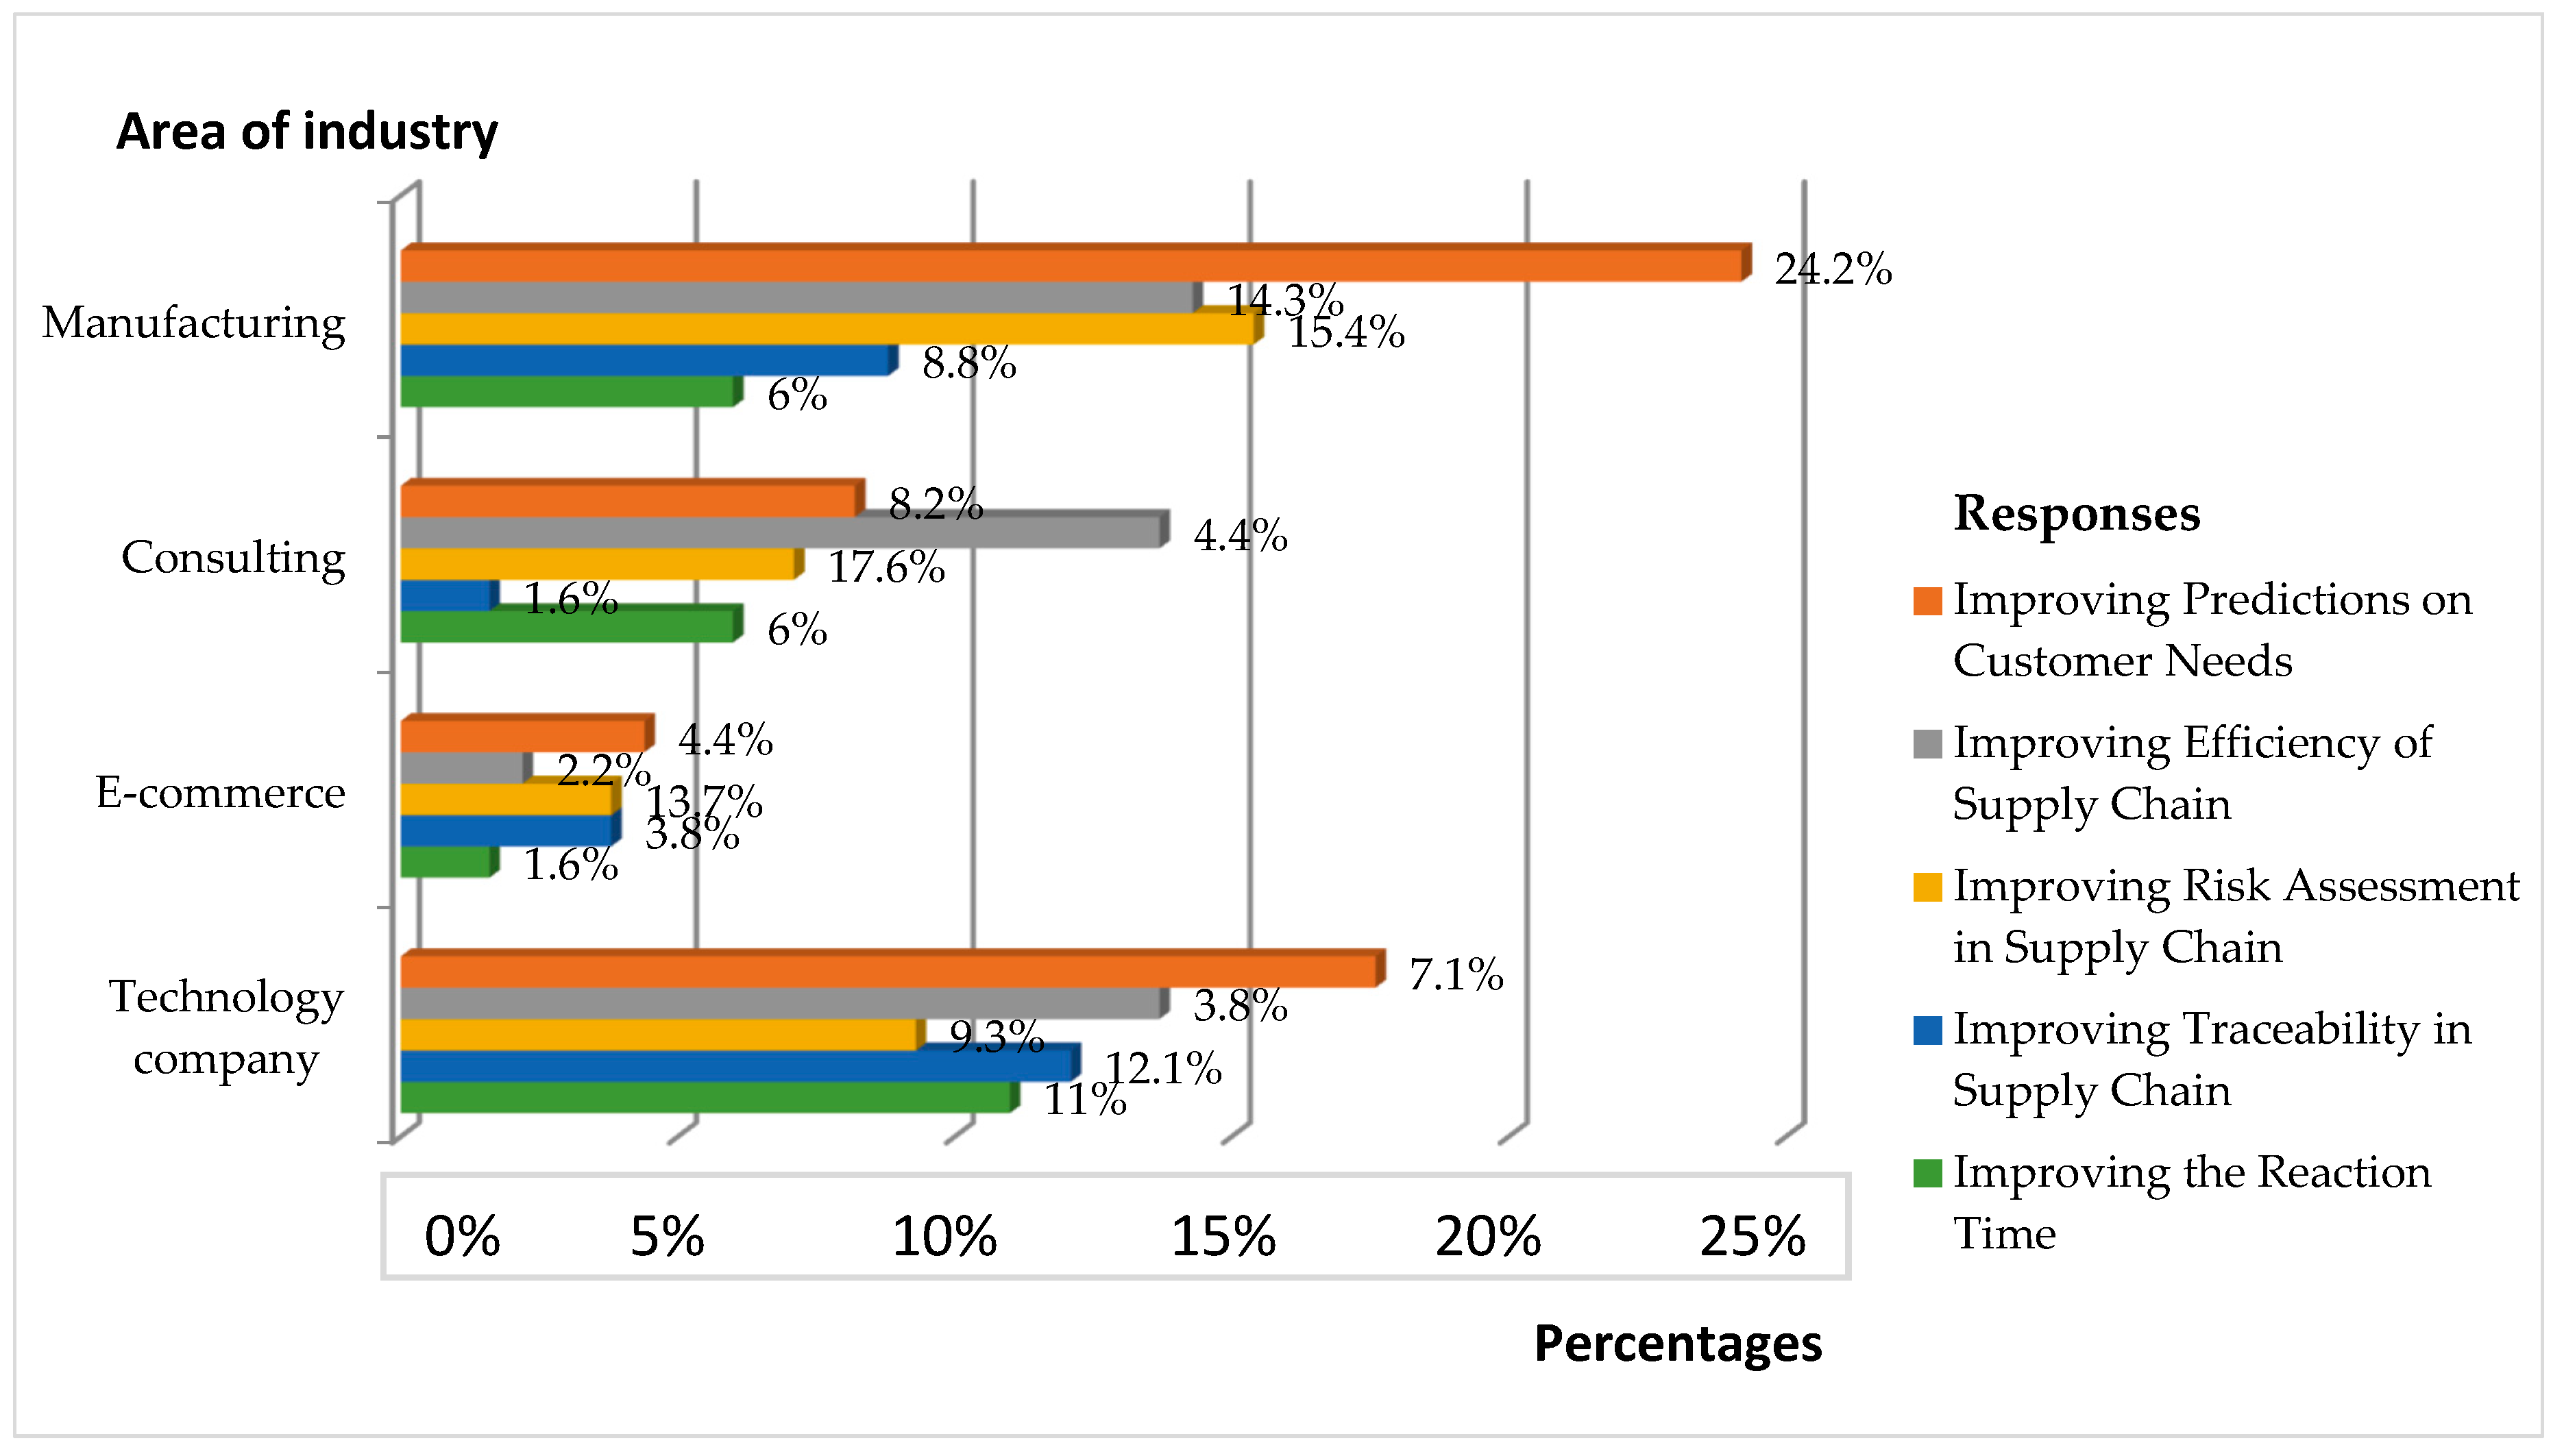
The results show that 24.2% of companies in manufacturing have adopted a strategy based on improving predictions of customer needs. Similarly, 7.1% of technology companies and 4.4% of e-commerce companies said improving predictions of customer needs is the top strategic priority in implementing BDA. Only companies in consulting (4.4%) recognize that improving the efficiency of the supply chain is the priority in their own strategy (Figure 3).
The third research goal (O3) was to identify the existence of professional capabilities needed to develop insights through BDA.
The distribution of companies by professional capability to develop insights through BDA based on years of operating experience is presented in Table 6. Of the 18 companies that do not have such professional capacity, 13 have a history in the Romanian market up to 5 years. Of the 187 companies that have this professional capacity, 46.56% have been in the domestic market for up to 5 years and 26.2% for up to 10 years.
As indicated in Table 6, the observed and expected frequencies in all subgroups formed by crossing the variables occupational capabilities and years of operational experience have different but close values. For companies with experience of up to five years, the observed professional capacity is higher than expected (40 > 37.4 and 87 > 85.7), with a corresponding decrease if there is no capacity, for which the expected frequency is greater than the observed (3.6 > 1 and 8.3 > 7).
For number of degrees of freedom df = 3, the critical ratio is 8.570 and the significance level is 0.036, less than p = 0.05. Therefore, the hypothesis is rejected, and the alternative hypothesis is accepted, according to which there is a connection between years of operational experience and professional capability to develop insights through BDA (Table 7).
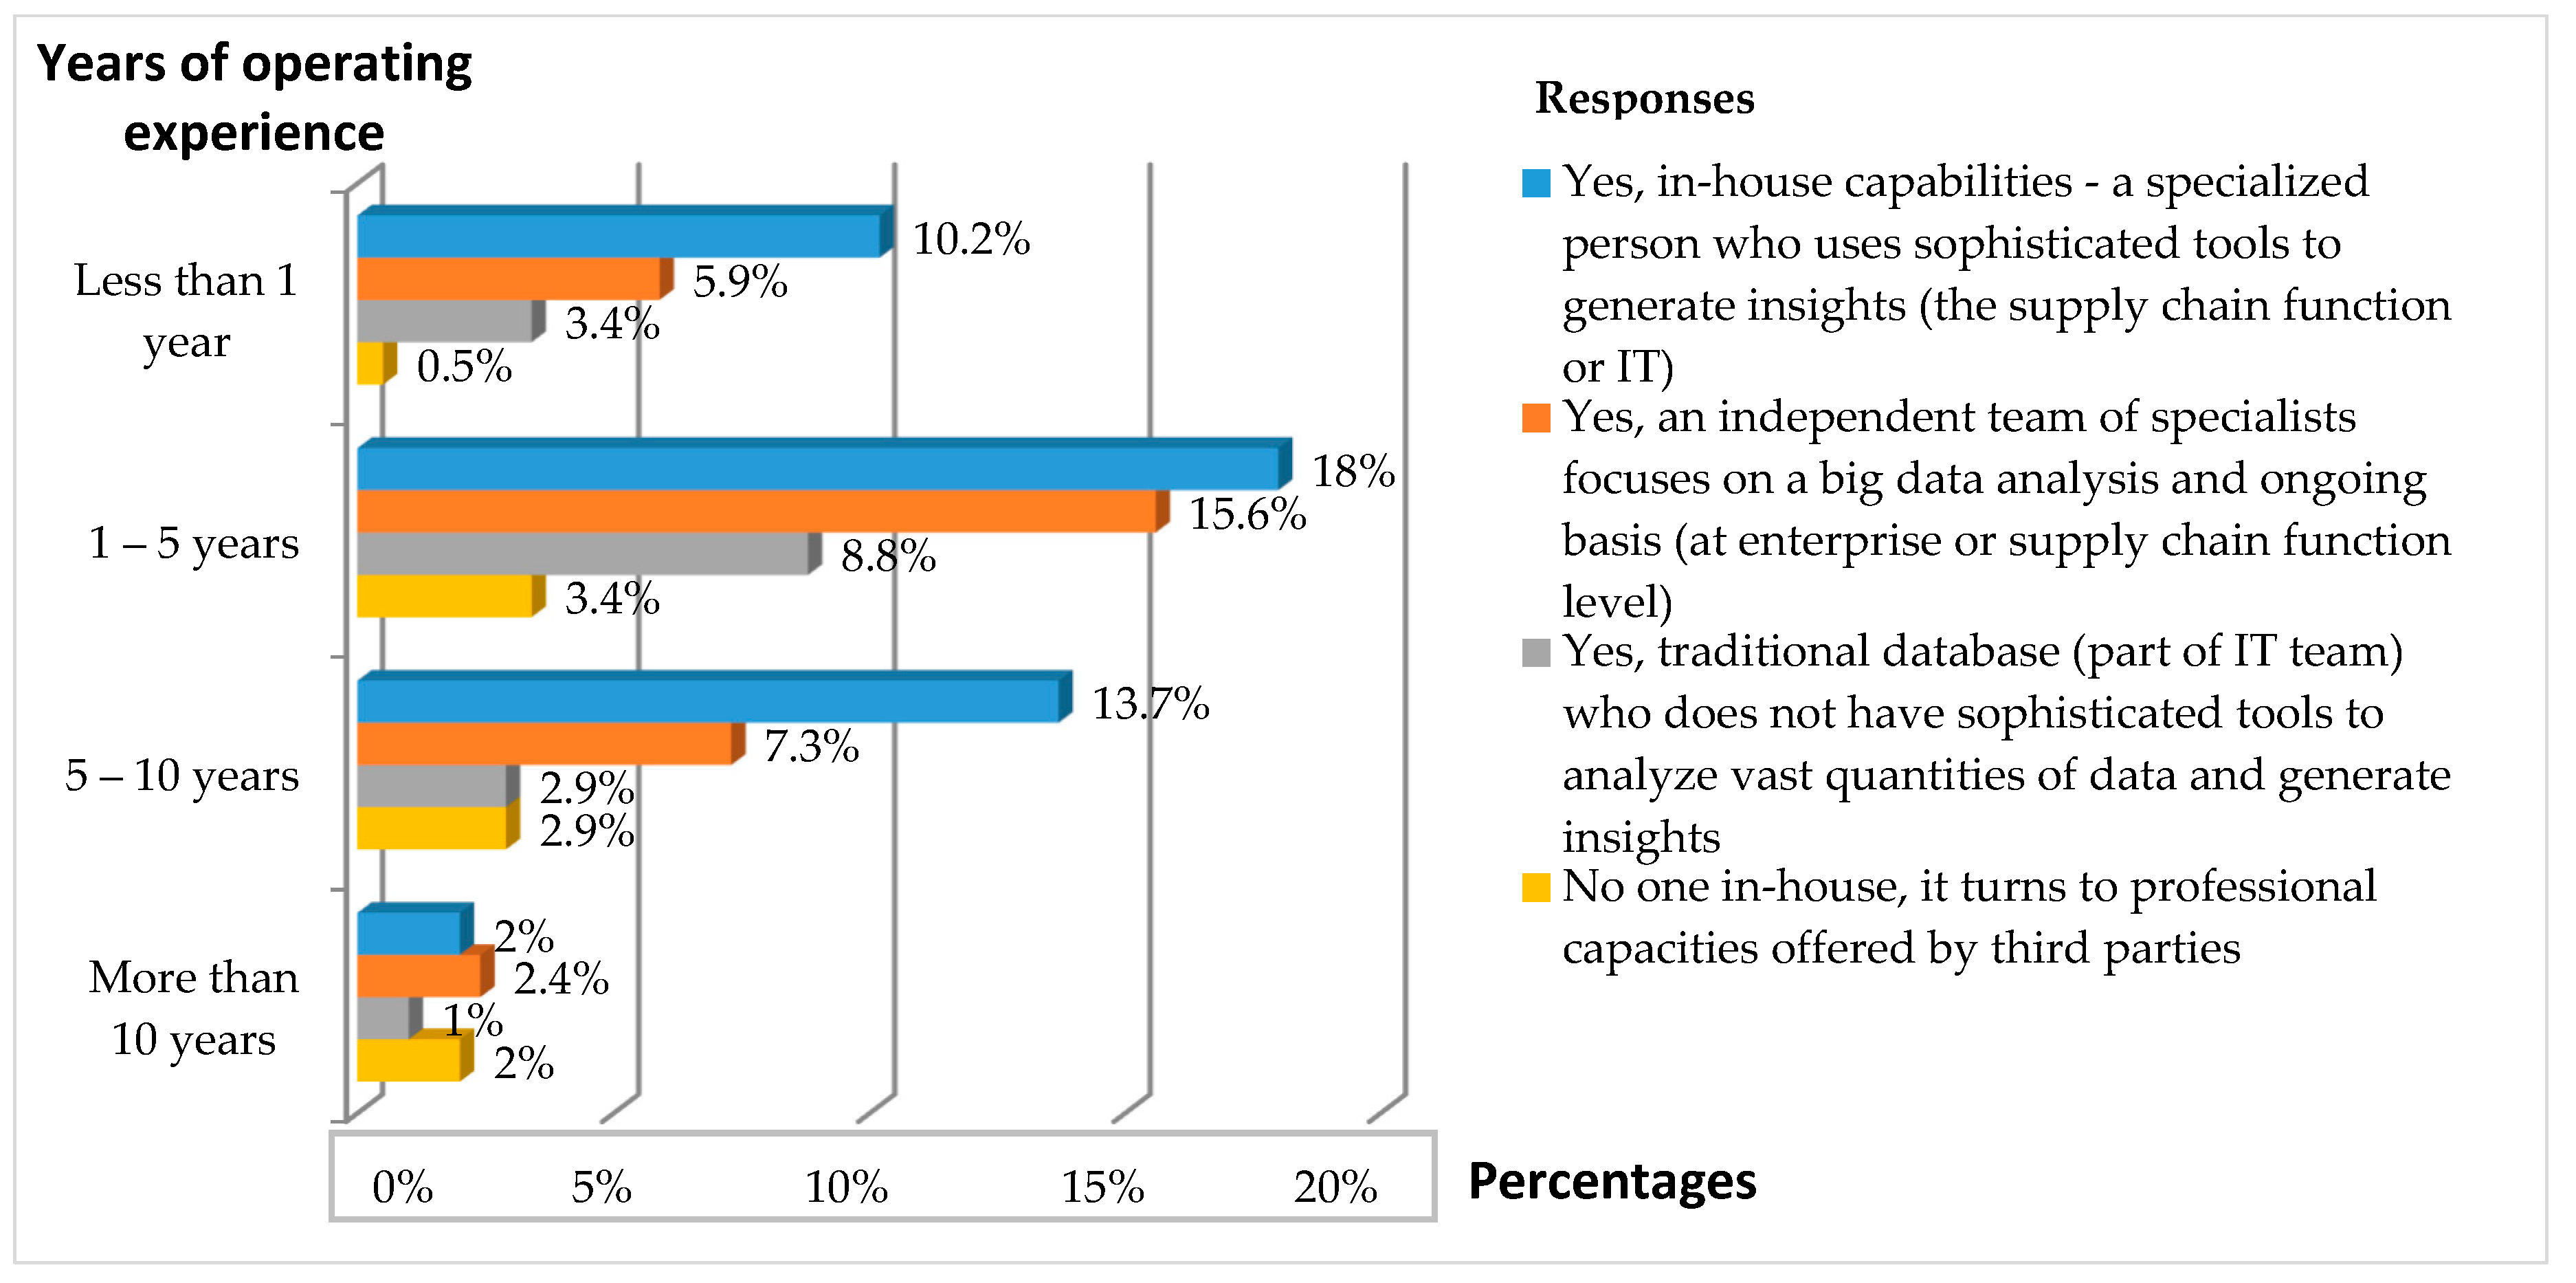
Of the 68 companies (31.2%) that have an independent team of data specialists focused on BDA on an ongoing basis, only 21.5% have up to five years of operating experience and 9.7% have over five years. Four out of 10 companies surveyed said they had a specialist in the IT or supply department with the necessary training who knows how to use sophisticated tools to generate insights (Figure 4). Analyzing the managers’ responses, we can say that most of the companies that did not resort to professional capacities offered by third parties hesitated or were not able to attract specialized personnel with training in the use of sophisticated tools to generate insights or this priority was not included in their strategy.
The fourth objective (O
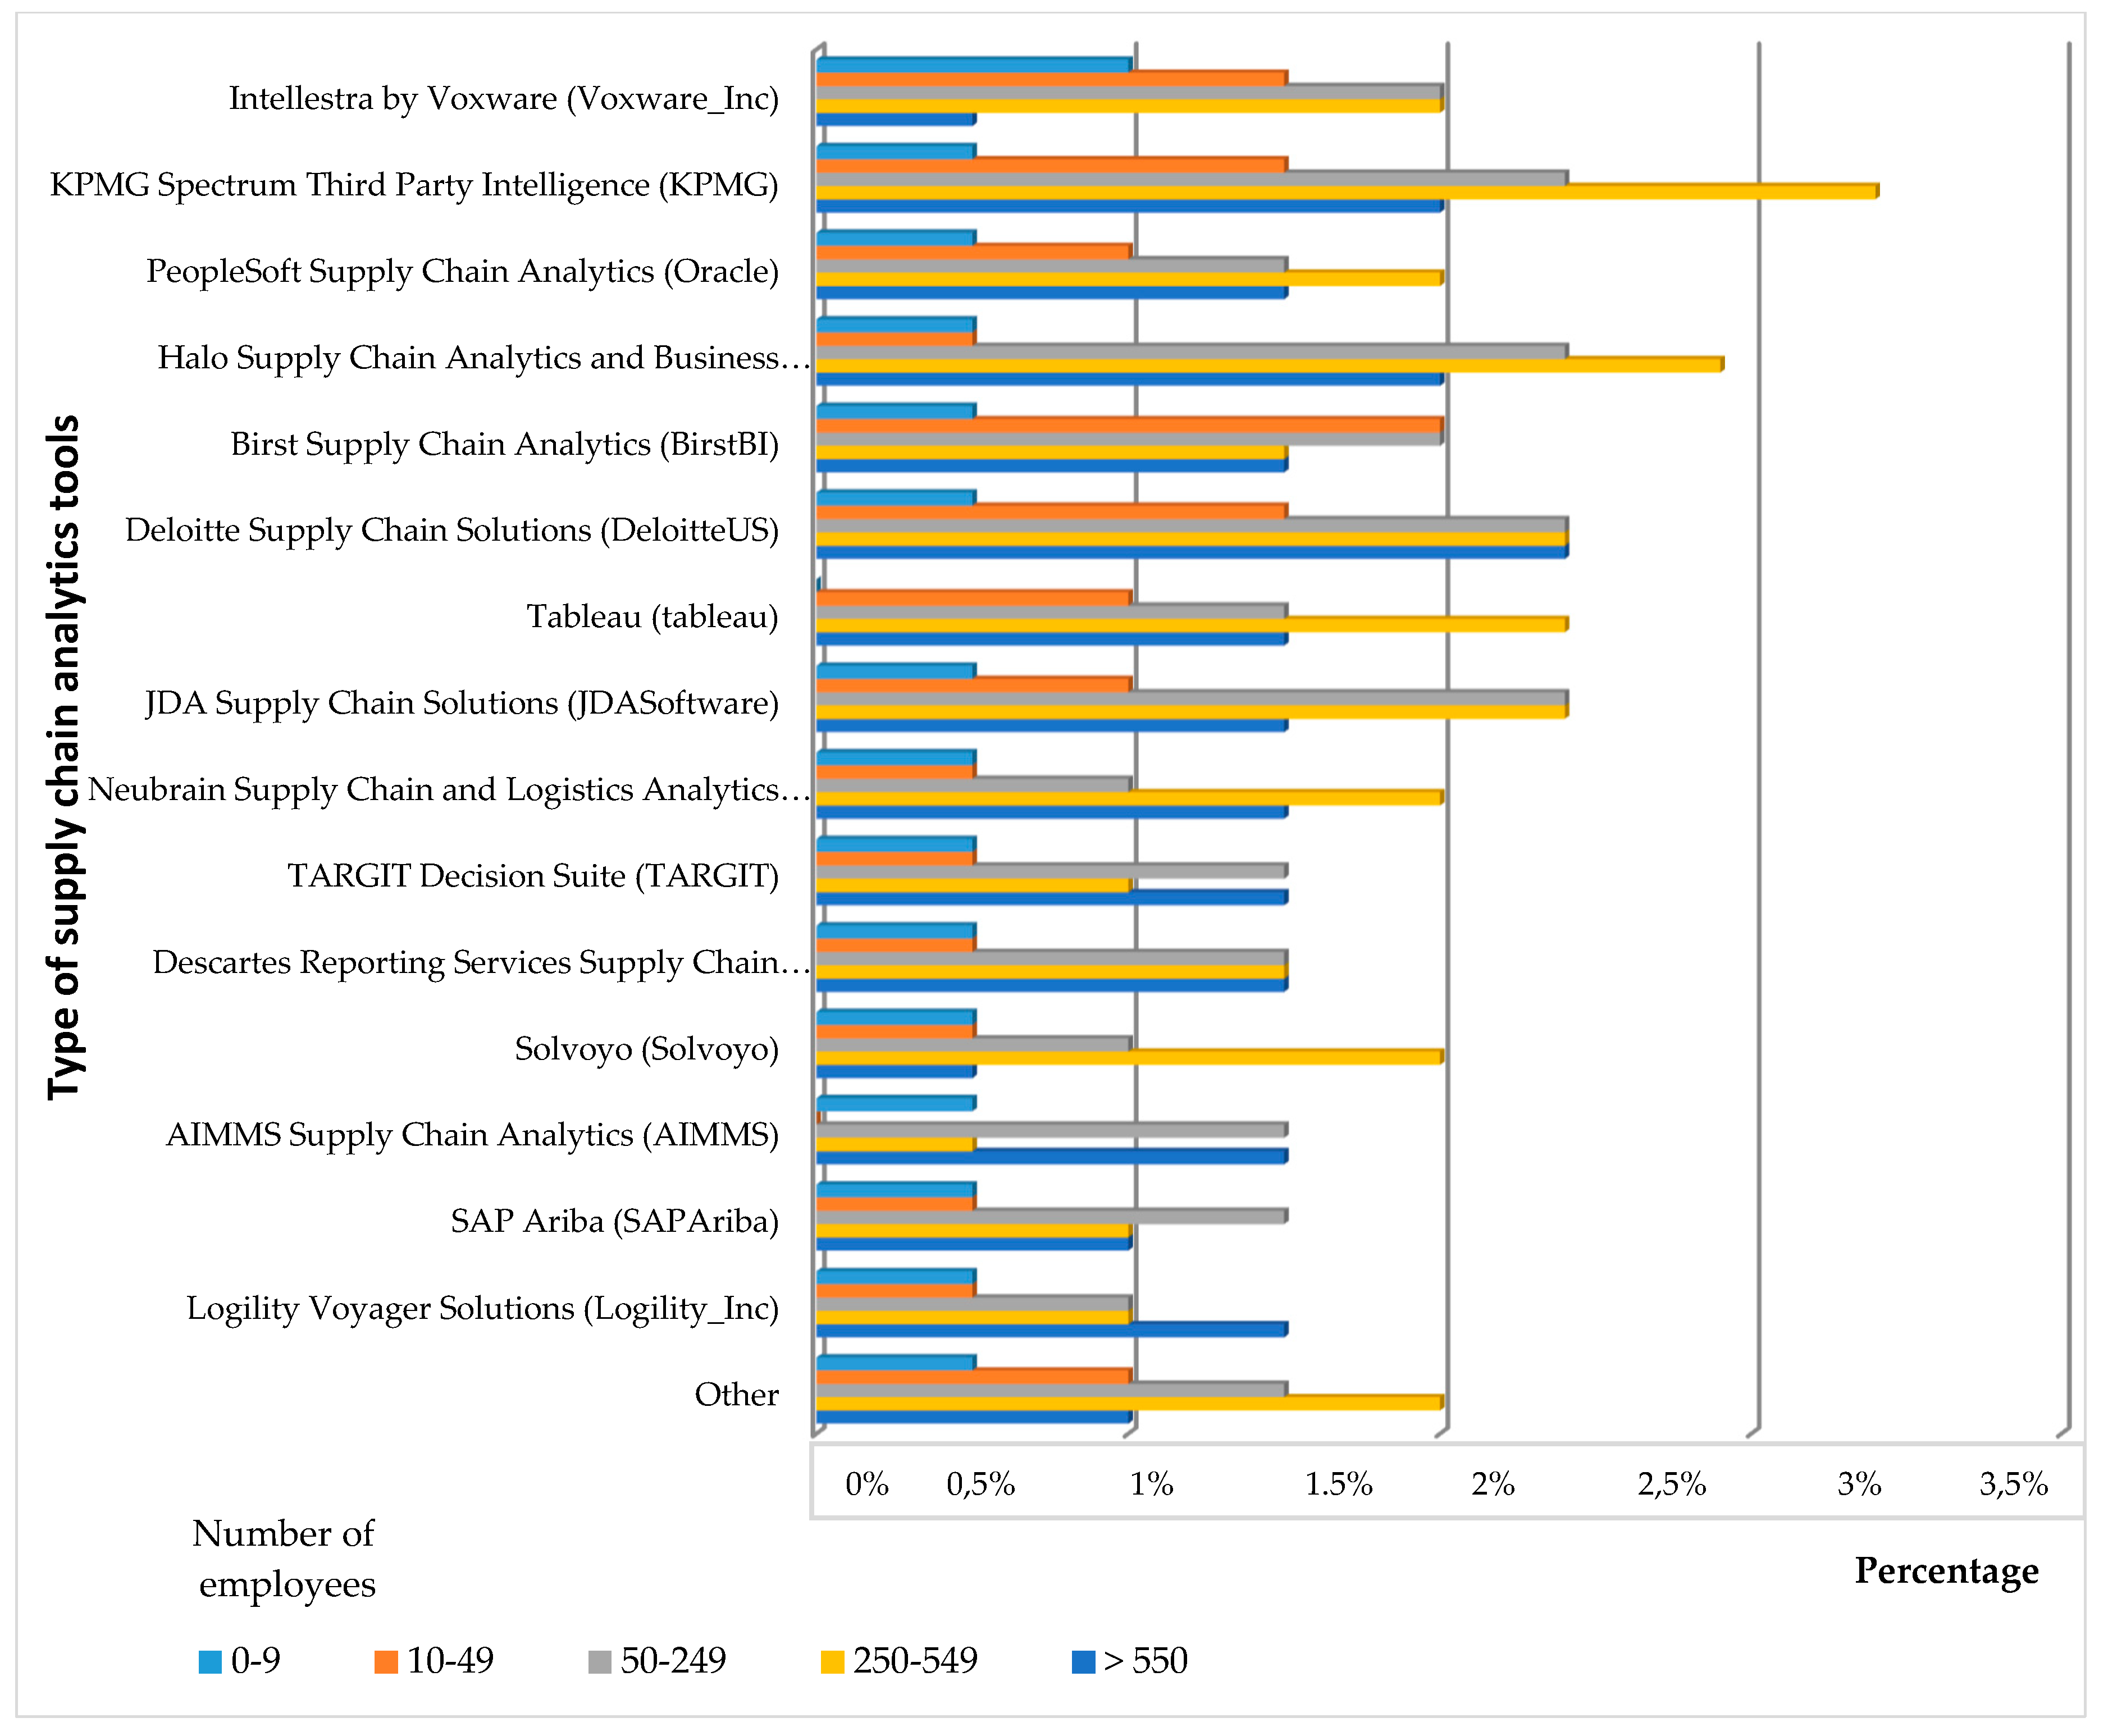
4) was to identify the supply-chain analytics tools used by companies and the future intended implementation of new tools and technologies to gain valuable supply-chain insights. Large companies (with more than 250 employees) use several supply-chain analytics tools, including KPMG Spectrum Third-Party Intelligence, Halo Supply-Chain Analytics and Business Intelligence Software, and Neubrain Supply Chain and Logistics Analytics Software (Figure 5). Deloitte Supply-Chain Solutions, KPMG Spectrum Third-Party Intelligence, and SAP Ariba are useful software solutions preferred by companies with more than 550 employees. About 5.9% of sample companies use other software solutions and data analytics tools such as Relax, FusionOps, Blue Ridge Supply-Chain Analytics and Inventory Analytics Software, IMI Supply-Chain Analytics, and Qlik Supply-Chain Analytics.
Given the company’s intention to deploy new tools and technologies to gain valuable supply-chain insights, only 41% of entities are interested in engaging in such actions; the remaining 59% have not allocated budgets for such initiatives.
To verify hypothesis H4, that most Romanian companies intend to implement new tools and technologies to gain valuable supply-chain insights, Student’s t-test was used. Table 8 shows the statistical significance of the difference between the percentage of companies that want to implement new techniques (41%) and the value of the test (50%), given that most of the Romanian entities want to be involved in such future actions.
Table 8 shows the value of the critical ratio tcalc = −2.621, which is less than the value in the distribution law table of the unilateral right test t0.05;205 = 1.64. Moreover, the significance level p = 0.009 < 0.05, and the difference between the two values is negative. We therefore accept the null hypothesis (H4); we cannot guarantee with 95% probability that the percentage of companies in the population surveyed is more than 50% and we reject the alternative hypothesis.
The fifth objective of the research (O
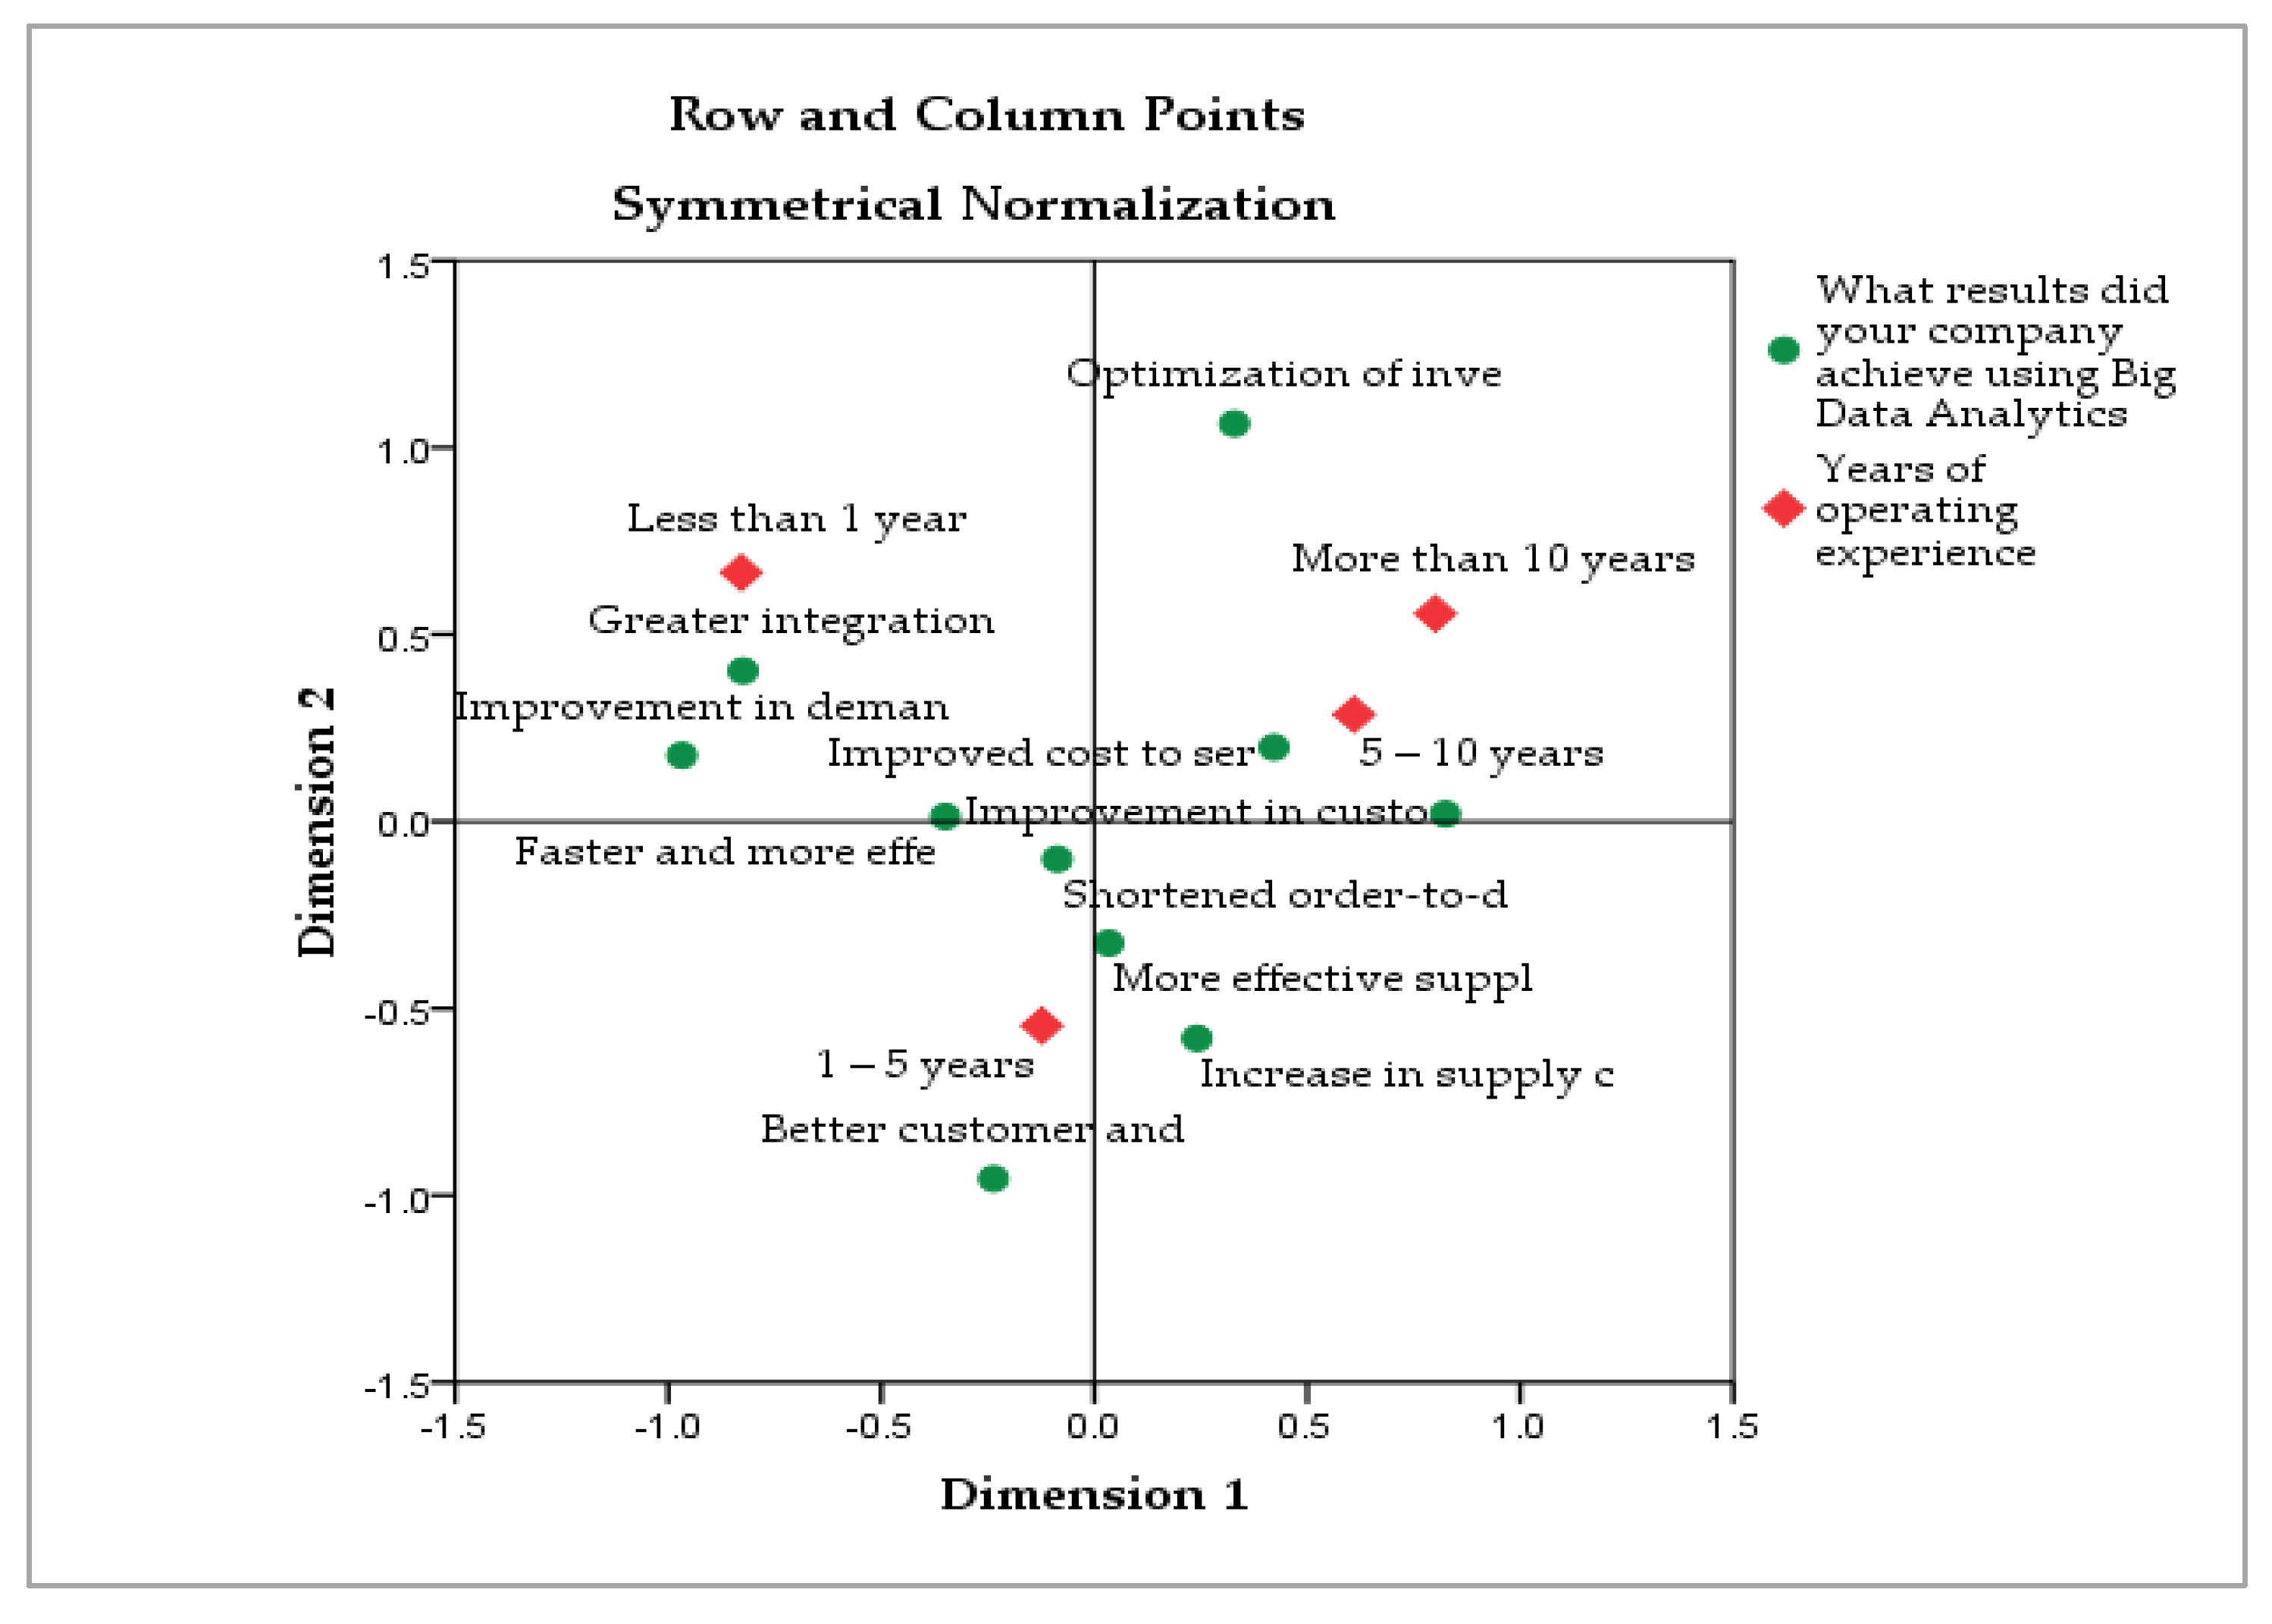
5) was to highlight the results obtained by companies following the use of BDA in SCM. Correspondence factor analysis was used to describe the relationship between the variables years of operating experience and results obtained after using BDA in SCM. The analysis of the data in Table 9 indicates that the calculated value of the test X2calc is 37.650 and the minimum significance level is 0.048 < 0.050, therefore the alternative hypothesis is accepted (i.e., the distribution of the variable differs from the normal distribution). Here, too, we can see that the first component explains a spread of 46.1%, the second of 39.7%, and the last one of 14.2%.
Companies with more than five years’ seniority are in opposition to the group of companies with less than one year and between one and five years. They are strongly associated with benefits such as “Improvement in customer service and demand fulfillment,” “Improved cost to serve,” “Increase in supply-chain efficiency,” and “Optimization of inventory and asset productivity.” Other companies with less than one year’s seniority in the domestic market indicated “Greater integration across the supply chain” and “Optimizing inventory and asset productivity” (Figure 6).
Instead, the fewer benefits that have been gained by companies operating in the market for nearly five years have been linked to “Optimized inventory and asset productivity,” “Shortened order-to-delivery cycle times,” “Improvement in demand driven operations,” and “Improved cost to serve.” However, benefits such as “Increase in supply-chain efficiency,” “Better customer and supplier relationships,” “Faster and more effective response time to supply-chain issues,” and “More efficient supply and operation process and decision-making” have been strongly associated with these companies.
The ultimate goal of the research (O6) was to measure the influence of experience, strategy, professional capabilities, annual sales revenue, and industry on the future intention of companies to implement new tools and technologies to gain valuable supply chain insights.
In the binary logistic regression model, the following independent variables (factorials) are included: Experience (x1), Annual Sales Revenue (x2), Strategy (x3), Professional Capabilities (x4), and Industry (x5). The use of these variables is required to test hypotheses H5–H9.
The dependent variable included in the model is given by the future intention of companies to implement new tools and technologies to obtain valuable supply-chain insights. Table 10 presents empirical model parameter estimates using the binary logistic regression method.
Using the model’s coefficients (B) from Table 10, we completed the binary logistic regression as Equation (2):
P ( y = 1 x 1 , x 2 ) = exp ( 1.269 + 1.097   E x p e r i e n c e + 1.023   A n n u a l   S a l e s   R e v e n u e ) 1 + exp ( 1.269 + 1.097   E x p e r i e n c e + 1.023   A n n u a l   S a l e s   R e v e n u e )
The probability of engaging in future actions to implement new tools and technologies to gain valuable supply-chain insights is high for companies with high annual sales revenue (0.030 < 0.05 (Sig.)), they have the professional capabilities to develop insights through big data analytics (0.029 < 0.05 (Sig.)) and greater experience in implementing analytics in the supply chain (0.007 < 0.05 (Sig.)). The probability is low that the industry (0.326 > 0.05 (Sig.)) and adoption strategy for implementing big data analytics (0.875 > 0.05 (Sig.)) will influence these actions.
The results obtained from testing the binary logistic regression model indicate that at a confidence level of 95%, hypotheses H6 and H9 are rejected and hypotheses H5, H7, and H8 are valid.

5. Conclusions

Massive volumes of data coming from different sources have a positive effect on real-time decision-making. The variety of data sources, the quality of the data to be integrated, and their visualization are some of the challenges for big data analytics integration. The survey results indicate that 80% of Romanian companies have accumulated big data analytics experience, integrating different software solutions into the supply chain. Big companies (with more than 250 employees) allocate large annual budgets to undertake projects aimed at implementing big data analytics in the supply chain or to employ specialists in the field. The difficulties encountered in the implementation of big data analytics in the supply chain by companies with annual sales revenues of up to €10 million are related to large investment requirements, security issues, and lack of executive support. Entities with annual sales over €11 million have encountered obstacles related to security and privacy issues.
Moreover, 90% of respondents have adopted an enterprise-wide strategy (that includes the supply chain), facilitating the use of big data to add business value. Some of these entities have adopted a dedicated supply-chain strategy (35.6%), and 11.2% have applied a big data strategy in some form for some processes. Some manufacturing (24.2%) and e-commerce (4.4%) companies have adopted a strategy that focuses on improving predictions of customer needs, while consulting companies (4.4%) have as a priority improving the efficiency of the supply chain. To develop insights through big data analytics, Romanian companies need professional capabilities; about 91.22% of entities use such capacities and are 5–10 years old. Of these, 43.9% have a specialized team using sophisticated tools to generate insights, 31.2% have an independent team, and 16.1% have a traditional database (part of the IT team).
Company managers admit that technological changes have changed work processes lately, with investments in training and staff development for large data analytics needed. Companies with over five years of experience in the market that have benefited from the expertise of specialists have achieved results including “Improvement in customer service and demand fulfillment,” “Improved cost to serve,” “Increase in supply-chain efficiency,” and “Optimization of inventory and asset productivity.” Other companies that are smaller and newer in the Romanian landscape, benefiting from the support of teams of specialists, have obtained results related to “Greater integration across the supply chain,” “Faster and more efficient response time to supply-chain issues,” and “Optimization of inventory and asset productivity.”
Managers agree that new capabilities and technologies are needed to transform, manage, and analyze company-wide information. The main challenges they face are the acceptance and use of new technologies, as well as their regulation. The most notable problems to overcome are based on the difficulty of analyzing large volumes of data to achieve timely accurate results, and the need for standardization, interoperability, security, confidentiality, expertise, and funding to develop big data analytics infrastructure and integrate sets of already available data.
Managers recognize that their concerns include identifying new methods, tools, and statistical technology approaches, such as cloud computing and security technologies, to be rigorously explored. Big data analytics is an opportunity to use new types of data to create more agile businesses to solve problems that were previously considered unsolvable, leading to better business results. This will lead to radical changes in business operations that change from the use of a model based mainly on the experience of decision-makers to an information model that gives real value to the business and organization itself.
Starting from the objectives presented and analyzed in our study, we propose the following possible future research directions: (1) Studying the opportunities, challenges, advantages and disadvantages of BD in large companies and/or SMEs in the state or private sector; (2) Studying how BD systematically affects the economic value in the business environment; (3) Studying the implementation of BD in various sectors of activity and the efficiency of using the information obtained in making decision process; (4) Studying the capabilities and benefits of using BDA in optimizing SCM; (5) Studying the impact of BDA on SCM by using various tools dedicated to analyzing information.

Author Contributions

Conceptualization, I.O. and S.C.; Methodology, M.C.T., O.C.B., and D.I.T.; Validation, M.C.T. and S.C.; Formal Analysis, I.O. and A.S.T.; Writing—Original Draft Preparation, S.C. and M.C.T.; Writing—Review and Editing, I.O., I.-S.R., and M.Ș.H.

Funding

This research received no external funding.

Conflicts of Interest

The authors declare no conflict of interest.

Appendix A

Table A1. Method of Sampling.
IndicatorsFrequencyPercent (%)
Number of employees0–9167.8
10–492713.2
50–2495526.8
250–5496129.8
>5504622.4
Industry7536.675
4220.542
199.319
6933.769
Annual sales revenueUnder €5 million167.8
€6–10 million2311.2
€11–25 million3115.1
€26–50 million4522.0
€51–75 million3014.6
€76–100 million199.3
Over €101 million4120.0
Years of operating experienceLess than 1 year4120.0
1–5 years9445.9
5–10 years5526.8
More than 10 years157.3
Total205100.0

References

  1. Türkeș, M.C.; Oncioiu, I.; Aslam, H.D.; Marin-Pantelescu, A.; Topor, D.I.; Căpușneanu, S. Drivers and barriers in using industry 4.0: A perspective of SMEs in Romania. Processes 2019, 7, 153. [Google Scholar] [CrossRef]
  2. Manyika, J.; Chui, M.; Brown, B.; Bughin, J.; Dobbs, R.; Roxburgh, C.; Byers, A.H. Big Data: The Next Frontier for Innovation, Competition and Productivity; Mckinsey Global Institute: New York, NY, USA, 2016; Available online: https://www.mckinsey.com/business-functions/digital-mckinsey/our-insights/big-data-the-next-frontier-for-innovation (accessed on 10 March 2019).
  3. Hellerstein, J. Parallel Programming in the Age of Big Data. Available online: https://gigaom.com/2008/11/09/mapreduce-leads-the-way-for-parallel-programming/ (accessed on 11 September 2008).
  4. Lohr, S. The Age of Big Data. The New York Times. 2012. Available online: https://www.nytimes.com/2012/02/12/sunday-review/big-datas-impact-in-the-world.ht (accessed on 20 June 2019).
  5. Kubick, W.R. Big data, information and meaning. Appl. Clin. Trials 2012, 21, 26–28. [Google Scholar]
  6. Wisner, J.; Tan, K.C.; Leong, G.K. Principles of Supply Chain Management: A Balanced Approach, 4th ed.; Cengage Learning: Boston, MA, USA, 2012. [Google Scholar]
  7. Laney, D. 3D data management: Controlling data volume, velocity and variety. META Group Res. Note 2001, 6, 1. [Google Scholar]
  8. Beyer, M.A.; Laney, D. The Importance of “Big Data”: A Definition; Gartner Publications: Stamford, CT, USA, 2012. [Google Scholar]
  9. Sun, E.W.; Chen, Y.T.; Yu, M.T. Generalized optimal wavelet decomposing algorithm for big financial data. Int. J. Prod. Econ. 2015, 165, 194–214. [Google Scholar] [CrossRef]
  10. Wamba, S.F.; Akter, S.; Edwards, A.; Chopin, G.; Gnanzou, D. How ‘big data’ can make big impact: Findings from a systematic review and a longitudinal case study. Int. J. Prod. Econ. 2015, 165, 234–246. [Google Scholar] [CrossRef]
  11. Assunção, M.D.; Calheiros, R.N.; Bianchi, S.; Netto, M.A.S.; Buyya, R. Big data computing and clouds: Trends and future directions. J. Parallel Distrib. Comput. 2015, 79, 3–15. [Google Scholar] [CrossRef]
  12. Emani, C.K.; Cullot, N.; Nicolle, C. Understandable big data: A survey. Comput. Sci. Rev. 2015, 17, 70–81. [Google Scholar] [CrossRef]
  13. Chen, C.L.P.; Zhang, C.Y. Data-intensive applications, challenges, techniques and technologies: A survey on big data. Inf. Sci. 2014, 275, 314–347. [Google Scholar] [CrossRef]
  14. Tan, K.H.; Zhan, Y.; Ji, G.; Ye, F.; Chang, C. Harvesting big data to enhance supply chain innovation capabilities: An analytic infrastructure based on deduction graph. Int. J. Prod. Econ. 2015, 165, 223–233. [Google Scholar] [CrossRef]
  15. Gandomi, A.; Haider, M. Beyond the hype: Big data concepts, methods, and analytics. Int. J. Inf. Manag. 2015, 35, 137–144. [Google Scholar] [CrossRef] [Green Version]
  16. White, M. Digital workplaces: Vision and reality. Bus. Inf. Rev. 2012, 29, 205–214. [Google Scholar] [CrossRef]
  17. Lee, A.H.I.; Kang, H.-Y.; Ye, S.-J.; Wu, W.-Y. An integrated approach for sustainable supply chain management with replenishment, transportation, and production decisions. Sustainability 2018, 10, 3887. [Google Scholar] [CrossRef]
  18. Oracle. Big Data for the Enterprise; Oracle: Redvud, CA, USA, 2012. [Google Scholar]
  19. Tsai, C.-W.; Lai, C.-F.; Chao, H.-C.; Vasilakos, A.V. Big data analytics: A survey. J. Big Data 2015, 2, 21. [Google Scholar] [CrossRef]
  20. Chae, B.; Sheu, C.; Yang, C.; Olson, D. The impact of advanced analytics and data accuracy on operational performance: A contingent resource based theory (RBT) perspective. Decis. Support Syst. 2014, 59, 119–126. [Google Scholar] [CrossRef] [Green Version]
  21. Lustig, I.; Dietrich, B.; Johnson, C.; Dziekan, C. The analytics journey. Anal. Mag. 2010, 3, 11–13. [Google Scholar]
  22. Zeng, X.; Lin, D.; Xu, Q. Query performance tuning in supply chain analytics. In Proceedings of the 4th International Conference on Computational Sciences and Optimization (CSO), Kunming and Lijang City, China, 15–19 April 2011; p. 327. [Google Scholar]
  23. Siegel, E. Predictive Analytics: The Power to Predict Who Will Click, Buy, Lie, or Die; Wiley Publishing: Hoboken, NJ, USA, 2013. [Google Scholar]
  24. Christopher, M. Logistics & Supply Chain Management, 4th ed.; FT Prentice Hall: Upper Saddle River, NY, USA, 2011. [Google Scholar]
  25. Halo. Descriptive, Predictive, and Prescriptive Analytics Explained. 2018. Available online: https://halobi.com/blog/descriptive-predictive-and-prescriptive-analytics-explained/ (accessed on 22 June 2019).
  26. Edwards, P.; Peters, M.; Sharman, G. The effectiveness of information systems in supporting the extended supply chain. J. Bus. Logist. 2001, 22, 1–27. [Google Scholar] [CrossRef]
  27. Smith, G.E.; Watson, K.J.; Baker, W.H.; Pokorski, J.A. A critical balance: Collaboration and security in the IT-enabled supply chain. Int. J. Prod. Res. 2007, 45, 2595–2613. [Google Scholar] [CrossRef]
  28. Antai, I.; Olson, H. Interaction: A new focus for supply chain vs. supply chain competition. Int. J. Phys. Distrib. Logist. Manag. 2013, 43, 511–528. [Google Scholar] [CrossRef]
  29. Barratt, M.; Oke, A. Antecedents of supply chain visibility in retail supply chains: A resource-based theory perspective. J. Oper. Manag. 2007, 25, 1217–1233. [Google Scholar] [CrossRef]
  30. Sanders, N.R. Big Data Driven Supply Chain Management: A Framework for Implementing Analytics and Turning Information into Intelligence, 1st ed.; Pearson: Hoboken, NJ, USA, 2014. [Google Scholar]
  31. Marabotti, D. Build supplier metrics, build better product. Quality 2003, 42, 40–43. [Google Scholar]
  32. Sahay, B.S.; Ranjan, J. Real time business intelligence in supply chain analytics. Inf. Manag. Comput. 2008, 16, 28–48. [Google Scholar] [CrossRef] [Green Version]
  33. Niu, S.; Zhuo, H.; Xue, K. DfRem-driven closed-loop supply chain decision-making: A systematic framework for modeling research. Sustainability 2019, 11, 3299. [Google Scholar] [CrossRef]
  34. O’Dwyer, J.; Renner, R. The promise of advanced supply chain analytics. Supply Chain Manag. Rev. 2011, 15, 32–37. [Google Scholar]
  35. Moro Visconti, R.; Morea, D. Big data for the sustainability of healthcare project financing. Sustainability 2019, 11, 3748. [Google Scholar] [CrossRef]
  36. Cheng, Y.; Kuang, Y.; Shi, X.; Dong, C. Sustainable investment in a supply chain in the big data era: An information updating approach. Sustainability 2018, 10, 403. [Google Scholar] [CrossRef]
  37. Xu, L.; Gao, R.; Xie, Y.; Du, P. To be or not to be? Big data business investment decision-making in the supply chain. Sustainability 2019, 11, 2298. [Google Scholar] [CrossRef]
  38. Du, B.; Liu, Q.; Li, G. Coordinating leader-follower supply chain with sustainable green technology innovation on their fairness concerns. Int. J. Environ. Res. Public Health 2017, 14, 1357. [Google Scholar] [CrossRef]
  39. Mani, V.; Delgado, C.; Hazen, B.T.; Patel, P. Mitigating supply chain risk via sustainability using big data analytics: Evidence from the manufacturing supply chain. Sustainability 2017, 9, 608. [Google Scholar] [CrossRef]
  40. Liu, L.; Li, F.; Qi, E. Research on risk avoidance and coordination of supply chain subject based on blockchain technology. Sustainability 2019, 11, 2182. [Google Scholar] [CrossRef]
  41. Zou, H.; Qin, J.; Yang, P.; Dai, B. A coordinated revenue-sharing model for a sustainable closed-loop supply chain. Sustainability 2018, 10, 3198. [Google Scholar] [CrossRef]
  42. Pinto, M.M.A.; Kovaleski, J.L.; Yoshino, R.T.; Pagani, R.N. Knowledge and technology transfer influencing the process of innovation in green supply chain management: A multicriteria model based on the DEMATEL Method. Sustainability 2019, 11, 3485. [Google Scholar] [CrossRef]
  43. Qian, C.; Wang, S.; Liu, X.; Zhang, X. Low-carbon initiatives of logistics service providers: The perspective of supply chain integration. Sustainability 2019, 11, 3233. [Google Scholar] [CrossRef]
  44. Persdotter Isaksson, M.; Hulthén, H.; Forslund, H. Environmentally sustainable logistics performance management process integration between Buyers and 3PLs. Sustainability 2019, 11, 3061. [Google Scholar] [CrossRef]
  45. Waller, M.A.; Fawcett, S.E. Data science, predictive analytics, and big data: A revolution that will transform supply chain design and management. J. Bus. Logist. 2013, 34, 77–84. [Google Scholar] [CrossRef]
  46. Accenture. Accenture Big Success with Big Data Survey. 2014. Available online: https://www.slideshare.net/polenumerique33/accenture-bigdatapov1 (accessed on 20 June 2019).
  47. Benabdellah, A.C.; Benghabrit, A.; Bouhaddou, I.; Zemmouri, E.M. Big data for supply chain management: Opportunities and challenges. In Proceedings of the IEEE/ACS 13th International Conference of Computer Systems and Applications (AICCSA), Agadir, Morocco, 29 November—2 December 2016. [Google Scholar]
  48. Bi, Z.; Cochran, D. Big data analytics with applications. J. Manag. Anal. 2014, 1, 249–265. [Google Scholar] [CrossRef]
  49. Chae, B. Insights from hashtag #supplychain and Twitter analytics: Considering Twitter and Twitter data for supply chain practice and research. Int. J. Prod. Econ. 2015, 165, 247–259. [Google Scholar]
  50. Li, J.; Tao, F.; Cheng, Y.; Zhao, L. Big data in product lifecycle management. Int. J. Adv. Manuf. Technol. 2015, 81, 667–684. [Google Scholar] [CrossRef]
  51. Hazen, B.T.; Boone, C.A.; Ezell, J.D.; Jones-Farmer, L.A. Data quality for data science, predictive analytics, and big data in supply chain management: An introduction to the problem and suggestions for research and applications. Int. J. Prod. Econ. 2014, 154, 72–80. [Google Scholar] [CrossRef]
  52. Singh, A.; Shukla, N.; Mishra, N. Social media data analytics to improve supply chain management in food industries. Transp. Res. Part E Logist. Transp. Rev. 2018, 114, 398–415. [Google Scholar] [CrossRef]
  53. Rozados, I.V.; Tjahjono, B. Big data analytics in supply chain management: Trends and related research. In Proceedings of the 6th International Conference on Operations and Supply Chain Management, Bali, Indonesia, 10–12 December 2014. [Google Scholar]
  54. Schoenherr, T.; Speier-Pero, C. Data science, predictive analytics, and big data in supply chain management: Current state and future potential. J. Bus. Logist. 2015, 36, 120–132. [Google Scholar] [CrossRef]
  55. Sheffi, Y. Preparing for disruptions through early detection preparing for disruptions through early detection. MIT Sloan Manag. Rev. 2015, 57, 31–42. [Google Scholar]
  56. Ramanathan, U.; Subramanian, N.; Parrott, G. Role of social media in retail network operations and marketing to enhance customer satisfaction. Int. J. Oper. Prod. Manag. 2017, 37, 105–123. [Google Scholar] [CrossRef] [Green Version]
  57. Sahin, F.; Robinson, E.P. Flow coordination and information sharing in supply chains: Review, implications, and directions for future research. Decis. Sci. 2002, 33, 505–536. [Google Scholar] [CrossRef]
  58. Saeed, K.A.; Malhotra, M.K.; Grover, V. Examining the impact of interorganizational systems on process Efficiency and sourcing leverage in buyer–supplier dyads. Decis. Sci. 2005, 36, 365–396. [Google Scholar] [CrossRef]
  59. Rai, A.; Patnayakuni, R.; Seth, N. Firm performance impacts of digitally enabled supply chain integration capabilities. MIS Q. 2006, 30, 225–246. [Google Scholar] [CrossRef]
  60. Eric, T.G.W.; Hsiao-Lan, W. Interorganizational governance value creation: Coordinating for information visibility and flexibility in supply chains. Decis. Sci. 2007, 38, 647–674. [Google Scholar]
  61. Wamba, F.S.; Lefebvre, L.A.; Bendavid, Y.; Lefebvre, É. Exploring the impact of RFID technology and the EPC network on mobile B2B eCommerce: A case study in the retail industry. Int. J. Prod. Econ. 2008, 112, 614–629. [Google Scholar] [CrossRef]
  62. Wamba, F.S. Achieving supply chain integration using RFID technology: The case of emerging intelligent B-to-B e-commerce processes in a living laboratory. Bus. Process Manag. J. 2012, 18, 58–81. [Google Scholar] [CrossRef]
  63. Asoo, J.V. E-business and supply chain management. Decis. Sci. 2002, 33, 495–504. [Google Scholar]
  64. Devaraj, S.; Krajewski, L.; Wei, J.C. Impact of eBusiness technologies on operational performance: The role of production information integration in the supply chain. J. Oper. Manag. 2007, 25, 1199–1216. [Google Scholar] [CrossRef]
  65. Sethuraman, M.S. Big Data’s Impact on the Data Supply Chain. In Cognizant 20–20 Insights; Cognizant: Teaneck, NJ, USA, 2012. [Google Scholar]
  66. Zhang, T. How do information technology resources facilitate relational and contractual governance in green supply chain management? Sustainability 2019, 11, 3663. [Google Scholar] [CrossRef]
  67. Vasan, S. Impact of Big Data and Analytics in Supply Chain Execution. Supply Chain Digital. 2014. Available online: https://www.supplychaindigital.com/logistics/impact-big-data-and-analytics-supply-chain-execution (accessed on 10 March 2019).
  68. Hagstrom, M. High-performance analytics fuels innovation and inclusive growth: Use big data, hyperconnectivity and speed to intelligence to get true value in the digital economy. J. Adv. Anal. 2012, 2, 3–4. [Google Scholar]
  69. Kenny, J. Big Data Can Have Big Impact on Supply Chain Management: The Use of Data Analytics Is Underused in Supply Chain Management to Minimize Risk Exposure; IC Inside Counsel. 2014. Available online: http://www.insidecounsel.com/2014/04/23/big-data-can-have-big-impact-on-supply-chain-manag (accessed on 10 March 2019).
  70. Moktadir, M.A.; Mithun Ali, S.; Kumar, P.S.; Shukla, N. Barriers to big data analytics in manufacturing supply chains: A case study from Bangladesh. Comput. Ind. Eng. 2019, 128, 1063–1075. [Google Scholar] [CrossRef]
  71. Trelles, O.; Prins, P.; Snir, M.; Jansen, R.C. Big data, but are we ready? Nat. Rev. Genet. 2011, 12, 224. [Google Scholar] [CrossRef]
  72. Malaka, I.; Brown, I. Challenges to the organisational adoption of big data analytics: A case study in the South African telecommunications industry. In Proceedings of the 2015 Annual Research Conference on South African Institute of Computer Scientists and Information Technologists, Stellenbosch, South Africa, 28–30 September 2015; pp. 1–9. [Google Scholar]
  73. Alharthi, A.; Krotov, V.; Bowman, M. Addressing barriers to big data. Bus. Horiz. 2017, 60, 285–292. [Google Scholar] [CrossRef]
  74. Gunasekaran, A.; Papadopoulos, T.; Dubey, R.; Wamba, S.F.; Childe, S.J.; Hazen, B.; Akter, S. Big data and predictive analytics for supply chain and organizational performance. J. Bus. Res. 2017, 70, 308–317. [Google Scholar] [CrossRef]
  75. Dubey, R.; Gunasekaran, A.; Childe, S.J.; Wamba, S.F.; Papadopoulos, T. The impact of big data on world-class sustainable manufacturing. Int. J. Adv. Manuf. Technol. 2016, 84, 631–645. [Google Scholar] [CrossRef]
  76. Fallik, D. For big data, big questions remain. Health Aff. 2014, 33, 1111–1114. [Google Scholar] [CrossRef]
  77. Zhong, R.Y.; Newman, S.T.; Huang, G.Q.; Lan, S. Big data for supply chain management in the service and manufacturing sectors: Challenges, opportunities, and future perspectives. Comput. Ind. Eng. 2016, 101, 572–591. [Google Scholar] [CrossRef]
  78. Alexandru, A.; Coardoş, D. Utilizarea Tehnologiilor Big Data şi IoT în Domeniul Sănătăţii. Rev. Română Inform. Autom. 2018, 28, 61–84. [Google Scholar]
  79. Vladimir, F.; Neagu, G. Abordări şi soluţii specifice în managementul, guvernanţa şi analiza datelor de mari dimensiuni (BigData). Rev. Română Inform. Autom. 2016, 26, 5–22. [Google Scholar]
  80. SN-ADR. Strategia Naţională Privind Agenda Digitală Pentru România 2020; Ministerul pentru Societatea Informaţională: Bucharest, Romania, 2015.
  81. Butilc, D.; Crişan, E.; Salanţă, I.; Ilieş, L. The adoption/adaption of the “supply chain” concept in Romanian. Annals Univ. Oradea 2011, 20, 657–668. [Google Scholar]
  82. Lupşe, V.; Cosma, O. ERP extension—Supply chain management (SCM). Inform. Econ. 2006, 38, 120–123. [Google Scholar]
  83. Fotache, D.; Hurbean, L. Supply chain management: From linear interactions to networked processes. Inform. Econ. 2006, 4, 73–77. [Google Scholar]
  84. Pelău, C. Structuri organizatorice la nivel de întreprindere pentru implementarea marketing-controllingului. Manag. Mark. Buchar. 2007, 1, 133–142. [Google Scholar]
  85. Cucui, G.; Ionescu, C.A.; Goldbach, I.R.; Coman, M.D.; Marin, E.L.M. Quantifying the economic effects of biogas installations for organic waste from agro-industrial sector. Sustainability 2018, 10, 2582. [Google Scholar] [CrossRef]
  86. Amancei, B. Managementul Lanţului de Aprovizionare-Noţiuni Teoretice, Viziuni Strategice şi Abordări Practice; Editura Universitară: București, Romania, 2009. [Google Scholar]
  87. Mocuţa, G.E. Logistica-instrument și concept în continuă evoluţie. Bul. AGIR 2009, 2–3, 88–93. [Google Scholar]
  88. Popa, V. Managementul Lantului de Distribuţie/Aprovizionare Pentru un Răspuns Eficient Consumatorului; Valahia University Press: Târgoviște, Romania, 2009. [Google Scholar]
  89. Felea, M.; Albăstroiu, I. Defining the concept of supply chain management and its relevance to Romanian academics and practitioners. Amfiteatru Econ. J. 2013, 15, 74–88. [Google Scholar]
  90. Batrancea, I.; Morar, I.-D.; Masca, E.; Catalin, S.; Bechis, L. Econometric modeling of SME performance. Case of Romania. Sustainability 2018, 10, 192. [Google Scholar] [CrossRef]
  91. Moanţă, D. The principles of an evolutionary algorithm for non-linear transportation. Econ. Comput. Econ. Cybern. Stud. Res. 2008, 42, 227–236. [Google Scholar]
  92. Dinu, V. The logistics of merchandise. Amfiteatru Econ. J. 2008, 10, 5–6. [Google Scholar]
  93. Vasiliu, C.; Dobrea, M. State of Implementation of supply chain management in companies in Romania. Amfiteatru Econ. J. 2013, 15, 44–55. [Google Scholar]
  94. Glaser-Segura, D.A.; Anghel, L.-D.; Tucci, J.E. Supply chain management and the Romanian transition. Amfiteatru Econ. 2006, 8, 18–26. [Google Scholar]
  95. Moss-Kanter, R. Collaborative advantage. Harv. Bus. Rev. 1994, 72, 96–112. [Google Scholar]
  96. Hair, J.F., Jr.; Black, W.C.; Babin, B.J.; Anderson, R.E. Multivariate Data Analysis with Readings; Prentice-Hall: Englewood Cliffs, NJ, USA, 1998. [Google Scholar]
Figure 1. Distribution of difficulties faced according to annual sales revenue.
Sustainability 11 04864 g001
Figure 2. Distribution of strategies according to company size.
Sustainability 11 04864 g002
Figure 3. Distribution of main development priorities of BDA for supply chain strategy according to industry.
Sustainability 11 04864 g003
Figure 4. Distribution of professional capabilities to develop insights via BDA according to years of operating experience.
Sustainability 11 04864 g004
Figure 5. Distribution of supply-chain analytics tools according to company size.
Sustainability 11 04864 g005
Figure 6. Graphical representation of the correspondence between the categories years of operating experience and results obtained after using big data analytics in the supply chain.
Sustainability 11 04864 g006
Table 1. Observed and expected frequencies. BDA, big data analytics; SC, supply chain.
Number of EmployeesTotal
0–910–4950–249250–549>550
Does your company have experience in implementing BDA in the SC?NoCount1312133041
Expected Count3.25.411.012.29.241.0
YesCount315425846164
Expected Count12.821.644.048.836.8164.0
TotalCount1627556146205
Expected Count16.027.055.061.046.0205.0
Table 2. Critical report for Chi-Square Tests.
ValuedfAsymp. Sig. (2-Sided)
Pearson Chi-Square68.226 a40.000
Likelihood ratio68.54940.000
Linear-by-linear association61.46210.000
No. of valid cases205
a One cell (10.0%) has expected count less than 5. The minimum expected count is 3.20.
Table 3. Strategy according to company size.
CountNumber of EmployeesTotal
0–910–4950–249250–549>550
Did your company adopt a strategy for BDA?NoCount91040023
Expected Count1.83.06.26.85.223.0
YesCount717516146182
Expected Count14.224.048.854.240.8182.0
TotalCount1627556146205
Expected Count16.027.055.061.046.0205.0
Table 4. Critical report for Chi-Square Tests.
ValuedfAsymp. Sig. (2-Sided)
Pearson Chi-Square65.022 a40.000
Likelihood ratio57.74940.000
Linear-by-linear association50.68010.000
No. of valid cases205
a Two cells (20.0%) have expected count less than 5. The minimum expected count is 1.80.
Table 5. Coefficients to measure the association of nominal variables.
Symmetric MeasuresValueApprox. Sig.
Nominal by nominalPhi0.5630.000
Cramer’s V0.5630.000
Contingency Coefficient0.4910.000
No. of valid cases205
Table 6. Observed and expected frequencies.
Years of Operating ExperienceTotal
<1 Year1–5 Years5–10 Years>10 Years
Does your company have professional capabilities to develop insights via BDA?NoCount176418
Expected Count3.68.34.81.318.0
YesCount40874911187
Expected Count37.485.750.213.7187.0
TotalCount41945515205
Expected Count41.094.055.015.0205.0
Table 7. Critical report for Chi-Square Tests.
Chi-Square TestsValuedfAsymp. Sig. (2-Sided)
Pearson Chi-Square8.570 a30.036
Likelihood ratio7.41030.060
Linear-by-linear association7.07710.008
No. of valid cases205
a Three cells (37.5%) have expected count less than 5. The minimum expected count is 1.32.
Table 8. Data obtained from Student’s t-test.
One-Sample TestTest Value = 0.5
tdfSig. (2-Tailed)Mean Difference95% Confidence Interval of the Difference
LowerUpper
Will your company intend in future to implement new tools and technologies to gain valuable supply-chain insights?−2.6212040.009−0.090−0.16−0.02
Table 9. Statistics on factors and their importance.
DimensionSingular ValueInertiaChi-SquareSig.Proportion of InertiaConfidence Singular Value
Accounted ForCumulativeStandard DeviationCorrelation
2
10.2910.085 0.4610.4610.0650.053
20.2700.073 0.3970.8580.063
30.1610.026 0.1421.000
Total 0.18437.6500.048 a1.0001.000
a 27 degrees of freedom.
Table 10. Coefficients of binary logistic regression model.
βS.E.WalddfSig.Exp(β)95.0% C.I. for EXP(β)
LowerUpper
Step 1 aExperience0.9900.6232.52310.0423.6911.0939.127
Strategy0.1260.7990.02510.8751.1350.2375.434
Professional Capabilities0.5080.6010.71410.0383.6621.5129.401
Industry 3.56130.313
Industry (Manufacturing)0.3440.3690.86510.3521.4100.6842.908
Industry (Consulting)0.8160.4393.45910.0632.2620.9575.344
Industry (E-commerce)0.5200.5750.81710.3661.6820.5455.194
Annual Sales Revenue 10.32260.031
Annual Sales Revenue (Under €5 million)−0.0800.7810.01110.0493.1231.2007.269
Annual Sales Revenue (€6–10 million)1.1600.5784.02510.0453.1891.0279.899
Annual Sales Revenue (€11–25 million)1.2080.5255.29110.0213.3481.1969.375
Annual Sales Revenue (€26–50 million)0.9340.4644.05210.0442.5441.0256.314
Annual Sales Revenue (€51–75 million)0.3000.5190.33310.5641.3490.4883.730
Annual Sales Revenue (€76–100 million)0.1480.5930.06310.8021.1600.3633.712
Constant−2.6930.8609.81410.0020.068
Step 2 aExperience1.0560.4665.14810.0232.8761.1557.162
Professional Capabilities0.5150.5990.73810.0293.6731.5179.415
Industry 3.54730.315
Industry (Manufacturing)0.3380.3680.84510.3581.4020.6822.882
Industry (Consulting)0.8070.4353.44410.0642.2420.9565.261
Industry (E-commerce)0.5100.5720.79610.3721.6660.5435.110
Annual Sales Revenue 10.32860.031
Annual Sales Revenue (Under €5 million)−0.0940.7760.01510.0473.9103.1998.167
Annual Sales Revenue (€6–10 million)1.1590.5784.02110.0453.1881.0279.900
Annual Sales Revenue (€11–25 million)1.2040.5245.27110.0223.3331.1939.315
Annual Sales Revenue (€26–50 million)0.9350.4644.06310.0442.5471.0266.319
Annual Sales Revenue (€51–75 million)0.3020.5190.33810.5611.3520.4893.736
Annual Sales Revenue (€76–100 million)0.1510.5930.06510.7991.1630.3643.719
Constant−2.6350.77311.63110.0010.072
Step 3 aExperience1.1640.4516.66810.0103.2031.3247.751
Industry 3.46230.326
Industry (Manufacturing)0.3240.3660.78110.3771.3820.6742.834
Industry (Consulting)0.8010.4343.40410.0652.2280.9515.218
Industry (E-commerce)0.4550.5630.65210.4201.5760.5224.752
Annual Sales Revenue 9.97460.026
Annual Sales Revenue (Under € 5 million)−0.0910.7750.01410.0473.9131.2007.168
Annual Sales Revenue (€6–10 million)1.1090.5723.75410.0443.0311.9879.304
Annual Sales Revenue (€11–25 million)1.1980.5255.21010.0223.3151.1859.276
Annual Sales Revenue (€26–50 million)0.9110.4613.90010.0482.4861.0076.138
Annual Sales Revenue (€51–75 million)0.2840.5180.30110.5831.3290.4823.666
Annual Sales Revenue (€76–100 million)0.1640.5930.07610.7821.1780.3683.766
Constant−2.2270.59514.02110.0000.108
Step 4 aExperience1.1970.4477.17810.0073.3091.3797.939
Annual Sales Revenue 8.69260.029
Annual Sales Revenue (Under €5 million)−0.0640.7700.00710.0422.9381.2074.245
Annual Sales Revenue (€6–10 million)0.8830.5532.55310.0402.4191.8197.149
Annual Sales Revenue (€11–25 million)1.1210.5164.72010.0303.0691.1168.441
Annual Sales Revenue (€26–50 million)0.8710.4553.65910.0562.3900.9795.836
Annual Sales Revenue (€51–75 million)0.2270.5110.19810.6561.2550.4613.417
Annual Sales Revenue (€76–100 million)0.1880.5860.10310.7481.2070.3833.806
Constant−1.8730.54211.95810.0010.154
Step 5 aExperience1.0970.4097.21410.0072.9961.3456.674
Annual Sales Revenue1.0230.5074.54010.0303.0571.1098.411
Constant−1.2690.37711.30310.0010.281
a Variable(s) entered are: Experience, Strategy, Professional Capabilities, Industry, Annual Sales Revenue.

