Article

Communication Barrier, Spillover Effect and Industrial-Technological Innovation

1
School of Surveying and Land Information Engineering, Henan Polytechnic University, Jiaozuo 454000, China
2
School of Management, Shanghai University, Shanghai 200444, China
3
School of Management, China University of Mining and Technology, Beijing 100083, China
4
Research Center for Energy Economics, School of Business Administration, Henan Polytechnic University, Jiaozuo 454000, China
*
Authors to whom correspondence should be addressed.
Sustainability 2019, 11(18), 4841; https://doi.org/10.3390/su11184841
Submission received: 8 July 2019 / Revised: 22 August 2019 / Accepted: 26 August 2019 / Published: 5 September 2019
(This article belongs to the Special Issue Smart Trends of Systems, Security and Sustainability)

Abstract

:
Industrial-technological innovation (ITI) has far-reaching significance for China’s sustainable development. In this study, we construct an ITI model to analyze the impact of communication barrier and spillover effects in ITI system from the perspective of system by means of system dynamics. Statistical data of smartphone industry were collected to verify the authenticity of the model, which show that the model has higher goodness of fit with the real-world. Simulation experiments were carried out and the results showed that: (1) Spillover effects have obvious effects on ITI in both positive and negative radiation directions, and deeper exchanges and cooperation should be encouraged to carry out among firm. (2) Communication barrier play an important role in regulating ITI. Under the condition of non-barrier and complete-barrier, the completion time of the whole process has increased by 76.5%, it is urgent to reduce communication carrier. The research puts forward suggestions to help improve ITI from institutional, market, and government.

1. Introduction

Various factors lead to the slowdown of China’s economic growth [1]. It is not only affected by the international economic downturn but also due to the imbalance of China’s domestic industrial structure [2,3].The imbalanced industrial structure in China can be observed in many aspects. For example, the overcapacity in China’s energy-intensive industries; lagging behind in high-tech industries; weak service for consumer’s needs, etc. [4]. It is worth mentioning that the low level of industrial technology is one of the reasons [5]. The development model of China’s low-edge manufacturing industry which relied on importing and imitating other countries’ technology has been unsustainable [6]. “Made in China 2025” plan once again provides that the driving force of high-tech and innovation is an important support for China’s sustainable development [7]. Changing the mode of economic growth and industrial-technological innovation (ITI) is related to the “middle-income trap” and the existing social contradictions in China, which is a major challenge for its future development [8].
In order to overcome Chinese major challenge, the government has launched two major strategies, “The Belt and Road Initiative” [9] and “Innovating China” [10], which aim at win-win cooperation and innovative development in China’s industries [2]. Under the open environment, the communication between innovation subjects is becoming more frequent, and the path of cooperation affecting innovation has gradually become an academic hot issue [11]. Technology communication and spillover are the main ways of ITI [5,12]. However, no consensus has been reached on the effects between technology communication and spillover, and there are still great disputes on the mechanism and influence mode. In the framework of ITI, it is noteworthy to mention that the influence mode, degree of communication barrier and spillover should be solved quickly. In this study, we focus on ITI model and try to explain three main questions:
  • How to divide the process of ITI?
  • What factors can influence ITI?
  • How does the communication barrier (CB) and spillover effect (SE) affect ITI?
To the best of our knowledge, we highlight our contributions in the following, and the main contributions of this research can be described as the following three aspects. Firstly, it expands the scope of research on ITI, not only examines the path of ITI from a systematic perspective but also studies the relationship of the influencing factors, which has important reference value for understanding the path of ITI. Secondly, it deepens the research of ITI. Based on the previous researches, it will study the impacts about the differences of communication barrier and spillover effect on ITI from a systematic perspective, which will to supplement the research framework of ITI. Thirdly, it provides a theoretical basis for policymakers, which can help the promotion of ITI.

2. Literature Review

For a long time, the nature of technology communication and spillover effect has puzzled many scholars. According to Grupp [13], he analyzed data from the European Patent Office by using statistical method, and found that the property of scientific “public goods” was the main cause of the technology communication and spillover. Since then, a lot of research has been done on the relationship between technology communication and spillover effect and innovation. They are mainly reflected in two aspects: first, spillover effect between the same types of subjects (firm to firm, etc.); second, communication and cooperation between different types of subjects (firm to universities, etc.).
First of all, some scholars discussed the relationship between spillover effect and innovation on the same type of subjects. The relationship between multi-level communication and innovation among regions has been a popular research topic for decades. Such as Srholec [14], based on analyzing the micro survey data and macro national data, a big difference between the communication and cooperation of different countries and the domestic was explored, which is mainly caused by the quality of domestic cooperators. Moreover, Liu [15] took Chinese high-tech firm as the research object, researching the spillover effect of multinational firm in host, it is found that high-tech acceptance level is helpful to improve the technology of high-tech firm, but firm development also needs strong innovation ability. Similarly, Liu [2] also came to a similar conclusion. From the viewpoint of Benjamin [16], it is certain that both formal and informal associations can adjust the core management ability through spillover effect, and then exert a positive effect on innovation ability.
After exploring regions and countries, scholars began to study the role of spillovers effect in industries with no obvious physical boundaries. As previously mentioned, Stejskal [17] took the Czech industrial system as an example and conducted analysis based on survey data, and found that more active cooperation between firms would generate a greater driving force for innovation. At the same time, after analyzing the new energy industry in Rwanda, Tigabu [18] found the lack of effective innovation system to support technology diffusion is the main factor behind the new energy technology. In addition, Song [19] built a model which showed the influence from technology transfer to innovation spillover effect, using 2000–2016 date of China industry, and the result showed that: adaptive ripening has positive effect on innovation spillover effect of China industry.
With the development of globalization, the international cooperation of small-sized firms gradually increases, Radicic [20] firstly demonstrated the research on cooperation between small-sized firms: technological (product and process) innovations, non-technological (organizational and marketing) innovations and process innovations (innovative sales), which has obvious complementary effect, and the spillover from couple of cooperations has significantly increased the spread of innovation.
Another key framework within relationship between technology communication and spillover effect and innovation the different types of subjects (firm, universities, etc.). A lot of work has been done. First, some scholars focus on the impact of university-firm combination on innovation: Kang [21] put forward that different types of subjects were recognized as an effective tool for technological innovation, and broke down the communication barrier effectively. As what Nave [22] argued, if we use university-firm cooperation as a way to promote sustainability practices, according to the information provided by the interview, the university-firm cooperation is more conducive for firm to solve their own problems through innovation.
After studied of university-firm cooperation, some scholars pay attention to the key factors of cooperation between university and firm. Considering the perspective determinants of university-firm cooperation, Diego [23] has argued that internal characteristics of firm (size etc.), and external characteristics of markets and policies (economic risk etc.) were the major factor of that. Wang [24] proposes that university and firm should further reduce the distance, both geographically and organizationally, because closer relationships (space or organizational) will help increase communication and innovation.
Throughout all the literature, the research system of ITI with communication barrier and spillover effect has been basically established, but there are still deficiencies in research methods and contents.
In terms of research content, current research is mainly based on the impact of a single factor on ITI. There are few studies on the communication barrier and spillover effects under the effect of system feedback regulation. In view of this, this study will depict ITI from a system perspective, analyze the feedback regulating effect among various factors, especially the system development law under extreme value conditions, and then explore the role of communication barrier and spillover effects in the process of ITI.
In terms of research methods, Empirical research is the main research method, which not only fails to systematically depict the relationship between the process of ITI improvement and various influencing factors but also fails to take into account the interaction between various factors. In addition, such as excessive reliance on real data, and lack of research on the impact of extreme values. As argued by many experts, the process of ITI is affected by many factors and the relationship between them is highly complex. So, traditional methods have many limitations in dealing with complex large-scale systems. Therefore, it is necessary to apply more suitable methods to study the path of ITI.
System-Dynamics (SD), a method for studying highly complex system, which is supported by system feedback theory and computer simulation. SD has great advantages in dealing with the problems of complex system with nonlinearity, high complexity, multi-level and multi-feedback [25]. On the one hand, SD theoretical modeling is carried out based on taking full account of the feedback loop inside the system, and the influence of the dynamic changes of each factor is analyzed; on the other hand, it can be explored the extreme historical data. SD model has been widely used in Social-Sciences [26,27] and Natural-Sciences [28,29]. It is a mature method to solve complex system problems.

3. Model Development

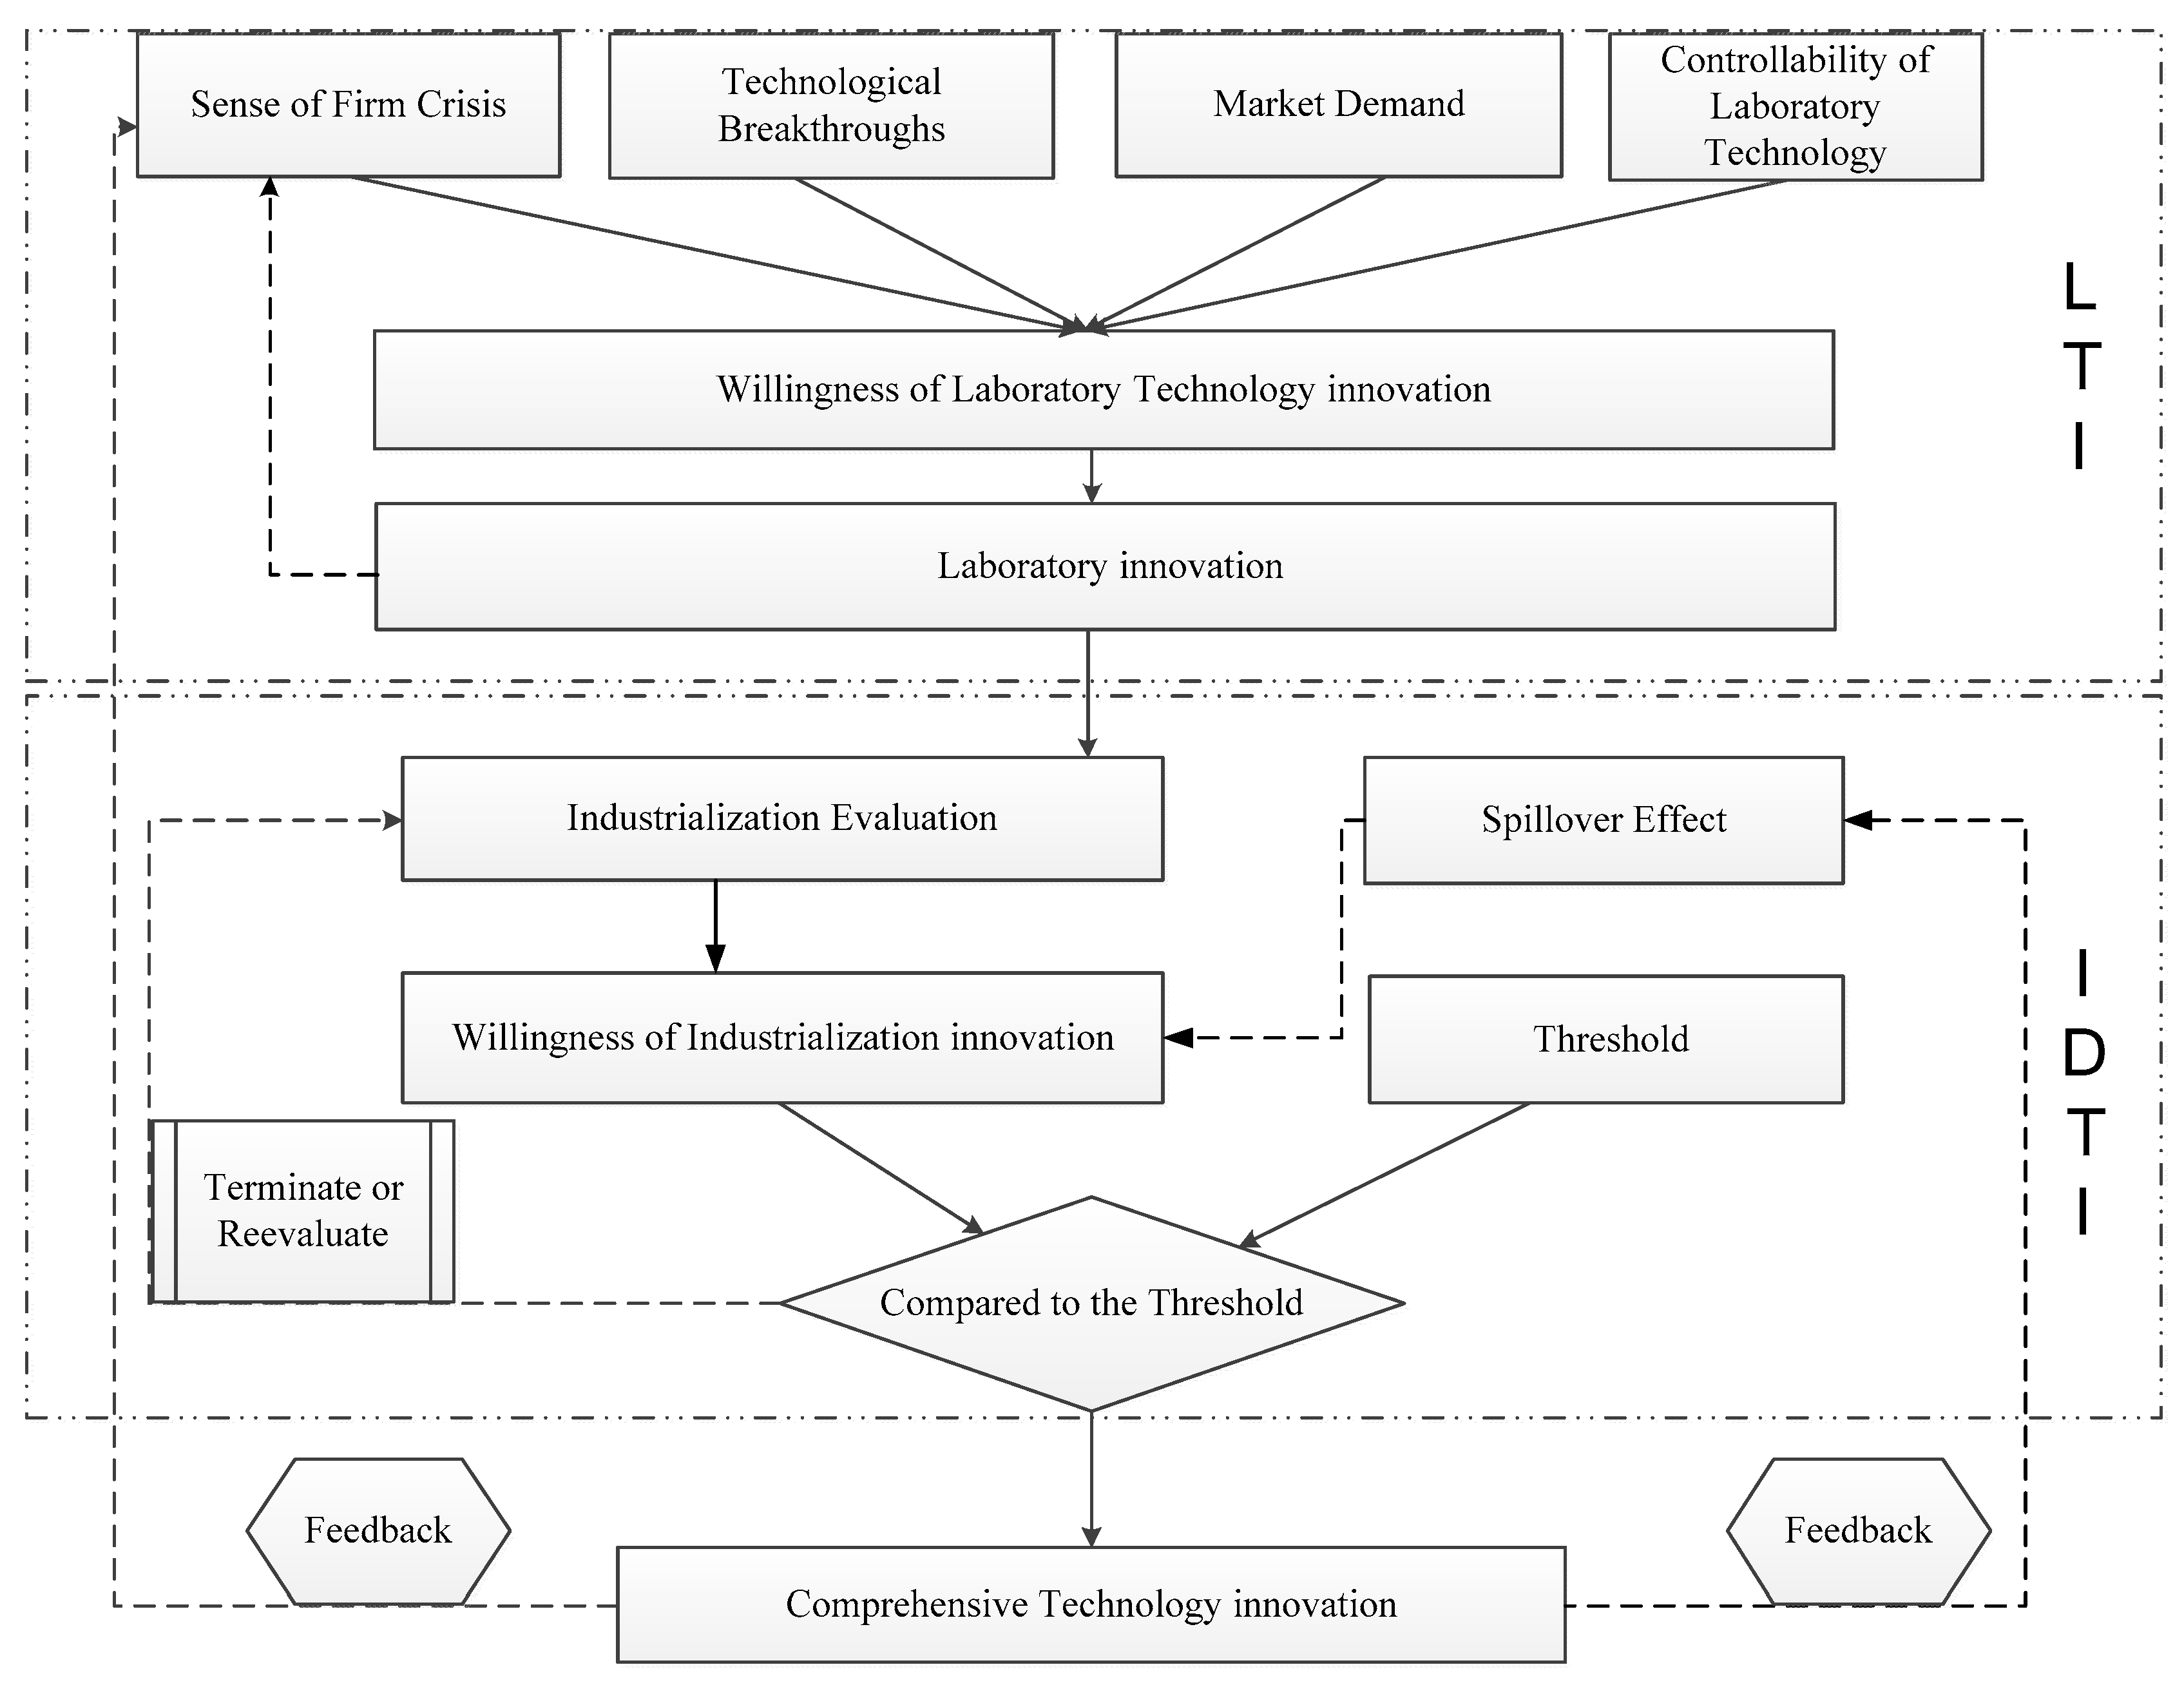
3.1. The Theoretical Background Analysis

The ITI is a complex system with a long span and many participating factors. How to divide the process of ITI is a key issue. Tunzelmann et al. [30] are the pioneer to study the process of industrial technology. Industrial technology is regarded as the process of integrating and learning different knowledge structures and integrating knowledge into new products. Soon afterwards, Tunzelmann et al. [31] improved by proposing that industrial technology was a means to improve product quality and service efficiency, by introducing new processes and technologies.
The difference between industrial technology and firm technology is the difference in research scope [32]. The research scope of industrial technology is more abundant when studying industrial technology, while the scope of firm technology is relatively narrow, mainly focuses on the study of a single firm. Because an industry consists of enormous firms with the same nature (business scope, firm attributes, operation mode, etc.). There is a similar relationship between this industry technology and firm technology. Industrial technology is a systematic, large-scale and universal firm technology [33,34]. It can only be called industrial technology after it is applied by the vast number of firm in the industry. Therefore, it can be considered that industrial technology innovation is a phenomenon of diffusion between industries after carrying out technological innovation activities. The process of ITI can be divided into “innovation generation” and “innovation diffusion”, which is laboratory technological innovation(LTI)and industrialized technological innovation (IDTI).

3.1.1. Analysis of LTI

Laboratory technology innovation (LTI) refers to create a new one, that is “innovation generation”. Nowadays, the research on the impact of “innovation generation” mainly focuses on the breakthroughs of university, policy or subjectivity differences on innovation.
Scholars firstly pay attention to the impact of Universities on innovation. Juan [35] and Broekel [36] found that higher education also plays an important role in the process of innovation, and universities and innovation ability have an obvious direct or indirect correlation. Hojin [37] studies the impact of Technological Exploration on industrial technology development from the perspective of demand. He believes that technological exploration mainly comes from the university’s technological research and market customers’ needs. Maria [38] and Fang [39] respectively analyzed the Italian and Chinese samples and reached a highly consistent conclusion that research departments such as universities, geographical location, and firm size are the determinants of Italian firm’ technological innovation, while the degree of industrial technology and economic development is highly consistent in space. The innovation level and innovation level of central cities are also significantly higher than those of small and medium-sized cities and the industrial technology level of basic education, economic development and scientific research investment in developed areas has increased significantly.
Subsequently, scholars have done a lot of work from the perspective of regional policy. Kleoniki [40] further confirmed that the innovation efficiency of regions with higher resource utilization efficiency (employment rate, technological diversity, etc.) is higher than that of regions with lower resource utilization efficiency. He also confirmed that the innovation efficiency of regions with underdeveloped and transitional periods is higher, and the innovation efficiency of regions with differentiation and decentralization is higher. The policy of industrialization will provide more clear help to innovation in developed areas, that is, government intervention will have a significant impact on the evolution path of innovation. Miao [41] found that latecomers can learn through various channels to catch up with or even surpass existing firm, and use various government policies to help them start the next generation of research and build development platforms as soon as possible to overcome their initial weaknesses and complete technological catching-up. Rieu [42] argues that the triple helix structure of “government-industry-university” can no longer fully release the scientific and technological innovation of scientific research institutions. It also need to release innovation output and improve the quality of innovation by means of social and regional factors.
Finally, the subjectivity differences also attracted the attention of scholars, and then some scholars carried out research on the relationship between firm differences and innovation. Stav [43] proved that diversified knowledge and differentiated national knowledge have a positive correlation with industrial technological innovation. The reason for this phenomenon is the external positive effect of open knowledge convergence on innovation. Lee [44] found that there is an inverted U-shaped relationship between firm size and industrial technology R&D intensity, and technology controllability has a significant impact on industrial technology and has produced in different industries. The effect is different, and the technology controllability has obvious regulating effect in the developing stage and the underdeveloped stage.
From this, the LTI is driven by the willingness to upgrade laboratory technology. There are four motivations for the willingness to upgrade laboratory technology: market demand, technological breakthroughs in scientific research institutions, controllability of laboratory technology and sense of firm crisis [36,37,43,44]. Among them, market demand refers to the customers’ demand for the function, application, material or other elements of a certain product in a certain period. Some firm meet the needs of some customers after technological innovation, so the market demand will decrease with time. Technological breakthroughs in scientific research institutions and controllability of laboratory techniques are also key factors. If the scientific research breakthrough ability is strong, it will directly enhance the willingness of the firm to upgrade laboratory technology. Technological controllability can be understood as the probability of completion of laboratory innovation. Higher controllability will lead to greater research and development willingness. Firm crisis sense is generated by firm environmental factors, and the proportion of different types of firm will affect firm continue to affect firm crisis sense. The above motivations together drive the willingness of LTI. The higher willingness means the higher rates of innovation.

3.1.2. Analysis of IDTI

The process of IDTI is similar to “point-to-plane”, which means the expansion of laboratory innovation, the main results that influence innovation diffusion focus on the study of social network effects. Wang [45] was an early scholar who studied the diffusion of innovation. He used mathematical methods to establish an evolutionary game model. The conclusion shows that knowledge sharing will promote the innovation cluster, which proves that the propagation of innovation in the enterprise network can stimulate industrial innovation. After proving in theory, many scholars have carried out empirical research on the impact of social networks on innovation.
Firstly, Martin [46] draws a conclusion from the organizational perspective of start-ups that industrial models such as inter-departmental linkages and organizational structure of start-ups will affect the industrial capabilities of start-ups, and that different organizational networks will result in differentiated organizational communication multipliers. Subsequently, Zhou [47] firstly proved that firm cooperation can promote innovation diffusion, and then further proved that excellent market structure, favorable natural environment, excellent technological innovation, sound governance policies, and reasonable firm size have a positive impact on innovation diffusion. Lee [48] also draws a similar conclusion: when researchers can communicate with each other, spillover effect is more obvious, which effectively strengthens the maturity of scientific capacity, regional knowledge and scientific knowledge, promotes the integration of science and technology, and achieves effective innovative results. Xie [49] analyzed the worldwide data from 2007 to 2015 and concluded that international trade had an impact on innovation through information diffusion effect, firm competition effect and value chain optimization effect.
IDIT is driven by industrialization intention, spillover effect and industrialization assessment work together on industrialization intention [48], and the industrialization assessment composed of profit and product characteristics is the core determinant of industrialization. Because the cost of large-scale products will be thousands of times the laboratory samples, the external uneconomic will also increase (these costs can be defined as threshold for IDTI), so the firm will evaluate the feasibility of industrial production (willingness of IDTI compare with threshold).If the profit of the innovative industrial application is higher than the threshold, then the firm will carry out IDTI [45].

3.2. Structure and Loops of ITI

In summary, we have established the structure and loops of ITI. The structure of ITI is shown as Figure 1 and loops of ITI are shown as Table 1.

3.3. Simulation Model Formation

3.3.1. System Variables and Boundaries

Systems engineering considers that most systems have boundaries. Extracting the main key variables, and finally determining the boundary of the model is the key to determine whether the system model is reasonable or not. In this study, the number of potential firm is taken as the starting variable. Based on the process of ITI from “non-upgrading” to “overall upgrading”, the Bass [50] model and TOE [51] model are extended, and the impact of environmental factors is taken into account.
The names of three horizontal variables, i.e., the number of firm that have not been promoted by laboratory technology, the number of firm that have been finish the laboratory technology but not promoted industrial technology, and the number of firm that have been ITI. The corresponding two rates are “the rate of LTI” and “the rate of IDTI”, and the introduction of “production”. Industrial comparative advantage will affect the willingness of LTI, while technology spillover effect will affect the willingness of IDTI. Other Factors such as “perceived ease of use” and “perceived usefulness” are derived from TAM [52] model.
After screening, the key level variables are determined as “number of firm without laboratory technology innovation (NLTI)”, “number of laboratory technology improvement & unimproved industrialization (LTI&UI)” and “number of firm with comprehensive technology innovation (TI)”. The key rate variables are “laboratory technology innovation rate (LTIR)” and “industrialized technology innovation rate (IDR)”. The key auxiliary variables are “laboratory technology innovation willingness (LTIW)”, “industrialization willingness (IW)”, “firm crisis feeling (FCF)”, “CB (CB)”, “cooperative firm coefficient (COOFC)”and “spillover effect (SE)”. The key constants are “start threshold (ST)”, “total number of firm (TNF)” and “technological breakthrough of scientific research units (TBASRU)”.

3.3.2. Simulation Model and Variables Code

Based on the logical relationship of each variable, the system of ITI is constructed, as shown in Figure 2, together with the variables and the corresponding code are described in Table 2.

3.4. The Model Equation

3.4.1. Demand and LTI Willingness

Demand (D) refers to the historical price and price adjustment of mobile phones, computers, and other products. Using the historical data [53] and on-site survey, this study defines the initial market demand as 0.1, with decay interval of 10 months and each time a 20% decline, as shown in Equation (1).
D = WITH LOOKUP (TIME, ([(0,0) − (60,1)], (0,0.1), (10,0.08), (20,0.06), (30,0.04), (40,0.02), (50,0)))
After realizing the gap between firms, the firms will realize that if they do not innovate, they will be eliminated from the market, get bigger crisis feeling (FCF), so they will have greater willingness to innovate. Innovation will bring excess profits for a period of time, so firm will launch innovation to obtain greater profits. Technological breakthrough of scientific research units (TBASRU) is the strong foundation of firm innovation; Laboratory technology controllability (LTIC) refers to the ability to control innovation in the LTI stage, that is, the possibility of the initial intention turning into the final intention [36,37,43,44]. LTI willingness (LTIW) shown in Equation (2).
LTIW = (FCF + D + TBASRU) × LTIC

3.4.2. IDTI Willingness

The evaluation of the PUIT is complex and there is no stable and unified norm. In this study, based on TAM model, the PUIT can be decomposed into “industrial ease of use (IEU)” and “industrial usefulness (IU)” [27], as shown in Equation (3).
PUIT = IEU + IU
Industrial usefulness (IU) is controlled by the relative advantage of products. Subtle advantages have no effects on usefulness, and only when the difference accumulates to a certain amount, then the difference of usefulness was appeared [27,51], as shown in Equation (4):
IU = WITH LOOKUP (RAP, ([(0,0) − (10,10)], (0,0), (0.25,0.2), (0.5,0.4), (0.75,0.6), (1,1))
Heterogeneity is an important factor affecting firm development. Different corporate preferences will directly determine the attitude of firm to innovation, so firm with greater preference for innovation can obtain higher evaluation of industrialization. Higher availability of technology and higher profitability will further enhance the level of industrial assessment. In this study, the NP can be expressed as the arithmetic mean of PUIT, IPF and IP [27,48], as shown in Equation (5).
NP = (IPF + PUIT + IP)/3
Industrialization feasibility refers to the initial feasibility of industrialization, which can be defined as the sum of industrialization assessment and spillover effects of new products, as shown in Equation (6); when the IF is greater than the starting threshold, the company has the willingness to carry out IDTI. In the study, the IDTI willingness (IW) is defined as the difference of the industrialization feasibility (IF) and the start threshold (ST), as shown in Equation (7).
IF = NP + SE
IW = IF − ST

3.4.3. Product Comparison Gap and Firm Crisis Feeling

PCG depends on CB, because different levels of communication will directly affect the type and depth of information acquisitions [5,51], as well as the PCG shown in Equation (8).The FCFR is regulated by CB, and higher CB reduce the frequency of communication between firms, where the FCFR shown in Equation (9). FCF is determined by the PCG and FCFR, more frequent communication and greater differences will bring a stronger sense of crisis, the FCF as shown in Equation (10).
PCG = IF THEN ELSE (CB ≤ 4, ((((0.5 × “LTI&UI”) + TI)/(TI + “LTI&UI” + NTLI))),
((TI/(TI + “LTI&UI” + NTLI))))
FCFR = 1/CB
FCF = FCFR × PCG

3.4.4. Technology Spillover Effect

Based on the impact of the environment in the TOE model on ITI, we consider that the spillover intensity will change between cooperation and competition in different environments. In this study, define the proportion of TI as an environmental variable [2,51], as shown in Equation (11).
SE = IF THEN ELSE (CCTIPF ≥ 0.5, ((COOR × COO + COMR × COM/2) × ABS(S)),
((COOR × COO/2 + COMR × COM) × ABS(S)))

3.4.5. Others

LTI rate (LTIR) is defined as the lab innovation willingness (LTIW) multiply the number of firm without carry out LTI, as shown in Equation (12);Similar to this, IDTI rate (IDR),as shown in Equation (13).
LTIR = LTIW × NTLI
IDR = “LTI&UI” × IW
Cooperation firm ratio (COOR) defined as the product of the ratio of completed innovation companies to the coefficient of cooperative firm (COOEC), as shown in Equation (14). Similar to this, Competition firm ratio (COMR), as shown in Equation (15).
COOR = COOFC × ITICR
COMR = ITICR × (1 − COOFC)
ITI completion rate (ITICR) defined as the quotient of Total ITI (TI) and the Total number of firm (TNF), as shown in Equation (16).
ITICR = TI/TNF
Number of firm without LTI (NTLI) defined as the total number of firm (TNF) and the difference between the subtracted LTI rate (LTIR), as shown in Equation (17). Similar to this, number of LTI improvement & unimproved IDTI (LTI&UI) shown in Equation (18), and Total ITI (TI) shown in Equation (19).
NTLI = INTEG (−LTIR, TNF)
LTI&UI = INTEG (LTIR − IDR, 0)
TI = INTEG (IDR, 0)

4. Data and Model Testing

4.1. Date

In this study, Vensim PLE software is used for simulation. INITIAL TIME = 0; FINAL TIME = 60; TIME STEP = 0.125; TIME UNIT: Month. This study uses Delphi method to assign the values. The specific values are shown in Table 3.

4.2. Model Testing

Before running the model, the fitting degree between the model and the real world and the stability of the model should be verified. This test is divided into two steps: output fitting of historical data and Sensitivity testing.

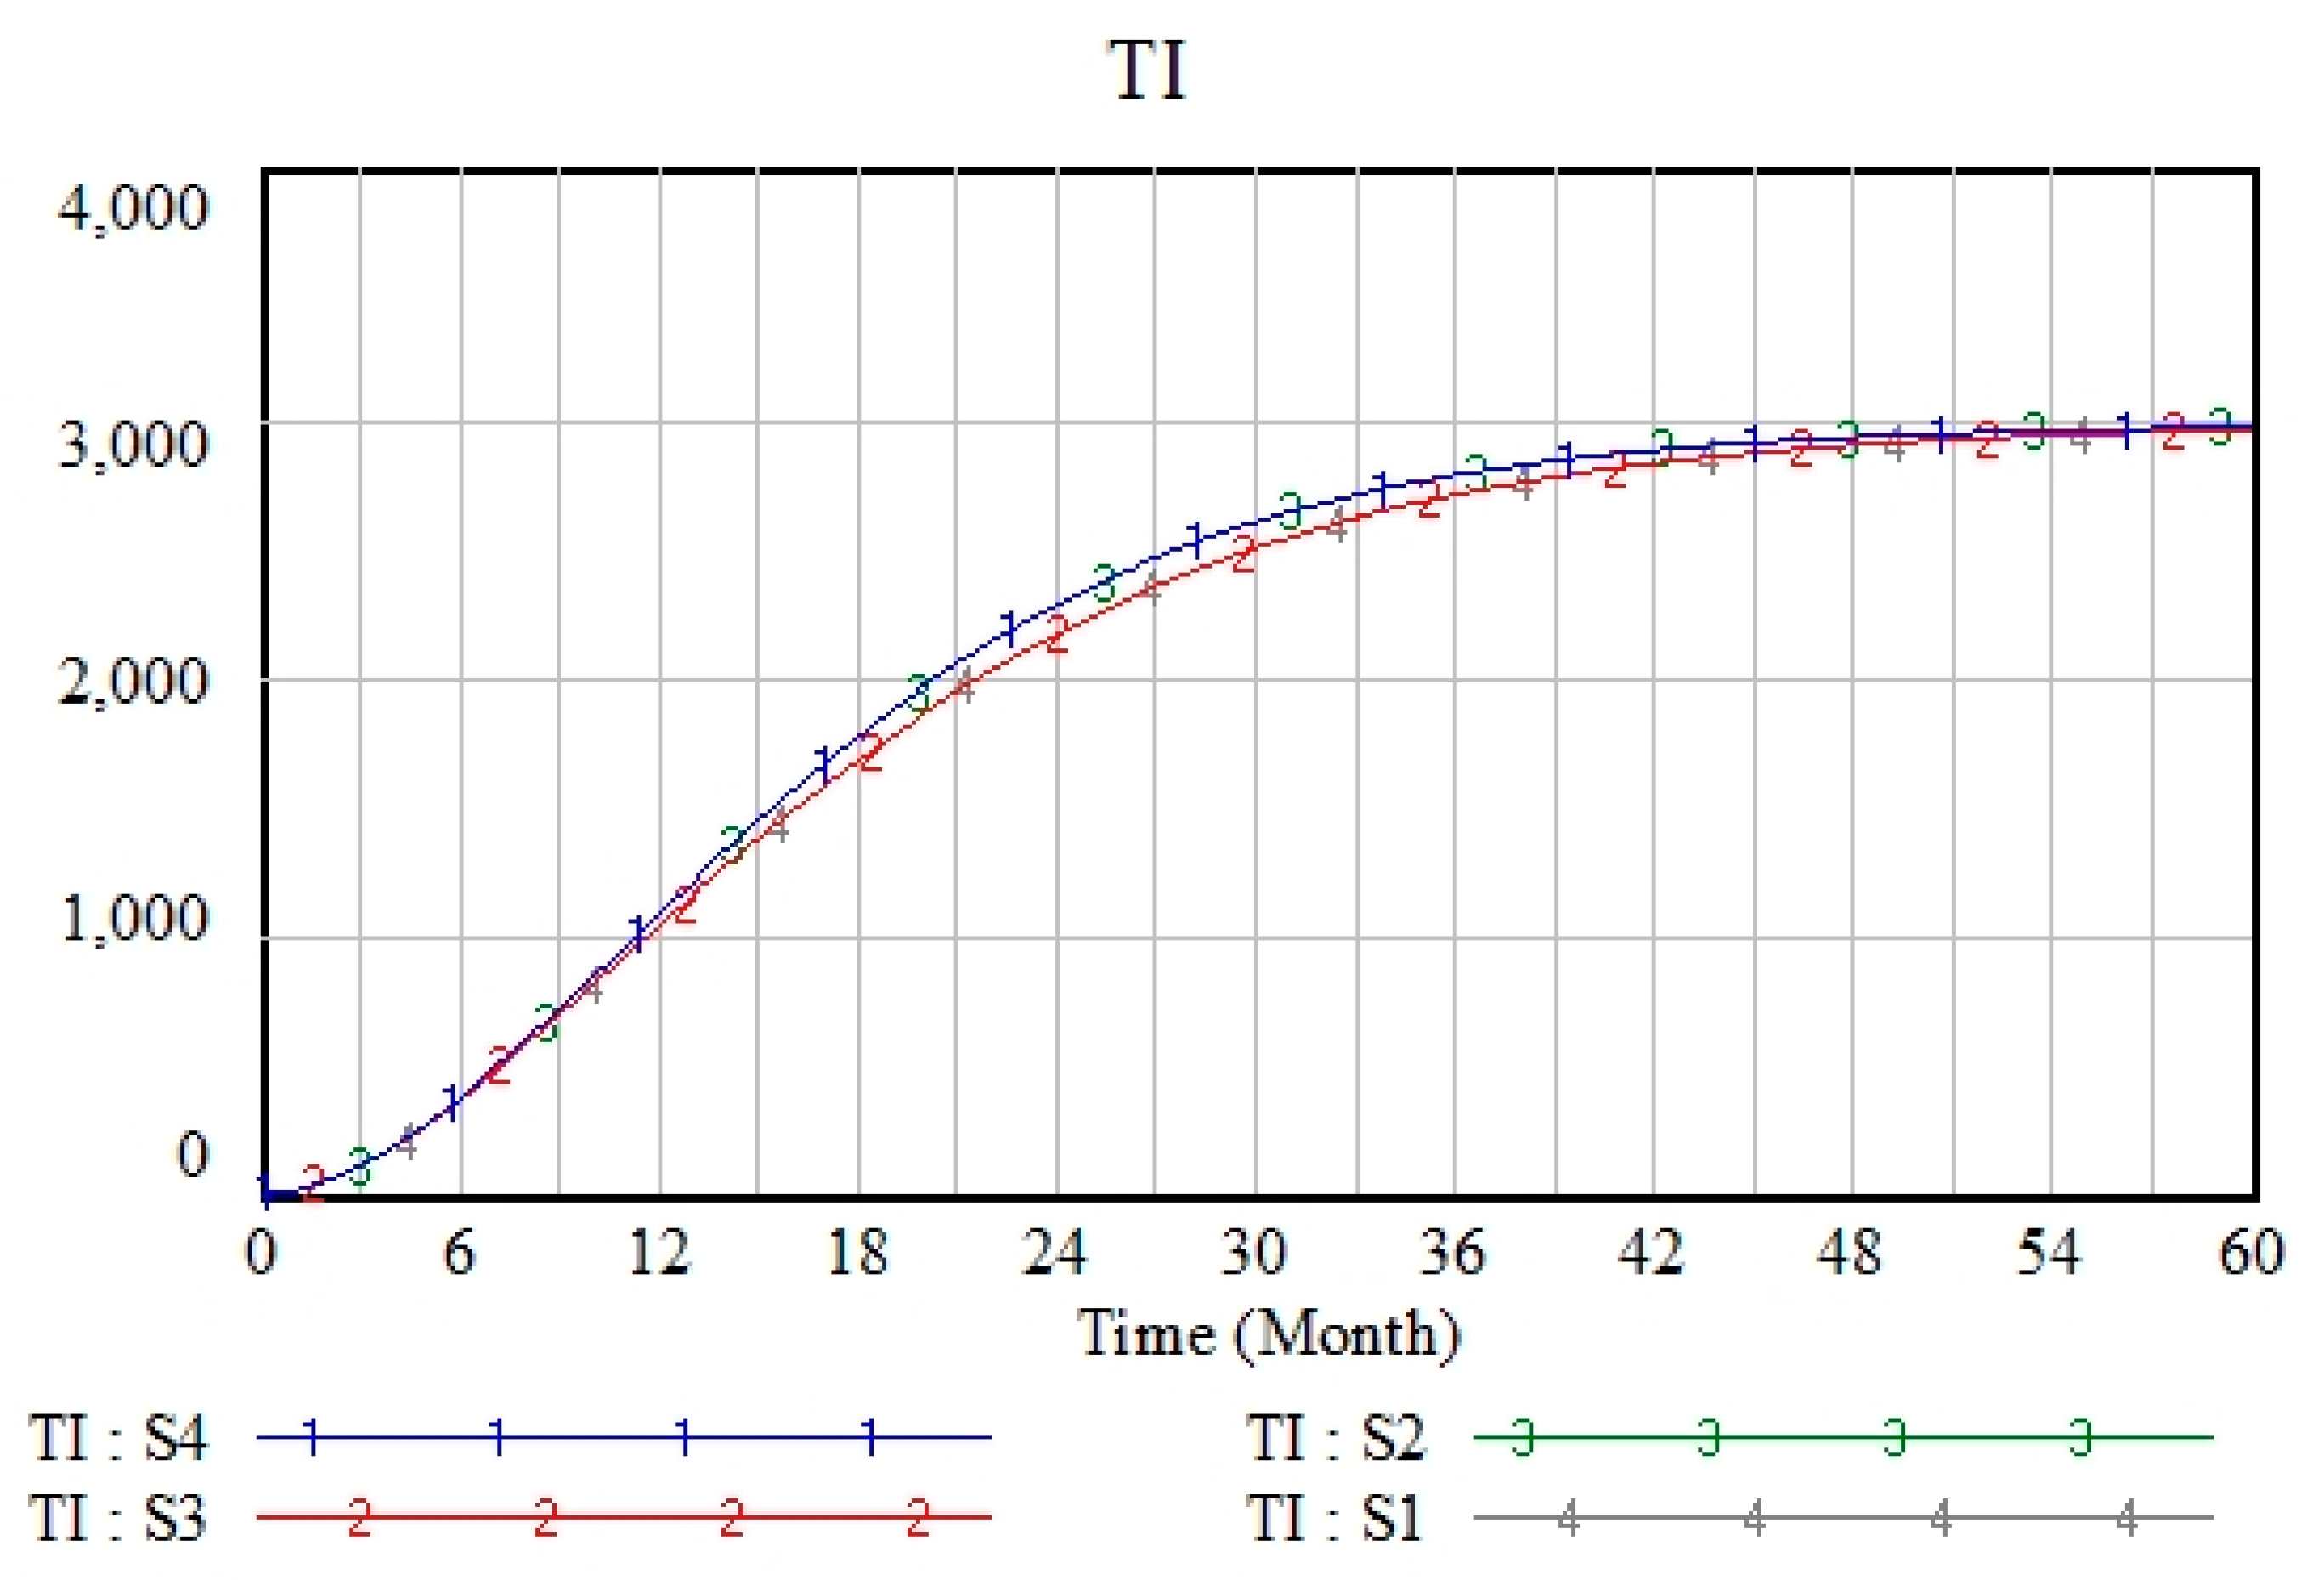
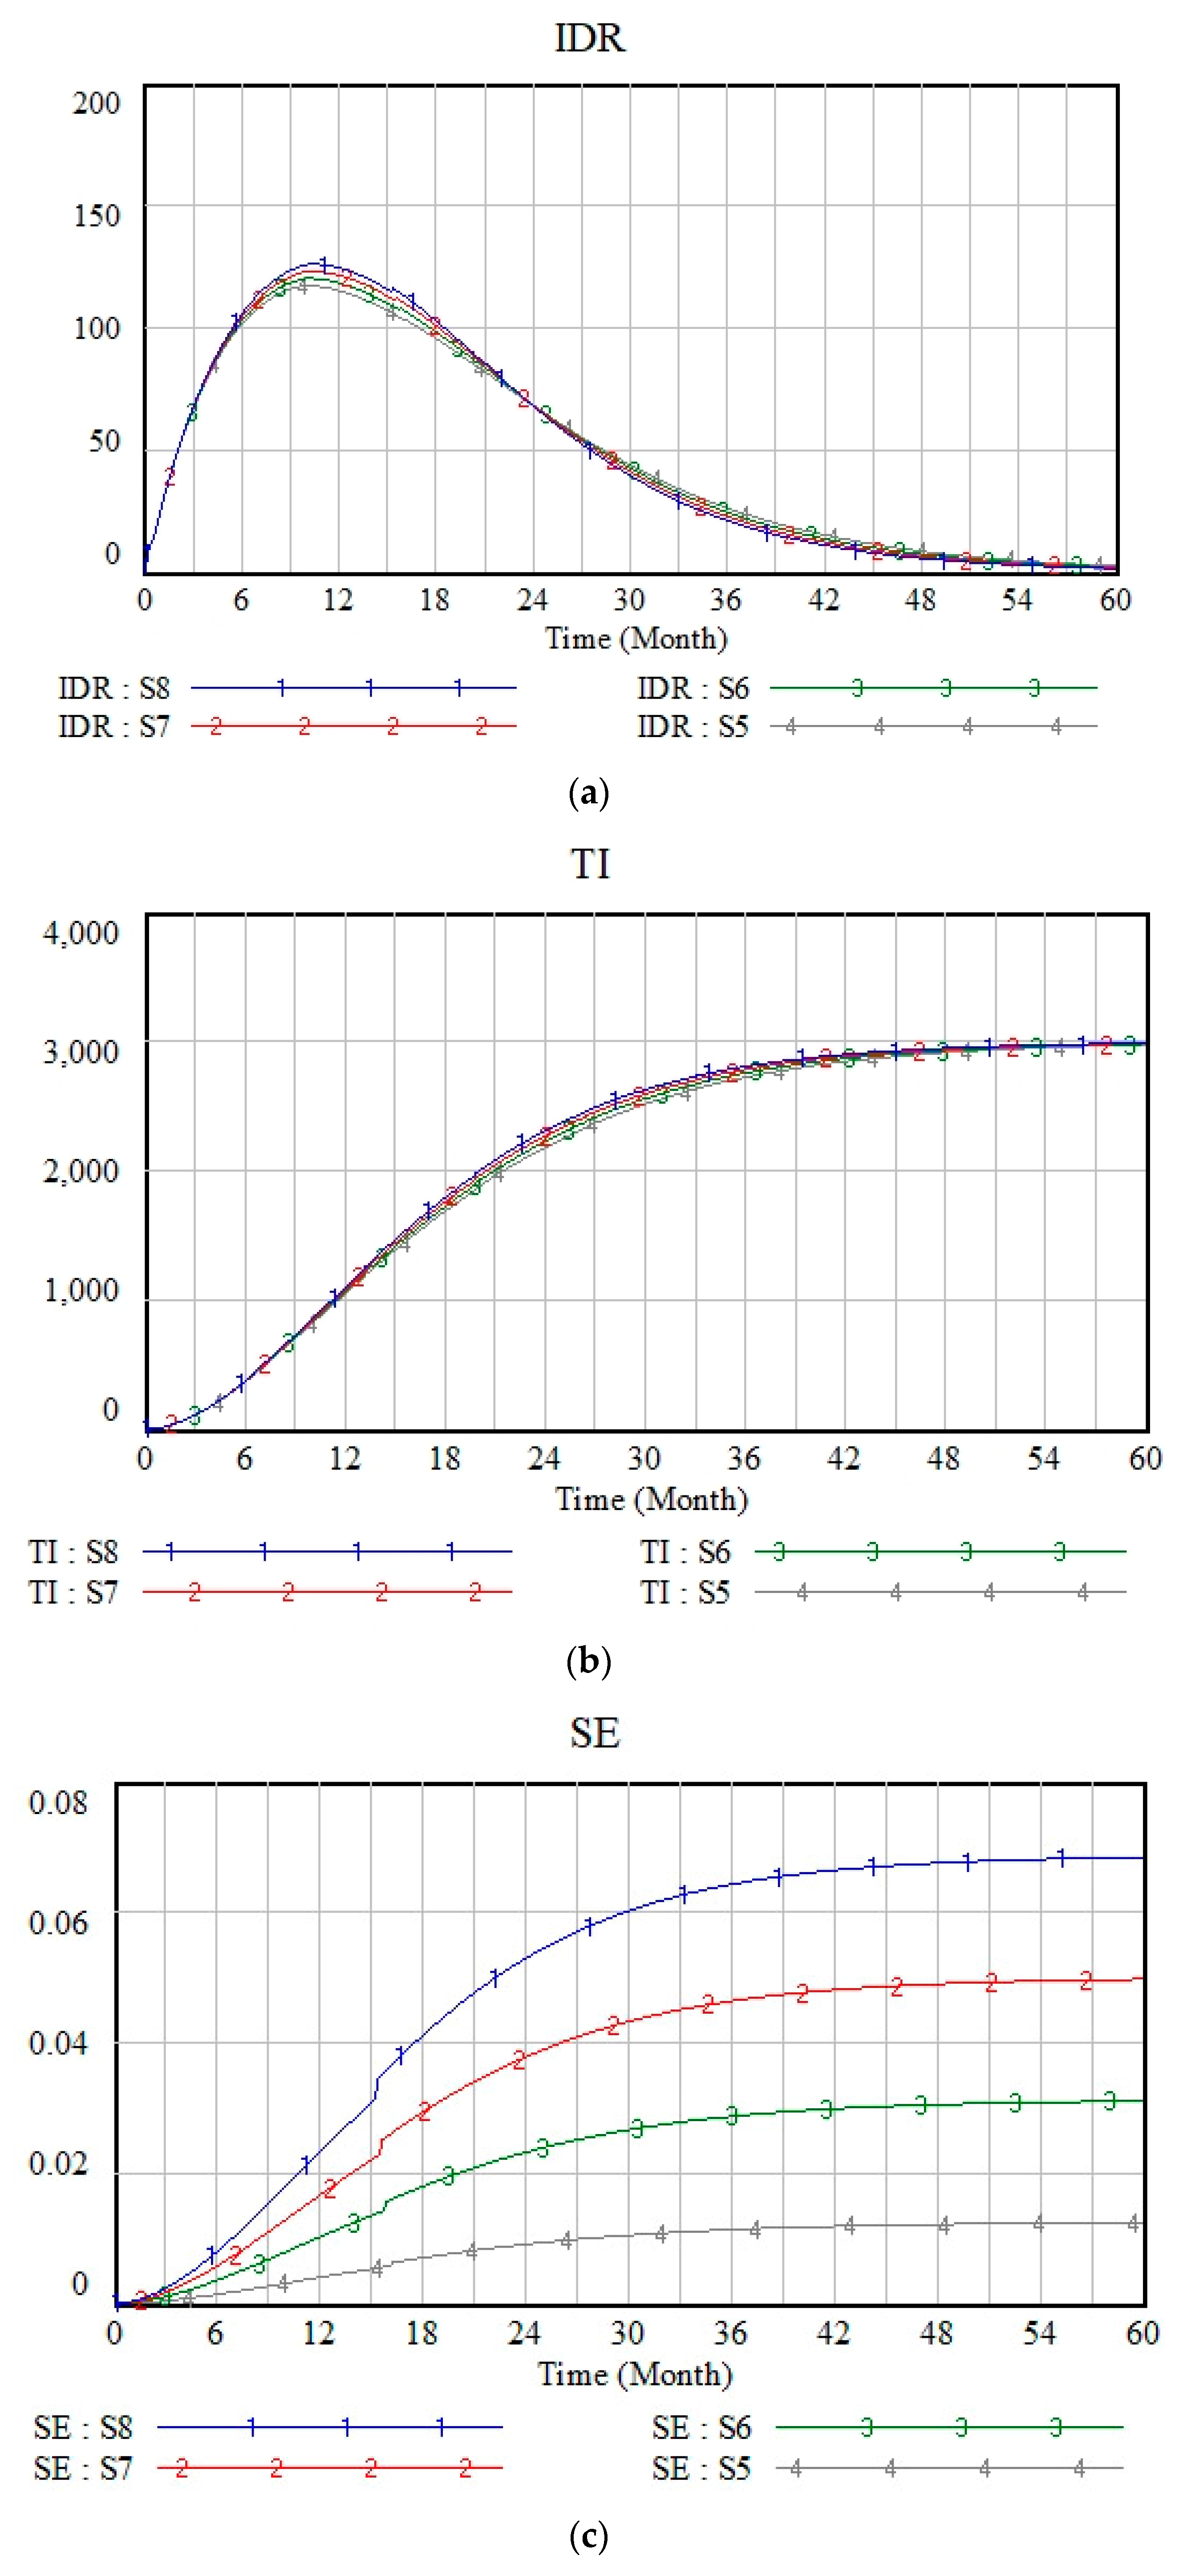
4.2.1. Output Fitting of Historical Data

We manually investigated the application of biometrics in the top seven smartphone brands (accounting for 99% of China’s market share) [55]. After the first company announced the start of research and development of biometric technology, the time span for the first application of this technology in different firm was 6, 13, 18, 21, 27, 32 and 36 months, respectively. Based on this, the simulated value is compared with the real value (Figure 3). The simulated value and the real value are highly consistent in the image. The Pearson correlation coefficient of the two groups of data is 0.975, and the fitting degree of the simulated value and the real value is 0.958. It shows that the model has a strong ability to interpret the real world.

4.2.2. Sensitivity Testing

Then the robustness of the model is discussed by sensitivity analysis. It is generally believed that the change of a certain quantity in the model will bring about some changes in the output results of the model, but the general trend will not change, and the output results will change in a controllable range. If a certain value is changed, the output of the model changes uncontrollably and subversively, then the model is viewed to be sensitive, and there are many limitations when it is applied to the real world without assuming conditions. In this study, sensitivity analysis is carried out by changing the breakthrough ability of scientific research institutions. The breakthrough ability of scientific research units is set to F1 = 0.1, F2 = 0.3 and F3 = 0.5. The changes of “two firm number”, “two wishes” and “two rates” in the model are observed. The specific output is shown in Figure 4, Figure 5 and Figure 6.
As shown in Figure 4, Figure 5 and Figure 6, after changing the TBASRU, the key horizontal variables, key rate variables and auxiliary variables in the model did not change uncontrollably or subversively but fluctuated in amplitude and rate. We can conclude that the ITI model is insensitive to parameters and has certain guiding significance for the real world.

5. System Simulation and Results

5.1. Simulation and Results of SE

In the firm information network, there may be two directions of information transmission. The first is that the firm receives external information, and the second is that the firm sends information to the outside. According to the different direction of SE, it is assigned and the simulation results are observed. If a firm accepts external spillover radiation, it can be considered that the SE is greater than 0; on the contrary, the SE is less than 0. Specific assignments, as shown in Table 4:
As shown in Figure 7, curves 1 and 3 coincide with curves 2 and 4 completely, which shows that in the firm network, the radiation effect (including external radiation and internal radiation) of the firm has the same effect on the enhancement of ITI when the absolute value of SE coefficient is the same. Then the SE is assigned as shown in Table 5.
As shown in Figure 8a,b, there is no significant difference in IDR in the first few months. With time going by, the SE on the rate of ITI began to appear. The SE coefficient increasing will make IDR steeper, which can improve the IDR and enhance the process of ITI. This is confirmed by the number of firm that has improved their technology in an all-around way. The time of S8 is nearly 11% higher than that of S5.
Figure 8c shows that the environment has a significant impact on SE. All the curves are in the period of 15M–18M. Faults and jumps have occurred. Because have been upgraded to be the main body in an all-around way. The quality and amount of information acquired by firms will increase, which will lead to the change of spillover intensity. It can be concluded that the SE can effectively improve the process of ITI.

5.2. Simulation and Results of CB

Another key framework within cooperation and innovative is CB. The range of CB is from 1 to infinite, and the corresponding information transmission efficiency is from 1 to 0. In particular, in order to facilitate our simulation of infinite barriers, we define CB = 10,000. Because when CB = 10,000, the information transmission capacity is 0.00001, which is very close to the target of complete barrier. This part simulates the conduction efficiency represented by different CB and takes the corresponding values of CB as 1, 3, 6, 9 and 10,000. Among them, value 1 represents the complete transmission of information, and there is no hindrance to the transmission of information; value 10,000 means that information is not transmitted at all, and firms cannot get the sense of crisis through the information network. The image (Figure 9) is as follows:
As Figure 9a, the curve can be divided into two groups. The shape of the first group (curve 1, 2, 3) is similar, while the second group (curve 4, 5) is significantly different from the first group. Fundamentally, the level of CB affects the level of information acquired by firm. Under the lower CB, firm will get some information with a higher level of privacy (firm carry out laboratory experiments, etc.), while under the higher CB, firm cannot get such information. In other cases, under the same conditions, the richer information levels lead to changes in the image.
From Figure 9b, we can see that the change of CB will result in a great change in the LTIR, especially in the case of without barriers (as curve 5 shown). This is because when CB are low and information exchange efficiency is very high, firm’s sense of crisis will rise rapidly, which will lead to various firm to carry out LTI in the short term. Subsequently, due to the limitation of the total number of firm, the LTIR began to decline significantly, while the small shocks caused by other factors were also weakened in the process. Eventually, in the initial stage, the LTIR increased rapidly, and then the curve began to decline rapidly. On the contrary, the other curves (as curves 2, 3, 4 shown) are the monotonous decreasing trend, and the short-term shocks caused by changes in demand are also clearly visible. It can be concluded that reducing barriers to communication can effectively improve the rate of LTI.
The impact of CB on the TI can be reflected in the curve, i.e., its slope. As shown in Figure 9c, the trend of the curves in the graph is basically the same, and all the curves are monotonous upward curves. The lower the CB, the fewer firm will be able to improve their technology in an all-round way at the same time. Under the complete barrier and non-barrier conditions, the speed of ITI will decrease by 76.5%. Therefore, CB have a tremendous impact on the rate of ITI.

6. Conclusions and Suggestions

6.1. Conclusions

Because there is no systematic description of the process of ITI, and there is not much research on the communication barrier and spillover effect. In order to remedy this deficiency, through a system dynamics model of ITI, the study simulates the path of ITI and analyses the regulatory communication barrier and spillover effect on ITI. The results show that: (1) SE has a significant impact on ITI in various radiation directions, and deeper exchanges and cooperation between firm should be encouraged. With different SE, the completion rate of ITI improvement in simulation increase by 11%. (2) CB plays an important role in regulating ITI, and lower CB can effectively enhance the process of ITI. CB transmission not only accelerates the LTIR but also shortens the time to complete the overall ITI. Even under different size of CB, the ITI improvement in the simulation experiment increased by 76.5%.

6.2. Suggestions

At the institutional level, we should improve the top-level design, promote cooperation between firms and establish appropriate industrial agglomeration areas. The cooperation between firms is not simply the capital input of lagging firm by advantageous firm, nor the investment of large amounts of resources into departments with low production efficiency. At the same time, we should increase investment in R&D and change the economic development model of labor-intensive industries. Because core technology cannot be obtained from other firm, it can only be obtained through independent research and development, so in order to enhance the status of the international value chain, we must adhere to the principle of “innovation-driven”, and enhance scientific research to break through the bottleneck of transformation of scientific research achievements.
At the market level, we should promote market-oriented development, make use of the advantages of market resource allocation, promote benign cooperation among firm, and prevent malignant competition among firms. There is still a certain gap between developing countries scientific research and the developed countries in the world. For the market, it is necessary to guide capital into R&D units of science and technology, which can greatly enhance the ability of scientific research organizations, meanwhile increase applied research and innovative research projects. We should introduce market mechanisms to promote cooperation among scientific research institutions such as universities, encourage cooperation across regions and industries, and support exploratory cooperation. We also should establish a high-tech market, and improve the supervision and testing system of firms’ innovative achievements, promoting the landing of scientific research achievements, and give full play to the role of scientific research institutions in promoting the surrounding areas.
At the government level, a complete information exchange network should be established. In recent years, with the rapid development of infrastructure construction in China, the efficiency of information exchange has been further improved, but there is still a big gap compared with the advanced level in the world. We should reduce CB and actively develop technical cooperation, in order to promote win-win cooperation among enterprises and prevent waste of resources. In order to change the current situation of slow infrastructure construction in China, we should not rush for quick success and instant benefit in infrastructure construction. We should take into account the bearing capacity of the region in the future and reserve the necessary space for future expansion, and give full play to the regulatory role of information communication and promote innovation.

Author Contributions

Data curation, B.G.; Formal analysis, J.G.; Funding acquisition, J.X. and B.Y.; Methodology, J.G.; Project administration, J.X.; Resources, B.Y.; Software, J.G.; Validation, X.S.; Visualization, J.G., B.G. and X.S.; Writing—original draft, J.G.; Writing—review & editing, B.G. and X.S.

Funding

This research was funded by Ministry of Education Humanities and Social Sciences Research Project (19YJC630178); Project of National Natural Science Foundation of China (71502050); Henan Philosophy and Social Sciences Planning Project (2018CJJ080); General Project of Humanities and Social Sciences of Henan Education Department (2019-ZZJH-043); Key Scientific Research Projects of Henan Higher Education Institutions (17A630022); The Fundamental Research Funds for the Universities of Henan Province (SKJYB2016-07).

Conflicts of Interest

The authors declare no conflict of interest.

References

  1. Loke, B. China’s economic slowdown: Implications for Beijing’s institutional power and global governance role. Pac. Rev. 2018, 31, 673–691. [Google Scholar] [CrossRef]
  2. Liu, C.; Guo, Q. Technology Spillover Effect in China: The Spatiotemporal Evolution and Its Drivers. Sustainability 2019, 11, 1694. [Google Scholar] [CrossRef]
  3. Feng, T.; Sun, L.; Zhang, Y. The relationship between energy consumption structure, economic structure and energy intensity in China. Energy Policy 2009, 37, 5475–5483. [Google Scholar] [CrossRef]
  4. Ramaswami, A.; Jiang, D.; Tong, K.; Zhao, J. Impact of the Economic Structure of Cities on Urban Scaling Factors: Implications for Urban Material and Energy Flows in China. J. Ind. Ecol. 2017, 79, 16115. [Google Scholar] [CrossRef]
  5. Dong, J.; Xu, Y.; Hwang, B.G.; Ren, R.; Chen, Z. The Impact of Underground Logistics System on Urban Sustainable Development: A System Dynamics Approach. Sustainability 2019, 11, 1223. [Google Scholar] [CrossRef]
  6. Zheng, J.H.; Song, J.; Zhang, Y.C.; Zheng, Y.; Jiang, Q.K. The Evaluation of Conversion of New and Old Driving Force of China’s Economic Growth. China Ind. Econ. 2018, 6, 24–42. [Google Scholar]
  7. Du, M.; Wang, B.; Zhang, N. National research funding and energy efficiency: Evidence from the National Science Foundation of China. Energy Policy 2018, 120, 335–346. [Google Scholar] [CrossRef]
  8. Harrison, R.; Scheela, W.; Lai, P.C.; Vivekarajah, S. Beyond institutional voids and the middle-income trap: The emerging business angel market in Malaysia. Asia Pac. J. Manag. 2017, 35, 965–991. [Google Scholar] [CrossRef] [Green Version]
  9. Lingliang, Z. Conceptual Analysis of China’s Belt and Road Initiative: A Road towards a Regional Community of Common Destiny. Chin. J. Int. Law 2016, 15, 21. [Google Scholar] [CrossRef]
  10. Liu, S.X. Innovation Design: Made in China 2025. Des. Manag. Rev. 2016, 27, 52–58. [Google Scholar]
  11. Singh, R.; O’Hagan, F. “Apping Up”: Prospects for Information Technology Innovation in Return to Work Communication. J. Occup. Rehabil. 2018, 29, 104–118. [Google Scholar] [CrossRef]
  12. Choi, S.; Noh, M.S.; Yoon, J.; Park, H.; Seo, W. Analyzing Technological Spillover Effects between Technology Classes: The Case of Korea Technology Finance Corporation. IEEE Access 2018, 6, 3573–3584. [Google Scholar] [CrossRef]
  13. Grupp, H. Spillover effects and the science base of innovations reconsidered: An empirical approach. J. Evol. Econ. 1996, 6, 175–197. [Google Scholar] [CrossRef]
  14. Srholec, M. Understanding the diversity of cooperation on innovation across countries: Multilevel evidence from Europe. Pap. Innov. Stud. 2015, 24, 159–182. [Google Scholar] [CrossRef]
  15. Liu, X.; Buck, T. Innovation performance and channels for international technology spillovers: Evidence from Chinese high-tech industries. Res. Policy 2007, 36, 355–366. [Google Scholar] [CrossRef]
  16. Weber, B.; Heidenreich, S. Improving innovation capabilities by cooperation: Examining effects of core network management functions and relational mechanisms in the industrial goods sector. Int. J. Innov. Manag. 2016, 20, 1650074. [Google Scholar] [CrossRef]
  17. Stejskal, J.; Meričková, B.M.; Prokop, V. The cooperation between enterprises: Significant part of the innovation process—A case study of the czech machinery industry. E M Èkon. Manag. 2016, 19, 110–122. [Google Scholar] [CrossRef]
  18. Tigabu, A.D.; Berkhout, F.; Van Beukering, P. Technology innovation systems and technology diffusion: Adoption of bio-digestion in an emerging innovation system in Rwanda. Technol. Forecast. Soc. Chang. 2015, 90, 318–330. [Google Scholar] [CrossRef]
  19. Wei, S.; Yong, Z. Compulsory Technology Transfer, Adptive Ripening and Innovation Spillover Effect—From China Industry’s Empirical Evidence. Soft Sci. 2019, 33, 52–55. (In Chinese) [Google Scholar]
  20. Radicic, D.; Douglas, D.; Pugh, G.; Jackson, I. Cooperation for innovation and its impact on technological and non-technological innovation: Empirical evidence from European SMEs in traditional manufacturing industries. Int. J. Innov. Manag. 2019, 23, 1–41. [Google Scholar] [CrossRef]
  21. Kang, J.H.; Lee, J.S.; Jang, D.S.; Park, S.S. A Methodology of Partner Selection for Sustainable Industry-University Cooperation Based on LDA Topic Model. Sustainability 2019, 11, 3478. [Google Scholar] [CrossRef]
  22. Nave, A.; Franco, M. University-Firm cooperation as a way to promote sustainability practices: A sustainable entrepreneurship perspective. J. Clean. Prod. 2019, 230, 1188–1196. [Google Scholar] [CrossRef]
  23. De Moraes Silva, D.R.; Furtado, A.T.; Vonortas, N.S. University-industry R&D cooperation in Brazil: A sectoral approach. J. Technol. Transf. 2018, 43, 1–31. [Google Scholar]
  24. Liping, W.; Huiming, L. Organization Distance, Value Co-Creation, and Industry-University-Research Collaborative Innovation Performance. Chin. J. Manag. 2019, 5, 704–711. [Google Scholar]
  25. Forrester, J.W. Industrial Dynamics; MIT Press: Cambridge, MA, USA, 1961; p. 11. [Google Scholar]
  26. Hayward, J.; Roach, P.A. Newton’s laws as an interpretive framework in system dynamics. Syst. Dyn. Rev. 2018, 33, 183–218. [Google Scholar] [CrossRef]
  27. Ding, Z.; Zhu, M.; Tam, V.W.; Yi, G.; Tran, C.N. A system dynamics-based environmental benefit assessment model of construction waste reduction management at the design and construction stages. J. Clean. Prod. 2018, 176, 676–692. [Google Scholar] [CrossRef]
  28. Biondi, G.; Onori, R.; Volpetti, C.; Carlini, C.; Tsaples, G.; Armenia, S. A system dynamics simulation tool for the management of extreme events in urban transportation systems. Int. J. Crit. Infrastruct. 2018, 13, 329. [Google Scholar] [CrossRef]
  29. Xu, T.; Birchfield, A.B.; Overbye, T.J. Modeling, Tuning, and Validating System Dynamics in Synthetic Electric Grids. IEEE Trans. Power Syst. 2018, 33, 6501–6509. [Google Scholar] [CrossRef]
  30. Tunzelmann, N.V.; Wang, Q. An evolutionary view of dynamic capabilities. Manag. Acc. Res. 2003, 6, 47–62. [Google Scholar]
  31. Tunzelmann, N.V.; Wang, Q. Capabilities and production theory. Struct. Chang. Econ. Dyn. 2007, 18, 192–211. [Google Scholar] [CrossRef]
  32. Rapp, F. Analytical Philosophy of Technology; Springer: Berlin, The Netherlands, 1985; pp. 77–78. [Google Scholar]
  33. Winter, S. Knowledge and Competence as Strategic Assets. Strateg. Manag. Int. Cap. 1998, 10, 165–187. [Google Scholar]
  34. Bo, C.; Eliasson, G. The Nature and Importance of Economic Competence. Ind. Corp. Chang. 1991, 3, 687–711. [Google Scholar]
  35. Martínez-Román, J.A.; Romero, I. Determinants of innovativeness in SMEs: Disentangling core innovation and technology adoption capabilities. Rev. Manag. Sci. 2017, 11, 1–27. [Google Scholar] [CrossRef]
  36. Broekel, T.; Rogge, N.; Brenner, T. The innovation efficiency of German regions—A shared-input DEA approach. Rev. Reg. Res. 2018, 38, 77–109. [Google Scholar] [CrossRef]
  37. Lee, H.; Cha, S.; Park, H. The effect of technology-exploration on product innovation: An analysis based on Korean manufacturing SMEs. Int. J. Qual. Innov. 2016, 2, 285. [Google Scholar] [CrossRef]
  38. Zoia, M.G.; Barbieri, L.; Cortelezzi, F.; Marseguerra, G. The determinants of Italian firms’ technological competencies and capabilities. Eurasian Bus. Rev. 2018, 8, 453–476. [Google Scholar] [CrossRef]
  39. Fang, C.; Ma, H.; Wang, Z.; Li, G. The sustainable development of innovative cities in China: Comprehensive assessment and future configuration. J. Geogr. Sci. 2014, 24, 1095–1114. [Google Scholar] [CrossRef] [Green Version]
  40. Kalapouti, K.; Petridis, K.; Malesios, C.; Dey, P.K. Measuring efficiency of innovation using combined Data Envelopment Analysis and Structural Equation Modeling: Empirical study in EU regions. Ann. Oper. Res. 2017, 1–24. [Google Scholar] [CrossRef]
  41. Miao, Y.; Song, J.; Lee, K.; Jin, C. Technological catch-up by east Asian firms: Trends, issues, and future research agenda. Asia Pac. J. Manag. 2018, 35, 639–669. [Google Scholar] [CrossRef]
  42. Rieu, A.M. Innovation today: The Triple Helix and research diversity. Triple Helix 2014, 1, 237. [Google Scholar] [CrossRef]
  43. Rosenzweig, S. The effects of diversified technology and country knowledge on the impact of technological innovation. J. Technol. Transf. 2017, 42, 564–584. [Google Scholar] [CrossRef]
  44. Lee, C.Y.; Lee, J.H.; Gaur, A.S. Are large business groups conducive to industry innovation? The moderating role of technological appropriability. Asia Pac. J. Manag. 2017, 34, 1–25. [Google Scholar] [CrossRef]
  45. Wang, R.H.; Lv, Y.B.; Duan, M. Evolutionary game of inter-firm knowledge sharing in innovation cluster. Evol. Syst. 2016, 8, 121–133. [Google Scholar] [CrossRef]
  46. Alba, M.F.; Mas-Verdú, F. New firm creation and innovation: Industrial patterns and inter-sectoral linkages. Int. Entrep. Manag. J. 2013, 9, 501–519. [Google Scholar] [CrossRef]
  47. Zhou, G. An Empirical Study of the Technological Innovation Cooperation Performance between the Resource-Based Enterprises; Springer: Berlin/Heidelberg, Germany, 2014; pp. 1207–1218. [Google Scholar]
  48. Lee, C.; Park, G.; Kang, J. The impact of convergence between science and technology on innovation. J. Technol. Transf. 2016, 43, 522–544. [Google Scholar] [CrossRef]
  49. Xie, L.; Wang, S. The effect of domestic and foreign trade coordination on technological innovation: Complements or substitutes? Front. Bus. Res. China 2017, 11, 14. [Google Scholar] [CrossRef]
  50. Bass, F.M. A New Product Growth for Model Customer Durables. Manag. Sci. 1969, 5, 215–227. [Google Scholar] [CrossRef]
  51. Zhu, K.; Kraemer, K.L.; Xu, S.; Dedrick, J. Information technology payoff in e-business environments: An international perspective on value creation of e-business in the financial services industry. J. Manag. Inform. Syst. 2004, 1, 17–54. [Google Scholar] [CrossRef]
  52. Davis, F.D. User Acceptance of Information Technology:System Characteristics, User Perceptions and Behavioral Impacts. Int. J. Man Mach. Stud. 1993, 3, 475–487. [Google Scholar] [CrossRef]
  53. China Statistical Yearbook (1981–2018). Available online: http://data.cnki.net/Yearbook/ Single/%20N2018110025 (accessed on 20 May 2019). (In Chinese).
  54. Kiermer, V. Six degrees of separation. Nat. Methods 2006, 3, 964. [Google Scholar] [CrossRef]
  55. JIGUANG Smart Phone Industry Research Report. Available online: https://doc.mbalib.com/view/5bc89c03945c 8911ca99578df80c3f05.html (accessed on 12 May 2019). (In Chinese).
Figure 1. Structure of ITI.
Sustainability 11 04841 g001
Figure 2. System of ITI.
Sustainability 11 04841 g002
Figure 3. Realistic and Simulation.
Sustainability 11 04841 g003
Figure 4. Comparison of the Two Types of Firms.
Sustainability 11 04841 g004
Figure 5. Comparison of Two Willingness.
Sustainability 11 04841 g005
Figure 6. Comparison of Two Rates.
Sustainability 11 04841 g006
Figure 7. TI Under the SE.
Sustainability 11 04841 g007
Figure 8. (a) Change of IDR; (b) Change of TI; (c) Change of SE.
Sustainability 11 04841 g008
Figure 9. (a) Change of PCG; (b) Change of LTIR, (c) Change of TI.
Sustainability 11 04841 g009aSustainability 11 04841 g009b
Table 1. Loops of ITI.
CategoryVariables
Forward Loopsense of firm crisis, etc.—willingness of LTI—Lab. innovation—Industrialization evaluation—willingness of IDTI—ITI
Feedback Loop1ITI—sense of firm crisis—Forward Loop—ITI
Feedback Loop2ITI—Spillover effect—willingness of IDTI—ITI
Feedback Loop3Compared to the threshold—Industrialization evaluation—willingness of IDTI—Compared to the threshold
Feedback Loop4Lab. Innovation—sense of firm crisis, etc.—willingness of LTI—Lab. Innovation
Table 2. Variables and Codes.
CodeVariableReference
NLTINumber of firm without LTI[50]
LTI&UINumber of LTI improvement & unimproved IDTI[50]
TITotal ITI[50]
LTIRLTI rate[50]
IDRIDTI rate[50]
LTIWLTI willingness[50]
IWIDTI willingness[50]
FCFFirm crisis feeling[43]
LTICLTI Controllability[44]
TBASRUTechnological breakthrough of scientific research units[35,36]
DDemand[37]
FCFRFirm communication frequency[43]
CBcommunication barrier[2]
PCGProduct comparison gap[37]
SESpillover effect[39]
SSpillover coefficient[39]
COOCooperative spillover strength[39]
COMCompetitive spillover intensity[39]
COORCooperation firm ratio[20]
COMRCompetition firm ratio[20]
COOFCCooperative firm coefficient[20]
ITICRITI completion rate[50]
TNFTotal number of firm[50]
STStart threshold[49]
IFIndustrialization feasibility[51]
NPNew product industrialization evaluation[50]
IPFIndividual preference of firm[22]
IPIndustrial profit[52]
CCost[52]
PProfit[52]
PUITPractical utility of industrial technology[51]
IUIndustrial usefulness[51]
RAPRelative advantage of product[51]
IEUIndustrial ease of use[51]
POProduct operability[51]
TCTechnical complexity[51]
SCSystem compatibility[51]
FLCFlow control[51]
Table 3. Setting of the Parameters.
VariableValueFoundationDate
TBASRU0.136Outstanding Youth Science Foundation passing rateChina Statistical Yearbook [53]
ST0.1121.5 times the loan interest rateChina Statistical Yearbook [53]
LTC0.33The National Natural Science Foundation of China passing rateChina Statistical Yearbook [53]
RAP0.135Delphi MethodExpert Groups and Surveys
SC0.679Delphi MethodExpert Groups and Surveys
FLC0.369Delphi MethodExpert Groups and Surveys
PO0.579Delphi MethodExpert Groups and Surveys
TC0.236Proportion of invention patentsChina Statistical Yearbook [53]
P0.3Four times the rate of inflationChina Statistical Yearbook [53]
C0.15Two times the rate of inflationChina Statistical Yearbook [53]
IP0.156Delphi MethodExpert Groups and Surveys
OC0.3Delphi MethodExpert Groups and Surveys
COO0.3Delphi MethodExpert Groups and Surveys
COM0.1Delphi MethodExpert Groups and Surveys
COOEC0.3Delphi MethodExpert Groups and Surveys
TNE3000Delphi MethodExpert Groups and Surveys
CB6Six Degrees of SeparationStanley Milgram [54]
Table 4. SE Coefficient Assignment Table (1).
CodeS1S2S3S4
assignment0.20.5−0.2−0.5
Table 5. SE Coefficient Assignment Table (2).
CodeS5S6S7S8
assignment0.10.250.40.55

