Article

Sustainable Livelihood Capital and Strategy in Rural Tourism Households: A Seasonality Perspective

1
Department of Tourism Management, Business School, Guangxi University, No.100 East Daxue Road, Nanning 530004, Guangxi, China
2
Department of Management, Jones College of Business, Middle Tennessee State University, MTSU Box75, Murfreesboro, TN 37132, USA
*
Author to whom correspondence should be addressed.
Sustainability 2019, 11(18), 4833; https://doi.org/10.3390/su11184833
Submission received: 5 August 2019 / Revised: 1 September 2019 / Accepted: 1 September 2019 / Published: 4 September 2019

Abstract

:
As an inherent characteristic and pervasive market phenomenon of the tourism industry, seasonality plays an important role in tourist business survivability and sustainability. It is also a significant factor for rural households involved in tourism as they plan their livelihood strategies around it. In this study, household surveys were conducted in The Beautiful South, an area for rural tourism in Guangxi of Southern China. We analyzed the livelihood capital and strategy of different household types in response to seasonal fluctuations in tourism by applying a mixed method that integrated livelihood capital index (LCI) evaluation and data envelopment analysis. The results indicate that LCI of tourism income-oriented households ranks second among the four types of households, while the LCI of tourism-engaged households in peak season performed better than that of those not engaged. However, the number of households participating in tourism nearly halved during the off season, and they are mainly diverted to temporary labor work, which may be one of the reasons for the low livelihood capital efficiency of tourism households. The implications of the findings and empirical solutions to mitigate the negative seasonal impact are discussed.

1. Introduction

As a multifaceted activity, tourism positively impacts rural communities [1]. For underdeveloped rural areas rich in tourism resources, tourism is a source of economic development and employment opportunities [2,3]. Changes in rural areas in light of economic needs and poverty alleviation have caused many rural households to incorporate tourism into their livelihood strategy [3,4,5,6].
Sustainable livelihood from tourism is a branch of sustainable livelihood research [7]. Livelihood is usually investigated at the household level [8] and can be defined as the combination of multiple assets and activities which contribute to the income of local residents [9]. Sustainable livelihood is characterized by safety from and resilience to stress as well as diversity of income sources [10]. The UK Department for International Development developed a Sustainable Livelihood Framework (SLF) that has been widely used as an analytical tool [11,12,13]. Based on the SLF, empirical studies on sustainable livelihood in the tourism sector, focusing on the impact of tourism on households’ livelihoods, have increased [14,15,16,17,18]. Many case studies have shown that rural households can enhance livelihood sustainability by adopting a series of livelihood strategies and multiple livelihood activities [19,20]. Residents who have adopted tourism-related livelihood activities instead of traditional hunting, gathering, or livestock and crop farming achieved improved living standards and natural resource preservation [21]. However, few studies have examined the relationship between seasonal fluctuations in tourism and household livelihood capital and strategies, which may have a significant influence on rural business operation.
Quantitative research into household livelihoods in terms of seasonal fluctuations in rural tourism is lacking, because the assessment of seasonality is often done in macrotourism economic research [22]. Seasonality in tourism, a pervasive market phenomenon characterized by uneven economic resources throughout the year, plays an important role in business survivability and tourist destination sustainability [23,24]. Seasonality is caused by many factors, and most researchers divide them into two main categories: natural and institutional variables [25]. Natural variables refer to seasonal changes in the suitability of tourism activities related to geographical location, climate, or temperature [26]. Institutional variables include holidays related to school types, national statutory holidays, and religious festivals [27]. Researchers and tourism enterprise managers have proposed many solutions to address the seasonality of tourism, irrespective of its causes [28,29]. In theory, Jang explored the use of financial portfolio theory to quantitatively minimize tourism destination seasonality [30]. In practice, tourism owners in the Danish Island of Bornholm responded to the off season by maintaining equipment, reducing staff, and finding other jobs [31]. In rural Southwest Scotland, small and microtourism operators chose to close down when the flow of tourists was low [32]. The abovementioned studies focused on the impact of tourism on local sustainable livelihoods or tourism seasonality analysis in different regions.
Subsequently, the main aim of this study was to determine the relationship between sustainable livelihood capital and strategy in rural tourism households in light of seasonal fluctuations, using an area for rural tourism named The Beautiful South in Southern China as a case study. To achieve this, the following research questions were examined: Firstly, what are the livelihood capital characteristics of different household types? Secondly, do the households involved in peak-season tourism have advantages in terms of livelihood capital and efficiency? Thirdly, what are the characteristics of livelihood strategy adjustments for households engaged in tourism?
This research promotes understanding of the quantitative relationship between household livelihood capital and strategic responses to tourism seasonality by integrating seasonal livelihood surveys, livelihood capital index evaluation, and data envelopment analysis (DEA). The findings can serve as a reference for improving sustainable livelihood theory in rural tourism and providing households with more targeted rural tourism management guidance.

2. Methods

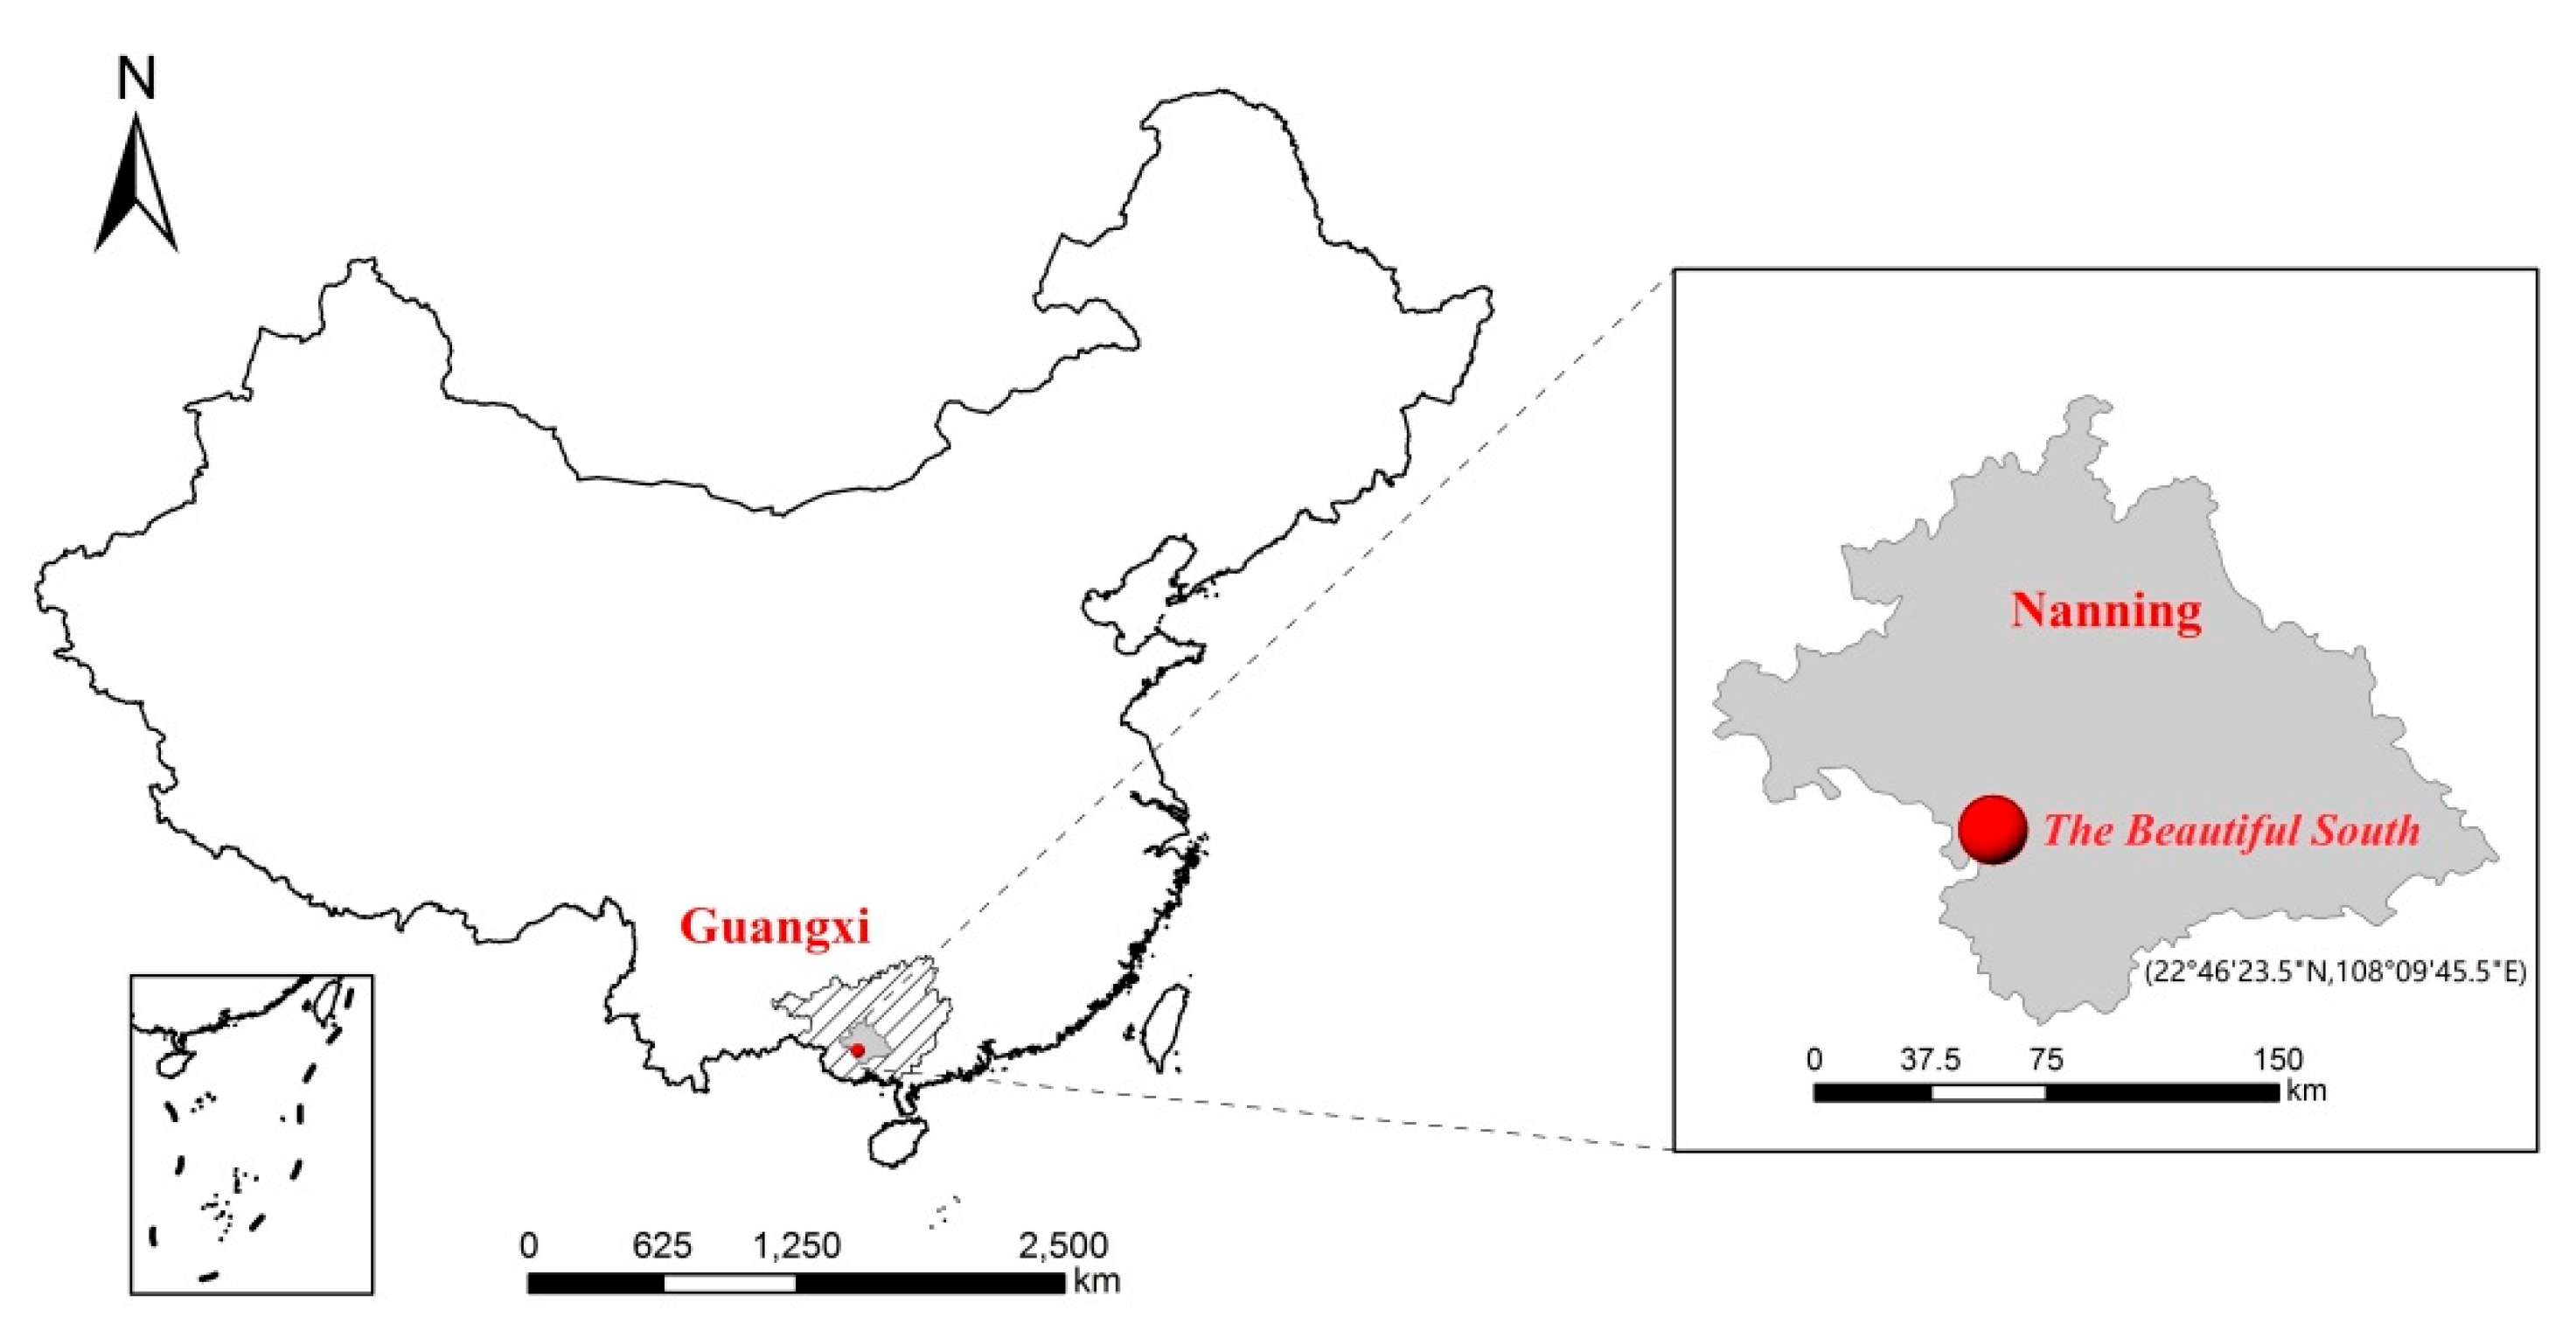
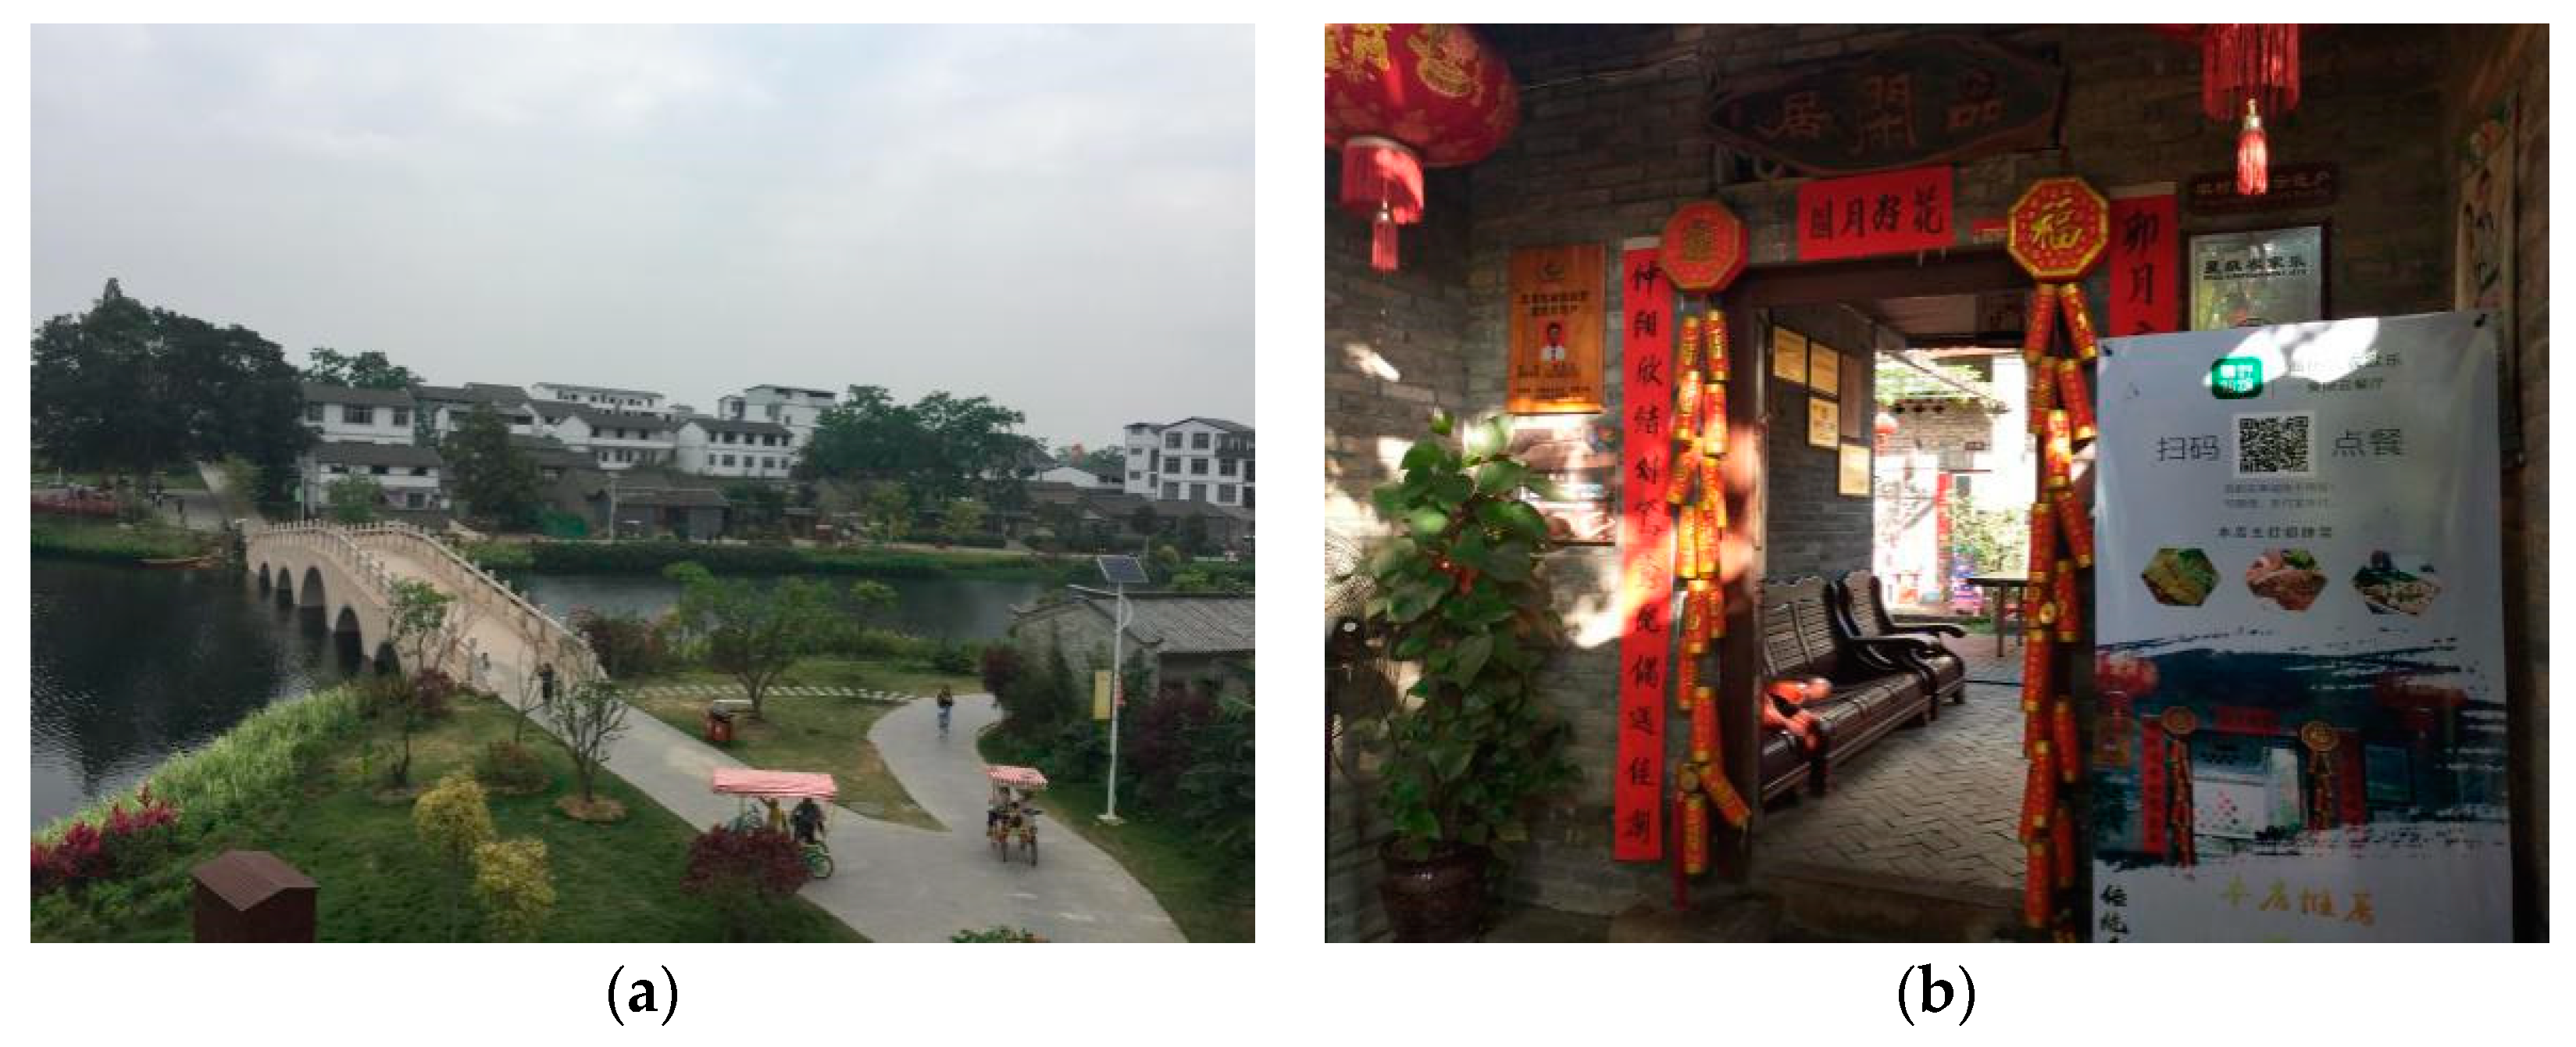
2.1. Case Study Area

The Beautiful South is located in Nanning of Guangxi Zhuang Autonomous Region in China (Figure 1). The Zhongliang resort (Zhongliang Village), the core area with 4 square kilometers in The Beautiful South, has a population of nearly 1700, the majority of whom are former farmers. Since its opening in 2006, it has become an important and continuous development region for rural tourism [33]. Funds from various channels were invested to expend the scope of the region and improve the infrastructure and overall tourism environment, which has resulted in its being recognized as one the most beautiful villages for leisure in China and a model of rural tourism [34] (Figure 2). Because of the tropical climate, the off season for the local tourism industry is in the hottest months (July to September), whereas the autumn and winter months constitute the peak season.

2.2. Data Source and Processing

To study the household livelihood characteristics of the core area in The Beautiful South, a field survey was performed from October to November of 2018. Semistructured interviews were initially conducted with Zhongliang village community managers and representatives of rural households to revise and improve the questionnaire. Subsequently, 24 well-trained senior undergraduate students majoring in tourism management were divided into 5 groups assigned to different areas, which conducted opportunity sampled interviews with the households from 4 to 6 November 2018. Under the guidance of village community managers, the respondents at home responded favorably to the survey request. Adults from indigenous and non-indigenous households were both included in our survey. Non-indigenous households in this study specifically refer to immigrants since 2006. To ensure that respondents had a good understanding of the research, the investigators explained the questionnaire in detail, and the interviews lasted between 35 and 50 min for each household. The research group distributed 150 questionnaires and collected 132 valid responses, representing a response rate of 88%. The content of the questionnaire included (1) basic information about the households, (2) the composition of households’ livelihood capital (natural, physical, human, social, and financial capital), (3) the basic livelihood strategies and annual income sources (farming, labor, microbusiness or leasing, tourism) of the surveyed households, and (4) seasonal adjustment of households’ livelihood strategies.

2.3. Rural Household Categories

The literature on livelihood strategies divides households into several types according to different standards, e.g., pure-, part-time, and non-agricultural households according to agriculture-related livelihood strategies [35,36]; landless fisher, landless nonfisher, small landowner fisher, small landowner nonfisher, and large landowner nonfisher according to land ownership and fishery profiles in local communities [37]; and farming, nonfarming, and mixed livelihood strategy according to the means of raising household income [38]. When seasonality is considered, rural households’ livelihood strategies become more complex and flexible.
In this case study, all households chose a single livelihood strategy as the primary source of household income and other activities as auxiliary income sources, i.e., the households had one livelihood activity accounting for more than 50% of total household income. This study therefore employed the following criteria regarding livelihood activity: Households whose income from agriculture, labor, microbusiness, or tourism accounted for more than 50% of total annual household income were respectively defined as agricultural households (Type A), laboring households (Type B), microbusiness households (Type C), or tourism households (Type D). Type C households included grocery stores and rental houses, whereas Type D households included restaurants, family hotels, transportation services, local specialty stores, tourism-related services, and on-site souvenir vendors.

2.4. Livelihood Capital Index

This study established an evaluation system of a livelihood capital index (LCI) based on the SLF. The SLF measures livelihood capital in five dimensions: natural, physical, human, social, and financial capital [39]. Considering the location, natural environment, and cultural customs, among other factors, the LCI evaluation system was designed to evaluate households’ livelihood capital (Table 1). The weight values are calculated by the entropy method (see Section 2.5).
Natural capital refers to the quantity and quality of farmland owned by households. The measured values indicate household members’ ability to use farmland for agricultural production or self-sufficiency. Physical capital refers to various resources owned by households, including housing, means of production, and life supplies. Human capital includes the number, ability, and education of the rural household labor force. The measured value significantly impacts the degree of freedom of production labor and livelihood strategy choices that a family has. Social capital refers to the social communication ability of household members and the degree to which they can obtain help from social organizations, relatives, and friends. Financial capital is the principal thing that rural household members need to invest when they adopt multiple livelihood strategies. Based on the hypothesis that rural tourism operators reinvest most of their income in continuous development, we treated tourism operating income as a proxy for financial capital.

2.5. Entropy Method and LCI

To determine the weights of measurement indicators, we adopted the entropy method [40] to measure the weight of the above livelihood index. The concept of entropy, from thermodynamics, was introduced into information theory by Shannon [41] in 1948 and subsequently applied in natural and social sciences [42]. According to this concept, the quantity and quality of information obtained in decision making determine the accuracy and reliability of the decision. System entropy can reflect the amount of information provided to decision makers. Accordingly, the entropy method is useful for determining the weights of measurement indicators of local residents [43].
Based on the sample data of 132 households obtained from the survey, the data of each indicator were standardized according to the following process. Since the quantified values acquired from the household survey differ in terms of dimension, magnitude, and range, we adopted the extremum method to standardize the data:
x i j = ( x i j x m i n x m a x x m i n ) × 100 % .
where x i j refers to the standardized value of x i j ; x i j represents the variable data of the jth indicator of the ith sample household; and x m a x and x m i n represent the maximum and minimum values of the sample variable, respectively.
The weight value was calculated by the following formula of entropy method. The specific gravity p i j of the ith sample household under the jth indicator was calculated as follows:
p i j = x i j / i = 1 m x i j .  
The entropy ej of the jth indicator was calculated as follows:
e j = 1 / l n m i = 1 m p i j l n p i j .
The weight value of the jth indicator (wj) was calculated as follows, and the results are shown in Table 1:
w j = ( 1 e j ) / i = 1 n ( 1 e j ) .  
The LCI was calculated as follows:
L C I = i = 1 n w j x i j .  

2.6. Efficiency Assessment of Livelihood Capital

To clarify whether the input of livelihood capital causes different outputs for households because of livelihood strategy diversification, we used DEA. In 1978, Charnes, Cooper, and Rhodes proposed an efficiency assessment model under the assumption of constant return to scale (CRS), which is known as the CCR model [44]. After six years, Banker, Charnes, and Cooper modified it under the assumption of variable returns to scale (VRS), which is known as the BCC model [45]. DEA, especially a basic model of CCR and BCC, is a widely applied method for assessing the relative efficiency of decision-making units (DMUs) using input and output data to establish a mathematical model [46]. The input vector (Ij) and output vector (Oj) of n DMU can be expressed as follows:
I j = ( x 1 j , x 2 j ,   ,   x m j ) T ,   j = 1 , 2 ,   ,   n .  
O j = ( y 1 j , y 2 j ,   ,   y q j ) T ,   j = 1 , 2 ,   ,   n . ,  
where m and q indicate the number of input and output indicators, respectively. Based on the output-oriented CCR and BCC model, the efficiency evaluation index φ of DMUs needed to meet the following requirements:
max φ   s . t .   j = 1 n λ j y r j φ y r k   j = 1 n λ j y r j φ y r k   λ 0   i = 1 , 2 , , m ;   r = 1 , 2 , , q ;   j = 1 , 2 , , n .  
min i = 1 m ν i x i k + ν 0   s . t .     r = 1 q μ r y r j i = 1 m ν i x i j ν 0 0   r = 1 s μ r y r k = 1   ν 0 ; μ 0 ;   ν 0   free i = 1 , 2 , , m ;   r = 1 , 2 , , q ;   j = 1 , 2 , , n .
where λ presents the coefficient of linear combination; ν and μ present the optimal pair of values; k presents the currently measured DMU.
The technical efficiency (TE) of household livelihood capital was calculated through Equation (8). The assumption of VRS makes it possible to measure purely technical efficiency (PTE) through Equation (9), which is the measurement TE without scale efficiency (SE). As shown in Equation (10), TE calculated by the CCR model can be decomposed into PTE by the BCC model and SE. PTE refers to the efficiency affected by factors such as management and technology. SE is the efficiency affected by scale factors.
This study used the households as DMUs, the five types of livelihood capital as input variables, and household income as output variable. In this research, the software MaxDEA 7.0 was applied to calculate the efficiency values of TE, PTE, and SE of 132 households. Meanwhile, the geometric average values were calculated according to the classification of household types.
T E ( C R S ) = P T E ( V R S ) × S E .

3. Results

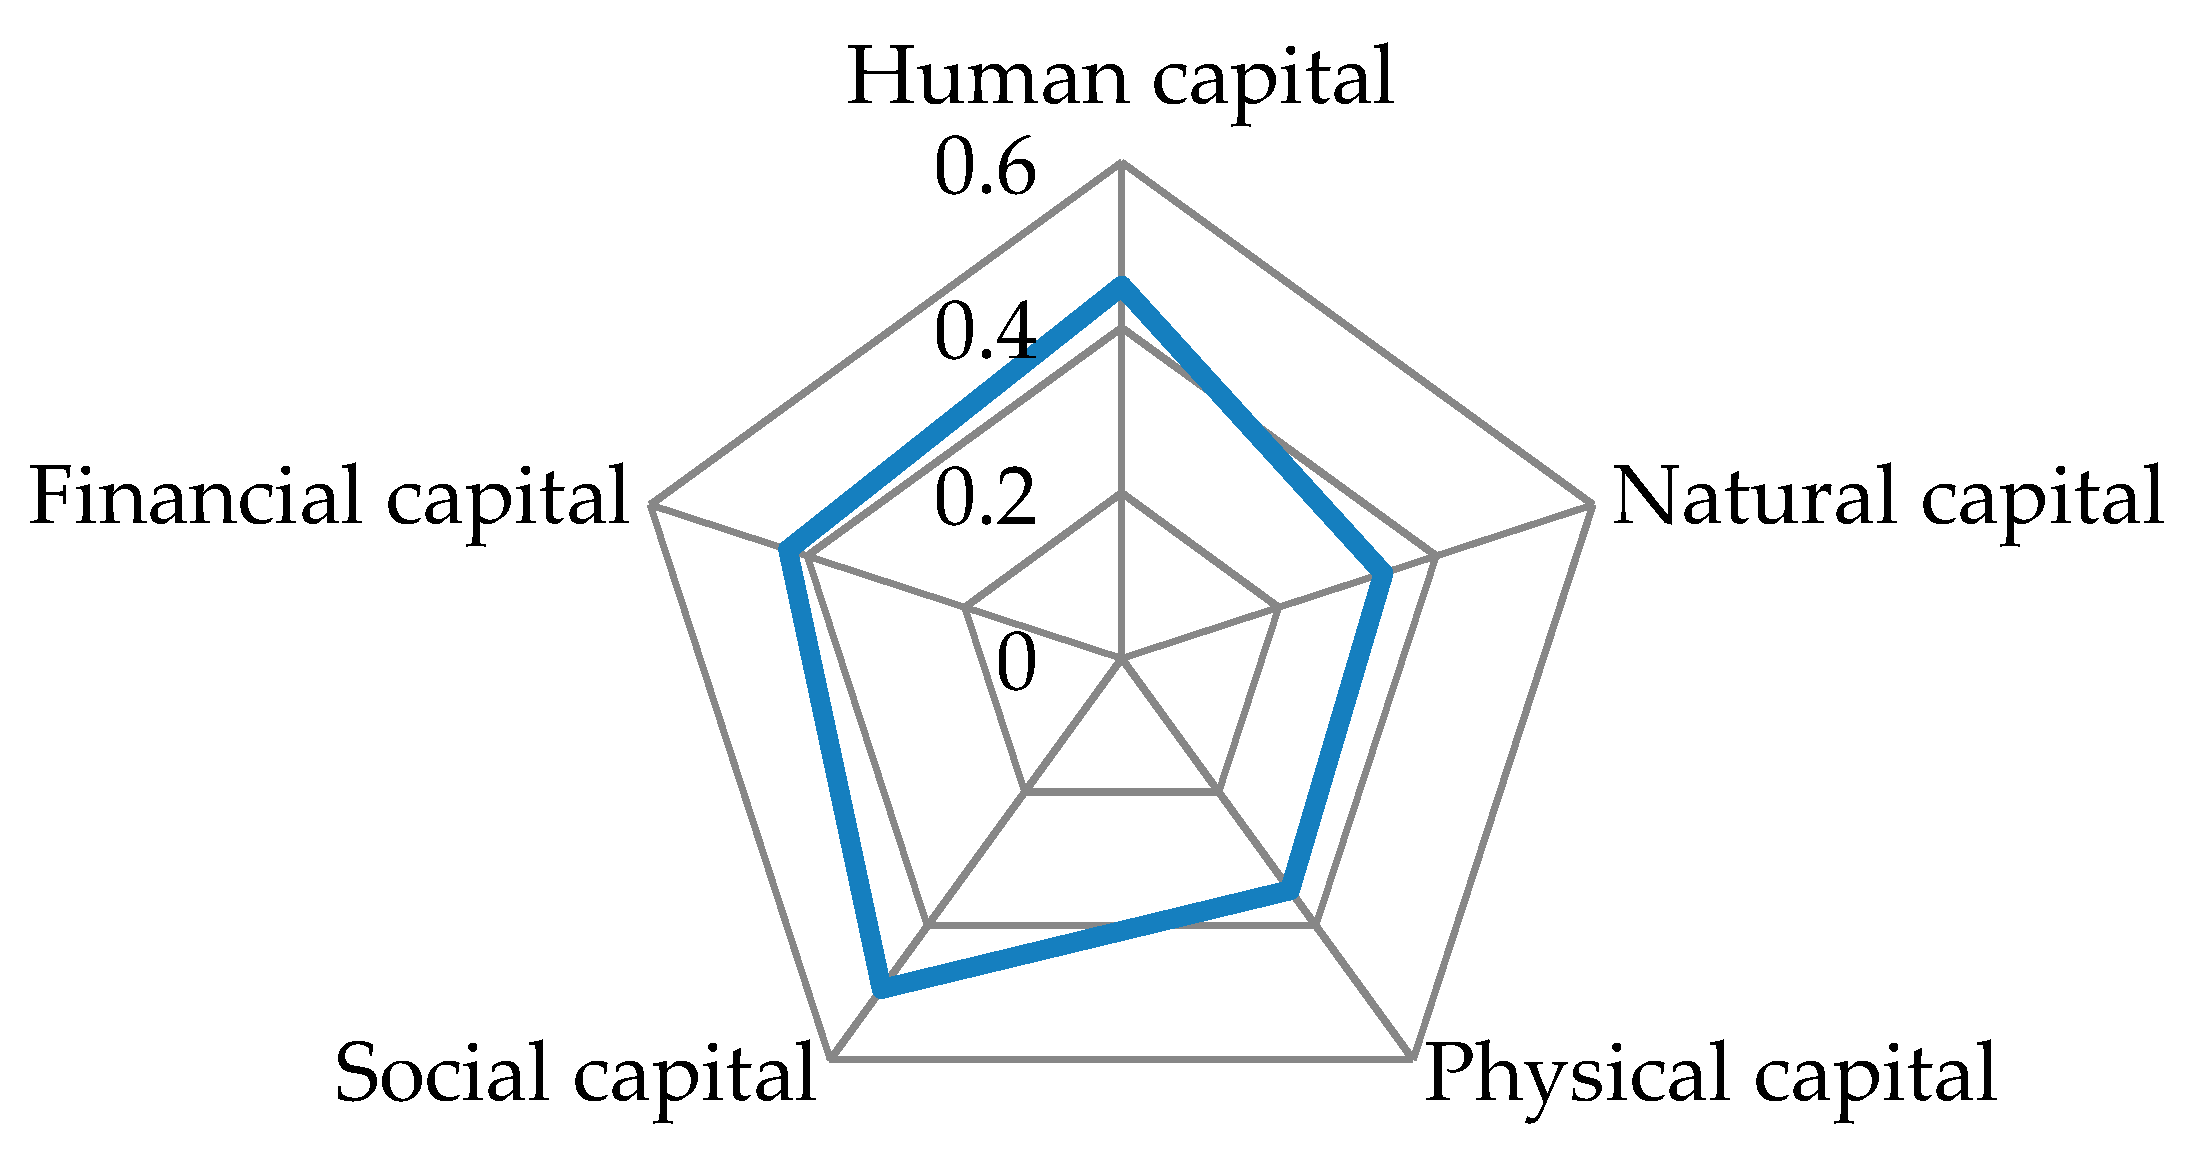
3.1. Household Livelihood Assets

The general LCI in The Beautiful South was 2.050. In terms of the types of livelihood capital, households in the study area generally had relatively high social and human capital (0.494 and 0.450, respectively) and low natural and physical capital (0.333 and 0.347, respectively) (Figure 3). The value of natural capital is relatively lower than that in other case studies [47,48,49], because the implementation of land transfer policies has reduced many residents’ farmland. In addition, many non-indigenous households have migrated from other villages or cities in search of employment and integrated into the local community without owning agricultural land. Family-owned business households are a relatively common phenomenon in tourism development [50] and are present in various tourist destinations in China.

3.2. Livelihood Capital of Various Household Types

Based on the rural household categories above, the comparison between households showed that the livelihood capital stocks of microbusiness households (Type C) and tourism households (Type D) were generally higher than those for agricultural households (Type A) and laboring households (Type B) (Table 2).

3.2.1. Natural Capital

Households with the highest natural capital were those mainly engaged in agriculture and whose livelihood capital reached 0.523. Both the quantity and quality of farmland these households owned were higher than those of households with other primary livelihood strategies. It further shows that the abundance of natural capital is the main motivation for choosing traditional agriculture. Tourism households had the lowest natural capital, with some having lost their land due to land expropriation by the government or long-term lease by the private sector and others being landless immigrant households.

3.2.2. Physical Capital

Compared with the other household types, microbusiness and tourism households had higher material livelihood capital, reaching 0.408 and 0.395, respectively. These two household types were superior to the others in terms of housing quality, housing area, means of production, and life supplies. Residents mainly involved in agriculture ranked worst in all aspects of physical capital, suggesting that such livelihood strategies may have a negative impact on material wellbeing.

3.2.3. Human Capital

The human capital index of microbusiness and tourism households was relatively high, reaching 0.532 and 0.526, respectively. The concentration of better human capital resources in microbusinesses and tourism indicated people’s judgment on the prospects of the industry. People in such fields have higher educational levels and better health. Agricultural households, accounting for the lowest proportion of the survey (3%), had the most age capital, indicating it is a livelihood option sustained by more adults. However, with the development of urbanization and people tending to work in cities [51], agricultural households with a relative low income may face the challenge of livelihood transformation due to manpower shortage.

3.2.4. Social Capital

Households engaged in microbusiness had the highest social capital value (0.678), whereas agricultural households had the lowest (0.380). Regarding participation in community activities, tourism households showed the highest enthusiasm. In financial or physical tough situations, only agricultural households had difficulty in seeking help, whereas other household types could access support more readily. In addition, agricultural and tourism households both had more opportunities for vocational training in terms of agricultural skills or rural hotel and restaurant operation. Nevertheless, for agricultural households, the overall social capital is low due to the weakness of social networking status, the ability to participate in the community, and the access to support. This is consistent with the result of another empirical study in China that categorizes different types of farmers [52].

3.2.5. Financial Capital

Agricultural households had the lowest annual income, had the most difficulty in obtaining loans, and ranked last among the household types in terms of financial capital. Tourism and laboring households had the highest financial capital (0.449 and 0.447, respectively). Laboring households, which accounted for more than 50% of the respondents, had the highest income level.

3.3. Livelihood Capital of Tourism Households

Influenced by seasonal fluctuation, many households engaged in multiple activities throughout the year to sustain their livelihoods. The 132 households that participated in this study were respectively divided into 74 and 58 households according to those who engaged or did not engage in tourism work during the peak season. The livelihood capital of households that engaged in tourism during the peak season was slightly higher than that of those who did not (Table 3). Among the five livelihood capital types, households not engaged in tourism had dominant natural capital, whereas the other types of capital were all lower than for households engaged in tourism. Therefore, engaging in tourism is a better livelihood strategy for residents who lack natural capital.

3.4. Seasonality Impacts Tourism-Engaged Households

An examination of the impact of seasonal fluctuations on livelihood strategy diversification of households engaged in tourism revealed that the number of households engaged in tourism in peak season (74) was more than double that in the off season (34) (Table 4). The 40 more households engaged in tourism during the peak season came from the following households: Tourism households (Type D) accounted for 57.5%, laboring households (Type B) for 30%, microbusiness households (Type C) for 7.5%, and agricultural households (Type A) for 5%. Therefore, households that periodically withdraw from tourism work because of seasonality were mainly from Type D and B households.
Part-time labor and farming were the main means of overcoming the problem of decreased income sources and labor surplus in the off season. Of the 74 tourism-engaged households, 44 engaged in part-time laboring jobs and 13 in agriculture during the off season, which increased by 83.3% and 116.7%, respectively, from the peak season. These seasonal changes in work were almost in line with the results of other relevant research. In the cases of Denmark and Nigeria, some family business operators were struggling in the off-season, hoping to increase their income from other sources [23,31].
Seasonal fluctuations in tourism did not have an obvious impact on the main livelihood activities of Type A, B, and C households. In the different tourism seasons, these three household types were engaged in tourism in order to diversify their income sources. Households whose members had long been engaged in tourism, but whose main income was not from tourism, were mostly engaged in casual and relatively low-income service work.

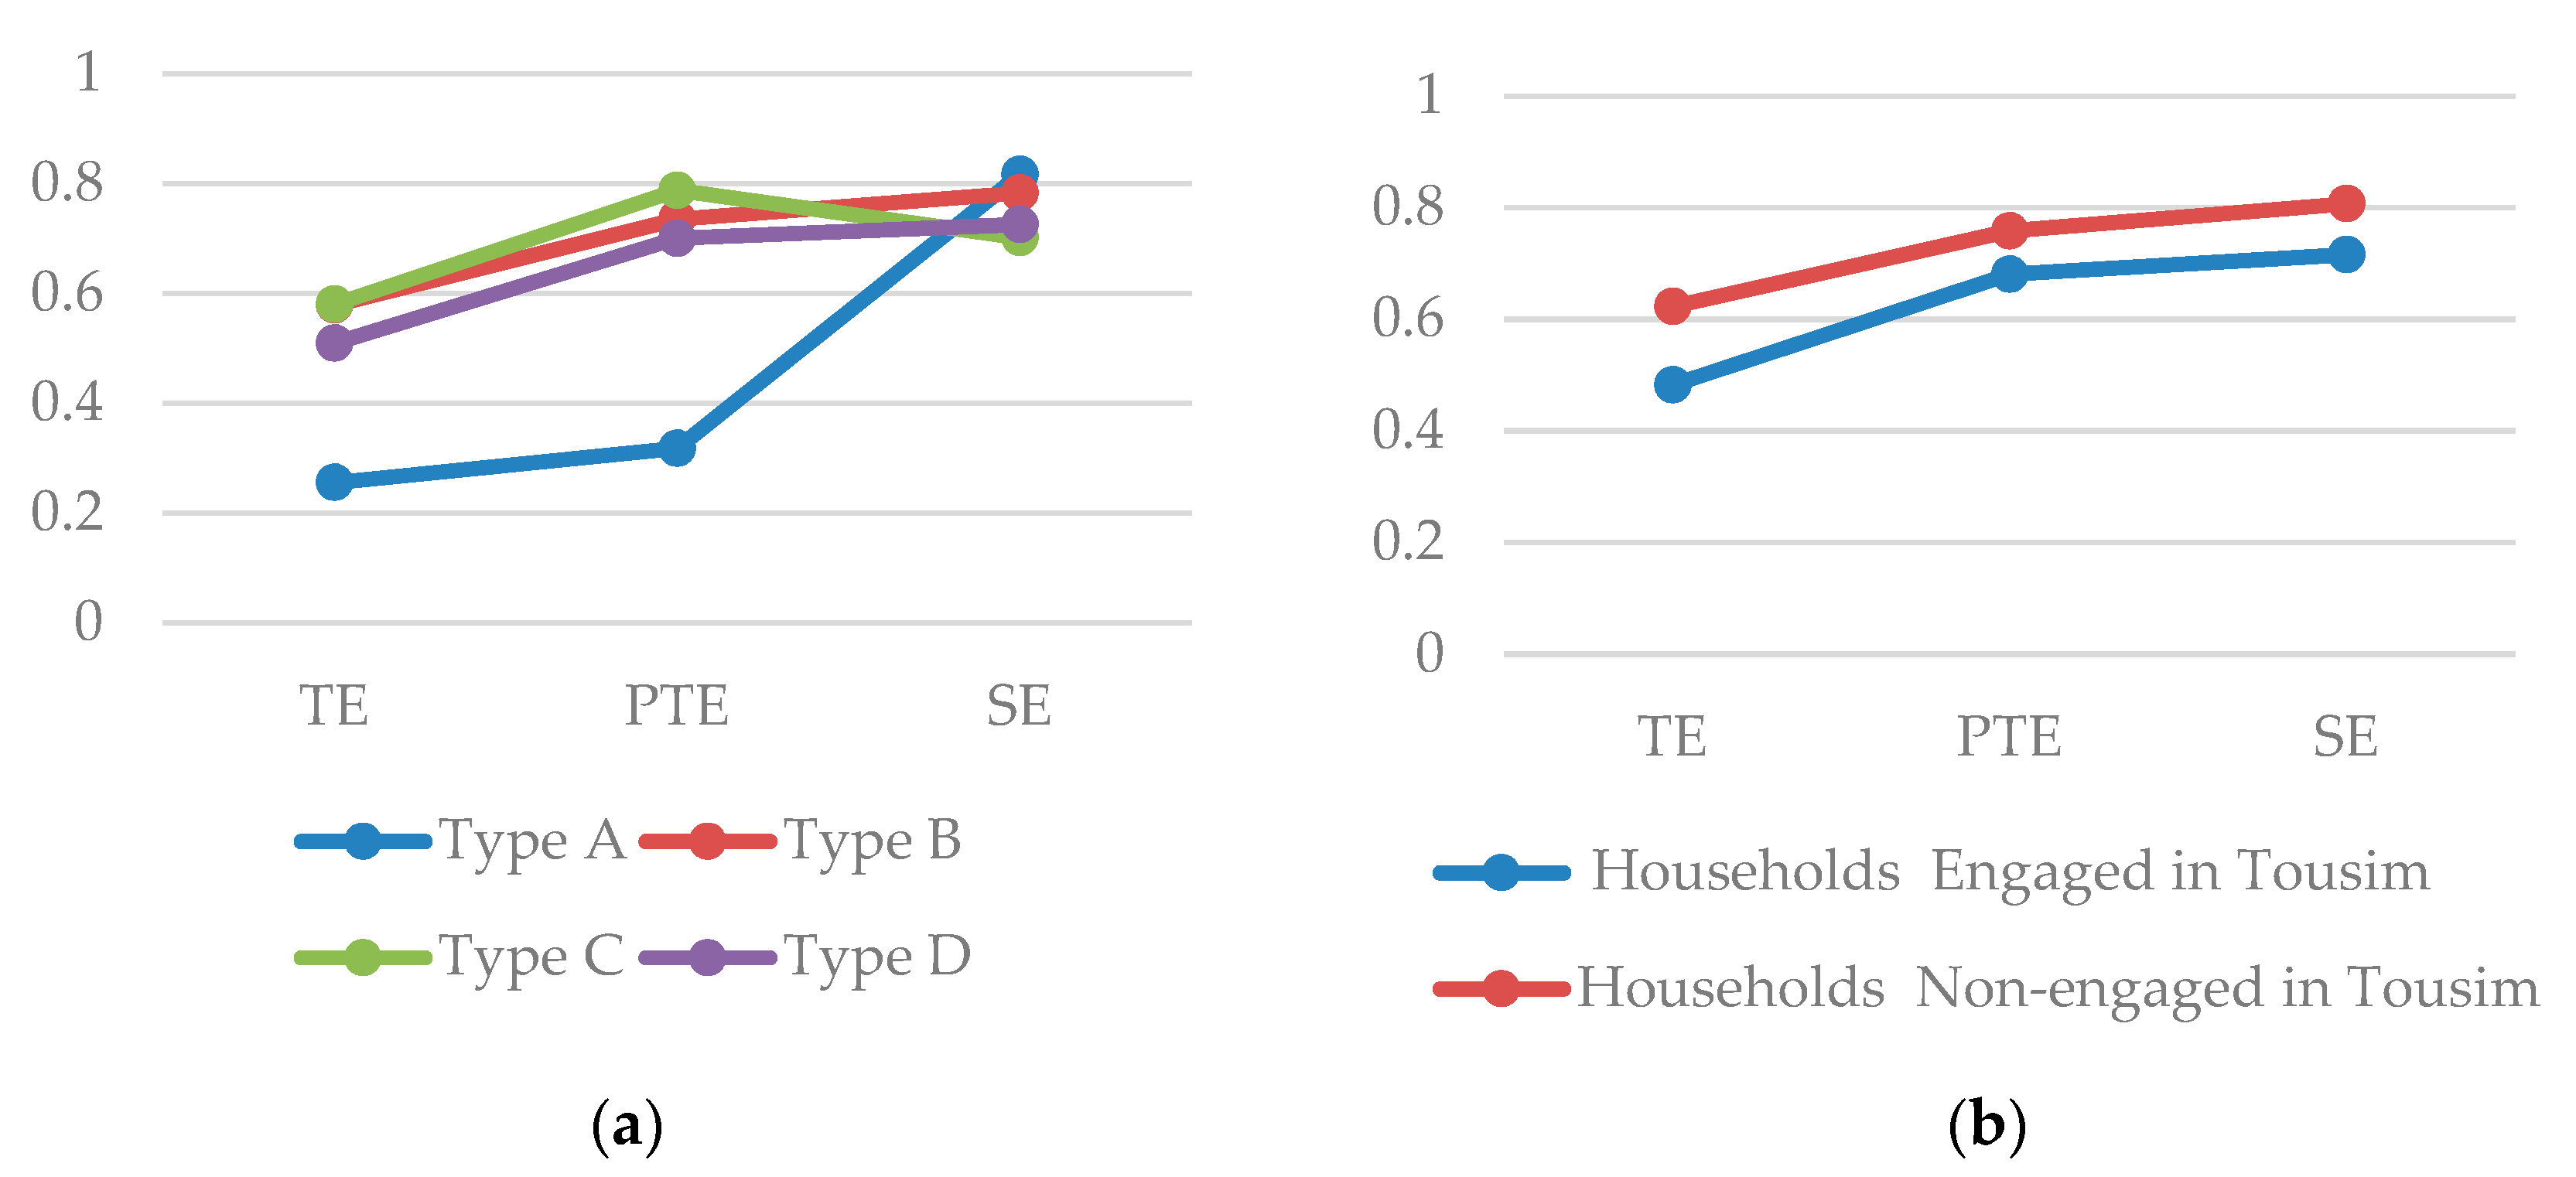
3.5. Efficiency Assessment of Livelihood Capitals

As shown in Figure 4a, the livelihood capital efficiency mean values of laboring (Type B), microbusiness (Type C), and tourism (Type D) households were close and high, whereas those from agricultural households (Type A) were low. In the limited sample of households with agriculture as the primary source of income, family-based agricultural production was less efficient, which may be the reason for the growing number of households adopting alternative livelihood strategies. The inefficiency of agricultural households may be one of the manifestations of the income gap between urban and rural areas in China [53]. Microbusiness households (Type C) had the highest TE value (0.580) due to a high PTE score of 0.788. The TE value of laboring households (0.579) was similar to that mentioned above, but the main contribution was from an SE score of 0.783. In this study, tourism households had the third-highest TE score (0.509) and did not have obvious advantages in terms of PTE and SE.
According to Figure 4b, the mean TE values of households engaged in tourism during peak season was lower than those of those not engaged. If households chose not to engage in tourism during the peak season, meaning that they have a more stable source of livelihood, the seasonal fluctuations in tourism may be an important reason for the low efficiency of livelihood capital.

4. Discussion and Conclusions

Seasonality is an important but poorly understood issue in the tourism industry [54]. Many rural destinations are mainly concerned with the positive impact of tourism on livelihoods but may ignore the negative effects of seasonality on sustainable development. This study identified seasonality as an important factor influencing sustainable livelihoods from tourism. We used the SLF, built an LCI measurement system, and analyzed the characteristics of various household types. Moreover, via DEA and comparisons, the impact of seasonality on households’ livelihood was clarified, which can provide a reference for the improvement of SLF in tourism.
The calculation and comparison of livelihood capital indicated that tourism fits well into the participating households’ livelihood strategies, and tourism-engaged households had livelihood capital advantages, which resulted in livelihood diversification and sustainability. In fact, the sustainability of their livelihoods may be affected by more factors from the stakeholders of the destination [55]. In this case study, changes in external environment presented both challenges and opportunities for households’ livelihoods. Large areas around villages designated as rural tourism development areas may result in agricultural land expropriated or rented. With the poverty alleviation policies encouraging tourism development, households need to spontaneously adjust their family’s livelihood behavior based on their livelihood capital conditions. In line with existing literature, the emergence of tourism in the study region has provided households with opportunities to diversify their livelihood strategies and improve their lives, thus promoting livelihood sustainability [56].
This study applied DEA to analyze livelihood capital efficiency based on different household types and involvement in tourism during peak season and revealed the weaknesses and diseconomy of rural tourism in the study area. Because of seasonality, only about half of the tourism households are able to maintain year-round operations. This may be the main reason for the low efficiency values of these households. The interviews indicated the following coping strategies for households to maintain their businesses during the off season: First, most businesses are direct investments and operations of agritainment (blend of agriculture + entertainment), which are more stable than casual work in tourism. Second, rural tourism facilities with distinctive decoration and service features enjoyed a relatively stable patronage. Third, such tourism operators used social media to connect with regular customers and strove for repeated sales by providing off-season discounts.
Seasonality may be used as a guide for assessing the development level of tourism in rural areas. The fact that tourism has become a year-round source of income for household members indicates that a relatively stable flow of local tourism has been able to support the industrialization of tourism. Decreased loss of income during the off season and increased profit during the peak season may be signs that the tourism industry is sufficiently developed. Under these circumstances, tourism operators are able to maintain their businesses or jobs throughout the year. In rural areas with underdeveloped tourism, tourism is merely another livelihood option incorporated into existing livelihoods, i.e., not a replacement [39].
This exploratory study aimed to provide a new perspective from which to address the sustainable livelihoods of rural tourism households. To clarify the impact of seasonality on the livelihood of rural households, future work should expand the scope of the survey, increase the sample size, and investigate seasonal changes in the livelihoods of households in different types of rural tourism destinations. In addition, an indicator system can be used to compare regions and time series. To improve the economic efficiency of households’ participation in rural tourism, future research should extensively study and discuss the management experience and livelihood strategies of different households in dealing with seasonality.

Author Contributions

Writing–original draft, Z.S.; Writing–review & editing, J.R.A.; Data curation, Y.G.; Investigation, H.W.

Funding

This research was jointly supported by National Natural Science Foundation of China (71764003), The MOE (Ministry of Education in China) Project of Humanities and Social Sciences (17YJCZH150), China Postdoctoral Science Foundation (2016M590847), China scholarship Council (201806665008), and Guangxi Postdoctoral Special Funding Project (160553).

Conflicts of Interest

The authors declare no conflict of interest.

References

  1. Lulia, C.M.; Camelia, F.O.; Rezhen, H.; Felix, H.A.; Andra, P.; Gabriela, O.C.; Alexandru, T.; Ramona, L. Local Residents’ Attitude toward Sustainable Rural Tourism Development. Sustainability 2016, 8, 100. [Google Scholar]
  2. Sharpley, R. Rural tourism and the challenge of tourism diversification: The case of Cyprus. Tour. Manag. 2002, 23, 233–244. [Google Scholar] [CrossRef]
  3. Iorio, M.; Corsale, A. Rural tourism and livelihood strategies in Romania. J. Rural Stud. 2010, 26, 152–162. [Google Scholar] [CrossRef]
  4. Snyder, K.A.; Sulle, E.B. Tourism in Maasai communities: A chance to improve livelihoods? J. Sustain. Tour. 2011, 19, 935–951. [Google Scholar] [CrossRef]
  5. Wu, M.Y.; Pearce, P.L. Host tourism aspirations as a point of departure for the sustainable livelihoods approach. J. Sustain. Tour. 2014, 22, 440–460. [Google Scholar] [CrossRef]
  6. Nyaupane, G.P.; Poudel, S. Linkages among Biodiversity, Livelihood, and Tourism. Ann. Tour. Res. 2011, 38, 1344–1366. [Google Scholar] [CrossRef]
  7. Shen, F.; Hughey, K.F.; Simmons, D.G. Connecting the sustainable livelihoods approach and tourism: A review of the literature. J. Hosp. Tour. Manag. 2008, 15, 19–31. [Google Scholar] [CrossRef]
  8. Diniz, F.H.; Kok, K.; Hoogstra-Klein, M.A.; Arts, B. Mapping future changes in livelihood security and environmental sustainability based on perceptions of small farmers in the Brazilian Amazon. Ecol. Soc. 2015, 20, 26. [Google Scholar] [CrossRef]
  9. Ellis, F. Rural Livelihoods and Diversity in Developing Countries; Oxford University Press: New York, NY, USA, 2000. [Google Scholar]
  10. Chambers, R.; Conway, G. Sustainable Rural Livelihoods: Practical Concepts for the 21st Century; Institute of Development Studies: Brighton, UK, 1992. [Google Scholar]
  11. Carney, D. Sustainable Livelihoods Approaches: Progress and Possibilities for Change; Department for International Development: London, UK, 2003. [Google Scholar]
  12. Su, M.M.; Wall, G.; Wang, Y.A.; Jin, M. Livelihood sustainability in a rural tourism destination-Hetu Town, Anhui Province, China. Tour. Manag. 2019, 71, 272–281. [Google Scholar] [CrossRef]
  13. Conroy, C.; Litvinoff, M. The Greening of Aid: Sustainable Livelihoods in Practice; Routledge: London, UK, 2013. [Google Scholar]
  14. Ashley, C. The Impacts of Tourism on Rural Livelihoods: Namibia’s Experience; Overseas Development Institute: London, UK, 2000. [Google Scholar]
  15. Melita, A.W.; Mendlinger, S. The impact of tourism revenue on the local communities’ livelihood: A case study of Ngorongoro Conservation Area, Tanzania. J. Serv. Sci. Manag. 2013, 6, 117. [Google Scholar] [CrossRef]
  16. Nepal, S.K. Sustainable tourism, protected areas and livelihood needs of local communities in developing countries. Int. J. Sustain. Dev. World Ecol. 1997, 4, 123–134. [Google Scholar] [CrossRef]
  17. Anup, K.; Parajuli, R.B.T. Tourism and its impact on livelihood in Manaslu conservation area, Nepal. Environ. Dev. Sustain. 2014, 16, 1053–1063. [Google Scholar]
  18. León, Y.M. The impact of tourism on rural livelihoods in the Dominican Republic’s coastal areas. J. Dev. Stud. 2007, 43, 340–359. [Google Scholar] [CrossRef]
  19. Lee, M.H. Tourism and sustainable livelihoods: The case of Taiwan. Third World Q. 2008, 29, 961–978. [Google Scholar] [CrossRef]
  20. Mbaiwa, J.E.; Sakuze, L.K. Cultural tourism and livelihood diversification: The case of Gcwihaba Caves and XaiXai village in the Okavango Delta, Botswana. J. Tour. Cult. Chang. 2009, 7, 61–75. [Google Scholar] [CrossRef]
  21. Mbaiwa, J.E.; Stronza, A.L. The effects of tourism development on rural livelihoods in the Okavango Delta, Botswana. J. Sustain. Tour. 2010, 18, 635–656. [Google Scholar] [CrossRef]
  22. Lundtorp, S. Chapter 3-Measuring tourism seasonality. In Seasonality in Tourism; Baum, T., Lundtorp, S., Eds.; Routledge: New York, NY, USA, 2011; pp. 23–50. [Google Scholar]
  23. Banki, M.B.; Ismail, H.N.; Muhamad, I.B. Coping with seasonality: A case study of family owned micro tourism businesses in Obudu Mountain Resort in Nigeria. Tour. Manag. Perspect. 2016, 18, 141–152. [Google Scholar] [CrossRef]
  24. Butler, R. Chapter 2-Seasonality in tourism: Issues and implications. In Seasonality in Tourism; Baum, T., Lundtorp, S., Eds.; Routledge: New York, NY, USA, 2011; pp. 5–21. [Google Scholar]
  25. Commons, J.; Page, S. Chapter 10-Managing Seasonality in Peripheral Tourism Regions: The Case of Northland, New Zealand. In Seasonality in Tourism; Baum, T., Lundtorp, S., Eds.; Pergamon: Oxford, UK, 2001; pp. 153–172. [Google Scholar]
  26. Baum, T.; Hagen, L. Responses to seasonality: The experiences of peripheral destinations. Int. J. Tour. Res. 1999, 1, 299–312. [Google Scholar] [CrossRef]
  27. Goulding, P.J.; Baum, T.G.; Morrison, A.J. Seasonal Trading and Lifestyle Motivation. J. Q. Assur. Hosp. Tour. 2005, 5, 209–238. [Google Scholar] [CrossRef]
  28. Koenig–Lewis, N.; Bischoff, E.E. Developing Effective Strategies for Tackling Seasonality in the Tourism Industry. Tour. Hosp. Plan. Dev. 2010, 7, 395–413. [Google Scholar] [CrossRef]
  29. Duval, D.T. When buying into the business, we knew it was seasonal: Perceptions of seasonality in Central Otago, New Zealand. Int. J. Tour. Res. 2004, 6, 325–337. [Google Scholar] [CrossRef]
  30. Jang, S.S. Mitigating tourism seasonality: A quantitative approach. Ann. Tour. Res. 2004, 31, 819–836. [Google Scholar] [CrossRef]
  31. Getz, D.; Nilsson, P.A. Responses of family businesses to extreme seasonality in demand: The case of Bornholm, Denmark. Tour. Manag. 2004, 25, 17–30. [Google Scholar] [CrossRef]
  32. Goulding, P.; Gunn, G. A Supply Side Study of Tourism Seasonality: A case study of tourism businesses in the Scottish Borders. In Proceedings of the 9th Annual CHME Hospitality Research Conference, 26–27 April 2000; University of Huddersfield: Huddersfield, UK, 2000; pp. 361–369. [Google Scholar]
  33. Open Ceremony of “Beautiful South” Zhongliang Village Scenic Spot in Shibu. Available online: http://www.gxnews.com.cn/staticpages/20061003/newgx4521ded5-828791.shtml (accessed on 2 August 2019). (In Chinese).
  34. Zhongliang Village of Xixiangtang District in Nanning City: Building Beautiful Zhongliang with Civilized Rural Scenery. Available online: http://www.gxnews.com.cn/staticpages/20181012/newgx5bbff43a-17712283.shtml?pcview=1 (accessed on 1 August 2019). (In Chinese).
  35. Ma, J.H.; Zhang, J.; Li, L.; Zeng, Z.J.; Sun, J.R.; Zhou, Q.L.; Zhang, Y.L. Study on Livelihood Assets–Based Spatial Differentiation of the Income of Natural Tourism Communities. Sustainability 2018, 10, 353. [Google Scholar] [CrossRef]
  36. Li, G.; Fang, C.; Qiu, D.; Wang, L. Impact of farmer households’ livelihood assets on their options of economic compensation patterns for cultivated land protection. J. Geogr. Sci. 2014, 24, 331–348. [Google Scholar] [CrossRef]
  37. Nurul Islam, G.M.; Yew, T.S.; Viswanathan, K.K. Poverty and livelihood impacts of community based fisheries management in Bangladesh. Ocean. Coast Manag. 2014, 96, 123–129. [Google Scholar] [CrossRef]
  38. Fang, Y.P.; Fan, J.; Shen, M.Y.; Song, M.Q. Sensitivity of livelihood strategy to livelihood capital in mountain areas: Empirical analysis based on different settlements in the upper reaches of the Minjiang River, China. Ecol. Indic. 2014, 38, 225–235. [Google Scholar] [CrossRef]
  39. Tao, T.C.; Wall, G. Tourism as a sustainable livelihood strategy. Tour. Manag. 2009, 30, 90–98. [Google Scholar] [CrossRef]
  40. Zou, Z.H.; Yi, Y.; Sun, J.N. Entropy method for determination of weight of evaluating indicators in fuzzy synthetic evaluation for water quality assessment. J. Environ. Sci. 2006, 18, 1020–1023. [Google Scholar] [CrossRef]
  41. Shannon, C.E. A mathematical theory of communication. Bell Syst. Tech. J. 1948, 27, 379–423. [Google Scholar] [CrossRef]
  42. Kapur, J.N.; Kesavan, H.K. Entropy optimization principles and their applications. In Entropy and Energy Dissipation in Water Resources; Springer: Dordrecht, The Netherlands, 1992; pp. 3–20. [Google Scholar]
  43. Ma, J.; Fan, Z.P.; Huang, L.H. A subjective and objective integrated approach to determine attribute weights. Eur. J. Oper. Res. 1999, 112, 397–404. [Google Scholar] [CrossRef]
  44. Charnes, A.; Cooper, W.W.; Rhodes, E. Measuring the efficiency of decision making units. Eur. J. Oper. Res. 1978, 2, 429–444. [Google Scholar] [CrossRef]
  45. Banker, R.D.; Charnes, A.; Cooper, W.W. Some models for estimating technical and scale inefficiencies in data envelopment analysis. Manag. Sci. 1984, 30, 1078–1092. [Google Scholar] [CrossRef]
  46. Yin, J.; Tan, Q. Study on Urban Efficiency Measurement and Spatiotemporal Evolution of Cities in Northwest China Based on the DEA–Malmquist Model. Sustainability 2019, 11, 434. [Google Scholar] [CrossRef]
  47. Jia, C.; Zhang, L.; Yang, X.; Li, G. The impact of tourism development on changes of households’ livelihood and community tourism effect: A case study based on the perspective of tourism development mode. Geogr. Res. 2017, 36, 1709–1724. (In Chinese) [Google Scholar]
  48. Wang, J.; Zhang, Y.; Shi, L. Evaluation index system of sustainable livelihoods ecotourism strategy: A case study of wangjiazhai community in baiyangdian wetland nature reserve, Hebei. Acta Ecol. Sin. 2014, 34, 2388–2400. (In Chinese) [Google Scholar]
  49. Shi, Y.; Li, J. The Multifunctional Development of Rural Tourism and the Rural Sustainable Livelihood: A Collaborative Study. Tour. Trib. 2018, 33, 15–26. (In Chinese) [Google Scholar]
  50. Buultjens, J.; Gale, D.; White, N.E. Synergies between Australian indigenous tourism and ecotourism: Possibilities and problems for future development. J. Sustain. Tour. 2010, 18, 497–513. [Google Scholar] [CrossRef]
  51. Keung Wong, D.F.; Li, C.Y.; Song, H.X. Rural migrant workers in urban China: Living a marginalised life. Int. J. Soc. Wel. 2007, 16, 32–40. [Google Scholar] [CrossRef]
  52. He, A.; Yang, X.; Chen, J.; Wang, Z. Impact of Rural Tourism Development on Farmer’s Livelihoods: A Case Study of Rural Tourism Destinations in Northern Slop of Qinling Mountains. Econo. Geogr. 2014, 34, 174–181. (In Chinese) [Google Scholar]
  53. Chao, X.; Shen, K. Urban–Rural Income Disparity, Labor Quality and Economic Growth in China. Econ. Res. J. 2014, 49, 30–43. (In Chinese) [Google Scholar]
  54. Hinch, T.D.; Jackson, E.L. Leisure Constraints Research: Its Value as a Framework for Understanding Tourism Seasonability. Curr. Issues Tour. 2000, 3, 87–106. [Google Scholar] [CrossRef]
  55. Rodríguez Díaz, M.; Espino Rodríguez, T. Determining the sustainability factors and performance of a tourism destination from the stakeholders’ perspective. Sustainability 2016, 8, 951. [Google Scholar] [CrossRef]
  56. Su, M.M.; Wall, G.; Xu, K. Heritage tourism and livelihood sustainability of a resettled rural community: Mount Sanqingshan World Heritage Site, China. J. Sustain Tour. 2016, 24, 735–757. [Google Scholar] [CrossRef]
Figure 1. Geographical location of study area.
Sustainability 11 04833 g001
Figure 2. Part of The Beautiful South (a) and tourism household (b) (photographs by authors).
Sustainability 11 04833 g002
Figure 3. Household livelihood assets.
Sustainability 11 04833 g003
Figure 4. (a) Comparison of livelihood capital efficiency mean values of different household types. (b) Comparison of livelihood capital efficiency mean values of engaged and non-engaged households in tourism during peak season.
Sustainability 11 04833 g004
Table 1. Livelihood capital index (LCI) evaluation system and source of values.
Livelihood CapitalMeasurement IndicatorsValuesWeight Values
Natural capitalAgricultural acreageTotal agricultural acreage in survey year0.176
Cultivated land qualityHigh quality = 1, Good = 0.67, General = 0.33, None = 00.150
Physical capitalHousing qualityConcrete house = 1, Brick and tile house = 0.75, Wooden house = 0.50, Soil building = 0.250.029
Living spaceTotal living space in survey year0.066
Means of productionBuilding = 1, Freight motor vehicles = 0.75, Agricultural machinery = 0.50, Motorcycle/electric vehicle = 0.250.029
Life suppliesCar = 1, Computer = 0.75, Daily household appliances = 0.5, Others = 0.250.028
Human capitalAge of household members19–60 years old = 1, 13–18 years old = 0.5, Under 12 & over 60 = 00.011
Education of household membersUniversity and above = 1, High school or technical secondary school = 0.8, Junior high school = 0.6, Primary school = 0.4, Uneducated = 0.20.021
Health status of household membersGood = 1, Can take care of themselves = 0.5, Cannot care for themselves = 00.013
Social capitalSocial networking statusHave social relations = 1, No social relation = 00.153
Participation in community activitiesOften = 1, Sometimes = 0.5, Rarely = 00.087
Access to supportSupport from relatives = 1, Support from neighbors and friends = 0.5, None = 00.032
Access to trainingYes = 1, No = 00.111
Financial capitalAnnual household incomeTotal household income in survey year0.033
Access to loansEasy = 1.0, Normal = 0.5, Hard = 00.060
Table 2. Household types and livelihood indicator index.
Capital TypeEvaluation IndicatorType AType BType CType D
Natural capitalAgricultural acreage0.5230.3280.3610.2920.3330.2370.1150.072
Cultivated land quality0.7530.4420.4450.167
Physical capitalHousing quality0.230.4170.3540.4750.4080.5560.3950.507
Living space0.0370.2700.3420.329
Means of production0.2080.2380.2780.253
Life supplies0.5000.5370.5420.576
Human capitalAge of household members0.3240.5330.420.4290.5320.5070.5260.524
Education of household members0.2630.4140.5440.523
Health status of household members0.2500.4220.5330.531
Social capitalSocial networking status0.4020.2500.380.2940.6780.9170.5180.458
Participation in community activities0.2500.3680.4170.479
Access to support0.3330.6270.5830.611
Access to training 0.7500.4410.5830.604
Financial capitalAnnual household income0.3950.2080.4470.4970.4080.4670.4490.488
Access to loans0.5000.4190.3750.427
Livelihood capital index 1874196223592003
Household proportion in survey3.0%51.5%9.1%36.4%
Table 3. Livelihood capital of households engaged and not engaged in tourism during peak season.
Livelihood CapitalLivelihood Capital IndexHouseholds not Engaged in TourismHouseholds Engaged in Tourism
Natural capitalAgricultural acreage0.3760.3090.1940.129
Cultivated land quality0.4550.271
Physical capitalHousing quality0.3560.5110.3810.477
Living space0.2630.313
Means of production0.2560.239
Life supplies0.5110.581
Human capitalAge0.4390.4480.4870.494
Education0.4340.482
Health0.4400.488
Social capitalSocial networking0.4170.4140.4900.405
Participation in community activities0.3450.459
Access to support0.5860.626
Access to training 0.4310.595
Financial capitalAnnual household income0.3870.4780.4860.485
Access to loans0.3360.486
Livelihood capital index1975 2038
Table 4. Livelihood strategy adjustment of 74 tourism-engaged households.
SeasonalityOff-Season/Household Peak-Season/Household
Livelihood strategies Type AType BType CType DSumType AType BType CType DSum
Agriculture22091322026
Laboring work120122441190424
Microbusiness0048120041014
Tourism081253422044874

