Article

Antecedents and Consequences of Brand Experiences in a Historical and Cultural Theme Park

1
College of Tourism and Fashion, Pai Chai University, Daejeon 35345, Korea
2
Department of Tourism, Hospitality and Event Management, University of Florida, Gainesville, FL 32611, USA
3
Tourism Research Institute, Kyonggi University, Suwon, Kyeonggi-do 16227, Korea
*
Author to whom correspondence should be addressed.
Sustainability 2019, 11(17), 4810; https://doi.org/10.3390/su11174810
Submission received: 16 August 2019 / Revised: 30 August 2019 / Accepted: 31 August 2019 / Published: 3 September 2019
(This article belongs to the Special Issue Sustainable Hospitality and Tourism Marketing)

Abstract

:
Sustainability has been a major research topic in the tourism and hospitality industry, and theme parks are no exception, particularly in terms of their economic sustainability. Yet few studies have specifically explored sustainability approaches for theme parks. This work examines structural relationships among theme park attributes and visitors’ brand experiences, perceived value, satisfaction, and behavioral intentions at a theme park. Data from 321 respondents, collected at a famous historical and cultural theme park in China, were incorporated into statistical analyses (e.g., structural equation modeling) in R software. Compared to peripheral attributes, core attributes comprised an antecedent that was closely and significantly related to brand experiences. Of the brand experiences construct consisting of sensory, affective, intellectual, and behavioral experiences, sensory and behavioral experiences significantly influenced the functional value of the perceived value and sensory and intellectual experiences significantly influenced the emotional value of the perceived value. The functional and emotional values each significantly affected satisfaction, which in turn significantly influenced behavioral intention. This study is the first to apply the brand experience concept in a theme park context. Theoretical and practical implications for achieving sustainable theme park growth and development are also provided.

1. Introduction

Theme parks represent a preferred mode of entertainment, generally intended for family visitors [1]. Theme parks comprise one of the most popular entertainment options in the world [2,3,4]. According to the Themed Entertainment Association and AECOM [5], approximately 244 million people worldwide visited the top 25 theme parks by the end of 2017 and 134 million visited the top 20 amusement/theme parks in the Asia-Pacific region.
The growth and development of China’s theme park industry is similar to other parts of the world thanks to a growing middle class, improved living standards, and convenient transportation. For example, the China Theme Park Pipeline Report [6] noted that the total attendance at domestic theme parks reached nearly 190 million in 2017 and is projected to balloon to 230 million by 2020. Annual theme park attendance increased by 13% on average between 2008 and 2017; hence, China is expected to be the world’s largest theme park market around 2020. To better cope with the shifting market environment of theme parks and help to ensure sustainable industry success, theme park visitors must be profiled in detail.
Milman [4] investigated perspectives on North American theme parks and attraction managers’ opinions on the future of the theme park and attraction industry, discovering that “consumers would most likely seek interactive adventure, fantasy, and mystery, movies and television shows, and science fiction/futuristic themes” (p. 146). Regarding China’s theme park industry, Zhang and Shan [7] reviewed Chinese journal articles published throughout the past 25 years and recommended including tangible and intangible cultural heritage in theme park development. They claimed that theme parks should focus on physical expressions of intangible culture rather than merely serving as entertainment spaces. As such, understanding theme park visitors’ behavior is crucial for sustainable industry development and enhanced theme park visitor experiences.
However, China’s theme park industry faces many challenges. For example, competition is rising in the domestic theme park market along with the entrance of international theme park development companies, such as Disneyland [8]. Accordingly, providing high-quality recreational and tourism facilities and services as well as understanding theme park visitors’ behavior are essential to vitalizing the theme park industry [3,9]. Pertinent issues related to theme park development include identifying attractive theme park attributes, memorable experiences, and visitors’ perceived values.
The attractiveness and vividness of theme parks are pivotal to tourist decisions of which parks to visit [7,10]. As Milman [4] noted, the theme park industry should be distinct from traditional amusement parks, and targeted marketing may attract more (and more diverse) visitors. Brakus, Schmitt, and Zarantonello’s [11] concept of the “brand experience” may provide interesting theoretical and practical implications for the theme park industry; however, the concept has not been sufficiently applied in theme park research. Brakus et al. [11] also suggested investigating the antecedents and consequences of the brand experience. Although Bae et al. [2] examined the roles of theme parks in enhancing cities’ brand images, few scholars have explored visitors’ brand experiences in theme parks, especially in terms of historical and cultural themes. Drawing upon the brand experience concept, this study investigates structural relationships between theme-park-related antecedents (i.e., attributes), visitors’ brand experiences, and consequences (i.e., visitors’ perceived values, satisfaction, and behavioral intentions). Findings focus on the roles of antecedents and consequences of the brand experience in terms of promoting sustainable brand experiences for theme park visitors. Such information could ultimately contribute to the sustainable growth and development of these parks.
The remainder of this paper is organized as follows. The theoretical backgrounds of the constructs of antecedents and consequences of brand experiences, as well as previous brand experience literature, are reviewed in Section 2. Several hypotheses are then developed based on the literature. Our data collection and analysis methods are explained in Section 3. The results of our analyses are provided in Section 4. Given our findings, the implications of this study are discussed in terms of sustainability and brand experiences in Section 5. Concluding remarks, limitations, and suggestions for future research are offered in Section 6.

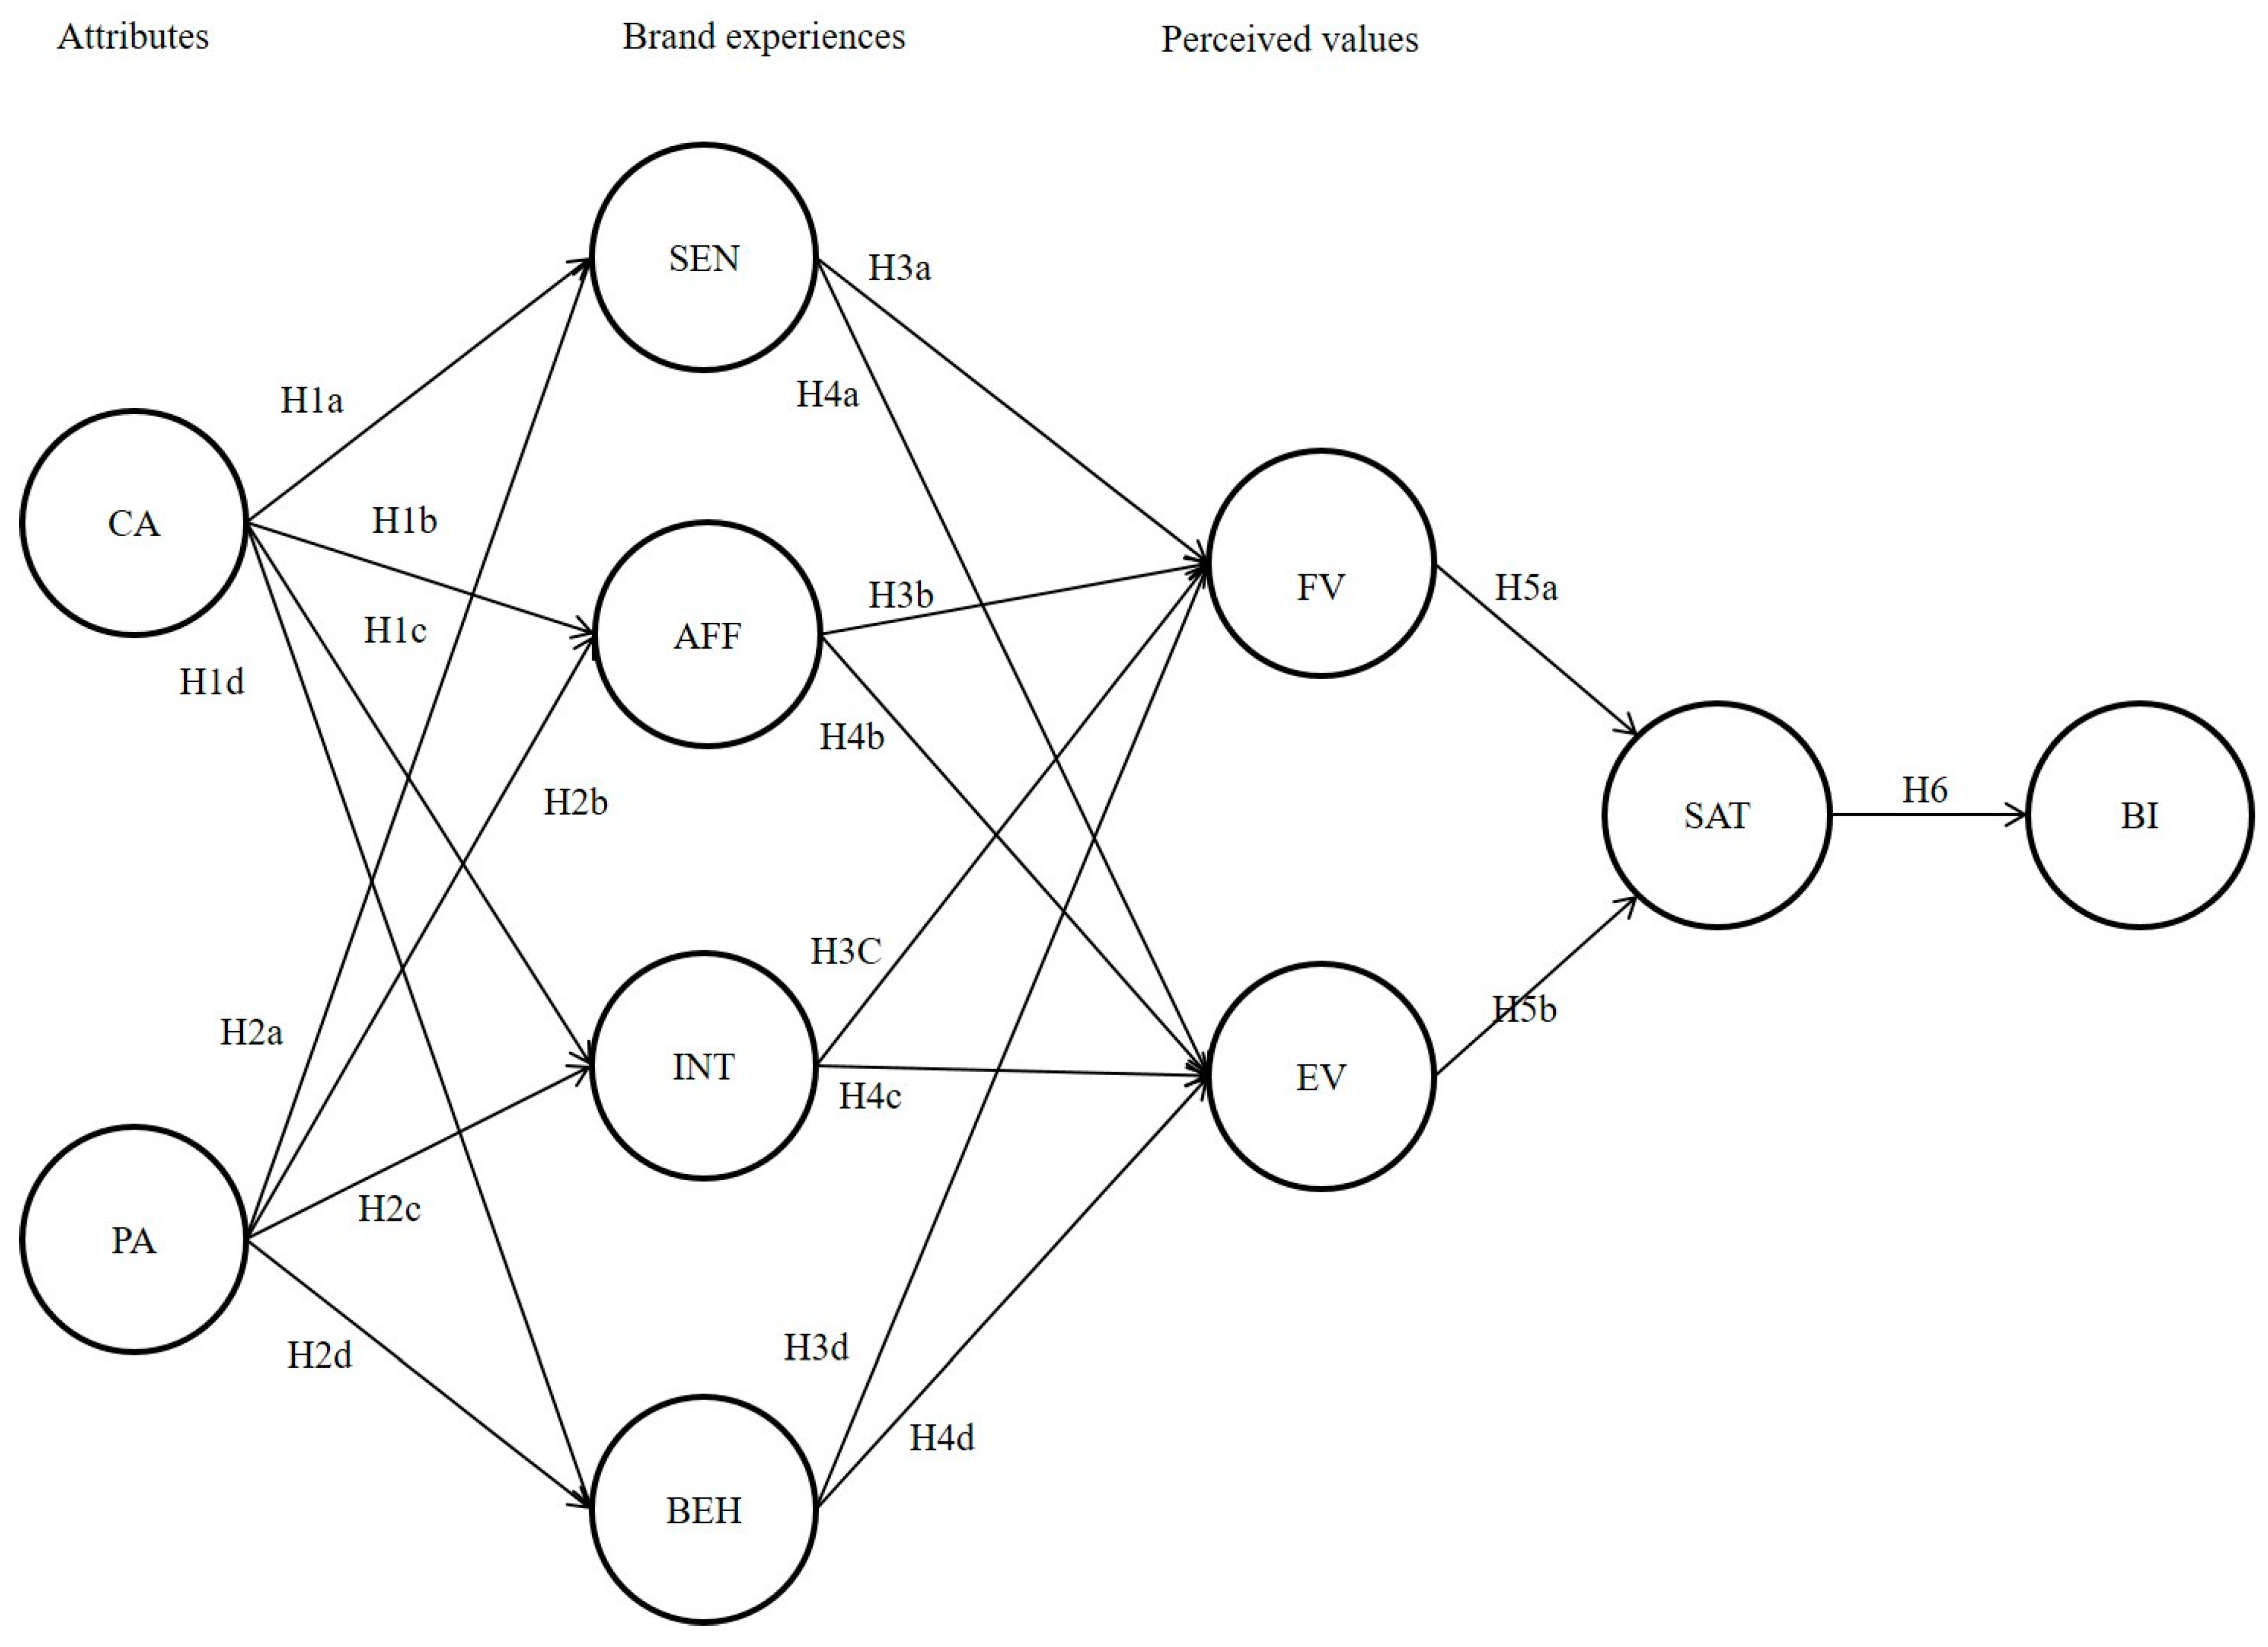
2. Literature Review and Hypothesis Development

2.1. Theme Park Attributes

A multi-attribute approach has been widely used as the basic means of measuring theme park attributes. For instance, Moutinho [12] identified seven highly important attributes (i.e., “fun rides,” “short waiting times,” “good climate/environment,” “proximity,” “overall price,” “family atmosphere”, and “hours of operation”) that tourists consider when deciding on a theme park. McClung [10] found that climate and lodging played similarly crucial roles in theme park selection. Milman [4] identified seven primary attributes consumers considered when evaluating theme parks; most were related to guests’ experiences. Geissler and Rucks [13] discovered that admission price/value, general enjoyment, and customers’ experience-related expectations were the most important attributes for theme park visitors. Despite somewhat inconsistent findings, landscape environment, quality of service, service facilities, and prices have appeared across many studies, highlighting these attributes as essential to theme parks. Wanhill [14] pointed out that the core of the theme park product is the imagescape, wherein commodities and services merge to generate memorable visitor experiences. Therefore, this study posits that theme park attributes may consist of core attributes (e.g., entertainment, facility, and theme displays) and peripheral attributes (e.g., consumption price, landscape environment, and service quality).

2.2. Brand Experience

Brand has been identified as a deciding factor when visitors choose which theme parks to visit [3]. Thus, brand management represents a fundamental research area relevant to sustainable theme park development and growth. Numerous scholars have evaluated brand experience in general; even so, few theme park studies have emerged relevant to brand experience [11], which includes consumers’ sensory experience, affective experience, intellectual experience, and behavioral experience.
Specifically, the sensory dimension refers to sensory stimulation evoked by a brand (i.e., based on sight, sound, touch, taste, and smell). The affective dimension captures feelings elicited by a brand and the emotional bond developed with customers. The intellectual dimension encompasses a brand’s ability to promote consumers’ similar and dissimilar thinking. The behavioral dimension consists of consumers’ physical experiences, lifestyles, and brand-based interactions. Although Brakus and colleagues verified the convenience and effectiveness of these four dimensions, the brand experience concept has rarely been applied in tourism and hospitality studies. Exceptionally, Choi et al. [15] studied coffee brand experiences and noted the importance of the cafe experience in fostering a pleasant consumer experience.
Nevertheless, little is known about the role of brand experience in theme parks. Because Brakus et al. [11] suggested investigating antecedents of the brand experience concept, this study assumes that core and peripheral attributes serve as antecedents of brand experience. The following hypotheses are thus proposed:
Hypothesis 1 (H1):
Attributes positively influence consumers’ brand experiences at a theme park.
Hypothesis 1 (H1a):
Core attributes positively influence consumers’ brand experiences at a theme park.
Hypothesis 1a1 (H1a1):
Core attributes positively influence consumers’ sensory experiences at a theme park.
Hypothesis 1a2 (H1a2):
Core attributes positively influence consumers’ affective experiences at a theme park.
Hypothesis 1a3 (H1a3):
Core attributes positively influence consumers’ intellectual experiences at a theme park.
Hypothesis 1a4 (H1a4):
Core attributes positively influence consumers’ behavioral experiences at a theme park.
Hypothesis 1b (H1b):
Peripheral attributes positively influence consumers’ brand experiences at a theme park.
Hypothesis 1b1 (H1b1):
Peripheral attributes positively influence consumers’ sensory experiences at a theme park.
Hypothesis 1b2 (H1b2):
Peripheral attributes positively influence consumers’ affective experiences at a theme park.
Hypothesis 1b3 (H1b3):
Peripheral attributes positively influence consumers’ intellectual experiences at a theme park.
Hypothesis 1b4 (H1b4):
Peripheral attributes positively influence consumers’ behavioral experiences at a theme park.

2.3. Perceived Value

Numerous tourism and hospitality researchers have studied perceived value. According to Zeithaml [16], the concept is defined as “the consumer’s overall assessment of the utility of a product based on perceptions of what is received and what is given” (p. 14). Several studies [17,18] have suggested that perceived value may not be measured via a utilitarian perspective (e.g., price and quality), because the decision-making process in contemporary society has become increasingly complicated.
Moreover, perceived value has often been assessed with a single-item measure (e.g., of overall value), yet some scholars [19,20,21] have applied multi-item measures, such as those including emotional and functional value. Although Cheng et al. [3] examined the relationship between attractions’ facility quality, park activity quality, staff service quality, historical and cultural quality, and perceived value, only the quality of park activities and historical and cultural quality were found to significantly influence perceived value. Few studies have examined the relationship between brand experiences and perceived value, hence the second set of hypotheses:
Hypothesis 2 (H2):
Brand experiences positively influence consumers’ perceived values at a theme park.
Hypothesis 2a (H2a):
Brand experiences positively influence consumers’ functional value at a theme park.
Hypothesis 2a1 (H2a1):
Sensory experiences positively influence consumers’ functional value at a theme park.
Hypothesis 2a2 (H2a2):
Affective experiences positively influence consumers’ functional value at a theme park.
Hypothesis 2a3 (H2a3):
Intellectual experiences positively influence consumers’ functional value at a theme park.
Hypothesis 2a4 (H2a4):
Behavioral experiences positively influence consumers’ functional value at a theme park.
Hypothesis 2b (H2b):
Brand experiences positively influence consumers’ emotional value at a theme park.
Hypothesis 2b1 (H2b1):
Sensory experiences positively influence consumers’ emotional value at a theme park.
Hypothesis 2b2 (H2b2):
Affective experiences positively influence consumers’ emotional value at a theme park.
Hypothesis 2b3 (H2b3):
Intellectual experiences positively influence consumers’ emotional value at a theme park.
Hypothesis 2b4 (H2b4):
Behavioral experiences positively influence consumers’ emotional value at a theme park.

2.4. Satisfaction

Tourism scholars have conducted an array of satisfaction-related research throughout the past three decades [22,23]. According to Oliver [24], satisfaction is defined as “a function of cognitive and affective responses in which attribute experience can operate through affect to influence satisfaction indirectly” (p. 81). Cognitive responses convey consumers’ objective evaluations regarding product/service attributes. Comparatively, affective responses denote consumers’ subjective psychological feelings/emotions in the consumption process.
Tourist satisfaction is frequently considered an important feature of tourists’ experiences during on-site participation in tourism activities [25,26]. Tourists’ satisfaction is also pivotal to successful destination marketing, as satisfaction influences tourists’ decision-making processes, including destination selection [3,27,28,29,30].
Customer satisfaction and loyalty are important consequences of perceived value [20,21,31,32,33]. McDougall and Lovesque [34] found that perceived value directly influences customer satisfaction. Similarly, Lee et al. [19] indicated that functional and emotional value each had positive effects on visitor satisfaction. Han, Meng, and Kim [32] noted that perceived value affected bicycle travelers’ satisfaction. In a theme park context, Cheng et al. [3] and Wu et al. [21] both identified a positive relationship between perceived value and satisfaction. The present study measures perceived value through functional and emotional value to further investigate the influences of perceived values on visitors’ satisfaction with theme parks. Accordingly, the third set of hypotheses is proposed:
Hypothesis 3 (H3):
Perceived values positively influence consumers’ satisfaction at a theme park.
Hypothesis 3a (H3a):
Functional value positively influences consumers’ satisfaction at a theme park.
Hypothesis 3b (H3b):
Emotional value positively influences consumers’ satisfaction at a theme park.

2.5. Behavioral Intention

Behavioral intention refers to an individual’s desire and efforts to participate in, consume, and use (or not) specific products or services in future [29]. Several tourism researchers have reported that satisfaction is a reliable predictor of behavioral intention. For example, Baker and Crompton [35] revealed a positive relationship between satisfaction and behavioral intention, including participants’ willingness to spend money at an annual festival and their loyalty. Cole and Chancellor [36] found that the quality of programs, entertainment, and amenities shaped visitors’ overall festival experiences, which then influenced visitors’ satisfaction and intentions to revisit the festival. Chi et al. [37] discovered that respondents’ satisfaction with food experiences led to overall satisfaction, which in turn affected their behavioral intentions, such as revisit intentions. Relatedly, Mason and Nassivera [38], Jung, Kim, and Yap [39], and Sohn, Lee, and Yoon [40] all suggested that visitors’ satisfaction with a festival significantly influenced behavioral intention (e.g., intention to revisit the festival). Han and Hyun [29] verified that luxury hotel restaurant customers’ satisfaction affected their behavioral intentions, both to re-patronize the same restaurant along with other restaurants under the same hotel. Kim and Shim [41] and Song, Wang, and Han [42] further confirmed the significant effect of customer satisfaction on behavioral intention in coffee shops. Jin, Lee, and Lee [43] uncovered a relationship between water park patrons’ satisfaction and behavioral intentions. Recently, Wu et al. [21] and Milman and Tasci [44] confirmed that the higher a visitor’s satisfaction, the greater his/her revisit intention or loyalty to a given theme park.
Although various studies have highlighted a positive relationship between satisfaction and behavioral intention [21,43,44], different research environments may elicit distinct results. For example, the setting of the current study is unique in that our chosen theme park is steeped in historical and cultural aspects of a Chinese dynasty; therefore, the following hypothesis is proposed:
Hypothesis 4 (H4):
Satisfaction positively influences consumers’ behavioral intentions at a theme park.
The proposed theoretical model, established based on the aforementioned hypotheses (H1–H4), is displayed in Figure 1.

3. Method

3.1. Measurement

In light of the preceding literature review, all variables in the proposed model were measured with multiple items scored on a 5-point Likert-type scale (1 = strongly disagree, 5 = strongly agree) to ensure measurement validity. Items intended to assess core and peripheral theme park attributes were adapted from Milman [4], Wanhill [14], and Lee et al. [19]. Based on suggestions in prior studies [11,15,33], the four dimensions of brand experience were included.
Perceived value was measured using two dimensions (i.e., functional and emotional value) per recommendations from earlier studies [3,20,45].
Satisfaction items were adapted from previous studies [19,20,31]. Behavioral intention items were similarly prepared based on behavioral intention research [39,40,46].

3.2. Data Collection

The survey was conducted in a famous historical and cultural theme park in Hangzhou, China—Songcheng Theme Park—from 2 February 2017 to 16 February 2017, including weekdays and weekends. Hangzhou is a city with more than 4700 years of history. As a representative theme park of China, Songcheng Theme Park opened in May 1996. It is the first theme park to reflect the cultural connotation of the North and South Song Dynasty in Hangzhou.
Convenience sampling was used for data collection; self-administered questionnaires were randomly distributed at randomly selected times and collected at the theme park exit by a survey team consisting of four research assistants. Thus, the survey team tried their best to obtain a representative sample. Data were gathered at the conclusion of respondents’ visits, which could have compromised the quality and validity of responses because respondents may have been fatigued from traveling and experiencing diverse activities in the park. Exit surveys were nonetheless deemed reasonable for this study; surveying respondents immediately following their visit could help ensure that respondents would accurately recall their experiences at Songcheng Theme Park. More importantly, one of the main research questions was intended to explore visitors’ brand experiences at the theme park. Although respondents may have been tired, the exit survey was likely the most effective strategy for collecting data on brand experiences in a theme park. A total of 410 questionnaires were distributed to visitors who agreed to participate. No incentives were provided to increase the participation rate. Of the original sample, 364 questionnaires were returned (response rate: 88.8%). However, 43 questionnaires were also excluded due to partial and inconsistent responses identified during the data refinement process. In the end, 321 questionnaires were deemed suitable for data analyses.
Power analysis was conducted to provide statistical justification for an adequate sample size via https://timo.gnambs.at/research/power-for-sem. The sample size of this study was considered sufficient based on a calculation of the required sample size to evaluate the fit of a structural equation model [47,48,49,50].

3.3. Analysis

R 3.3.5 was used to analyze data, beginning with descriptive analysis to summarize respondent characteristics. Per Anderson and Gerbing’s [51] recommendation, we then applied a two-step approach: First, confirmatory factor analysis (CFA) was performed to estimate the measurement model for all variables to ensure internal consistency along with construct validity and reliability; then, a structural equation modeling technique was used to test the proposed conceptual model and hypotheses.

4. Results

4.1. Respondent Characteristics

Characteristics of the respondents are summarized in Table 1. Of 321 respondents, 53.9% were women and 46.1% were men. Most were between 20 and 29 (28.7%) or 30 and 39 (26.5%) years old. In terms of occupations, 31.2% of respondents were students, 20.2% were office workers, and 13.1% were service and sales personnel. Slightly less than half (48.6%) reported having completed a 4-year university degree, followed by college (30.2%). Regarding monthly income, 34.0% earned 3000 yuan or less, 26.2% earned 3000–4999 yuan (USD $460–$770), and 22.1% earned 5000–6999 yuan (USD $770–$1077). Most respondents (61.7%) were married.

4.2. Measurement Model Analysis

Prior to analyzing the data, a Mahalanobis distance test was conducted to identify outliers. Results revealed no extreme outliers that would impede multivariate analysis. The measurement model was first generated to assess the quality of measures using CFA, and then the hypothesized structural models were tested via R. The CFA results indicated that a satisfactory model fit to the data (χ2 [360] = 852.705, p < 0.05; CFI = 0.929, TLI = 0.915, RMSEA = 0.065). The TLI and CFI values were equal to or greater than 0.9, and the RMSEA value was below 0.08, confirming a good model fit [51,52,53]. Thus, the proposed measurement model fit the data well.
Standardized factor loadings of observed variables ranged from 0.643 to 0.963, which were close to or exceeded the ideal criterion of 0.7 (see Table 2); therefore, the proposed constructs were significant. Each construct demonstrated sufficient reliability based on Cronbach’s alpha values, ranging from 0.78 to 0.908 (see Table 3); all larger than the suggested minimum criterion of 0.7 [54]. Average variance extracted (AVE) values were above the recommended value of 0.5 [55] (see Table 3), and respective composite reliability values for multi-item scales exceeded the minimum criterion of 0.7 [53]. As shown in Table 3, AVE values can be used to check the discriminant validity of constructs in the measurement model [56]; the AVE of each construct should be larger than the squared correlation to ensure satisfactory discriminant validity.
The confidence interval method is another approach used to test discriminant validity between two constructs through calculating a confidence interval (plus or minus two standard errors around the correlation between constructs) as well as determining whether this interval includes 1.0. If it does not contain 1.0, then discriminant validity can be confirmed [51]. The confidence interval of the squared correlation between satisfaction (SAT) and behavioral intention (BI) was the highest among constructs tested in this study and did not include 1.0; therefore, the measures exhibited convergent and discriminant validity.

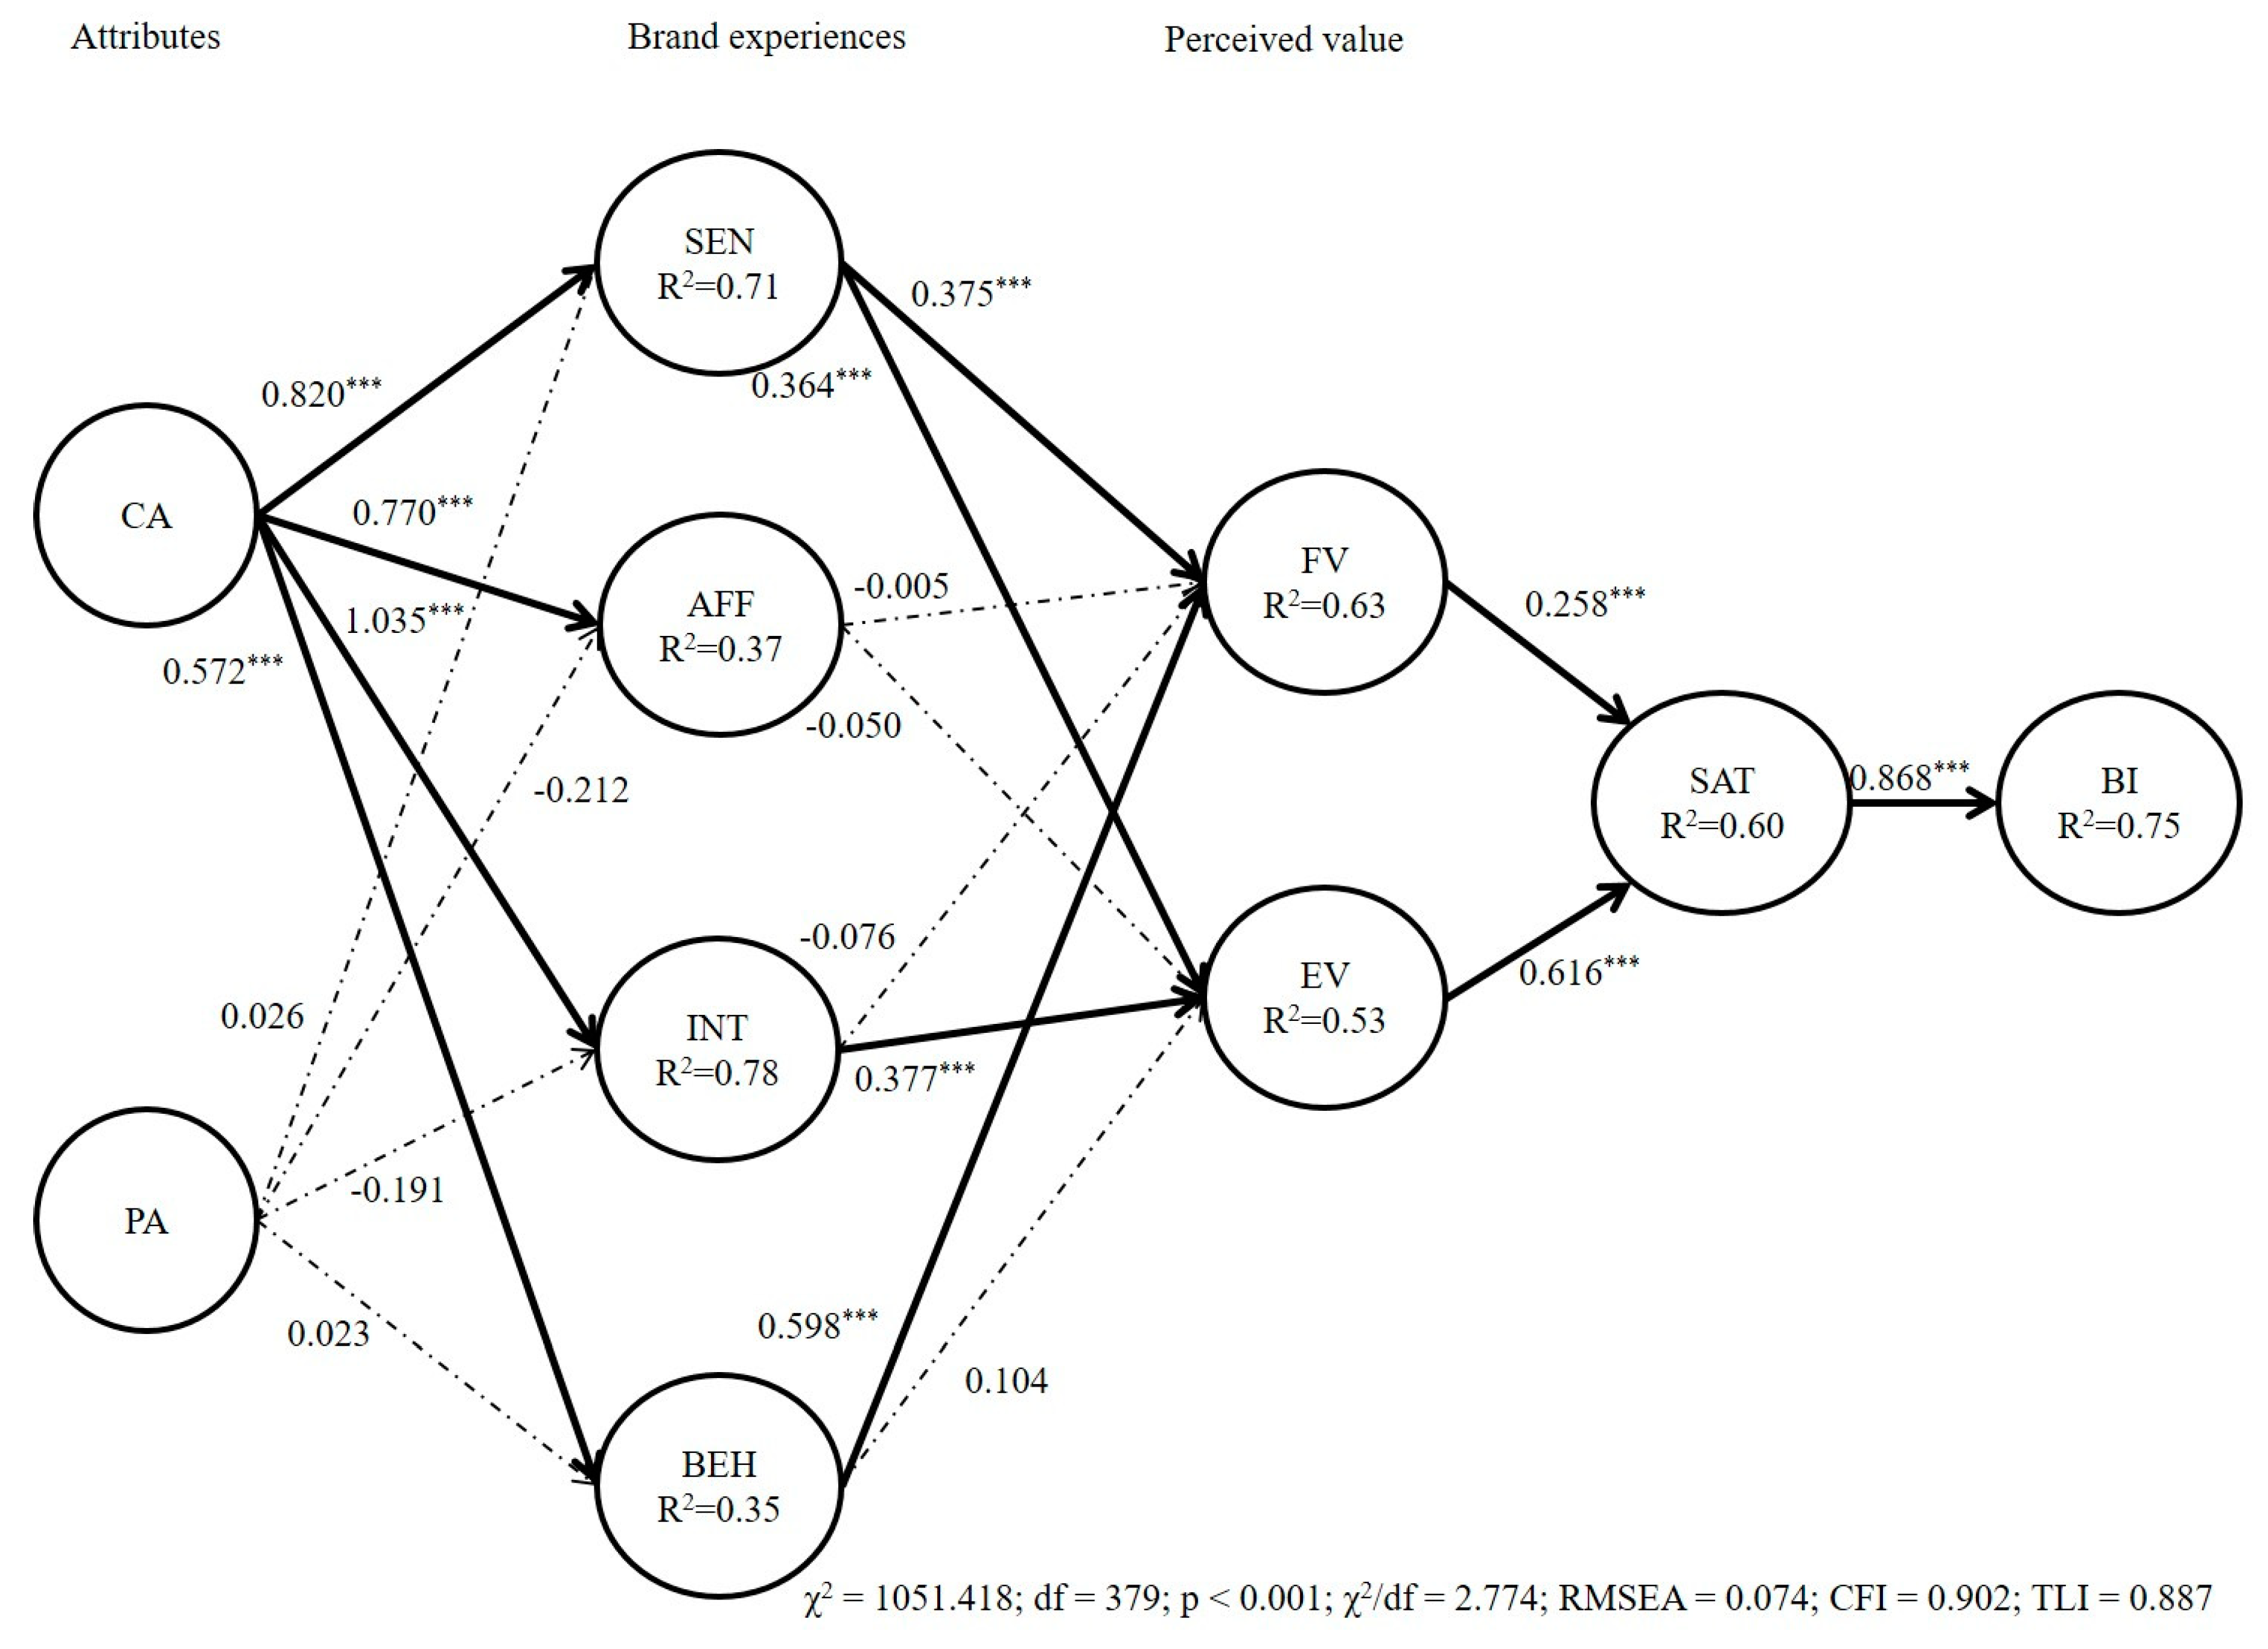
4.3. Structural Model Analysis and Hypothesis Tests

After identifying a well-fitted measurement model, relationships between all latent variables in the structural model (Figure 1) were tested. Results indicated an excellent fit to the data (χ2 = 1051.418, df = 379, p < 0.001, χ2/df = 2.774; RMSEA = 0.074, CFI = 0.902, TLI = 0.887; see Figure 2). A robust maximum likelihood estimation approach was used to generate this model. Figure 2 presents the results of hypothesis tests using the model.
Core attributes were found to positively influence the sensory experiences (βCA→SEN = 0.820, p < 0.001), affective experiences (βCA→AFF = 0.770, p < 0.001), intellectual experiences (βCA→INT = 1.035, p < 0.001), and behavioral experiences (βCA→BEH = 0.572, p < 0.001) of visitors to Songcheng Theme Park, supporting H1a1, H1a2, H1a3, and H1a4. As such, H1a (i.e., “Core attributes positively influence consumers’ brand experiences at a theme park”) was supported. However, because Songcheng Theme Park’s peripheral attributes did not significantly influence visitors’ experiences, H1b (i.e., “Peripheral attributes positively influence consumers’ brand experiences at a theme park”) was not supported. Therefore, H1 (i.e., “Attributes positively influence consumers’ brand experiences at a theme park”) was partially supported; of the two attributes, only core attributes positively influenced visitors’ brand experiences (H1a).
Sensory experiences (βSEN→FV = 0.375, p < 0.001) and behavioral experiences (βBEH→FV = 0.598, p < 0.001) both significantly influenced functional value; accordingly, H2a1 (i.e., “Sensory experiences positively influence consumers’ functional value at a theme park”) and H2a4 (i.e., “Behavioral experiences positively influence consumers’ functional value at a theme park”) were each supported. However, because neither affective experiences (βAFF→FV = −0.005, p > 0.05) nor intellectual experiences (βINT→FV = −0.076, p > 0.05) significantly influenced functional value, H2a2 (i.e., “Affective experiences positively influence consumers’ functional value at a theme park”) and H2a3 (i.e., “Intellectual experiences positively influence consumers’ functional value at a theme park”) were not supported. Therefore, H2a (i.e., “Brand experiences positively influence consumers’ functional value at a theme park”) was partially supported.
Sensory experiences positively influenced emotional value (βSENEV = 0.364, p < 0.001), as did intellectual experiences (βINTEV = 0.377, p < 0.001); therefore, H2b1 (i.e., “Sensory experiences positively influence consumers’ emotional value at a theme park”) and H2b3 (i.e., “Intellectual experiences positively influence consumers’ emotional value at a theme park”) were supported. Affective experiences (βAFFEV = −0.050, p > 0.05) and behavioral experiences (βBEHEV = 0.104, p > 0.05) exerted no significant influences on emotional value, respectively; thus, H2b2 (i.e., “Affective experiences positively influence consumers’ emotional value at a theme park”) and H2b4 (i.e., “Behavioral experiences positively influence consumers’ emotional value at a theme park”) were not supported. As a result, H2b (i.e., “Brand experiences positively influence consumers’ emotional value at a theme park”) was partially supported, as was H2 (i.e., “Brand experiences positively influence consumers’ perceived values at a theme park”).
Functional value (βFV→SAT = 0.258, p < 0.001) and emotional value (βEV→SAT = 0.616, p < 0.001) each exerted significant influences on visitors’ satisfaction, lending support to H3a (i.e., “Functional value positively influences consumers’ satisfaction at a theme park”) and H3b (i.e., “Emotional value positively influences consumers’ satisfaction at a theme park”). Therefore, H3 (i.e., “Perceived values positively influence consumers’ satisfaction at a theme park”) was supported.
Lastly, as visitors’ satisfaction with Songcheng Theme Park positively influenced their behavioral intentions (βSATBI = 0.868, p < 0.001), H4 (i.e., “Satisfaction positively influences consumers’ behavioral intentions at a theme park”) was supported.

5. Discussion

Unique historical and cultural experiences are essential to the sustainable growth and development of historical and cultural theme parks. As Milman (2001) asserted, because theme park visitors tend to seek interactive adventure, fantasy, mystery, and scientific fiction or futuristic themes, theme parks should provide creative and innovative experiences, as well as quality and safe entertainment. Furthermore, visitors who visit historical and cultural theme parks likely expect more than the traditional amusement park experience, as these theme parks often focus on historical and cultural aspects. This study responds to Milman’s [1] call for further research.
Our findings reveal that theme park attributes can influence visitors’ brand experiences. Thus, such attributes could be antecedents of brand experiences. Specifically, among the chosen theme park attributes, core attributes were found to significantly and positively influence the four dimensions of brand experience (i.e., sensory, affective, intellectual, and behavioral experiences), but exerted the strongest influence on the sensory dimension. This result suggests a central role of sensory experiences (among all brand experience dimensions) in constructing better brand experiences for theme park visitors. Songcheng Theme Park is renowned for its large-scale indoor real-life performance with historical and cultural themes, which constitutes the park’s core experience program. Additionally, many folk performances are held in the indoor area of the park before and after thematic shows to attract visitors. These experiences may serve to increase the theme park’s perceived value, which could enhance visitors’ satisfaction and behavioral intentions. As such, this study demonstrates that theme park attributes can be antecedents of the brand experience concept; perceived value, satisfaction, and behavioral intention are likely consequences. Therefore, understanding theme park visitors’ behavior mechanisms through brand experiences [11] can promote sustainable theme park development by continually attracting visitors and providing high-quality theme park experiences.
These implications could be especially meaningful for realizing sustainable development of the theme park industry under growing competition among parks, both within China and throughout the world. Changes in surrounding theme park environments also warrant consideration. Dramatic advances in transportation technologies, rising disposable income, and extended leisure time may enable people to travel relatively easily to other regions/countries if they cannot obtain desired theme park experiences in their places of origin. The sustainability of theme parks is related to other industries as well; therefore, revelations from this study could offer strategies to cope with rapidly evolving competitive environments by providing sustainable theme park experiences.
For example, economic aspects of sustainability in theme parks could be interpreted through a continuous increase in the number of visitors. In this case, although supplying new theme park facilities could be an option for ongoing theme park development, this approach would likely be burdensome in certain parks due to the large monetary expenditure. A cost-effective and visitor-centered approach for theme parks could include applying the brand experiences concept. Specifically, while theme parks may develop authentic experiential marketing strategies for visitors, the approach should address sensory, intellectual, and behavioral experiences rather than general experiences. Furthermore, these experiences can greatly influence the emotional and functional aspects of visitors’ perceived value, hence improving visitors’ satisfaction and behavioral intentions. As such, this study clearly demonstrates the fundamental importance of an in-depth understanding of brand experiences in theme parks to realize long-term prosperity (i.e., economic aspects of sustainability).
This study highlights perceived value, satisfaction, and behavioral intention as potential consequences of the brand experience concept. Specifically, our findings unveiled differences in the influences of brand experiences on perceived value: Sensory and behavioral experiences were shown to be significant predictors of functional value, whereas sensory and intellectual experiences had significant impacts on emotional value. Thus, sensory experiences represent a particularly important determinant in increasing visitors’ perceived values in theme parks, consistent with Oh et al. [57].
In terms of visitors’ satisfaction and behavioral intentions, emotional value was more strongly related to visitors’ satisfaction than functional value; this pattern echoes that which was identified by Lee et al. [19] and Sánchez et al. [58]. This result suggests the possibility of the emotional value’s fundamental contribution to fostering theme park visitors’ satisfaction. To obtain positive visitor evaluations, theme parks could implement certain strategies to strengthen visitors’ emotional value, such as providing an enjoyable visit and destination. Relevant efforts could be reflected in visitors’ behavioral intentions; for example, visitors may revisit a given theme park in the future or recommend the park to others, thereby contributing to theme parks’ sustainable development.

6. Conclusions

This study was grounded in the brand experience concept [11] and successfully identified antecedents and consequences in a theme park context. Furthermore, our findings help to specify dimensions of the brand experience concept. Although numerous studies have emphasized the importance of the experience economy in tourism and hospitality [19], little detailed information is available regarding the brand experience (e.g., which dimensions of the brand experience concept influence tourists’ satisfaction and behavioral intentions) in theme parks. Findings of this study offer empirical evidence that clarifies the role of brand experiences in the context of a historical and cultural theme park. Despite these revelations, this study has some limitations. Participants in this study were visiting a theme park that focused heavily on historical and cultural themes. Our findings and implications may not necessarily apply to other theme parks or research environments; therefore, future research should apply the model developed and tested in this study in other contexts to advance the brand experience concept.
This study was grounded in the brand experience concept proposed by Brakus et al. [11]. However, other constructs could be incorporated into our research model. For instance, visitors’ emotional reactions could be considered in attempts to construct more fulfilling brand experiences, which would also promote visitor satisfaction [59]. As another limitation, this study was conducted exclusively during late spring. Theme park visitors may behave differently in early spring, summer, fall, or winter. Subsequent research could involve a longitudinal approach to reflect such seasonal changes.
Although this study focused on economic aspects of sustainability, a triple-bottom-line approach could be recommended for future research; this method addresses social and environmental aspects along with economic aspects. As Muñoz-Pascual, Curado, and Galende [60] found, the triple-bottom-line approach can contribute to leading firms’ product innovation. Accordingly, the approach could potentially be applied to better understand the antecedents of theme park innovation.

Author Contributions

Conceptualization, J.W. and S.K.; methodology, J.W.; formal analysis, J.W.; investigation, J.W.; writing—original draft preparation, J.W. and S.K.; writing—review and editing, J.W., S.K. and J.K.; supervision, J.K. and S.K.; project administration, J.W. and S.K.

Funding

This research was funded by the China Scholarship Council, grant number 201808260021. The APC was funded by the authors.

Acknowledgments

This paper was based upon the first author (JunHui Wang)’s Master’s thesis.

Conflicts of Interest

The authors declare no conflict of interest. The funders had no role in the design of the study; in the collection, analyses, or interpretation of data; in the writing of the manuscript, or in the decision to publish the results.

References

  1. Milman, A. The future of the theme park and attraction industry. A management perspective. J. Travel Res. 2001, 40, 139–147. [Google Scholar] [CrossRef]
  2. Bae, Y.H.; Moon, S.; Jun, J.W.; Kim, T.; Ju, I. The impact of consumers’ attitudes toward a theme park: A focus on Disneyland in the Los Angeles metropolitan area. Sustainability 2018, 10, 3409. [Google Scholar] [CrossRef]
  3. Cheng, Q.; Fang, L.; Chen, H. Visitors’ brand loyalty to a historical and cultural theme park: A case study of Hangzhou Songcheng, China. Curr. Issues Tour. 2016, 19, 861–868. [Google Scholar] [CrossRef]
  4. Milman, A. Evaluating the guest experience at theme parks: An empirical investigation of key attributes. Int. J. Tour. Res. 2009, 11, 373–387. [Google Scholar] [CrossRef]
  5. Themed Entertainment Association and AECOM. 2018. Available online: https://www.aecom.com/theme-index/ (accessed on 14 March 2019).
  6. AECOM. 2018 China Theme Park Pipeline Report. Available online: https://www.aecom.com/cn/wp-content/uploads/2018/11/chinathemeparkpipeline.pdf (accessed on 14 March 2019).
  7. Zhang, W.; Shan, S. The theme park industry in China: A research review. Cogent Soc. Sci. 2016, 2, 1210718. [Google Scholar] [CrossRef]
  8. Bao, J. Theme Park Research; Science Press: Beijing, China, 2015; pp. 7–35. (In Chinese) [Google Scholar]
  9. Dong, G.Z.; Yang, F.Y. A study on the evaluation system of tourist satisfaction degree in tourist areas. Tour. Trib. 2005, 20, 27–30. [Google Scholar]
  10. McClung, G.W. Theme park selection: Factors influencing attendance. Tour. Manag. 1991, 12, 132–140. [Google Scholar] [CrossRef]
  11. Brakus, J.J.; Schmitt, B.H.; Zarantonello, L. Brand experience: What is it? How is it measured? Does it affect loyalty? J. Mark. 2009, 73, 52–68. [Google Scholar] [CrossRef]
  12. Moutinho, L. Amusement park visitor behaviour: Scottish attitudes. Tour. Manag. 1988, 9, 291–300. [Google Scholar] [CrossRef]
  13. Geissler, G.L.; Rucks, C.T. The overall theme park experience. A visitor satisfaction tracking study. J. Vacat. Mark. 2011, 17, 127–138. [Google Scholar] [CrossRef]
  14. Wanhill, S. Creating themed entertainment attractions: A Nordic perspective. Scand. J. Hosp. Tour. 2002, 2, 123–144. [Google Scholar] [CrossRef]
  15. Choi, Y.G.; Ok, C.M.; Hyun, S.S. Relationships between brand experiences, personality traits, prestige, relationship quality, and loyalty: An empirical analysis of coffeehouse brands. Int. J. Contemp. Hosp. Manag. 2017, 29, 1185–1202. [Google Scholar] [CrossRef]
  16. Zeithaml, V.A. Consumer perceptions of price quality, and value: A means-end model and synthesis of evidence. J. Mark. 1988, 52, 2–22. [Google Scholar] [CrossRef]
  17. Bolton, R.N.; Drew, J.H. A longitudinal analysis of the impact of service changes on customer attitudes. J. Mark. 1991, 55, 1–9. [Google Scholar] [CrossRef]
  18. Sweeney, J.C.; Soutar, G.N. Consumer perceived value: The development of a multiple item scale. J. Retail. 2001, 77, 203–220. [Google Scholar] [CrossRef]
  19. Lee, J.S.; Song, H.J.; Lee, C.K. A study on the experience, experiential value, and satisfaction of 3D film based on the Pine and Gilmore’s experience economy theory: The case of the film ‘Avatar’. Korea Acad. Soc. Tour. Leis. 2011, 23, 281–298. [Google Scholar]
  20. Song, H.J.; Lee, C.K.; Park, J.A.; Hwang, Y.H.; Reisinger, Y. The influence of tourist experience on perceived value and satisfaction with temple stays. The experience economy theory. J. Travel Tour. Mark. 2015, 32, 401–415. [Google Scholar] [CrossRef]
  21. Wu, H.C.; Li, M.Y.; Li, T. A study of experiential quality, experiential value, experiential satisfaction, theme park image, and revisit intention. J. Hosp. Tour. Res. 2018, 42, 26–73. [Google Scholar] [CrossRef]
  22. Bennett, R.; Rundel-Thiele, S. The brand loyalty life cycle: Implications for marketers. J. Brand Manag. 2005, 12, 250–263. [Google Scholar] [CrossRef]
  23. Yüksel, A.; Yüksel, F. Shopping risk perceptions: Effects on tourists’ emotions, satisfaction and expressed loyalty intentions. Tour. Manag. 2007, 28, 703–713. [Google Scholar] [CrossRef]
  24. Oliver, R.L. Cognitive, affective, and attribute bases of the satisfaction response. J. Consum. Res. 1993, 20, 418–430. [Google Scholar] [CrossRef]
  25. Lee, T.H. A structural model to examine how destination image, attitude, and motivation affect the future behavior of tourists. Leis. Sci. 2009, 31, 215–236. [Google Scholar] [CrossRef]
  26. Ross, E.L.D.; Iso-Ahola, S.E. Sightseeing tourists’ motivation and satisfaction. Ann. Tour. Res. 1991, 18, 226–237. [Google Scholar] [CrossRef]
  27. Gallarza, M.G.; Saura, I.G. Value dimensions, perceived value, satisfaction and loyalty: An investigation of university students’ travel behaviour. Tour. Manag. 2006, 27, 437–452. [Google Scholar] [CrossRef]
  28. Chen, C.F.; Chen, F.S. Experience quality, perceived value, satisfaction and behavioral intentions for heritage tourists. Tour. Manag. 2010, 31, 29–35. [Google Scholar] [CrossRef]
  29. Han, H.S.; Hyun, S.S. Impacts of hotel-restaurant image and quality of physical-environment, service, and food on satisfaction and intention. Int. J. Hosp. Manag. 2017, 63, 82–92. [Google Scholar] [CrossRef]
  30. Kozak, M.; Rimmington, M.T. Tourist satisfaction with Mallorca, Spain, as an off-season holiday destination. J. Travel Res. 2000, 38, 260–269. [Google Scholar] [CrossRef]
  31. Cheng, Q.; Du, R.; Ma, Y. Factors influencing theme park visitor brand-switching behaviour as based on visitor perception. Curr. Issues Tour. 2016, 19, 1425–1446. [Google Scholar] [CrossRef]
  32. Han, H.; Meng, B.; Kim, W. Bike-traveling as a growing phenomenon: Role of attributes, value, satisfaction, desire, and gender in developing loyalty. Tour. Manag. 2017, 59, 91–103. [Google Scholar] [CrossRef]
  33. Manthiou, A.; Kang, J.; Chiang, L.; Tang, L. Investigating the effects of memorable experiences: An extended model of script theory. J. Travel Tour. Mark. 2016, 33, 362–379. [Google Scholar] [CrossRef]
  34. McDougall, G.H.; Levesque, T. Customer satisfaction with services: Putting perceived value into the equation. J. Serv. Mark. 2000, 14, 392–410. [Google Scholar] [CrossRef]
  35. Baker, D.A.; Crompton, J.L. Quality, satisfaction and behavioral intentions. Ann. Tour. Res. 2000, 27, 785–804. [Google Scholar] [CrossRef]
  36. Cole, S.T.; Chancellor, H.C. Examining the festival attributes that impact visitor experience, satisfaction and re-visit intention. J. Vacat. Mark. 2009, 15, 323–333. [Google Scholar] [CrossRef]
  37. Chi, C.G.O.; Chua, B.L.; Othman, M.; Karim, S.A. Investigating the structural relationships between food image, food satisfaction, culinary quality, and behavioral intentions: The case of Malaysia. Int. J. Hosp. Tour. Adm. 2013, 14, 99–120. [Google Scholar] [CrossRef]
  38. Mason, M.C.; Nassivera, F. A conceptualization of the relationships between quality, satisfaction, behavioral intention, and awareness of a festival. J. Hosp. Mark. Manag. 2013, 22, 162–182. [Google Scholar] [CrossRef]
  39. Jung, T.; Ineson, E.M.; Kim, M.; Yap, M.H. Influence of festival attribute qualities on slow food tourists’ experience, satisfaction level and revisit intention. The case of the Mold Food and Drink Festival. J. Vacat. Mark. 2015, 21, 277–288. [Google Scholar] [CrossRef]
  40. Sohn, H.K.; Lee, T.H.; Yoon, Y.S. Relationship between perceived risk, evaluation, satisfaction, and behavioral intention: A case of local-festival visitors. J. Travel Tour. Mark. 2016, 33, 28–45. [Google Scholar] [CrossRef]
  41. Kim, H.S.; Shim, J.H. The effects of service qualities on customer satisfaction and behavioral intention in coffee shops. Int. J. Ind. Distrib. Bus. 2017, 8, 95–109. [Google Scholar] [CrossRef]
  42. Song, H.J.; Wang, J.H.; Han, H.S. Effect of image, satisfaction, trust, love, and respect on loyalty formation of name-brand coffee shops. Int. J. Hosp. Manag. 2019, 79, 50–59. [Google Scholar] [CrossRef]
  43. Jin, N.; Lee, S.; Lee, H. The effect of experience quality on perceived value, satisfaction, image and behavioral intention of water park patrons: New versus repeat visitors. Int. J. Tour. Res. 2015, 17, 82–95. [Google Scholar] [CrossRef]
  44. Milman, A.; Tasci, A.D. Exploring the experiential and sociodemographic drivers of satisfaction and loyalty in the theme park context. J. Destin. Mark. Manag. 2018, 8, 385–395. [Google Scholar] [CrossRef]
  45. Prebensen, N.K.; Woo, E.; Chen, J.S.; Uysal, M. Motivation and involvement as antecedents of the perceived value of the destination experience. J. Travel Res. 2013, 52, 253–264. [Google Scholar] [CrossRef]
  46. Sahin, A.; Zehir, C.; Kitapçı, H. The effects of brand experiences, trust and satisfaction on building brand loyalty; an empirical research on global brands. Procedia Soc. Behav. Sci. 2011, 24, 1288–1301. [Google Scholar] [CrossRef]
  47. Kim, K.H. The relation among fit indexes, power, and sample size in structural equation modeling. Struct. Equ. Model. 2005, 12, 368–390. [Google Scholar] [CrossRef]
  48. MacCallum, R.C.; Browne, M.W.; Sugawara, H.M. Power analysis and determination of sample size for covariance structure modeling. Psychol. Methods 1996, 1, 130–149. [Google Scholar] [CrossRef]
  49. MacCallum, R.C.; Hong, S. Power analysis in covariance structure modeling using GFI and AGFI. Multivar. Behav. Res. 1997, 32, 193–210. [Google Scholar] [CrossRef] [PubMed]
  50. MacCallum, R.C.; Browne, M.W.; Cai, L. Testing differences between nested covariance structure models: Power analysis and null hypotheses. Psychol. Methods 2006, 11, 19–35. [Google Scholar] [CrossRef]
  51. Anderson, J.C.; Gerbing, D.W. Structural equation modeling in practice: A review and recommended two-step approach. Psychol. Bull. 1988, 103, 411. [Google Scholar] [CrossRef]
  52. Bearden, W.O.; Sharma, S.; Teel, J.E. Sample size effects on chi square and other statistics used in evaluation causal models. J. Mark. Res. 1982, 19, 425–430. [Google Scholar] [CrossRef]
  53. Hair, J.F.; Black, W.C.; Babin, B.J.; Anderson, R.E. Multivariate Data Analysis; Pearson: Hoboken, NJ, USA, 2010. [Google Scholar]
  54. Nunnally, J. Psychometric Methods; McGraw-Hill: New York, NY, USA, 1978; pp. 464–465. [Google Scholar]
  55. Bagozzi, R.P.; Yi, Y. On the evaluation of structural equation models. J. Acad. Mark. Sci. 1988, 16, 74–94. [Google Scholar] [CrossRef]
  56. Fornell, C.; Larcker, D.F. Evaluating structural equation models with unobservable variables and measurement error. J. Mark. Res. 1981, 18, 39–50. [Google Scholar] [CrossRef]
  57. Oh, H.; Fiore, A.M.; Jeoung, M. Measuring experience economy concepts: Tourism applications. J. Travel Res. 2007, 46, 119–132. [Google Scholar] [CrossRef]
  58. Sánchez, J.; Callarisa, L.; Rodríguez, R.M.; Moliner, M.A. Perceived value of the purchase of a tourism product. Tour. Manag. 2006, 27, 394–409. [Google Scholar] [CrossRef]
  59. Morrison, S.; Crane, F.G. Building the service brand by creating and managing an emotional brand experience. J. Brand Manag. 2007, 14, 410–421. [Google Scholar] [CrossRef]
  60. Muñoz-Pascual, L.; Curado, C.; Galende, J. The triple bottom line on sustainable product innovation performance in SMEs: A mixed methods approach. Sustainability 2019, 11, 1689. [Google Scholar] [CrossRef]
Figure 1. Proposed Research Model. Note: Core attribute (CA); peripheral attribute (PA); sensory (SEN); affective (AFF); intellectual (INT); behavioral (BEH); function value (FV); motional value (EV); satisfaction (SAT); behavioral intention (BI).
Sustainability 11 04810 g001
Figure 2. Results of the structural model. * p < 0.05; ** p < 0.01; *** p < 0.001. Note: Core attribute (CA); peripheral attribute (PA); sensory (SEN); affective (AFF); intellectual (INT); behavioral (BEH); function value (FV); emotional value (EV); satisfaction (SAT); behavioral intention (BI).
Sustainability 11 04810 g002
Table 1. Demographic profile of respondents.
Characteristic FrequencyPercentage (%)
GenderMale14846.1
Female17353.9
Age<2092.8
20–299228.7
30–398526.5
40–497322.7
50–593711.5
>60257.8
EducationHigh school or less237.2
College9730.2
4-year University15648.6
Graduate school4514.0
OccupationOfficial from government134.0
Technician/academic4313.4
Business manager247.5
Service and sale person4213.1
Office worker6520.2
Farmer72.2
Student10031.2
Retired123.7
Other154.7
Marital statusSingle10432.4
Married19761.6
Other195.9
Monthly income a3000 or less10934.0
3000–49998426.2
5000–69997122.1
7000–89993310.3
9000 or more247.5
a Unit: Yuan (Chinese currency); N = 321.
Table 2. Confirmatory factor analysis: Items and loadings.
10 Factors and Scale ItemsStandardized Factor Loading
F1: Core attribute (CA)
Creativity of entertainment options offered to guests 0.786
Variety of entertainment options (shows, parades, and music) 0.771
Activities that appeal to people of all ages0.762
F2: Peripheral attribute (PA)
Friendly and courteous staff0.848
Staff knowledge about the park’s features0.849
Timeliness of staff services 0.889
F3: Sensory (SEN)
Songcheng Theme Park gives me a strong impression on my visual sense or other senses.0.643
I find Songcheng Theme Park is interesting in a sensory way.0.807
Songcheng Theme Park appeals to my senses.0.760
F4: Affective (AFF)
Songcheng Theme Park gives me good feelings and emotions.0.908
Songcheng Theme Park is a tourism product that values emotion.0.963
Songcheng Theme Park is an emotional tourism destination.0.871
F5: Intellectual (INT)
Songcheng Theme Park gives me a variety of thoughts.0.838
Songcheng Theme Park stimulates my curiosity.0.845
Songcheng Theme Park lets me know a lot.0.658
F6: Behavioral (BEH)
I am excited in Songcheng Theme Park.0.865
I engage in physical actions and behaviors when I am in Songcheng Theme Park.0.842
I spend a lot of time in staying Songcheng Theme Park.0.660
F7: Function value (FV)
Songcheng Theme Park was an economical visit.0.941
Compared to the cost of the visit, Songcheng Theme Park provided many benefits.0.783
Songcheng Theme Park has a higher financial value than other tourism products.0.788
F8: Emotional value (EV)
My visit to Songcheng Theme Park was very enjoyable.0.819
After visiting here, my impression of this theme park was deepened.0.681
My visit to Songcheng Theme Park was a good tourism destination that I enjoyed.0.940
F9: Satisfaction (SAT)
I am satisfied even after visiting Songcheng Theme Park, as expected.0.697
My feelings for Songcheng Theme Park are good.0.715
I am totally satisfied with Songcheng Theme Park.0.833
F10: Behavioral intention (BI)
I intend to visit Songcheng Qianguqing Theme Park again in the near future0.930
I will say positive things about this theme park to other people.0.896
I intend to recommend Songcheng Theme Park to others.0.813
Note: All standardized factor loadings are significant at p < 0.05.
Table 3. Results of measurement model.
ConstructCAPASENAFFINTBEHFVEVSATBI
CA0.5980.561
(0.749)
0.587
(0.766)
0.199
(0.446)
0.630
(0.794)
0.209
(0.457)
0.309
(0.556)
0.408
(0.639)
0.743
(0.862)
0.496
(0.697)
PA0.0430.7430.464
(0.681)
0.148
(0.385)
0.432
(0.657)
0.264
(0.514)
0.225
(0.474)
0.242
(0.492)
0.514
(0.717)
0.465
(0.682)
SEN0.0190.0180.5470.229
(0.479)
0.486
(0.697)
0.315
(0.561)
0.364
(0.603)
0.285
(0.534)
0.506
(0.711)
0.471
(0.686)
AFF0.0190.0190.0100.8370.326
(0.571)
0.149
(0.386)
0.131
(0.362)
0.134
(0.366)
0.185
(0.430)
0.205
(0.453)
INT0.0300.0310.0170.0160.6160.309
(0.556)
0.233
(0.483)
0.346
(0.588)
0.496
(0.704)
0.356
(0.597)
BEH0.0240.0240.0120.0120.0190.6310.552
(0.743)
0.188
(0.434)
0.233
(0.483)
0.205
(0.453)
FV0.0230.0240.0140.0120.0180.0190.7070.321
(0.567)
0.292
(0.540)
0.262
(0.512)
EV0.0260.0260.0130.0130.0210.0150.0170.6730.359
(0.599)
0.384
(0.620)
SAT0.0360.0320.0180.0170.0280.0200.0200.0220.5640.658 *
(0.811)
BI0.0230.0230.0120.0120.0200.0140.0160.0170.0240.776
α0.8170.8870.780.9380.8200.8170.8760.8460.7820.908
CR0.8170.8970.7830.9390.8270.8350.8780.8580.7940.912
Note: Core attribute (CA); peripheral attribute (PA); sensory (SEN); affective (AFF); intellectual (INT); behavioral (BEH); function value (FV); emotional value (EV); satisfaction (SAT); behavioral intention (BI); composite reliability (CR); * = highest correlation between pairs of constructs; the values of average variance extracted (AVE) are along the diagonal; squared correlations among latent constructs are above the diagonal; correlations among latent constructs are in the parentheses; standard errors among latent constructs are below the diagonal.

