Evaluation of Effects of the Humidity Level-Based Auto-Controlled Centralized Exhaust Ventilation Systems on Thermal Comfort of Multi-Family Residential Buildings in South Korea


Abstract
1. Introduction
2. Methodology
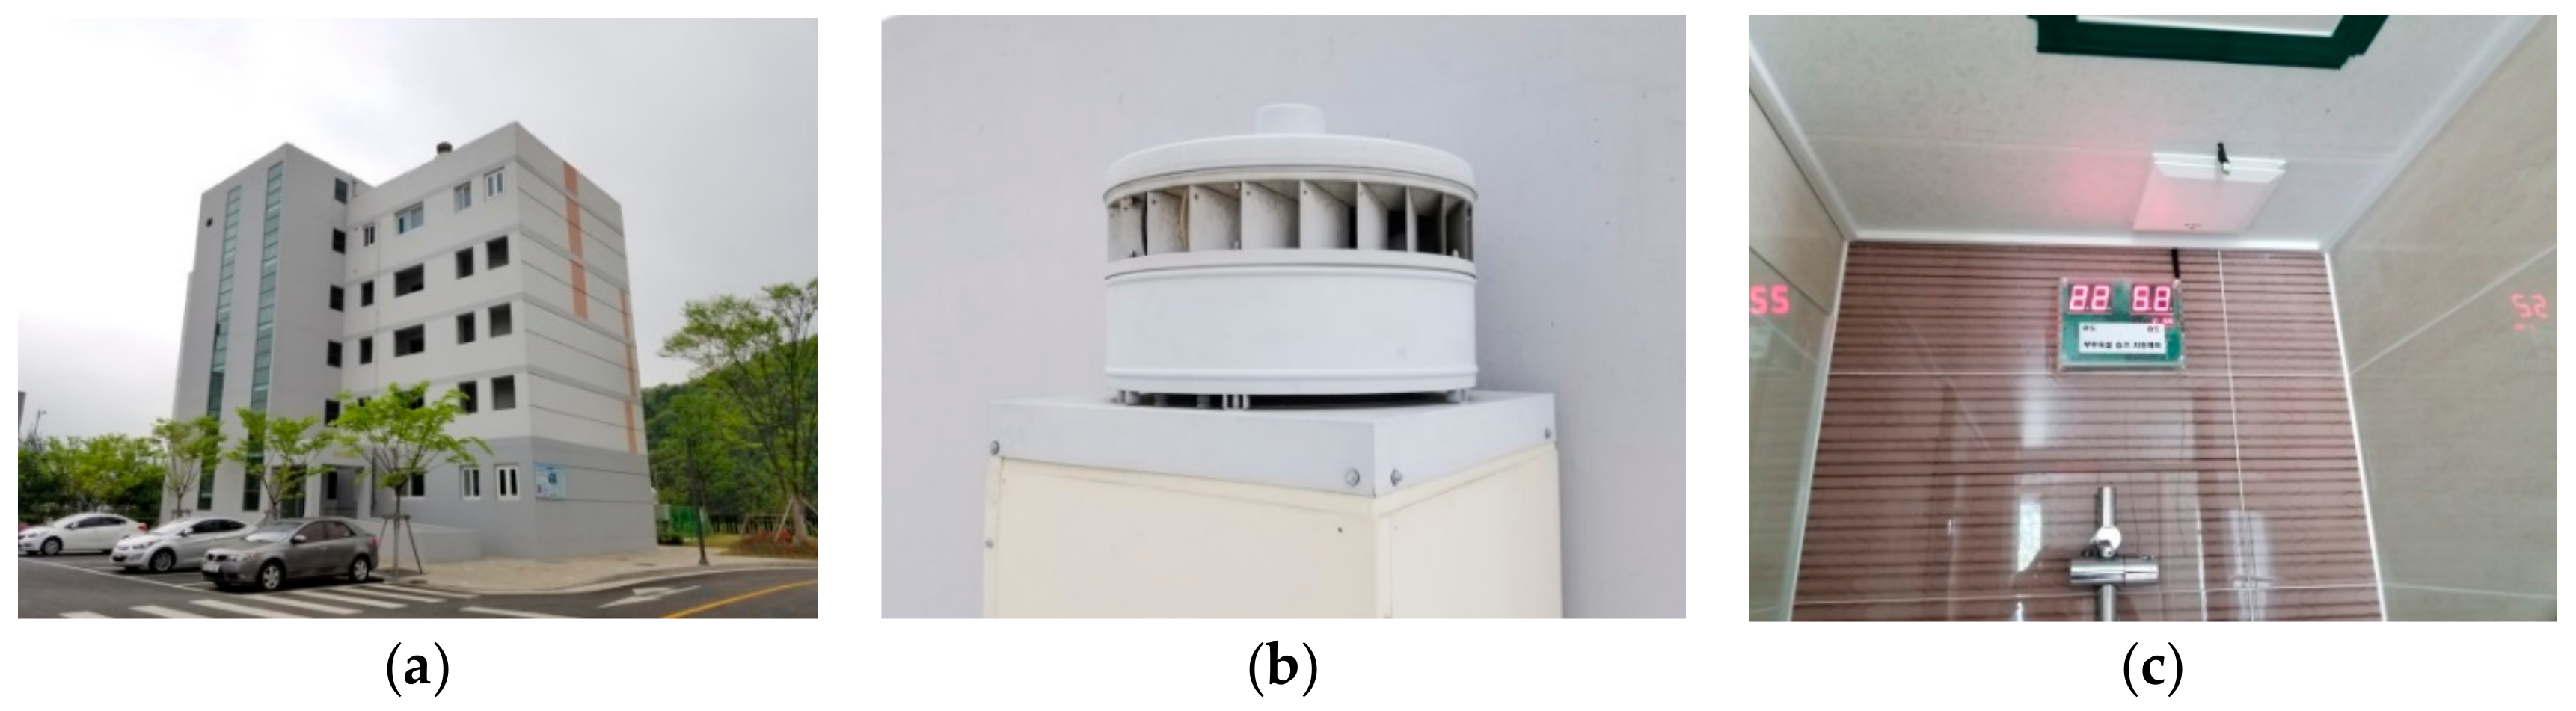
3. Field Tests
4. Results
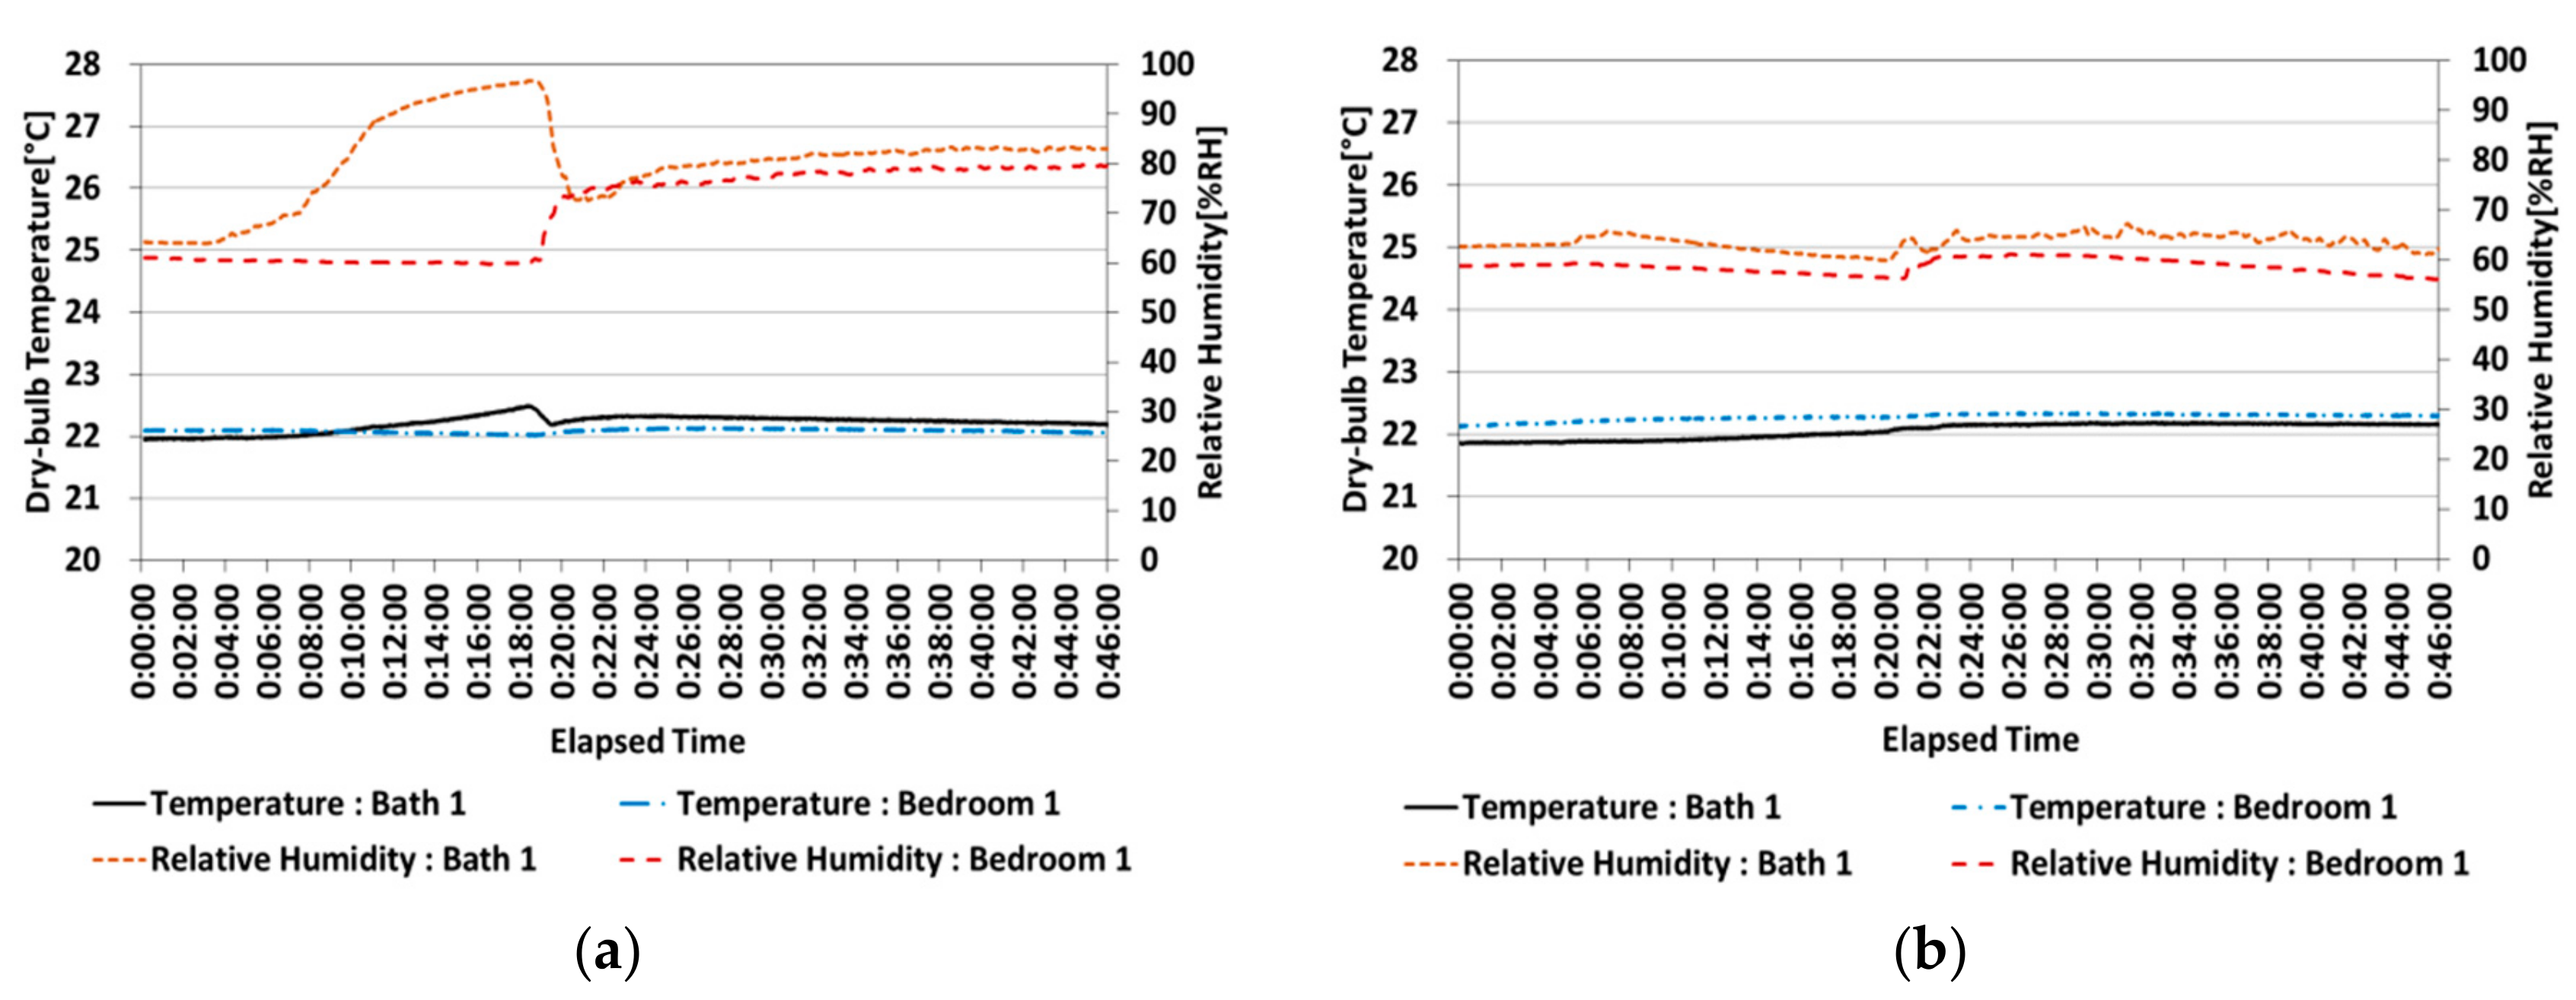
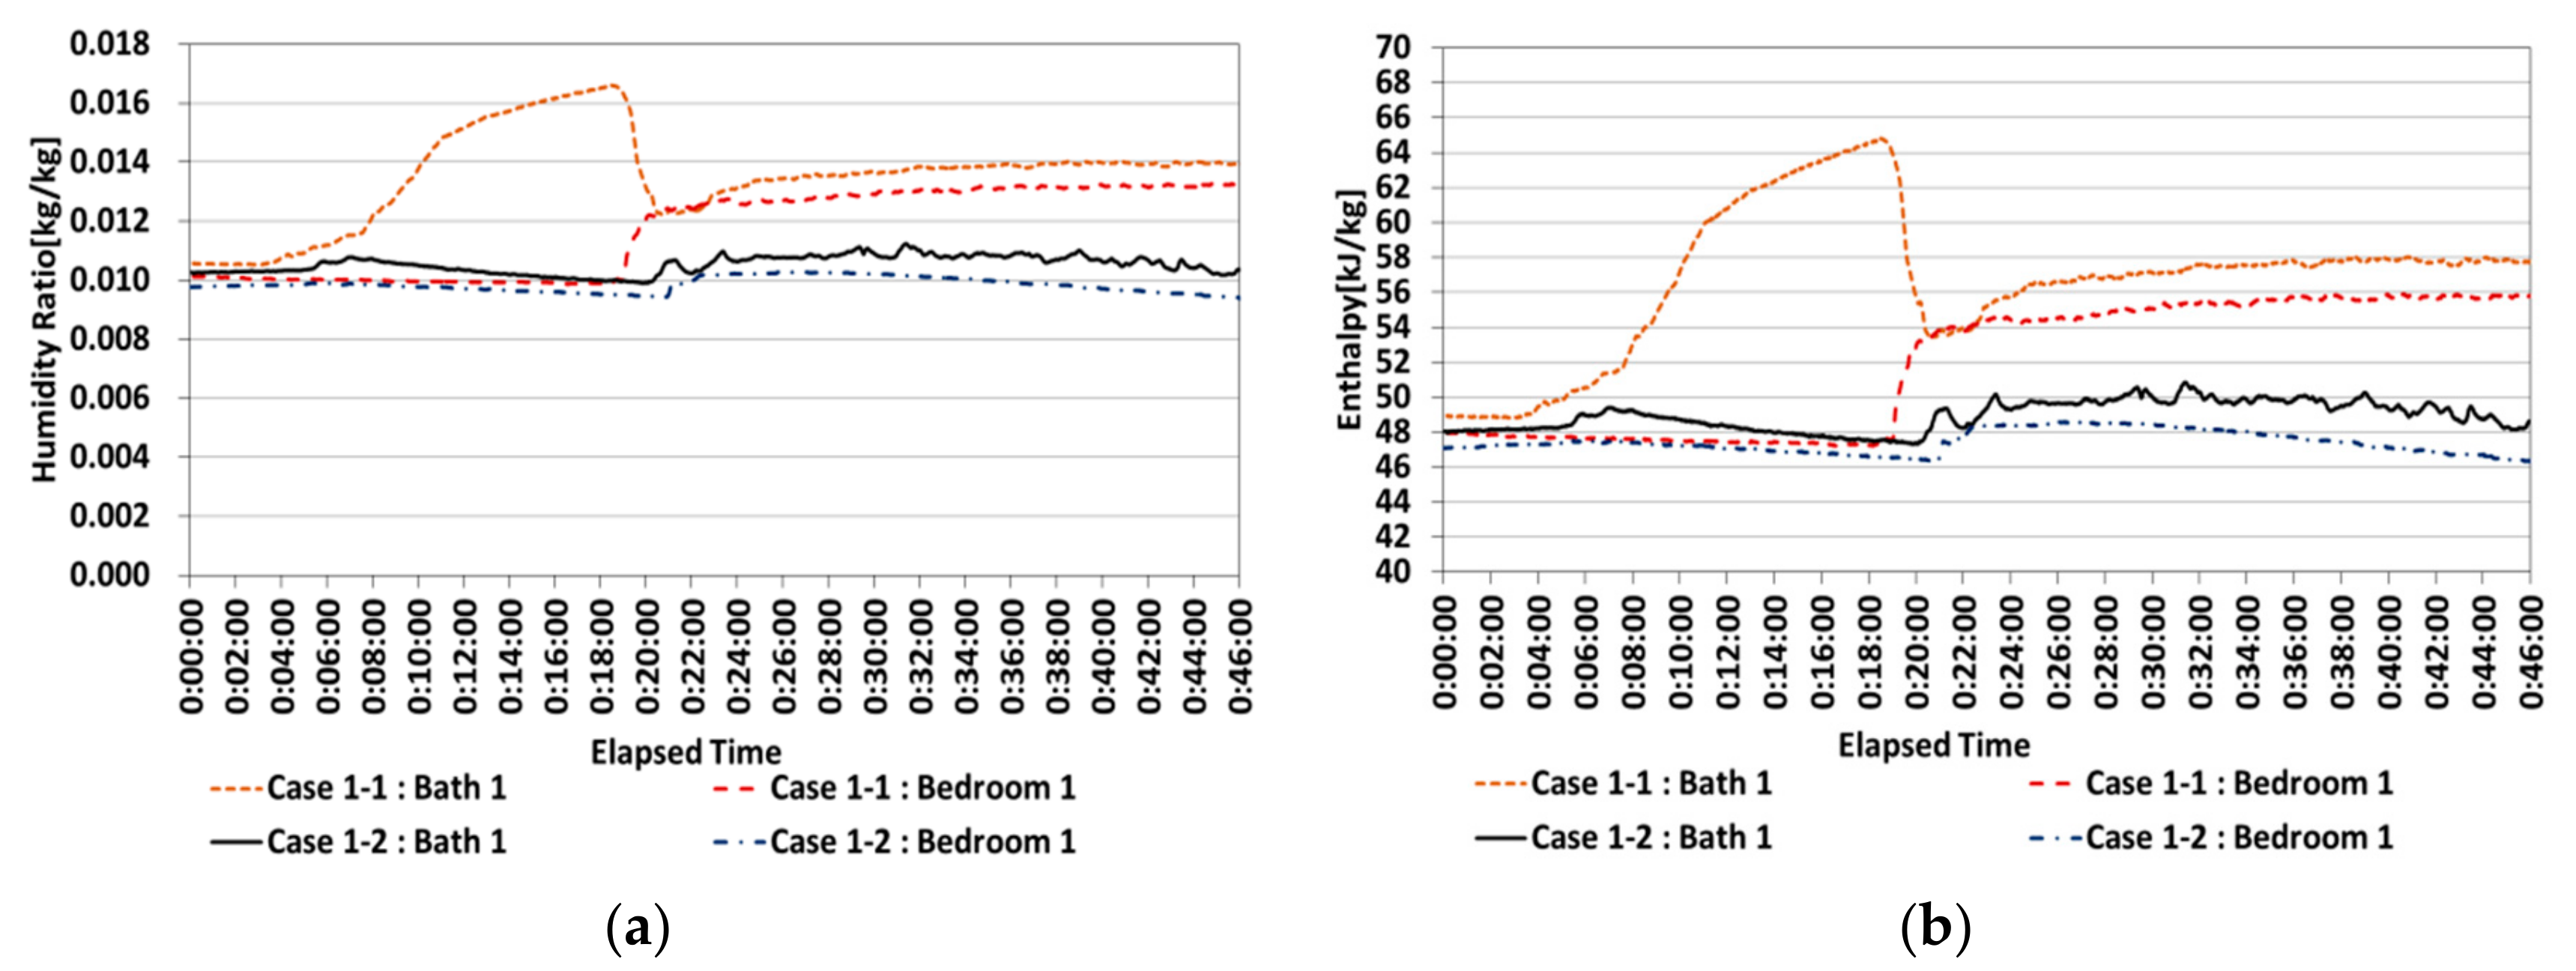
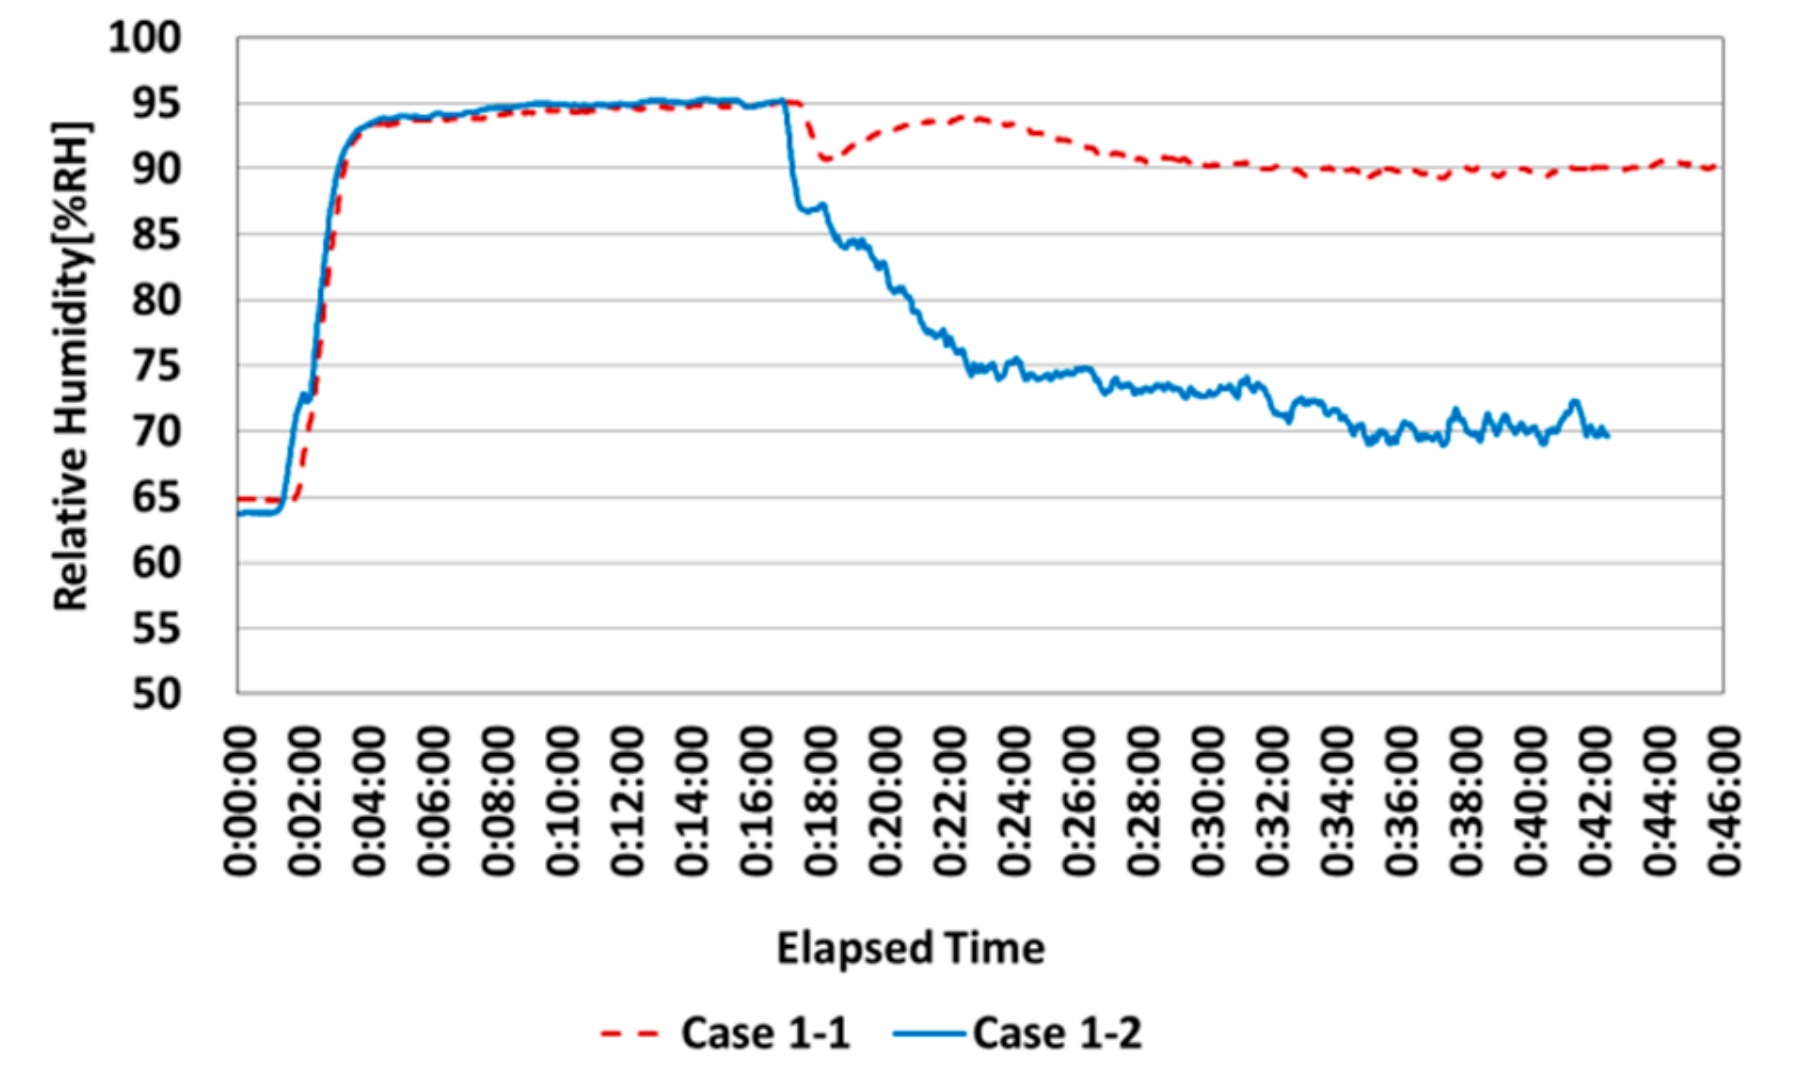
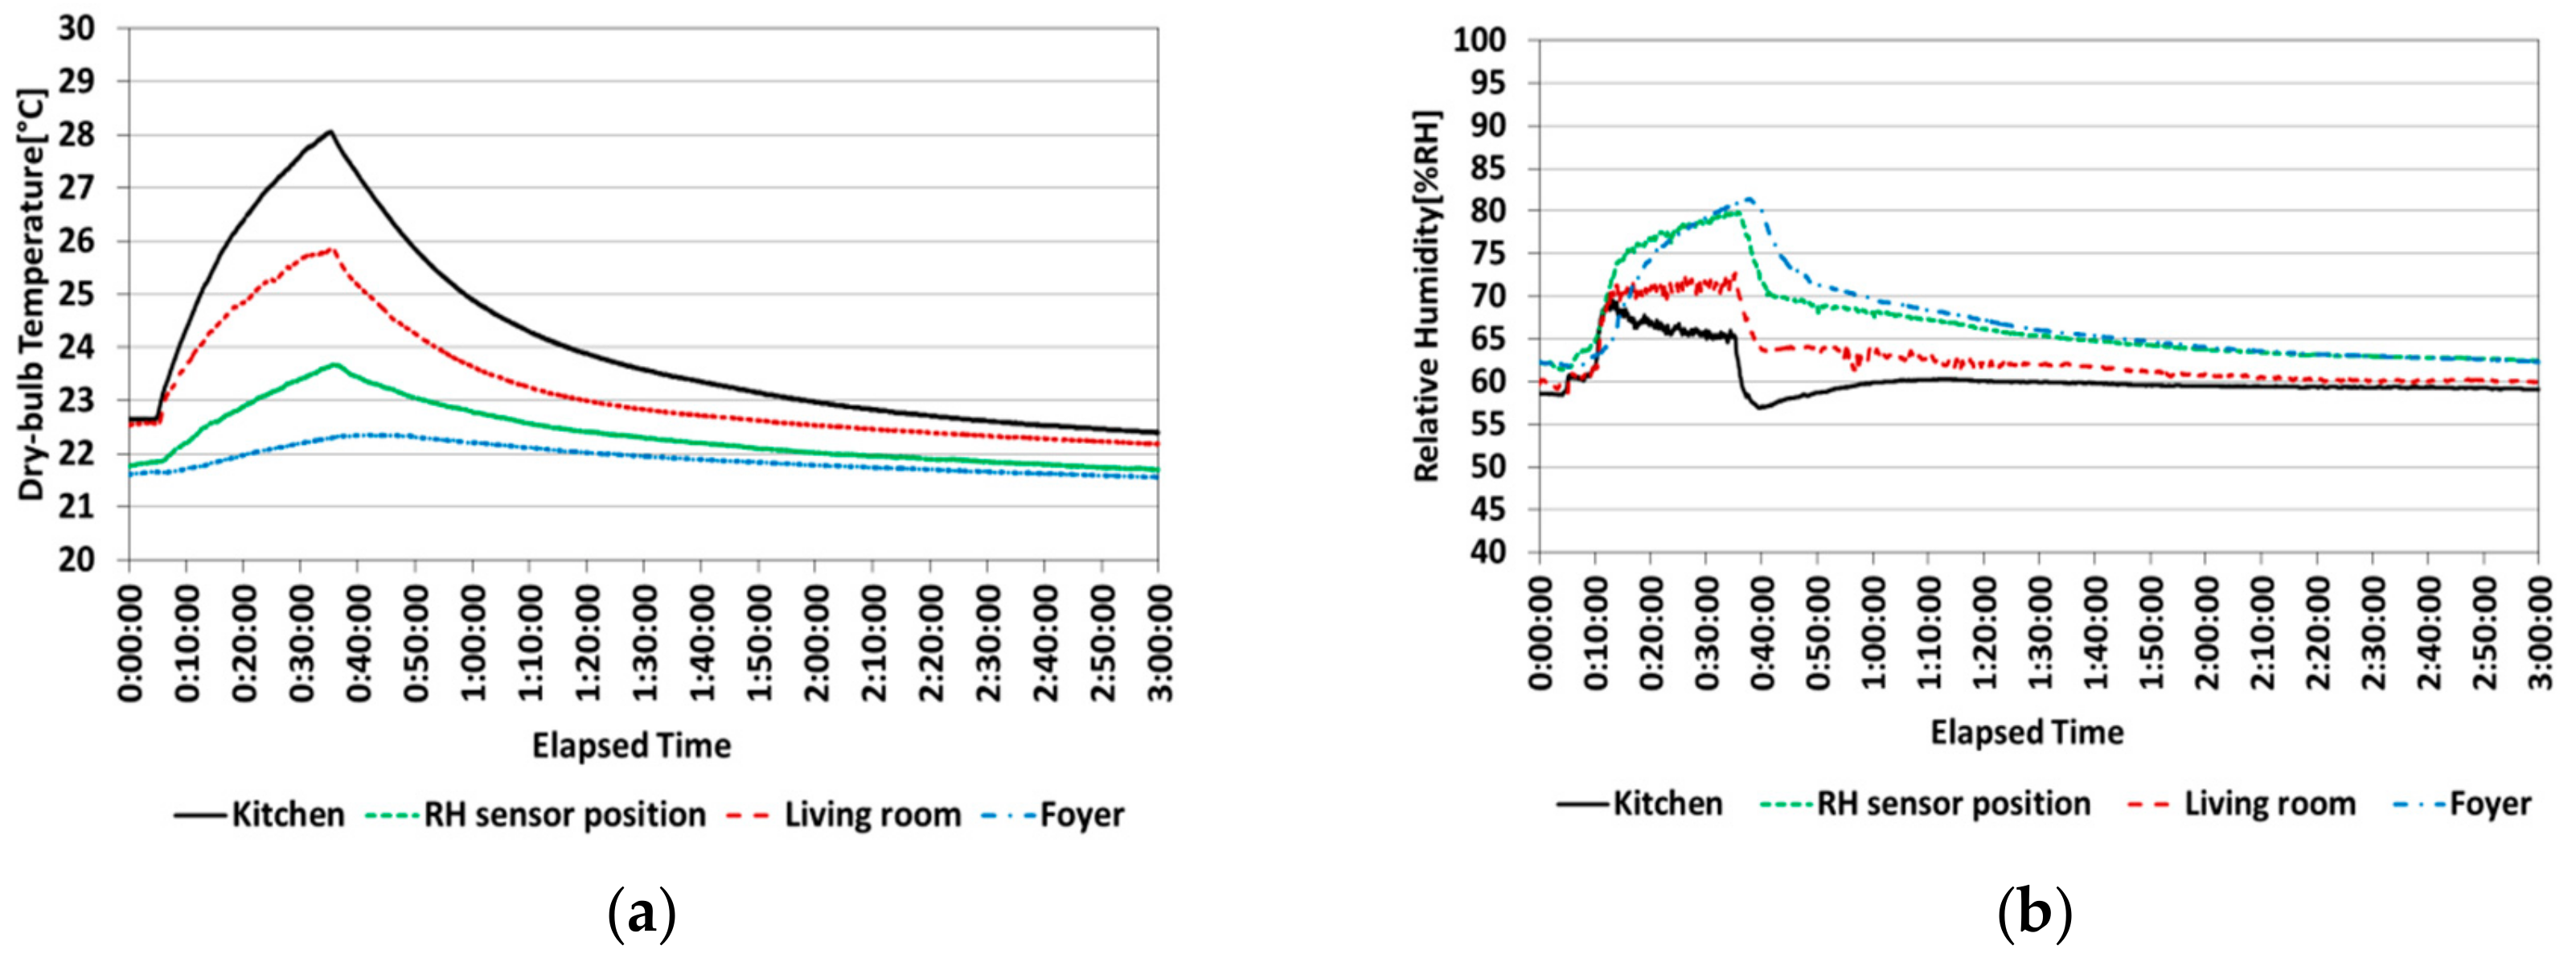
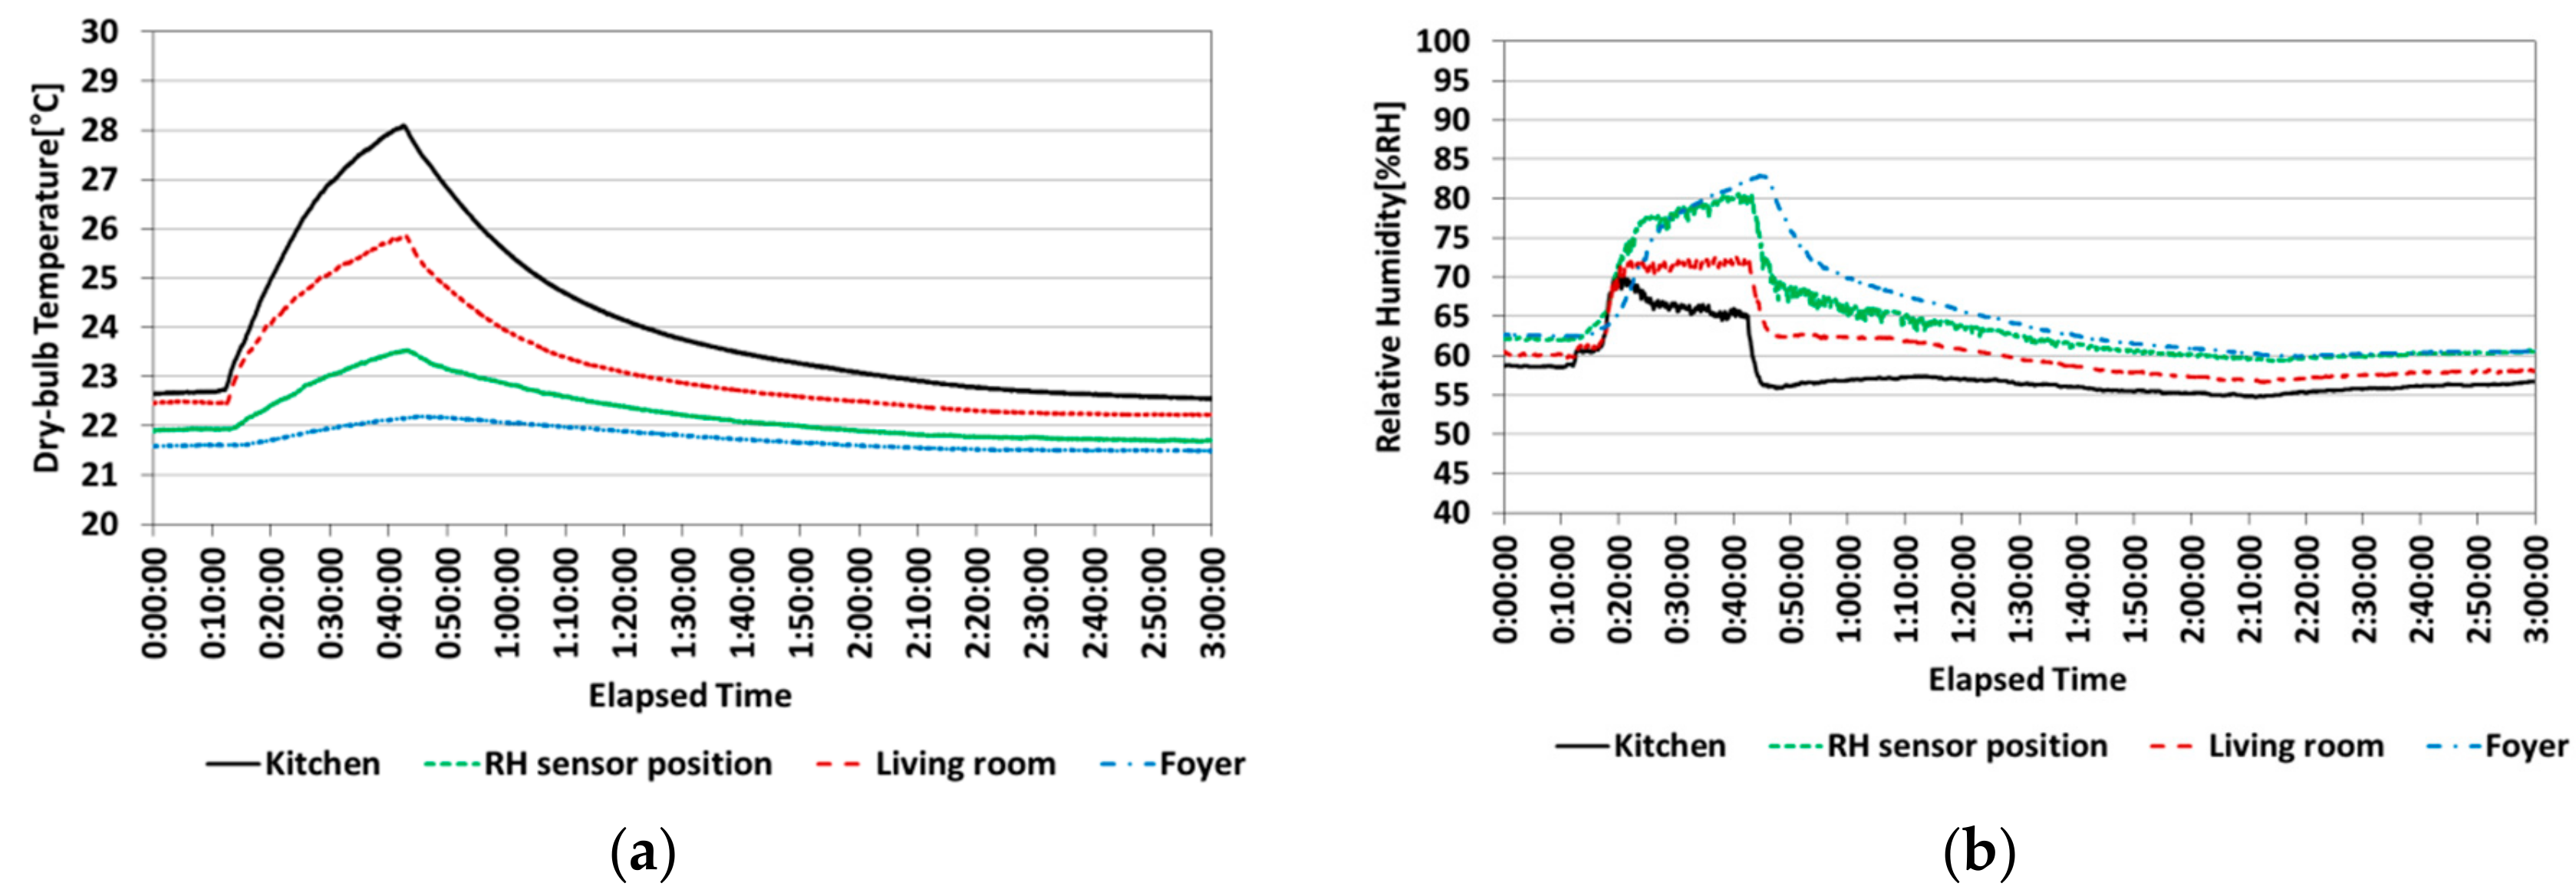
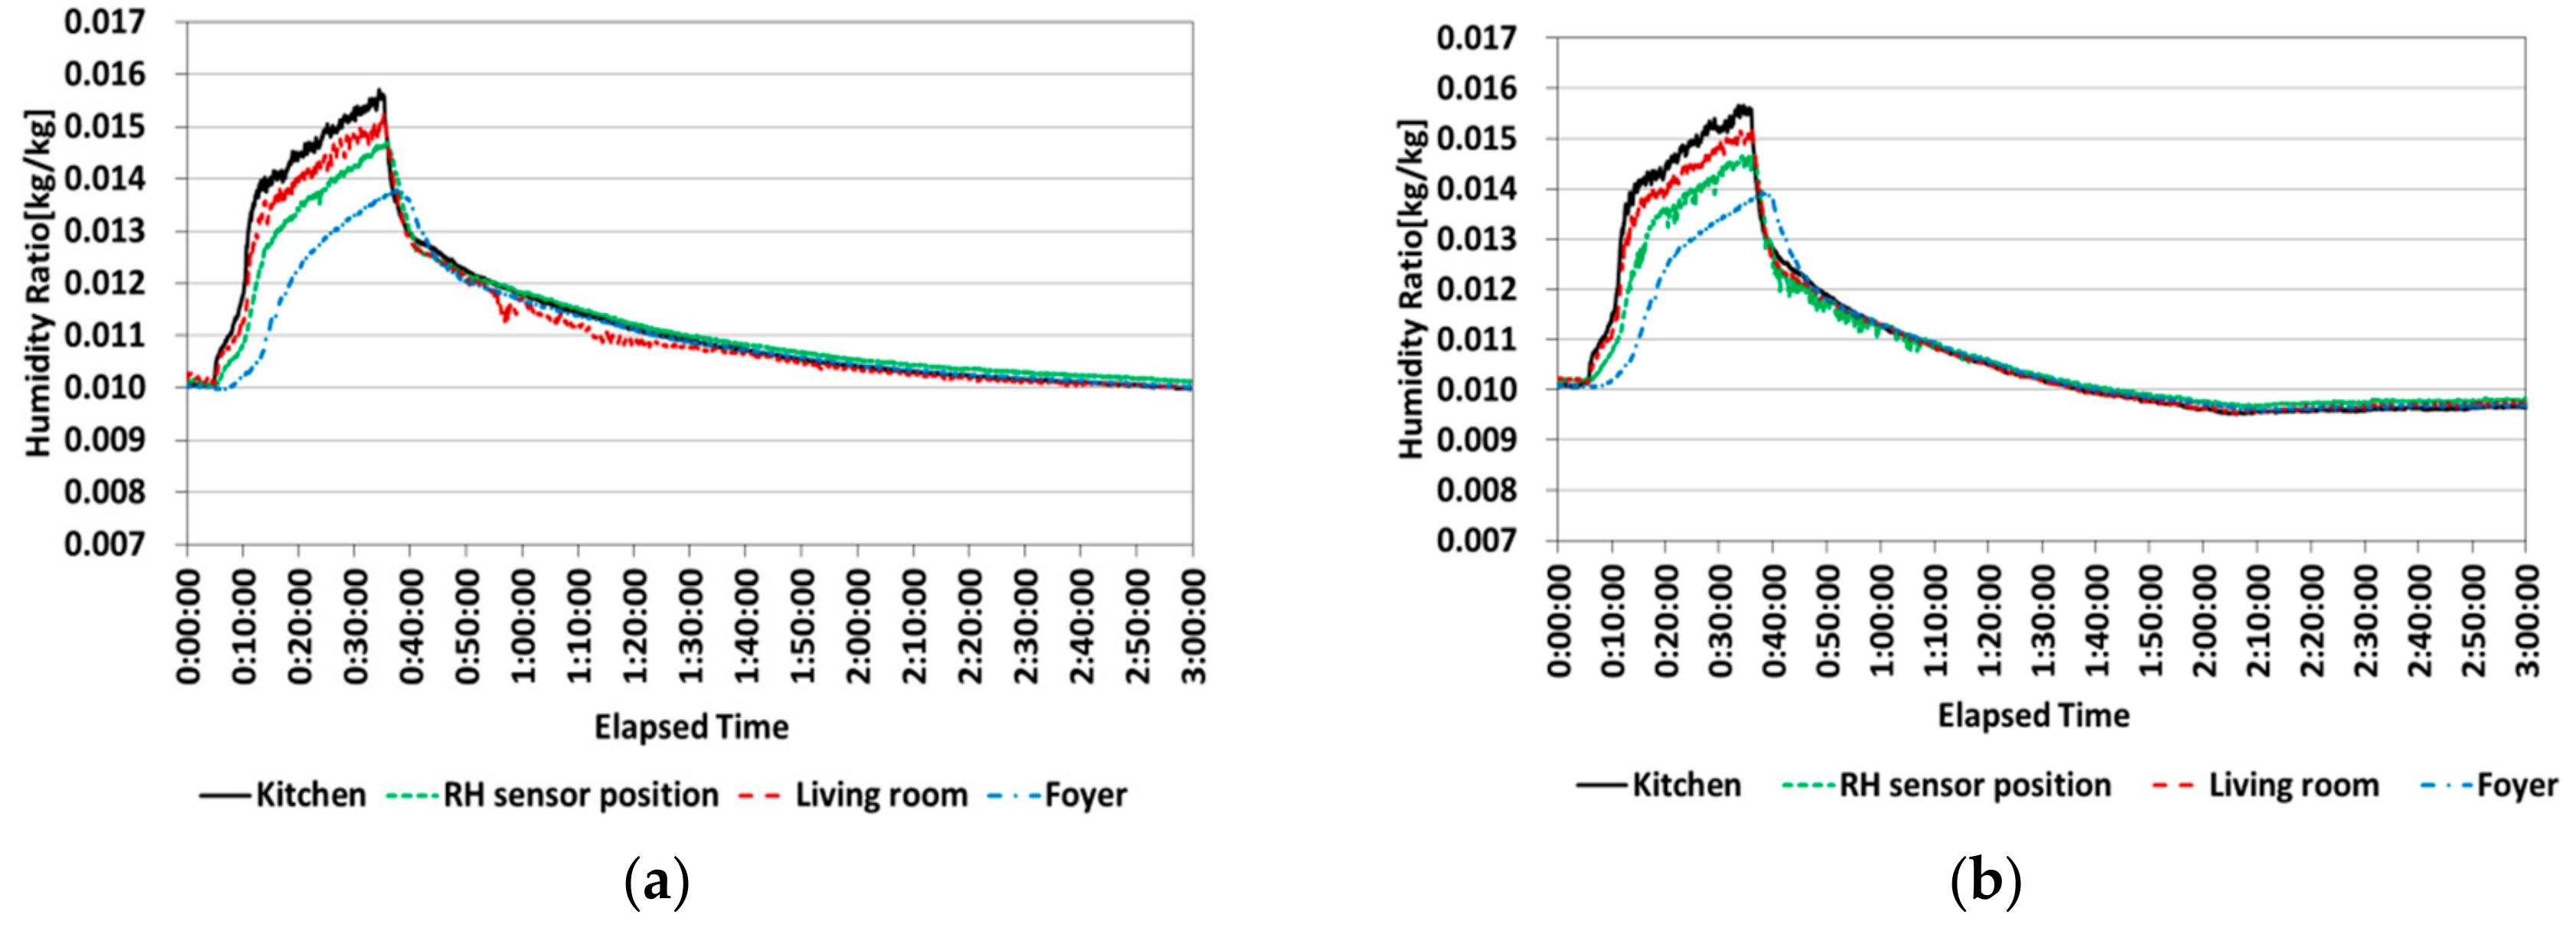
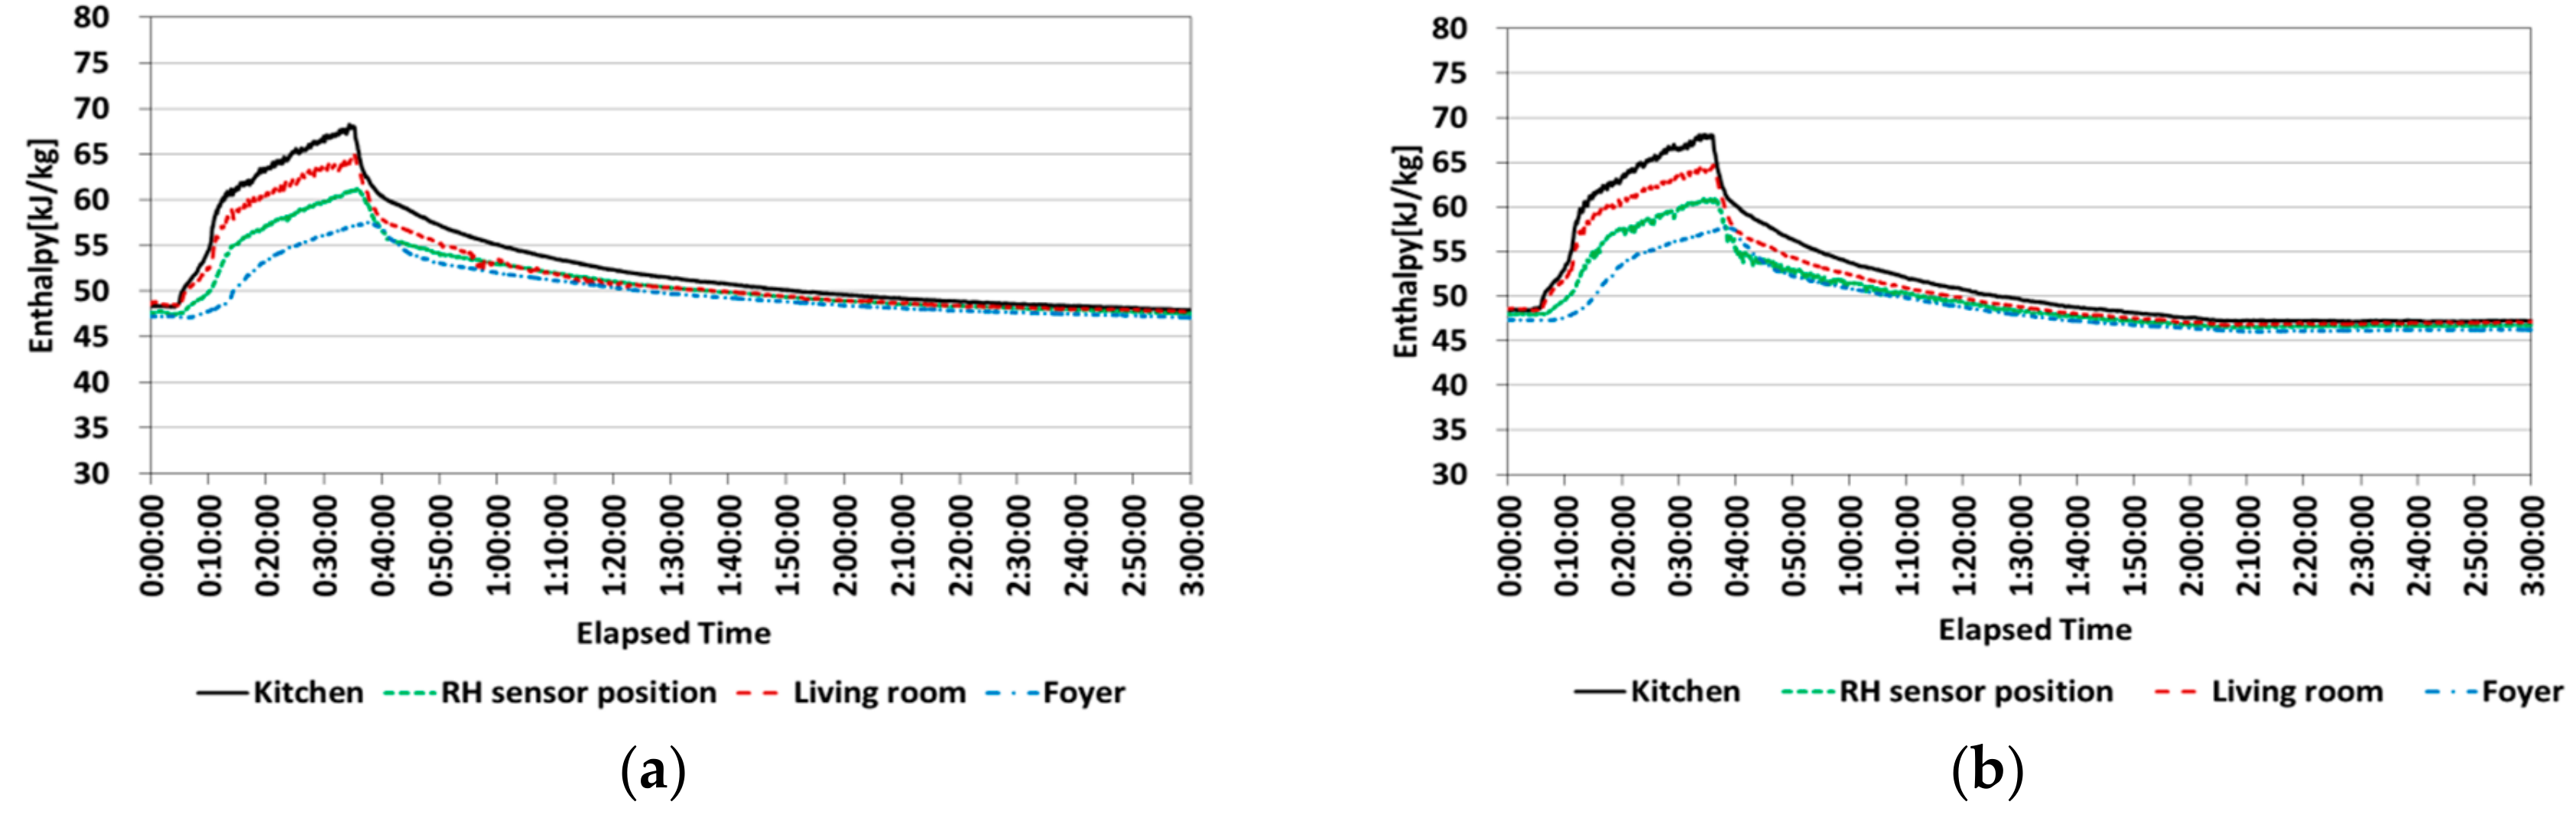
4.1. Evaluation of Effects on Indoor Air Quality
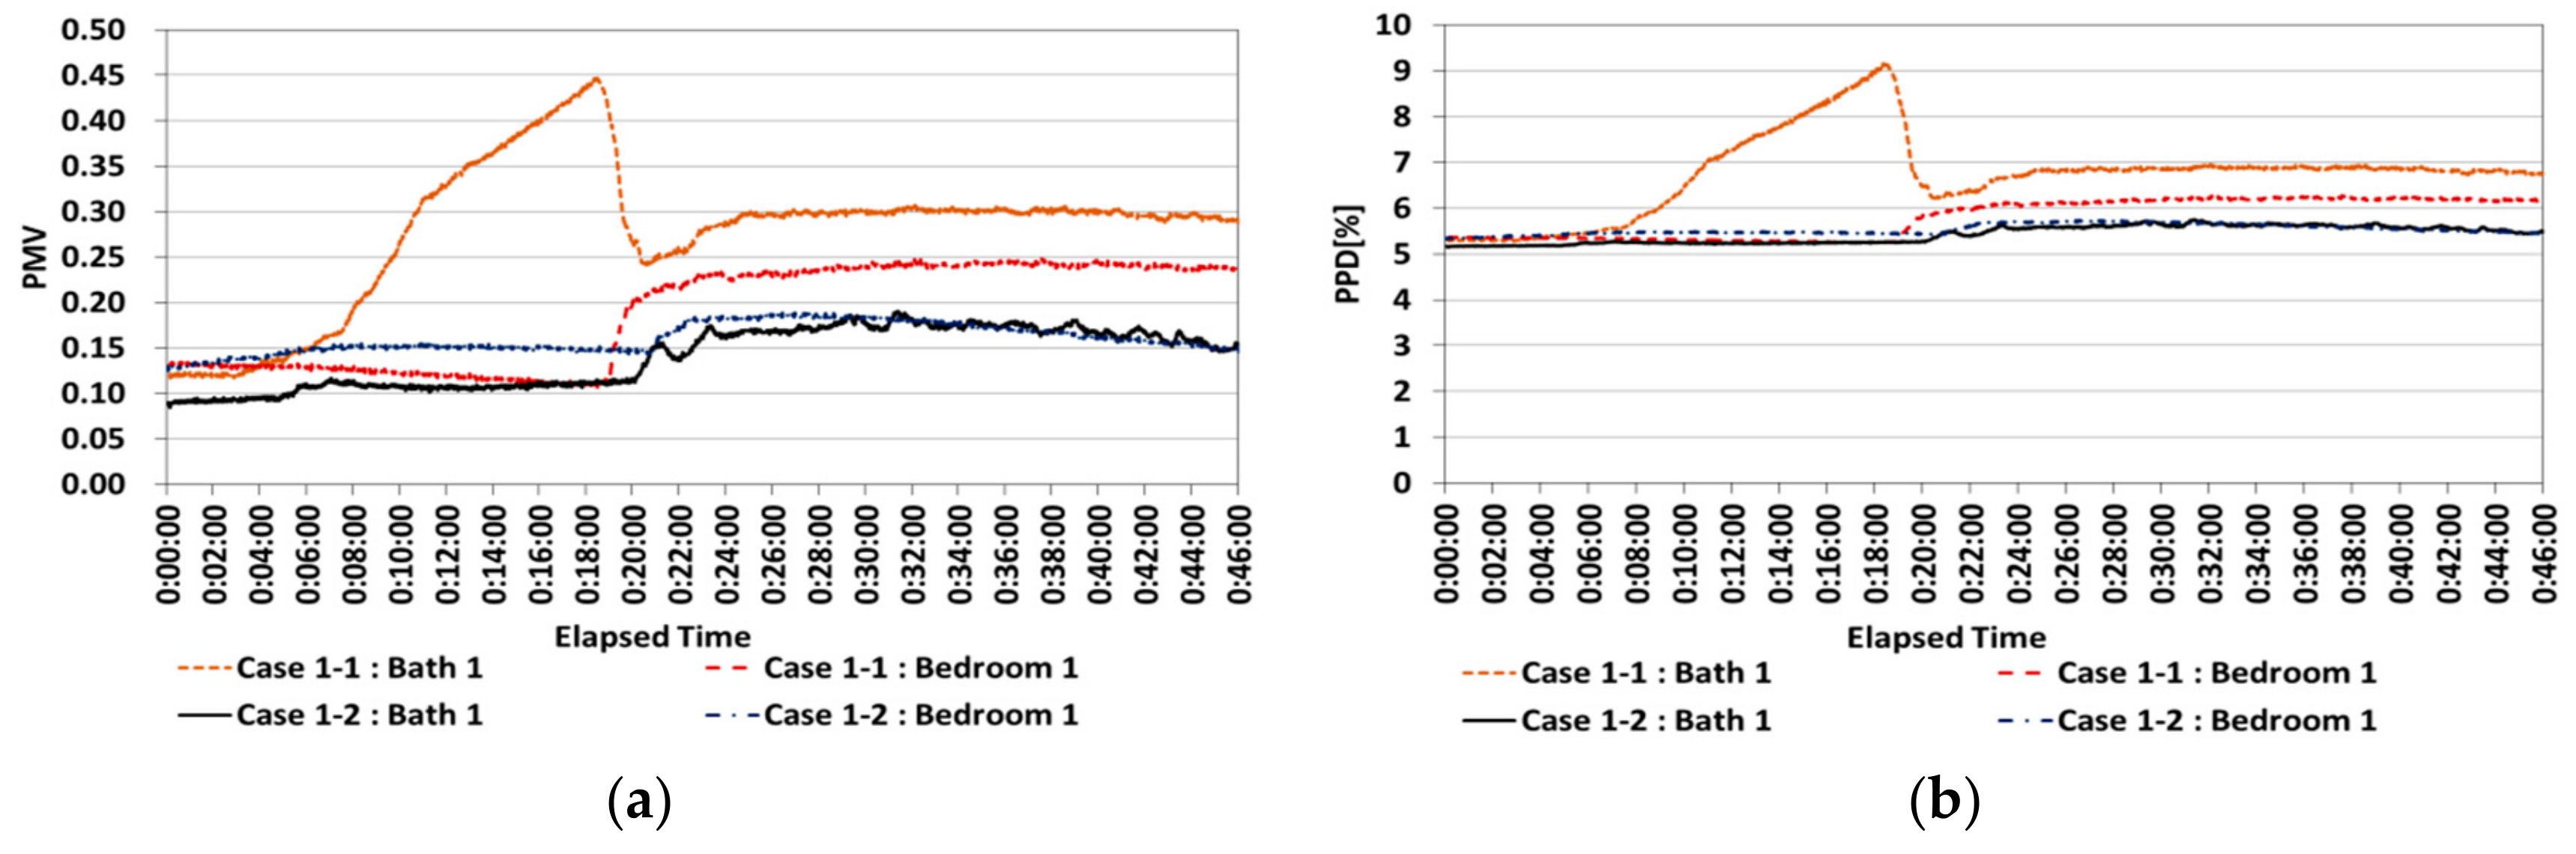
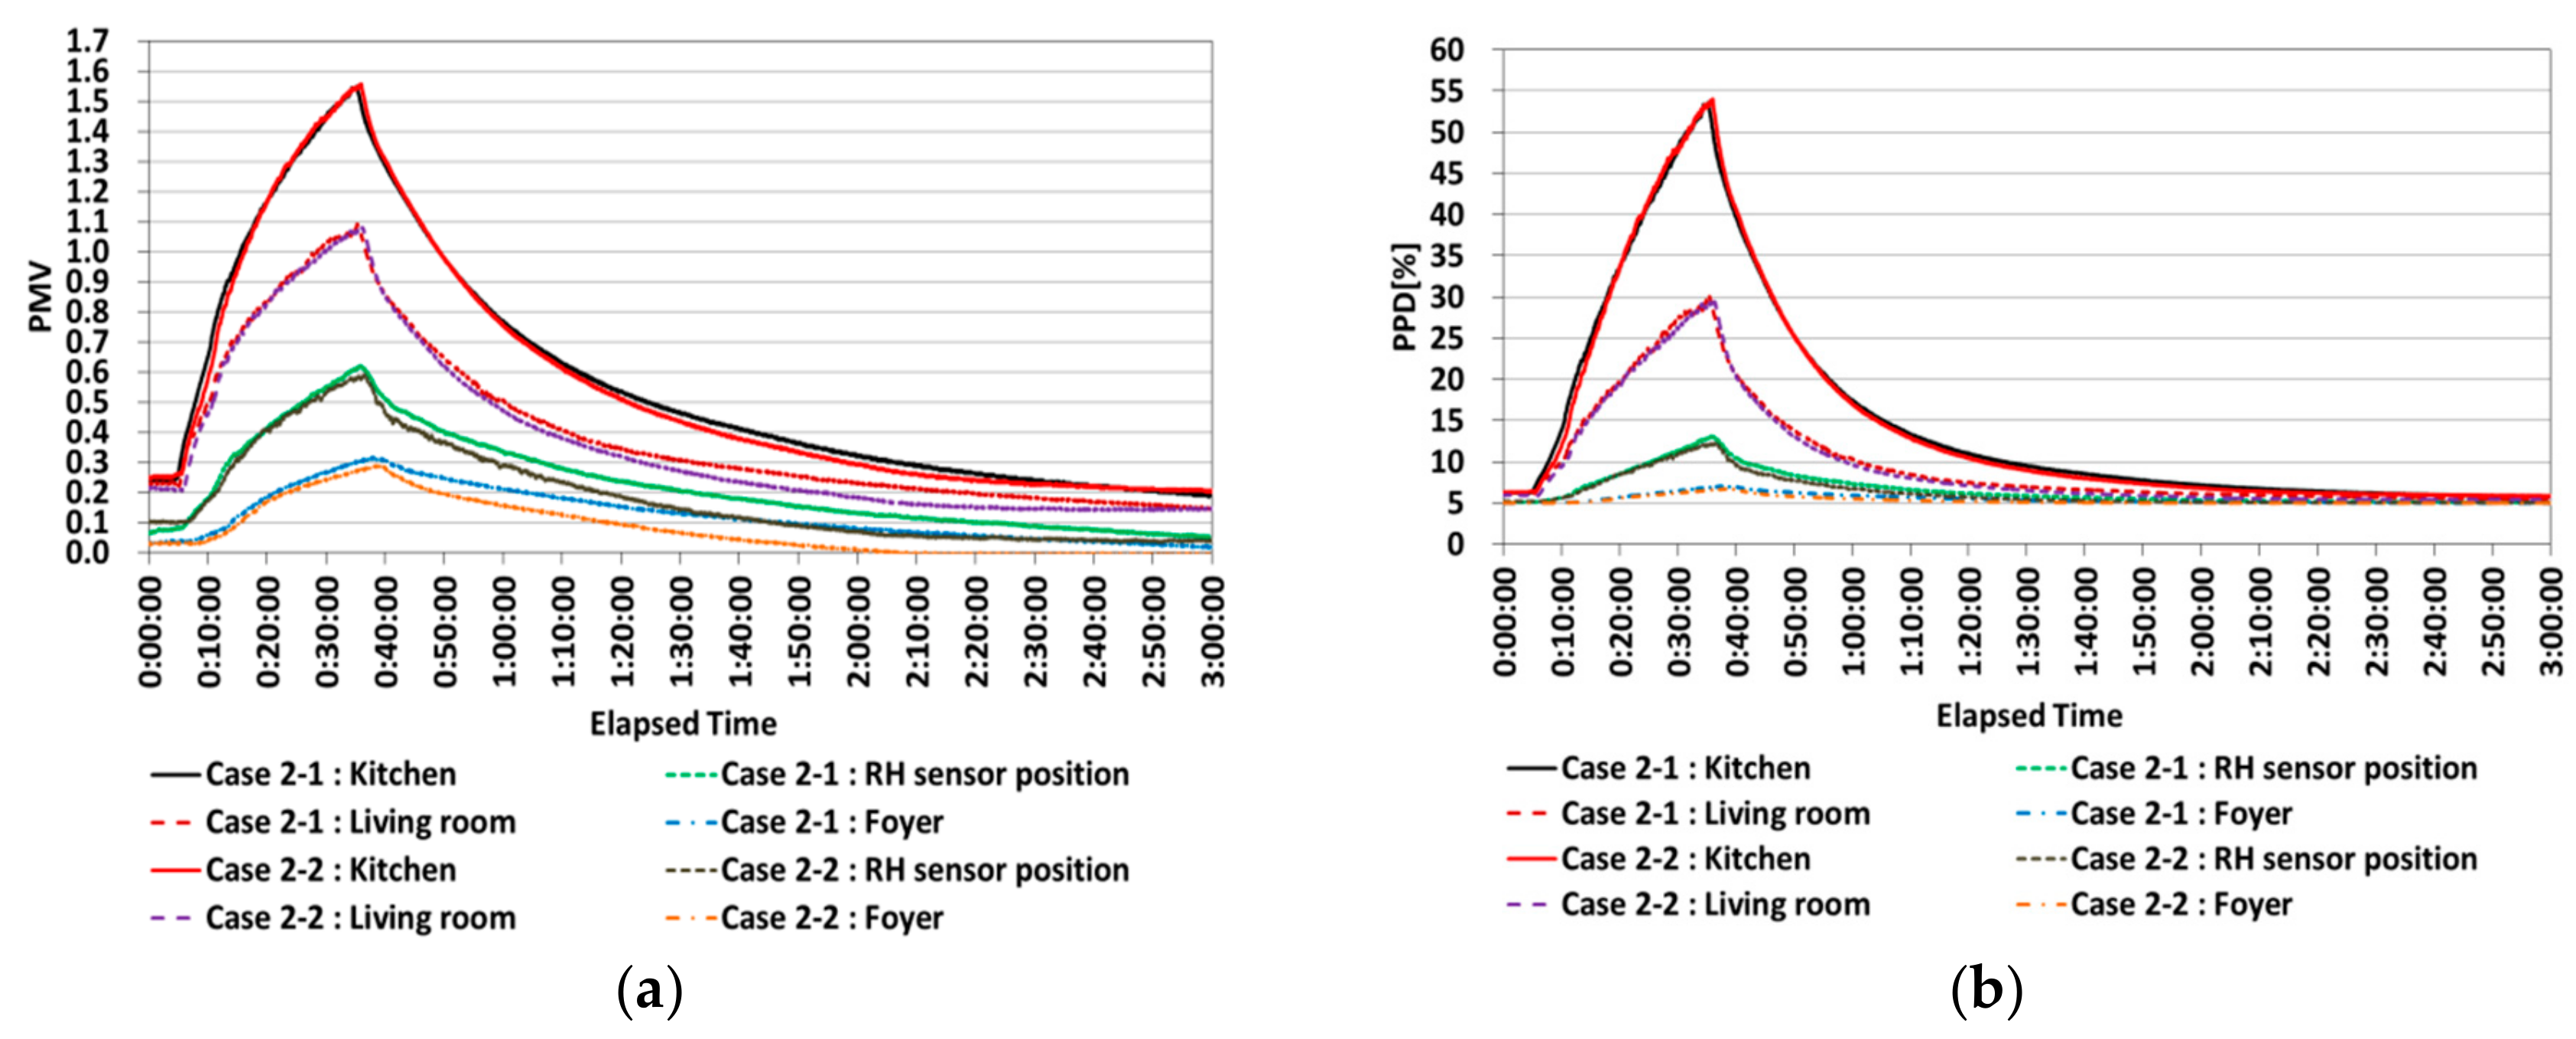
4.2. Evaluation of Effects on Indoor Thermal Comfort
- M: Metabolic rate [W/m2]
- W: Effective mechanical power [W/m2]
- H: Sensitive heat losses
- Ec: Heat exchange by evaporation on the skin
- Cres: Heat exchange by convection in breathing
- Eres: Evaporative heat exchange in breathing.
5. Summary
6. Conclusions
Author Contributions
Funding
Conflicts of Interest
References
- Korea Energy Economics Institute. Yearbook of Energy Statistics; Korea Energy Economics Institute: Ulsan, Korea, 2018. [Google Scholar]
- U.S. Energy Information Administration. Energy Consumption Estimates by Sector in 2018. Available online: https://www.eia.gov/consumption/ (accessed on 10 May 2019).
- European Commission. Energy Performance of Buildings. Available online: https://ec.europa.eu/energy/en/topics/energy-efficiency/energy-performance-of-buildings (accessed on 10 May 2019).
- Moon, H.J. Humidity control in buildings for healthy environment. Rev. Archit. Build Sci. 2015, 59, 53–59. [Google Scholar]
- Australian Building Codes Board. Condensation in Buildings-Handbook, 2nd ed.; Australian Building Codes Board: Canberra, Australia, 2014. [Google Scholar]
- Arens, E.A.; Baughman, A.V. Indoor humidity and human health: Part II—Buildings and their systems. ASHRAE Trans. 1996, 102, 212–221. [Google Scholar]
- Walker, I.S.; Sherman, M.H. Humidity implications for meeting residential ventilation requirements. In Proceedings of the ASHRAE Buildings X Conference—Thermal Performance of the Exterior Envelopes of Whole Buildings, U.S. Department of Energy, Oak Ridge National Laboratory, Atlanta, GA, USA, 2–7 December 2007; 14p. [Google Scholar]
- TenWolde, A.; Pilon, C.L. The effect of indoor humidity on water vapor release in homes. In Proceedings of the ASHRAE Buildings X Conference—Thermal Performance of the Exterior Envelopes of Whole Buildings, Atlanta, GA, USA, 2–7 December 2007. [Google Scholar]
- Fanger, P.O. Thermal Comfort, Analysis and Application in Environmental Engineering; Danish Technical Press: Copenhagen, Denmark, 1970. [Google Scholar]
- Fanger, P.O. Assessment of man’s thermal comfort in practice. Br. J. Ind. Med. 1973, 30, 313–324. [Google Scholar] [CrossRef] [PubMed]
- ASHRAE. ANSI/ASHRAE Standard 55-2010-Thermal Environmental Conditions for Human Occupancy; The American Society of Heating, Refrigerating and Air-Conditioning Engineers: Atlanta, GA, USA, 2010. [Google Scholar]
- Zhai, Y.; Zhang, Y.; Zhang, H.; Pasut, W.; Arens, E.; Meng, Q. Human comfort and perceived air quality in warm and humid environments with ceiling fans. Build. Environ. 2015, 90, 178–185. [Google Scholar] [CrossRef]
- Vellei, M.; Herrera, M.; Fosas, D.; Natarajan, S. The influence of relative humidity on adaptive thermal comfort. Build. Environ. 2017, 124, 171–185. [Google Scholar] [CrossRef]
- Wei, S.; Sun, Y.; Li, M.; Lin, W.; Zhao, D.; Shi, Y.; Yang, H. Indoor thermal environment evaluations and parametric analyses in naturally ventilated buildings in dry season using a field survey and PMVe-PPDe model. Build. Environ. 2011, 46, 1275–1283. [Google Scholar] [CrossRef]
- Nguyen, A.T.; Singh, M.J.; Reiter, S. An adaptive thermal comfort model for hot humid South-East Asia. Build. Environ. 2012, 56, 291–300. [Google Scholar] [CrossRef]
- Piasecki, M.; Fedorczak-Cisak, M.; Furtak, M.; Biskupski, J. Experimental confirmation of the reliability of fanger’s thermal comfort model—Case study of a near-zero energy building (NZEB) office building. Sustainability 2019, 11, 2461. [Google Scholar] [CrossRef]
- Wei, S.; Li, M.; Lin, W.; Sun, Y. Parametric studies and evaluations of indoor thermal environment in wet season using a field survey and PMV-PPD method. Energy Build. 2010, 42, 799–806. [Google Scholar] [CrossRef]
- Raczkowski, A. Assessment of Perceived Air Quality for Selected Flat in the Residential Building, Environmental Engineering III, 1st ed.; Taylor & Francis Group: London, UK, 2010. [Google Scholar]
- Lim, Y.; Song, D. Development of water vapor control algorithm for preventing condensation in multi-residential building. In Proceedings of the 2015 Winter Conference of Society of Air-conditioning and Refrigerating Engineers of Korea, Seoul, Korea, 27 November 2015; pp. 283–286. [Google Scholar]
- Suh, H.S.; Ryu, S.R. An experimental research on the effect of the ventilation system on the condensation reduction. In Proceedings of the 2012 Autumn Conference of Architectural Institute of Korea, Gwangju, Korea, 25 October 2012; Volume 32, pp. 351–352. [Google Scholar]
- Kim, Y.T.; Cho, W.J.; Rhee, K.N.; Hwang, M.K.; Lee, S.J.; Cha, J.H. Study on development of automatic control device of ventilation system to prevent indoor over-humidification in water. In Proceedings of the Korean Solar Energy Society Conference, Busan, Korea, 1–2 November 2012; Volume 32. [Google Scholar]
- Nielsen, T.R.; Drivsholm, C. Energy efficient demand controlled ventilation in single family houses. Energy Build. 2010, 42, 1995–1998. [Google Scholar] [CrossRef]
- Kim, G.T.; Chun, J.Y.; Kim, S.; Choi, K.S.; Park, G.Y. A Study on the Performance Evaluation and the Application Method of the Centralized Ventilation System; The Korea Land and Housing Institute: Daejeon, Korea, 2018. [Google Scholar]
- Center for the Built Environment. CBE Thermal Comfort Tool. Available online: https://cbe.berkeley.edu/project/thermal-comfort-tool/ (accessed on 10 July 2019).
- Schiavon, S.; Hoyt, T.; Piccioli, A.L. Web application for thermal comfort visualization and calculation according to ASHRAE Standard 55. Build. Simul. 2014, 7, 321–334. [Google Scholar] [CrossRef]
- Lin, Z.; Deng, S. A study on the thermal comfort in sleeping environments in the subtropics developing a thermal comfort model for sleeping environments. Build. Environ. 2008, 43, 70–81. [Google Scholar] [CrossRef]
- Chaudhuri1, T.; Soh, Y.C.; Bose, S.; Xie, L.; Li, H. On assuming mean radiant temperature equal to air temperature during PMV-based thermal comfort study in air-conditioned buildings. In Proceedings of the IECON 2016—42nd Annual Conference of the IEEE Industrial Electronics Society, Florence, Italy, 24–27 December 2016. [Google Scholar]
- Matzarakis, A.; Amelung, B. Physiological equivalent temperature as indicator for impacts of climate change on thermal comfort of humans, Seasonal Forecasts. Clim. Chang. Hum. Health 2008, 30, 161–172. [Google Scholar]
- Kantor, N.; Unger, J. The most problematic variable in the course of human biometeorological comfort assessment—The mean radiant temperature. Cent. Eur. J. Geosci. 2011, 3, 90–100. [Google Scholar] [CrossRef]
- Olesen, B.; Parsons, K. Introduction to thermal comfort standards and to the proposed new version of EN ISO 7730. Energy Build. 2002, 34, 537–548. [Google Scholar] [CrossRef]
- Walikewitz, N.; Jnicke, B.; Langner, M.; Meier, F.; Endlicher, W. The difference between the mean radiant temperature and the air temperature within indoor environments: A case study during summer conditions. Build. Environ. 2015, 84, 151–161. [Google Scholar] [CrossRef]
- Mayer, H.; Holst, J.; Dostal, P.; Imbery, F.; Schindler, D. Human thermal comfort in summer within an urban street canyon in central Europe. Meteorol. Z. 2008, 17, 241–250. [Google Scholar] [CrossRef]


| Floor area | 59 m2 |
| Structure type | Reinforced concrete structure |
| Load-bearing wall system | |
| Floor | Test unit on the 1st floor (Total 5 stories slab-on-grade) |
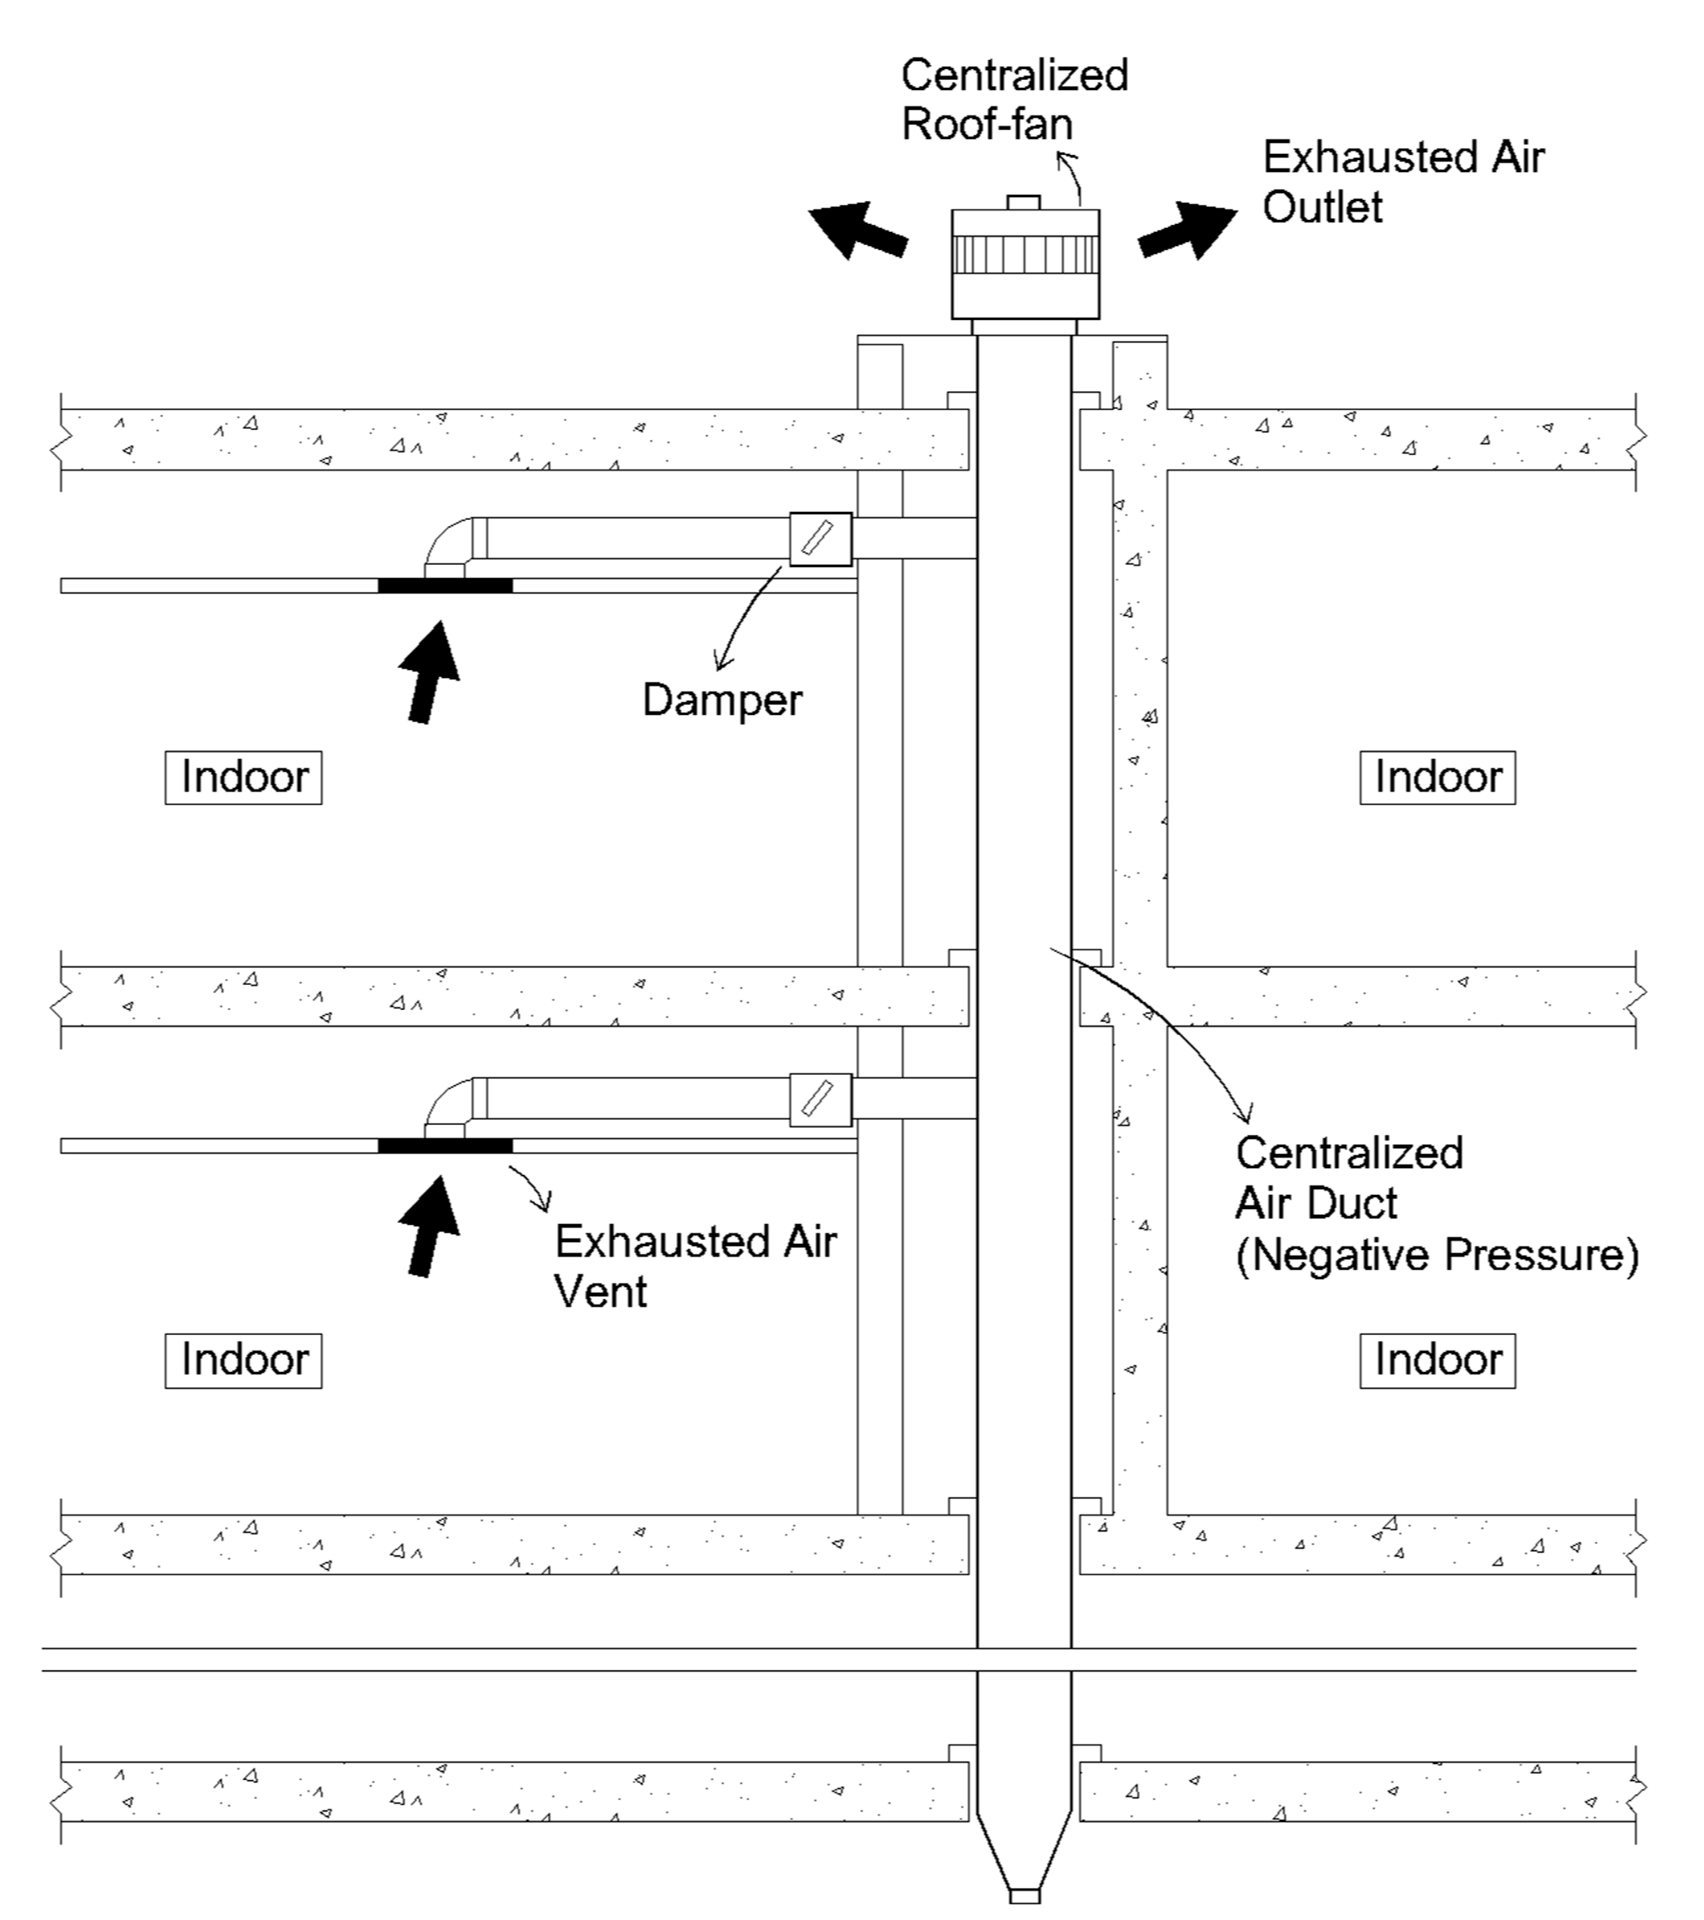
| Exhaust ventilation type | Centralized exhaust ventilation connected to a roof fan |
| Flow rate setup | Bath 1–80 m3/h |
| Bath 2–80 m3/h |
| Zone | Area (m2) | Volume (m3) |
|---|---|---|
| Living room | 21.98 | 51.86 |
| Bedroom 1 | 10.32 | 24.36 |
| Bedroom 2 | 11.26 | 26.57 |
| Bedroom 3 | 9.01 | 21.27 |
| Bath of Bedroom 1 | 2.85 | 6.27 |
| Bath of Living room | 3.27 | 7.19 |
| Kitchen | 8.82 | 20.82 |
| Laundry room | 2.03 | 5.81 |
| Foyer | 3.02 | 7.22 |
| Equipment | Specification |
|---|---|
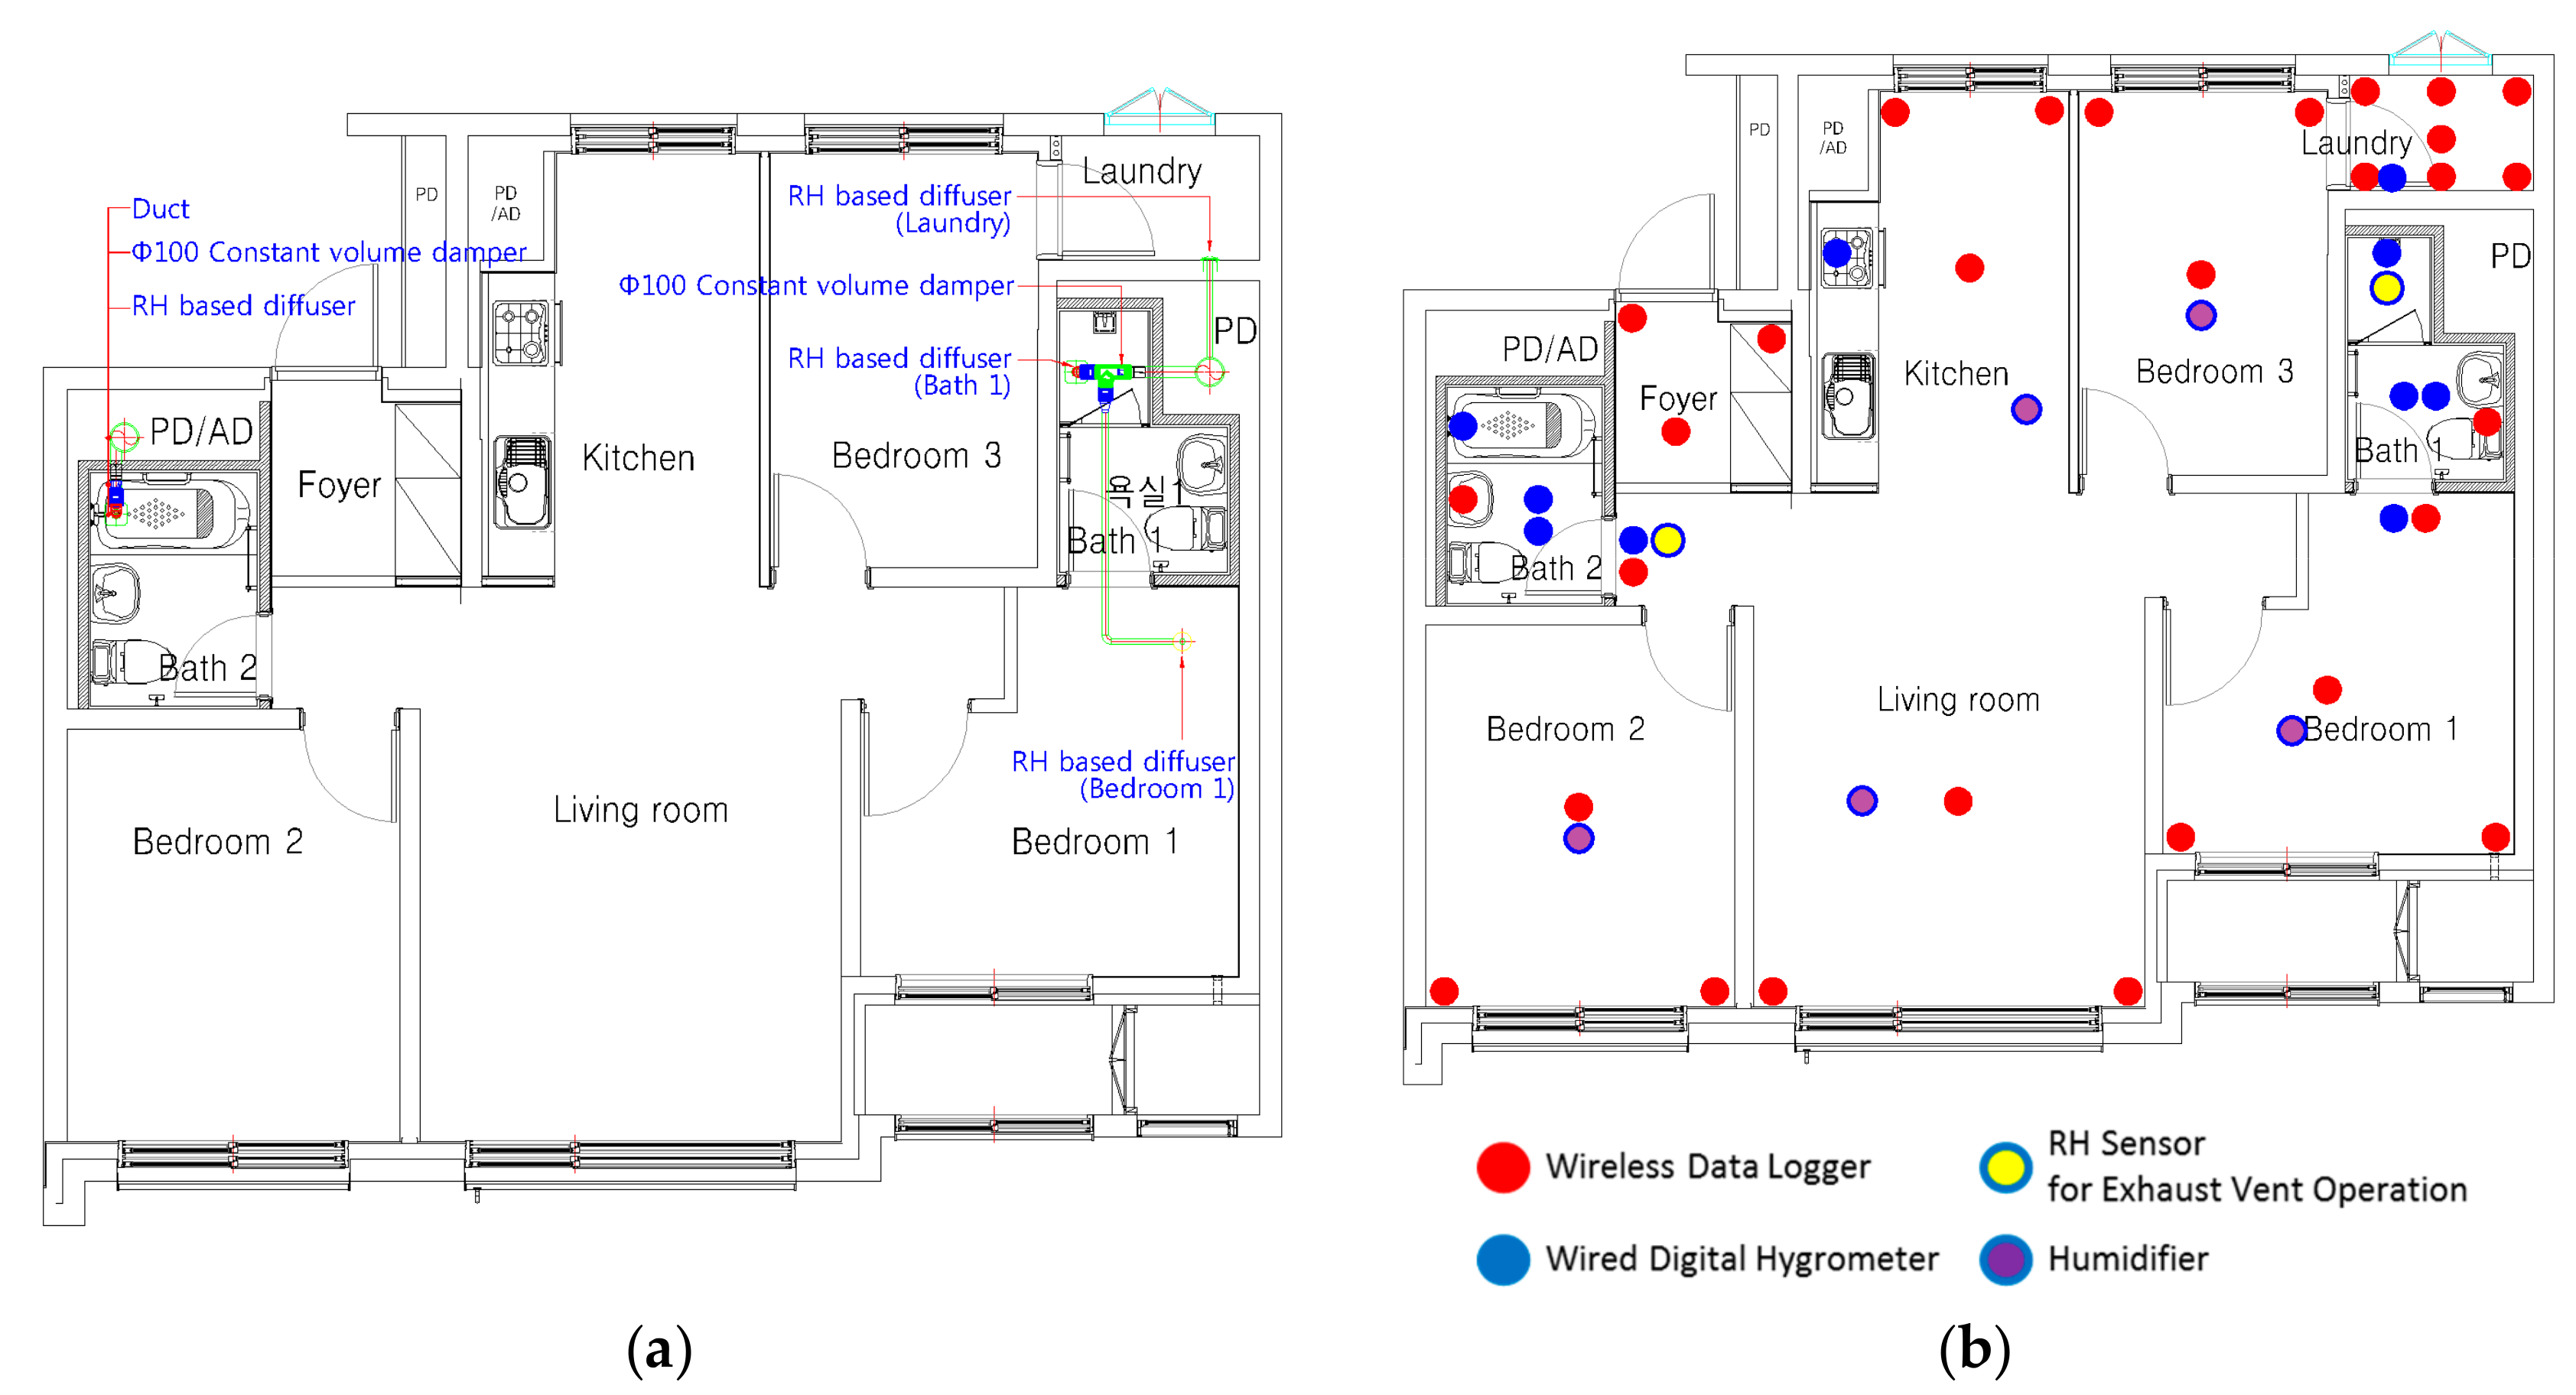
| Wireless 2-channel data logger | Range: −20 °C to +60 °C/0% RH to 95% RH |
| Resolution: 0.01 °C/0.1% RH | |
| Accuracy: ± 0.5 °C/±2.0% RH typical @ 25 °C | |
| Wired digital hygrometer | Range: −40 °C to +120°C/0 to 100% RH |
| Resolution: 0.01 °C/0.05% RH | |
| Accuracy: ± 0.4 °C/± 3.0% RH |
| Case | Target Zone | Settings |
|---|---|---|
| Case 1 | Bedroom 1 and bath 1 | Spray hot water in the shower booth for 15 min (Hot water temperature 43.0 °C) |
| Open shower booth door and bathroom-1 door after the shower | ||
| Monitor humidity changes based on exhaust vent operation | ||
| Flow rate of exhaust vent: Bath 1—60 CMH/Bedroom 1—20 CHM | ||
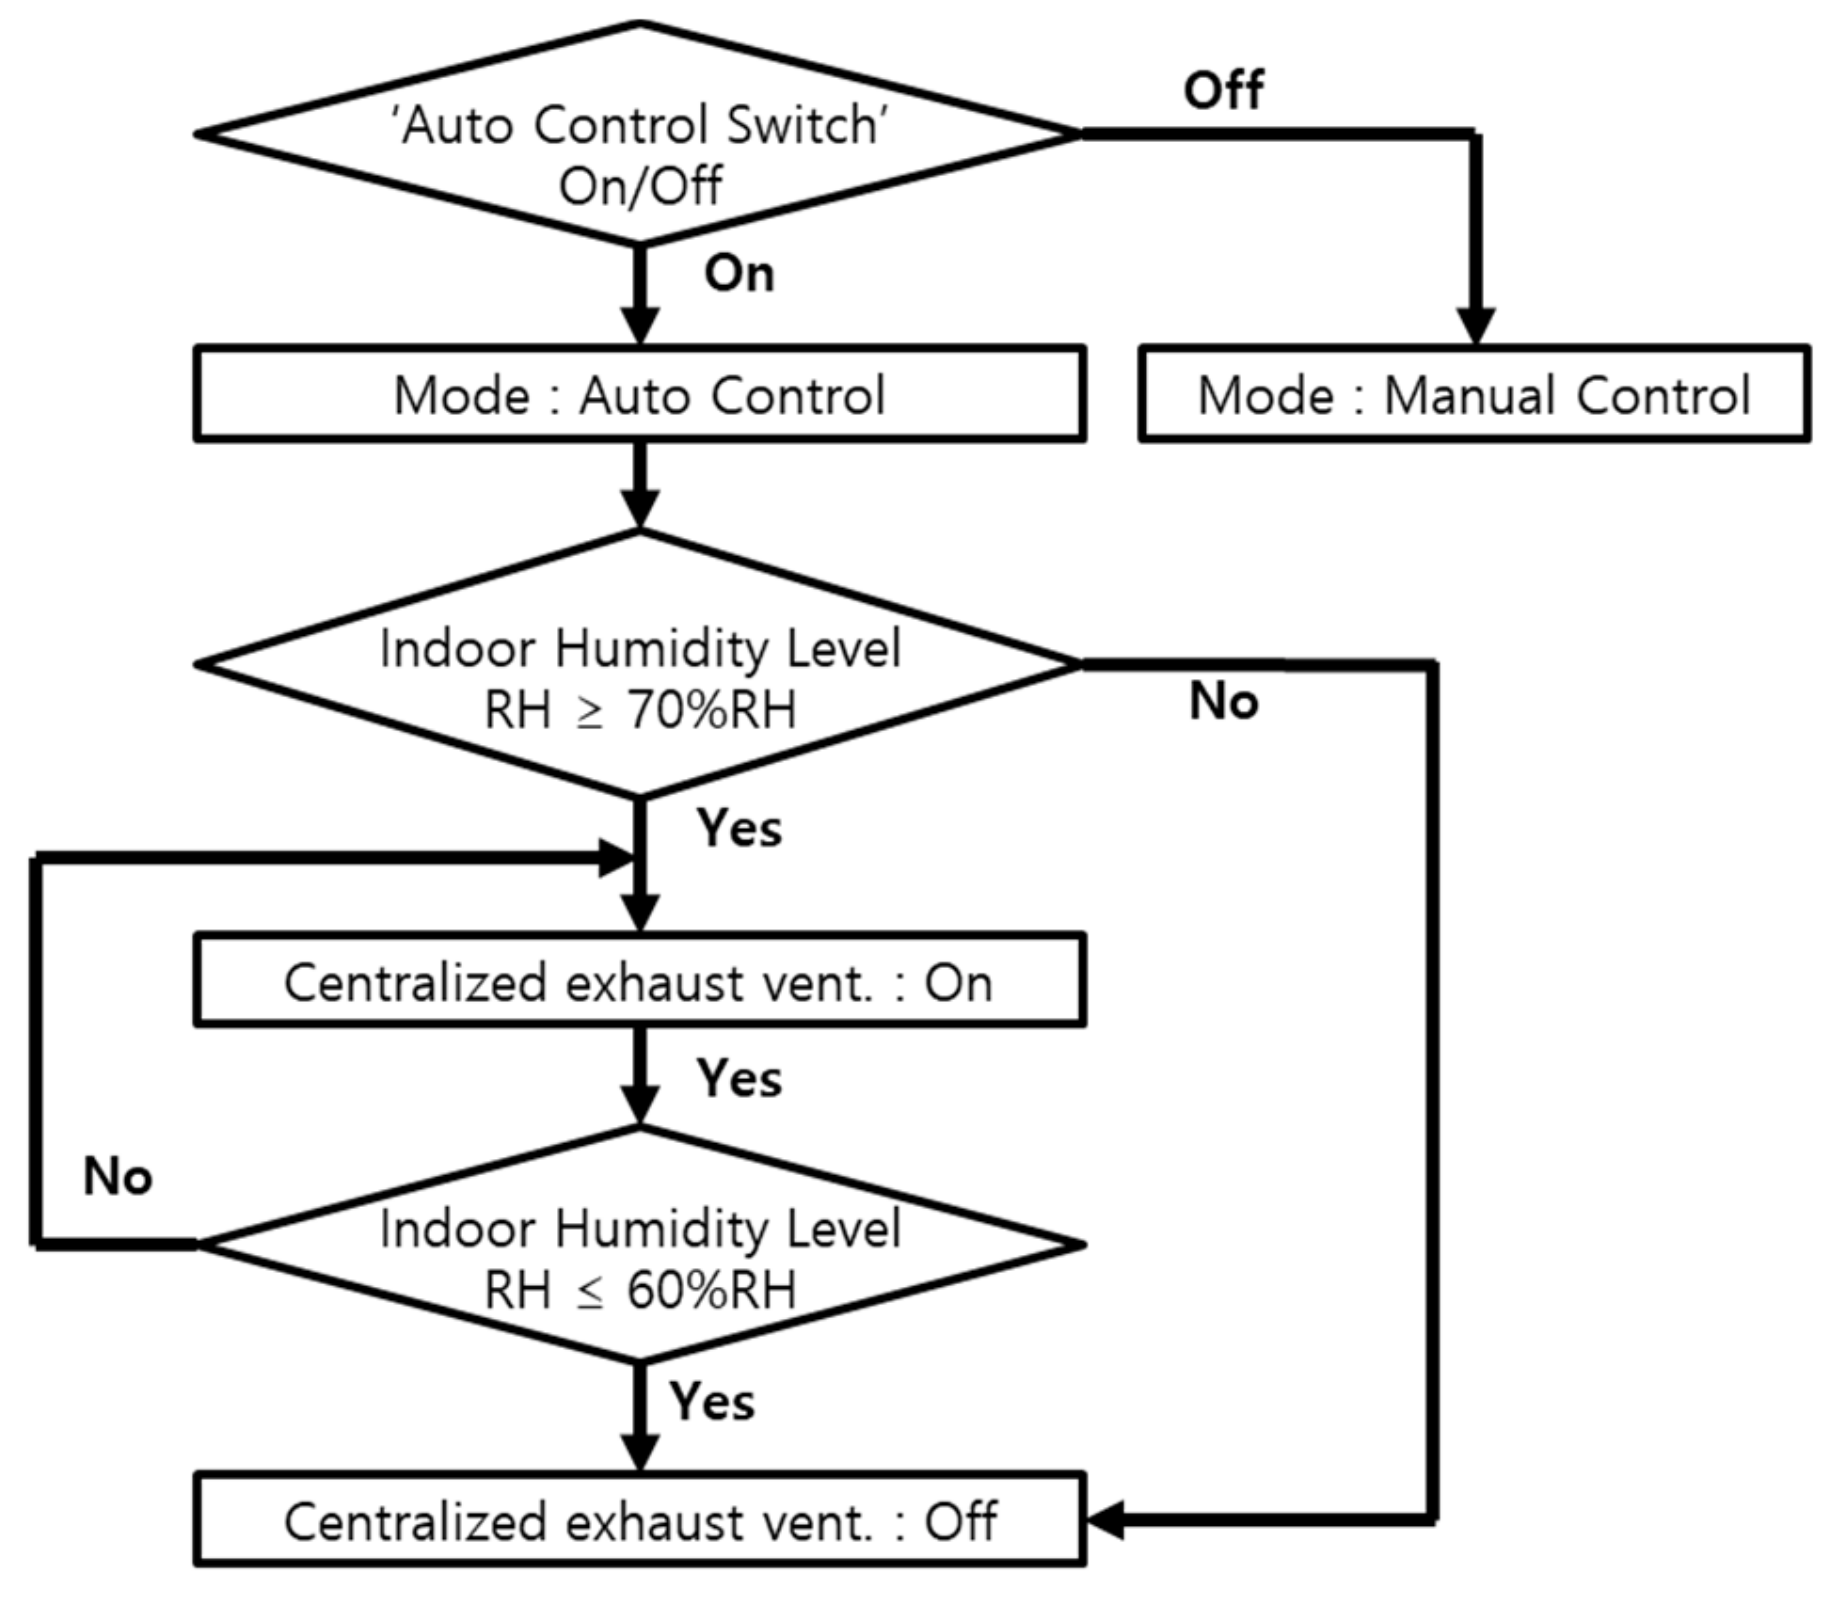
| Exhaust vent operation: On RH ≥70%RH | ||
| Setpoint Temperature/humidity level: 23 °C/60% RH | ||
| Case 2 | Living room Kitchen Foyer | Boil 1 L of tap-water for 30 min |
| Monitor humidity changes based on exhaust vent operation | ||
| Flow rate of exhaust vent: Bath 2—80 CMH | ||
| Exhaust vent operation: On RH ≥70% RH | ||
| Setpoint Temperature/humidity level: 23 °C/60% RH |
| Case 1-1 | Case 1-2 | Case 2-1 | Case 2-2 | |
|---|---|---|---|---|
| Exhaust Vent Operation | Off | On | Off | On |
| Target Zone | Activity | Case | Outside Air Measured Temperature | Outside Air Measured Relative Humidity | Outside Air Calculated Humidity Ratio |
|---|---|---|---|---|---|
| Bedroom 1 and bath 1 | Shower in Bath 1 | Case 1-1 | 5.3 °C | 67% RH | 0.00369 kg/kg |
| Case 1-2 | 10.4 °C | 54% RH | 0.00421 kg/kg | ||
| Living room Kitchen Foyer | Cook in Kitchen | Case 2-1 | 9.4 °C | 27% RH | 0.00203 kg/kg |
| Case 2-2 | 8.5 °C | 30% RH | 0.00205 kg/kg |
| Parameter | Activity | Input Value |
|---|---|---|
| Metabolic Rate | Standing, relaxed | Met = 1.2 |
| Clothing Insulation value | Typical winter indoor clothing | Clo = 1.0 |
| Indoor Air Speed | No local air speed control | V = 0.1 m/s |
| Operative Temperature () | ||
| MRT: Mean radiant temperature [°C] | ||
| : Indoor air temperature [°C] |
| PPD | PMV Range |
|---|---|
| <10 | −0.5 < PMV < +0.5 |
| Target Zone | Results |
|---|---|
| Bedroom 1 and Bath 1 |
|
| Living room Kitchen Bedroom 1, 2, 3 |
|
© 2019 by the authors. Licensee MDPI, Basel, Switzerland. This article is an open access article distributed under the terms and conditions of the Creative Commons Attribution (CC BY) license (http://creativecommons.org/licenses/by/4.0/).
Share and Cite
Kwag, B.C.; Park, J.; Kim, S.; Kim, G.T. Evaluation of Effects of the Humidity Level-Based Auto-Controlled Centralized Exhaust Ventilation Systems on Thermal Comfort of Multi-Family Residential Buildings in South Korea. Sustainability 2019, 11, 4791. https://doi.org/10.3390/su11174791
Kwag BC, Park J, Kim S, Kim GT. Evaluation of Effects of the Humidity Level-Based Auto-Controlled Centralized Exhaust Ventilation Systems on Thermal Comfort of Multi-Family Residential Buildings in South Korea. Sustainability. 2019; 11(17):4791. https://doi.org/10.3390/su11174791
Chicago/Turabian StyleKwag, Byung Chang, Jungha Park, Seongyong Kim, and Gil Tae Kim. 2019. "Evaluation of Effects of the Humidity Level-Based Auto-Controlled Centralized Exhaust Ventilation Systems on Thermal Comfort of Multi-Family Residential Buildings in South Korea" Sustainability 11, no. 17: 4791. https://doi.org/10.3390/su11174791
APA StyleKwag, B. C., Park, J., Kim, S., & Kim, G. T. (2019). Evaluation of Effects of the Humidity Level-Based Auto-Controlled Centralized Exhaust Ventilation Systems on Thermal Comfort of Multi-Family Residential Buildings in South Korea. Sustainability, 11(17), 4791. https://doi.org/10.3390/su11174791