1. Introduction
Global energy demand in 2035 is expected to have increased by one third in relation to current consumption rates [
1]. In the industrial sector, the construction industry has been responsible for 45% of total energy consumption since the start of the 21st century, as well as causing 50% of European air contamination [
2]. The construction industry has been classified as one of the major causes of environmental damage worldwide, due to the use of nonrenewable resources, soil damage and the huge amounts of energy needed during its life cycle.
Housing, during its full life cycle, is responsible for 40% of the energy consumption and 36% of the greenhouse gas (GHG) emissions in the European Union (EU) [
3]. Consequently, priority has been given to reducing energy consumption and GHG emissions by 30% and 40% respectively, in terms of the 1990 levels, by 2030 [
4]; a second phase aims for reductions of 80% by 2050 [
5]. In addition, the EU also forecasts that by 2030 80% of the population will be living in preexistent housing, with less construction and more rehabilitation, which will lead to an increase of 1% in energy consumption due to the need for upgrading [
4]. In specific terms, housing (operation phase) is responsible for 27% of energy consumption in the EU, generating 225 billion Euros and 630 million tons of CO
2 [
6]; more than half of this consumption is due to heating and refrigeration [
7].
Therefore, the objective of an energy policy for housing is to reduce consumption without affecting comfort, health, or productivity; the acceptable solutions should be indicated in the construction codes as minimum requirements for compliance. This result may be achieved through efficient architectural design, promoting CO
2 reductions and low primary energy consumption or energy cost. Finally, the Energy Efficiency Certificate (EEC) of a dwelling is the way to show the degree of classification or success attained, taking into account its particular characteristics as well as of the environs in which it is located. It may also be considered as a sign of the construction industry’s commitment regarding the global environmental crisis [
8].
The member states of the EU have set up the EEC in accordance with their own national priorities and their own timescale, and consequently there is no uniformity in the requirements [
4,
9].
The lack of a reference framework impedes the creation of a common housing market, causing uncertainty at a professional level among assessors and making the EEC themselves seem implausible; there is an evident need for a rapid harmonization of the EEC in order to allow their equivalence.
In the EU, the EEC has evolved from Directive 2002/91/EC, which establishes the requirements for reducing the CO
2 (Kyoto Protocol), dealing not only with insulation, as in the pre-Kyoto era [
10], but also with the need for a methodology to evaluate the energy performance of housing [
2], including the obligatory minimum amounts of renewable energy that new or existing buildings (major renovation) must comply with, as well as the use of efficient climate control systems [
5,
10]. Similarly, if energy saving is to be successful it must involve the consumers, whose awareness and commitment can only be engendered through a campaign of public information and education [
11].
In the particular case of Spain, the EEC began with the Royal Decree 47/2007, which initially made regional comparisons difficult as they tended to act independently of each other [
12]. This was corrected by Royal Decree 235/2013 (defining housing types for the different climatic regions of the country and homogenizing certification), and was extended to existing buildings, becoming obligatory in housing for rent or sale (implementing Directive 2010/32/EU [
11]) with a validity of 10 years. Among its most important defining parameters are the calculation method, the number of occupants per dwelling and its climate zone [
4]; it is currently used in commercial transactions of buying, selling or renting a building in order to know its environmental impact and energy performance. Apart from the EEC, legislation such as the “Regulación para Instalaciones Térmicas de Edificios” (RITE) (Regulation of Thermal Installations in Buildings) [
13], or the rules of the “Código Técnico de Edificación” (Technical Building Code) (CTE) [
14] have allowed a generalized and comparative EEC to be established throughout the country.
In other EU countries, such as Italy, the EEC is more restrictive than in Spain due to the regulating parameters [
10], showing the lack of homologation among certificates; only the use of equal norms in both countries can solve this. Similarly, Sweden is another case evidencing the lack of agreement among the EU countries, as it is the only one that obliges all heating and electricity to come from renewable energy sources [
4]. Finally, Portugal, which established its EEC procedure in 2006 and implementation in 2009, has the peculiarity that its methodology is based specifically on three foundations: the thermal cladding, heating and air-conditioning systems, and ventilation of the building [
15].
Observing other EEC evaluation systems on an international level, Latin American countries such as Brazil have pioneered their implementation (Ley 10.295 [
1]), aiming to reduce total housing electricity consumption (initially 50% of the national total) from 2001 onwards. The Technical Quality Regulation for energy efficiency in residential buildings (RTQ-R) [
11] evaluates exclusively the energy consumption of lighting and air-conditioning, as well as the effect of cladding; it uses two methods of calculation—simulation and prescription. The RQT-R, in the 2010 report [
16], shows the previous inefficiency of the Regulations in terms of significantly reducing the country’s energy consumption.
In the case of Chile, the emergence of sustainable or energy assessment certifications has seen its niche of development in the tertiary sector by not having a mandatory regulatory framework, thus defering to the residential sector. LEED certification, for example, has been used in Chile since 2005, with 71 certified projects and one housing complex [
17], but due to the high costs involved it has not become massive in this type of construction. Other international energy certifications or qualifications that have tried to enter Chile are the PassivHaus rating and the DGNB certification; however, there is currently only one tertiary building in Chile qualified with PassivHaus (BCI Bank, Vitacura branch).
In 2014, the Ministry of Housing and Urban Planning created the Sustainable Building Code for Housing [
18], which will aim to develop and adopt high technical standards of sustainability in energy, water, waste, health and well-being as central thematic axes. A year earlier, in 2013, the EEC called the Energy Housing Rating System (SCEV) entered into force, which aims to reduce emissions of new buildings (by 40%, which equates to reducing 8% of the country’s total); whereas, in existing homes, the overall reduction could mean up to 20% less [
19].
Since its implementation in 2017, the SCEV has evaluated only 5.5% of private homes (594 homes); and, therefore, if you consider your real estate stock for the same period (between 70,500 and 101,300 dwellings) [
20], any action that allows you to have a calibrated EEC will favor and ensure a correct deployment of it effectively.
Considering the technical and sociocultural reality of each country, the current processes in Chile are not the same as those in Spain. Extrapolating them to the technical aspects of the norms, the differences between both systems are representative of the development gap that Chile must overcome in order to comply more effectively with the requirements of the qualification tool.
Against this background, the research proposes a cross-check of the EUBs, through the evaluation of a case study for new homes, located in the city of Santiago de Chile. In purchasing geographical areas, methodologies used, and current degrees of implementation, it seeks to link the impending gaps between the EEC, with evidence of the results obtained from the evaluations of both systems; extrapolating conclusions that contribute to the establishment of comparative processes of the EEC between different country systems, and to help the proper incipient establishment of the EEC in a country.
2. Materials and Methods
2.1. Energy Efficiency Certification for Buildings (EEC)
The Spanish EEC is an official document, awarded by a competent professional, which includes information about the energy characteristics of building. This document is obligatory when selling or renting and has been in force since 2013, as a result of the Directive 2010/31/UE [
21].
The scale measured by the EEC is related to the emissions of CO
2 generated by each dwelling as a result of its energy consumption. It is determined on the basis of the energy qualification indices C1 and C2, where C1 corresponds to the energy efficiency of a reference dwelling that complies with the requirements of the current CTE, and C2 corresponds to the energy efficiency in terms of the 2006 norm. Both indices are subdivided into seven levels designated by letters from “A”–“G”, with “A” being the most efficient [
22], “E” corresponding to a new dwelling designed in conformity with the minimum standards set by the CTE, and “F” and “G” being assigned to existing buildings covered by previous regulations (
Table 1).
The housing CO2 emissions and energy consumption, estimated parameters that decide the certification level, are determined from the C1 and C2 indices, which compare parameters of a house under study with a pre-calibrated database; that is why the rating depends on the climatic zone in which the housing is located.
According to the Information Notice on Procedure for EEC, from 2016 the latest versions of the computer programs CERMA, CALENER, CE3, CE3X, and HULC may be considered valid tools for evaluating the energy qualification of new or existing buildings [
24]. The most widely-used of these programs have a simplified calculation methodology, with CE3 and CE3X being the most appreciated by users [
25].
CE3X (Institute for Diversification and Energy Saving: IDEA –by its acronym in Spanish–; Ministry for Ecological Transition; Secretary of State for Energy; Government of Spain; Spain) is based on the comparison of a studied building and a pre-established data base. The calculation tool considers the location of the dwelling, the surrounding characteristics and the principal equipment installed. Information is entered by default, by estimation or as pre-known; the program parameterizes these variables, comparing them with the cases in the previously mentioned database [
23].
2.2. Energy Qualification System of Housing (SCEV)
This is an instrument that evaluates the energy efficiency of a dwelling by means of an Energy Efficiency Report (EER) and an Energy Efficiency label (EEL). It was implemented as a result of the Chilean government’s commitment to reduce energy consumption and CO2 emissions, while increasing the generation of renewable non-conventional energy (RNCE).
It was introduced in 2013 and has been applied voluntarily in new buildings to qualify and evaluate projects from an objective and standardized point of view regarding their energy requirements for heating, hot water and lighting. The analysis is based on parameters such as the thermal transmittance of the building envelope, orientation of the building and the performance of the installed or incorporated RNCE equipment [
26]. It serves as a theoretical and comparative estimate, where the evaluation of the parameters considered by the instrument are compared with those of a reference dwelling, which complies with the minimum standards established by Art. 4.1.10 of the General Order of Urbanism and Construction (GOUC) [
27], the obligatory norms governing the planning, design and construction of buildings in Chile.
The SCEV sets out seven levels of energy efficiency, which are assigned according to the percentage of energy needed by the evaluated dwelling in respect to the reference building (coefficient “C”). These levels are represented by letters ranging from “A”–“G”, with “A” being the most efficient and “G” the least. The minimum standard required by the GOUC is that of “E”, with “F” and “G” being assigned to dwellings that show no saving and were built according to regulations prior to those of 2007.
The EER lays down two types of qualification for the dwellings studied: one considers the architectural aspects, considering the energy demand (EDE); the second considers the architectural aspects and the renewable energy installations incorporated, evaluating the energy consumption (ECE).
Table 2 shows the EDE qualification for the different thermal zones, according to their energy saving percentages. These thermal zones are defined according to the degrees per day of heating required [
28].
The case of
Table 3 is different, where the ECE considers only one category, regardless of the climate zone involved.
The SCEV considers two processes for obtaining a dwelling’s qualification: a dynamic simulation of the building using CCTE –by its acronym in Spanish- software: (Certification of the Thermal Bbehavior of Buildings in Chile; Ministry of Housing and Urbanism; Government of Chile; Chile [
29]; and the simplified calculation tool (CT) (used in this study). About 90% of current evaluations use this tool [
30], which has two versions: an Excel spreadsheet with universal access, and a website exclusively for accredited evaluators, by which the EER is generated.
Currently a new version is being considered for use in the SCEV, with a calculation engine that combines dynamic simulation with the simplified model. However, for the current study the simplified version is used.
Starting with the role that the material effects of a project—the installations, envelope configuration, location and orientation—play in its energy performance (expressed in the EDE, ECE and the CO2 emissions), an attempt was made to identify the common characteristics of each certification system, establishing the comparison criteria and proposing possible reciprocal improvements. Using the systems proposed in this work, the energy qualification of a group of houses located in the Metropolitan region of Chile was evaluated.
2.3. Choice of Samples
Publicly-funded social projects account for 81.9% of the evaluations carried out by SCEV in 2017, with apartments being the most frequent (38.8%) [
31]. In the same year, in accordance with the building licenses awarded, the Metropolitan region (encompassing Santiago, the capital of Chile) had been granted the most licenses (3302), equivalent to 22.19% of the national total [
32]. Therefore, in this work the study sample is composed of 20 public housing apartments in the city of Santiago de Chile.
2.4. Project Characteristics
The city of Santiago (latitude −33°28 S [
33]) is in the central region of the country, lying 567 m above sea level and 100 km from the coast (
Figure 1a). Its climatic condition, according to Köppen, is Csb [
34], a warm temperate climate with winter rains. Average temperatures range from 20.9 °C in January to 8.3 °C in June (average thermal oscillation 14 °C); relative humidity varies from 57% in January to 84% in June; it annual average radiation is 4.8 kWh/m
2 [
35] and its degrees-day heating requirement is between 750 and 1000 on base 15 [
28].
The samples used in the study are apartments located in three groups of social housing. Each apartment has an area of 56.97 m
2, with living-dining room, bedrooms, kitchen, bathroom, utility room, and terrace (
Figure 1b1). There are 18 reinforced concrete buildings, each one 13.65 m high and composed of five floors (
Figure 1b2) with four apartments per floor
In order to identify the dwellings studied, the nomenclature “number-xxx-letter” was proposed, defined for a location in Santiago de Chile. The “number” refers to the floor (1–5), “xxx” refers to the orientation of the main façade (“int” for E, “ext” for W) and, finally, “letter” refers to the orientation of the secondary façade (“A” for N or “B” for S); for example, 5-int-A represents an apartment on the fifth floor, with its main façade looking east and its secondary facing north.
2.5. Materials and Installations
The project’s envelope, or constructive system, is mainly composed of reinforced concrete (walls, floors and street-level paving). The exterior walls are of reinforced concrete with expanded polystyrene insulation and plasterboard; the thermal partition walls are of plasterboard, mineral wool insulation, and fiber cement sheeting. The windows have aluminum frames with panes of monolithic glass. There is a false ceiling on the fifth floor, made of double plasterboard sheeting and rigid glass fiber insulation panels; the roof has a timber framework and aluminum sheeting.
Table 4 shows the characteristics of the constructive elements of the opaque envelope of the dwellings; the values of thermal transmittance were determined according to the Norms of Thermal Conditioning [
36]. More details of characteristics of the house, from what is required by both tools can be found in
Table A1 (
Appendix A).
Regarding the installations, the selected samples do not include heating systems. Hot water is provided by a 7l boiler with natural ventilation and a nominal potency of 12.3 kW. Finally, there are no renewable energy sources, such as solar thermal collectors.
2.6. Inputting Information to CE3X
The process of inputting the technical information includes specifying the information for characterizing the dwelling (location, year of construction and regulating norms, among others); then comes the selection of the project’s climate zone (in accordance with the CTE), the estimates of hot water demand (according to number of inhabitants), and the ventilation of the studied dwelling.
As this study is carrying out a comparison of both certification systems, keeping the studied samples (20 dwellings in Santiago de Chile) as a controlled variable, it was necessary to establish an equivalent Spanish climatic zone. For this purpose, differentiating parameters (DP) contained in the Spanish EEC have been considered as a community and locality, linked to aspects such as height above sea level (HASL) and proximity to the sea coast (PSC); and the climatic zone, linked to temperature (T), radiation (R), precipitation (P), etc. Based on these parameters, a locality was determined to allow for an comparable comparison: the DPs of the location of the houses were determined; a multi-criteria matrix with similar available locations in the EEC was studied, the city with a higher homologation of the city was selected from the alternatives that are more homologated to the DPs identified in Santiago de Chile. As a result, was obtained the city of Cuenca, Spain, whose climatic and geographical parameters are compared to those of Santiago de Chile in
Table 5.
This equitable comparison should be used from DPs, if data from this research are used to contrast it with other studies.
As the study assumes that the dwellings are located in Cuenca— through the use of CE3X—the climatic zoning established by the CTE in this case corresponds to a qualification of D2.
The estimation of hot water requirements was carried out according to the CTE DB HE 4 process [
14], with demand being calculated for lower temperatures than those required in the houses (for boiler use at 38°C); the result is a hot water demand of 70.99 L/day. In turn, the ventilation was estimated according to the specifications of CTE DB HS3 [
14], which in this case resulted in 0.99 renovations/h. Characterization of the thermal envelope was carried out using known values, according to the data available to the Project.
Finally, CE3X offers the chance, once the dwelling has been classified, to simulate technical improvements in the constructive systems, and to gauge the economic viability of these options with a view to improving the certified classification if they are carried out, although this cannot be done in the Chilean case.
2.7. Inputting Information to the SCEV Calculation Tool
In the case of the SCEV, using the architectural information contained in the blueprints (measurements, geometry, etc.), the previously presented technical data (transmittance, constructive elements, etc.) and applying the geographical aspects (orientation, altitude, geolocation, climatic zone, etc.), and material characteristics it is possible to complement the information needed by the computer tool. Finally, aspects such as the access to natural light (associated with the effects on the windows of obstacles both near and distant, such as other buildings or natural elements, such as trees) are determined from the information provided in the blueprints [
26].
The comparison of both certifications is carried out by analyzing the similarities and differences established with respect to the entrance parameters, the modeling, and the final report of both calculation tools used. Similarly, a comparison is made of the evaluated demand-consumption of energy and CO2 emissions. This leads to an interpretation of the results according to the context of each country.
3. Results
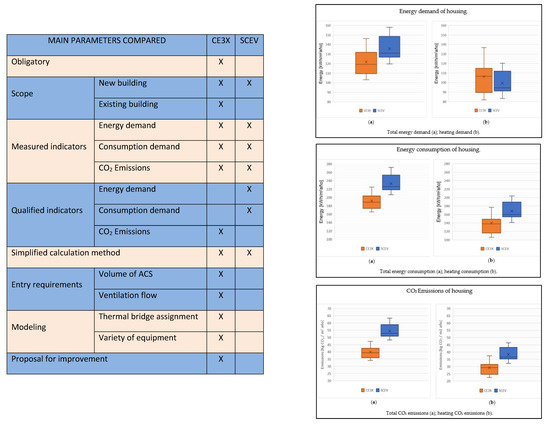
A comparison with quantitative and qualitative variables was established when both energy evaluation systems were compared in buildings. The qualitative variables are related to the input, modeling and output parameters of each HC, and to outline them the Spanish parameters are defined as the total to be obtained (as a reference), being represented in each of the graph vertices. Similarly, the quantitative variables are shown by box plot comparisons regarding the values of energy demand, consumption and CO2 emissions according to each HC.
3.1. General Project Information
The information needed by both HC (CE3X and SCEV) to make the simulations work differs; as can be seen in
Figure 2, the CE3X tool requires inputting more relevant parameters to function, whereas the SCEV only uses parameters common to the climatic zone, building type, and size of the studied dwelling. This shows that these three parameters are decisive in the simulation process, as well as demonstrating that the CE3X system could be considered as more rigorous and closer in its simulation, as it considers the wall mass, the use of ACS and the ventilation conditions. The reference to the applied norm also allows the evaluative criteria of the building to be adjusted in terms of the construction year, thereby preventing unfair comparisons with older constructive systems.
3.2. Modeling the Project
Despite the different information introduced to both HC, the parameters characterizing the thermal envelopes are eventually comparable (
Figure 3a); the differences lie only in the modeling of thermal bridges by CE3X—an important energetic event for constructive systems that integrate different materials and properties—which, in the Chilean case, is considered by default.
It can be seen from the technology available in the local ambit and the technical study of each HC that there are significant differences in the installations available (
Figure 3b); the SCEV only considers heating and ACS systems, while CE3X has a mixture which also includes refrigeration. This shows the level of access to and use of technology that can be used in both ambits of the study in Spain.
Regarding the modeling of the existing installations (
Figure 3c), the SCEV requires less information input, mainly the cover demand and boiler insulation needs; both parameters are very useful for modeling and optimizing its use.
The case of the ERNC (
Figure 3d) is different to those previously described, as the behavior of the comparative radar differs with regard to the distinct requirements of each tool. While the Spanish tool focuses on the cover demand and the recovery by cogeneration, the SCEV emphasizes the characteristics and performance of the collector. This shows that CE3X establishes the need and optimizes the resources, while the SCEV analyzes and evaluates the system.
3.3. Energy Evaluation Report (EER)
Despite coinciding in the granting of a qualification for energy demand and consumption, the CE3X also considers a qualification for CO
2 emissions (
Figure 4). This is noteworthy as the qualifications obtained from EDE and ECE—to obtain a correct comparable interpretation—should be related to the origin of the energy production in each country (energy mix), as this may come from several sources with varying environmental impacts (hydroelectric, thermoelectric, geothermal, nuclear, etc.); meanwhile, qualifying the CO
2 emissions allows for the proper comparison of the different evaluation systems, as well as allowing the environmental effects to be calculated on a global level.
Finally, the CE3X also differs from the SCEV by proposing technical improvements to the constructive system, quantifying the costs involved, obtaining the energy evaluation indicators for the new configuration and establishing the impact these improvements will ultimately have on the labelling.
3.4. Energy Efficiency Label (EEL)
Quantification of the energy labelling indicators differs with regard to the geographical zone and the HC used, the values varying according to their respective supply of heating, cooling, lighting or ACS.
In the case of energy demand (
Figure 5a), there are differences between the total requirements and those of heating (
Figure 5b), as well as between the Spanish and Chilean cases. Although they seemed to be similar, the fact is that heating demand showed a more heterogeneous distribution with CE3X, while the data from the SCEV was more widely spread. Similarly, although CE3X shows lower asymmetry, the SCEV clearly shows higher asymmetry; this is reflected in the fact that average heating demand is greater with CE3X (106 kWh/m
2year) than with SCEV (99 kWh/m
2year).
The distribution of data is similar in both cases for total required demand, while the asymmetry of CE3X changes in regard to heating, being higher. In this context, the data average in this case is higher for the SCEV (136 kWh/m2/year) than for CE3X (122 kWh/m2/year).
The difference between the total demand and that of heating, as well as the variation in the data between the heating and total demand in the CE3X, is related to the systems considered by each tool in calculating the requirement. While total demand in the SCEV considers the demand for heating, lighting and ACS, in the CE3X it depends on the heating and refrigeration demand. This explains their difference; demand for refrigeration varies according to the apartment analyzed, while demand for ACS is constant and demand for lighting is marginal. Thus, while the difference between total demand and that of heating is 16 kWh/m2/year in CE3X, in the case of SCEV it is 37 kWh/m2/year.
Regarding the energy consumption of the studied dwellings (
Figure 6a) both HC show similar dispersion in their results, being noticeably greater in the case of SCEV. Similarly, while the data of the SCEV show clear higher symmetry, the CE3X varies from lower asymmetry for heating consumption to symmetric behavior for the total consumption required (
Figure 6b).
The difference between the total required consumption and the heating consumption of the dwellings studied shows the same trend in both tools, with higher consumption in the SCEV. While in this case there is a difference of 65 kWh/m2/year, for the CE3X this value is reduced to 51 kWh/m2/year.
The total consumption required considers heating, ACS and refrigeration, in the case of CE3X, while the SCEV depends on heating, ACS and lighting consumption. The low variability of the data, in comparison with the case of demand, is because in this case both tools consider ACS consumption, constant for all the dwellings; therefore, the difference lies in the amount of lighting consumption with regard to that of refrigeration.
Additionally, the variation in the asymmetry for CE3X may be directly related to the efficiency and versatility of the equipment installed, which performs better than in the Chilean case.
Regarding the CO
2 emissions (
Figure 7), the trend is evidently for the results of the SCEV to be bigger than those of the CE3X. Additionally, the difference between the results of both tools is greater with respect to the total emissions (
Figure 7a) than for those of heating (
Figure 7b).
The spread of the results is similar in both situations and for both tools. While the SCEV maintains an upper symmetry in both situations, in the case of the CE3X it varies from a lower asymmetry for heating emissions to a symmetric behavior for the total emissions.
The difference between the total emissions and those of heating is 11 kgCO2/m2/year for CE3X, lower than the 16 kgCO2/m2/year shown in SCEV. When both systems are compared, the difference in terms of heating emissions is seen to be 9 kgCO2/m2year, while this difference grows to 14 kgCO2/m2/year in the case of total emissions.
4. Discussion
Both certification systems arose from the need of both Chile and Spain to comply with international obligations. In their real-world application, despite both being aimed at reducing the CO
2 emissions of the housing stock, the indicators that they use cannot be considered equivalent; while the EEC has CO
2 emissions as its prevalent indicator [
2], the SCEV considers the percentage of savings in energy demand and consumption [
26]; although these indicators are directly related, the energy saving does not establish the amount of CO
2 contamination generated by the dwellings studied.
Similarly, the specific requirement of having a study dwelling in each thermal zone means that energy requirements tend to vary according to their location; depending on the certification system used [
23], this can lead to different environmental scenarios. While this difference occurs in the CO
2 emission levels in the studied samples (and their qualification) in the EEC, it is not present in the SCEV, as the energy saving provides no evidence of the amount of emissions generated by the dwellings.
Despite their similar aims, the application of both systems is different. In Spain, as in Europe in general, the EEL is required in order to rent, buy or sell any dwelling. In Chile, however, it is optional, with the Government being the main promotor through the evaluation of social housing. Similarly, after six years of implementation in new housing, Spain started to evaluate existing housing (an important part of its current and future stock). Considering the similarities in the implementation period of the qualification systems and the time passed since their adoption in both countries it is to be hoped, at least in the Chilean case, that energy policy will be directed towards complying with the agreements mentioned and the existing housing will be incorporated into the SCEV.
Regarding the systems’ versatility, the SCEV is better, as it allows evaluation of projects at different stages in their development: projects in the design or execution phase can apply for pre-qualification, with finalized projects opting for qualification.
Looking at the differences in the results of energy demand, consumption and CO2 emissions, it’s important to remember that the HC evaluations were based on a standardization of the conditions that the group of buildings was originally exposed to. The input of this information was the first element to introduce divergences to the comparison.
In addition, parameters such as the envelope characteristics, installations, efficient use of the systems, the demand satisfied and the evaluation of the ERNC, etc., demonstrate the differences between the CE3X and the SCEV. In the Spanish system the incorporation of parameters, such as the ACS calculation, ventilation, thermal bridges and the option of remodeling occasional mixed energy systems are important for comparison as they are not considered in the Chilean system.
The EER should ideally present a structure that lets the client understand and interpret the information in it, associating the indicators provided with the parameters of the studied dwelling. Similarly, CE3X generates added value by introducing improvements to the project and analyzing their impact on efficiency and implementation cost. There is no further comparison with the SCEV, as this only awards qualifications for EDE and ECE.
Based on the Spanish experience, the Chilean system should consider future improvements such as the inclusion (according to the design or norms) of ventilation and ACS demand in the characteristics of the building, and not just a standardized or default value. Thermal bridges should be included in the building design phase, while the cooling variable should be considered in the evaluation, in order to achieve better characterization of the indicators according to their location. The range of possibilities for energy equipment should be diversified. A sensitivity analysis should be made to evaluate potential improvements in the envelope and its qualification; this information should be available to the client in the report emitted by the relevant body or professional.
In both countries the energy efficiency label cannot have the desired effect unless it is accompanied by a transversal education campaign throughout society. The owner should know that certification is not merely “by order”, and the client is aware of the investment needed to buy a dwelling that is more efficient in terms of energy saving. Therefore, it is necessary to accompany certification with an educational plan to make people aware [
11], turning them into active promoters of and participants in the changes needed in the housing industry.
5. Conclusions
The certifying scales that do show the energy efficiency levels, despite measuring different indicators, are analogous in both cases. They have seven levels, in which “A” is the most efficient, “E” is the minimum technical standard and “F” and “G” refer to dwellings built before the current norms were introduced [
23,
26].
Both tools can evaluate the dwellings by means of a dynamic and a simplified simulation system; in both countries researchers have shown a preference for the second (simplicity in modeling with similarities in the results obtained).
From the results obtained, energy demand, consumption and CO2 emissions are similar despite the previously mentioned differences in the information input, parameters evaluated or modeling. It shows greater requirements in the SCEV, whose results show similar data spread and trends, where the difference between the heating requirement and the total requirement is due to considering ACS (constant) and lighting. The Spanish system shows lower requirements than the Chilean, and despite a similar spread in its indicators, the distribution and trends vary according to the context.
The comparison of both qualification systems highlights their differences, in implementation, procedure, methodology and results. It is evident that the working conditions of the calculation tool are not the same in Spain as they are in Chile. If the SCEV is applied in a Spanish context there are few impediments beyond an adjustment of the conditions to ensure correct analysis by the program. However, the inverse operation shows the real differences between the tools. The EEC is not implemented in isolation, but interacts with the information available in the RITE, the CTE or the Royal Decrees. The rules and the access to information mean that there are no technical impediments to using the tool.
Chile, classified as an emerging country, does not have the same capacity for technological research or investment as Spain, a developed European Union member with stricter and more established technical standards. Similarly, the level of technicality and representation of the calculation tools in the study depends on the level of knowledge acquired by each society.


 ,
, 


