Article

Transport Infrastructure Interdependency: Metro’s Failure Propagation in the Road Transport System in Mexico City

by
Jaime Santos-Reyes
1,*,
Diego Padilla-Perez
1,2 and
Alan N Beard
3
1
Grupo de Investigación, SARACS, SEPI-ESIME, ZAC. Instituto Politécnico Nacional, 07738 Mexico City, Mexico
2
Centro de Desarrollo Aeroespacial, Instituto Politécnico Nacional, 06000 Mexico City, Mexico
3
Civil Engineering Section, Heriot-Watt University, Edinburgh EH14 4AS, Scotland, UK
*
Author to whom correspondence should be addressed.
Sustainability 2019, 11(17), 4757; https://doi.org/10.3390/su11174757
Submission received: 26 July 2019 / Revised: 28 August 2019 / Accepted: 28 August 2019 / Published: 30 August 2019
(This article belongs to the Special Issue Road Traffic Engineering and Sustainable Transportation)

Abstract

:
On Friday, 3 March 2017, at about 18:19 h, a metro track failed, prompting about 50% of Mexico City’s metro line-C to a halt. The track failure occurred at a peak hour when tens of thousands of commuters were heading to their homes. Given the interdependency among the modes of transportation in the capital city, the incident caused heavy disruption; it is believed that about 45,000 commuters were affected. A systemic safety management system (‘SSMS’) model has been used for the analysis. The results showed that: a) the model demonstrated its potential to the analysis of the transport system interdependency; it has been found that failure propagates vertically and horizontally; b) the model highlighted that failure propagation has to do with a coordination function; c) in relation to the case study, it has been found that the actions taken by the decision-makers during the emergency were less than adequate; d) the commuters traveling patterns should be considered when designing emergency plans; and, e) more generally, there is a need for the creation of a system to manage critical infrastructure protection in the context of Mexico. It is hoped that by conducting such analyses, we may gain a better understanding of the complexity of cities.

1. Introduction

Cities may be regarded as complex systems; further, they are characterized by traffic congestion. Very often, news reports related to congestion appear in the mass media, and this is particularly more acute in megacities. Moreover, traffic congestion is regarded as one of the variables that severely affects, among other, economic development in megacities [1]; for example, it is believed that traffic jams costs the city of Cairo, Egypt, an estimated USD eight billion every year, equivalent of 4 percent of the country’s economic output [2]. Also, it adversely contributes to air and environmental pollution, urban mobility, and, ultimately, the quality of life of those living in urban environments [1,3,4,5,6,7].
On the other hand, there is a growing concern on critical infrastructure interdependency [8,9,10,11,12,13,14,15]. For example, the President’s Commission on Critical Infrastructure Protection (PCCIP) report defines an infrastructure as “a network of independent, mostly privately-owned, man-made systems and processes that function collaboratively and synergistically to produce and distribute a continuous flow of essential goods and services” [8]. In essence, a failure of a critical infrastructure would have an important security, economic impact in any city or country.
Most developed countries have defined what constitutes their critical infrastructure systems [16,17,18,19]; for example, the United States has identified sixteen critical infrastructure sectors [16], and thirteen have been identified in the case of the UK [17], while Canada, on the other hand, has identified ten critical sectors [18], to mention some of them. The transportation sector is being considered as a critical infrastructure in these countries. However, the question is, what about developing countries, such as Mexico? Unfortunately, the country still lacks any governmental regulation or decree regarding critical infrastructure sectors [20,21]. For example, in [20], it has been argued the need for the creation of a specific organization in charge of critical infrastructures for the case of Mexico. Further, it has also been argued that there are about 17,000 facilities where 300 are considered as highly critical [21], however, it is not clear what are these.
Regarding transportation, there is hardly a day without news in the mass media, for example, on the disruption in the various modes of transport in urban environments. For instance, very recently, due to an extreme weather across Europe, thousands of holidaymakers experienced long delays on Eurotunnel trains, flights and ferries [22]. Further, a flight operator cancelled fourteen flights from Stansted airport (England) as a result of the ‘knock-on effects’ caused by the air traffic control restrictions from storms on the previous day and staff shortages caused by industrial action in France [22]. These examples have illustrated that critical infrastructures are in fact highly interdependent [14,23].
Scholars have made a great deal of effort in trying to understand, among other things, disruptions in transport systems from different perspectives [24,25,26]. However, there are not that many studies regarding, for example, the failure propagation due to the interdependency amongst modes of road transport systems; in particular, in megacities, and from a systemic point of view.
The paper aims to investigate the disruption caused by a failure of a track in the metro transport system in Mexico City. The approach has been the application of the developed ‘SSMS’ (‘Systemic Safety Management System’) model. The systemic model has been applied extensively in analyzing past failure; e.g., railway accidents [27,28,29,30], flood disaster in Mexico [31], the 1996 Channel tunnel fire [32,33]. It also has been applied to the management of safety and fire safety in particular; e.g., in the oil and gas sector [34,35,36], and to modelling interdependencies among the subsystems that constitute the metro transport system [14]. More details on the model are given in Section 3.2.

2. The Traveling Patterns and the Metro’s Failure and Its Aftermath

2.1. The Traveling Patterns in the Context of Mexico City

According to a recent published report on commuters’ Origin-Destination (OD) [37] in the so called Urban Metropolitan Zone (ZMVM) of the city, it has been found that a total of 34.56 million trips made during the weekdays, almost half of them were related to returning home (i.e., 47.4%). Further, of the 23.41 million trips made during the year 2017, the maximum demand time (or peak hours) in the ZMVM were the following: a) 11.7% was during the morning peak hour (07:00–7:59 h); b) 8% during the evening peak hour (18:00–18:59 h). (It should be highlighted that the metro track failure occurred at the evening peak hour, see Section 2.2).
But what about the modes of road transport used during these peak hours? The findings of the report [37] showed that of the 2.47 million trips made during the evening peak hour, the following modes of transport have been used by the commuters: a) public transport (buses, vans) (76.0%); b) Taxi (7.6%); c) the metro transport system (36.2%); d) Bus Rapid Transit (BRT) system (8.1%); private motorcars (92.7%). Further, when the participants of the study were asked “What modes of transport do you use when back home?” the results showed that commuters used public buses (33.6%), private motorcars (18.3%), the metro system (12.9%), taxis (4.7%), and the BRT transport system (3.2%).

2.2. The Metro System Failure and Its Consequences

On Friday 3 March 2017, at about 18:19 h, a metro track failed prompting about 50% of the metro system line-C to a halt (Figure 1a and Figure 2). The incident occurred at rush hour when tens of thousands of commuters were heading to their homes after work [38]. Soon after the track incident, (18:20–19:35 h), it is believed that some of the metro trains were instructed to decrease the traveling speed, others to stop in the stations, and some of them stopped in between stations (tunnels); the commuters were angry and finally were instructed to evacuate through the tunnels. It is thought about 45,000 commuters were affected by the transport disruption [38].
The timeline of the key events leading to the public transport disruption were the following (Figure 1 and Figure 2):
18:19 h
  • At about 18:19 h, a fault in the track apparatus, which allows to change from one track to another failed, prompting the metro system line-C to a halt.
19:36–20:21 h
  • By this time the scene was chaotic at the exit doors of the affected metro and BRT stations (i.e., Stations 1–9 as shown in Figure 1a). As expected, commuters left the stations and looked for other modes of transport to get home; e.g., taxi, public buses, BRT, even the police vans, etc. (Figure 2).
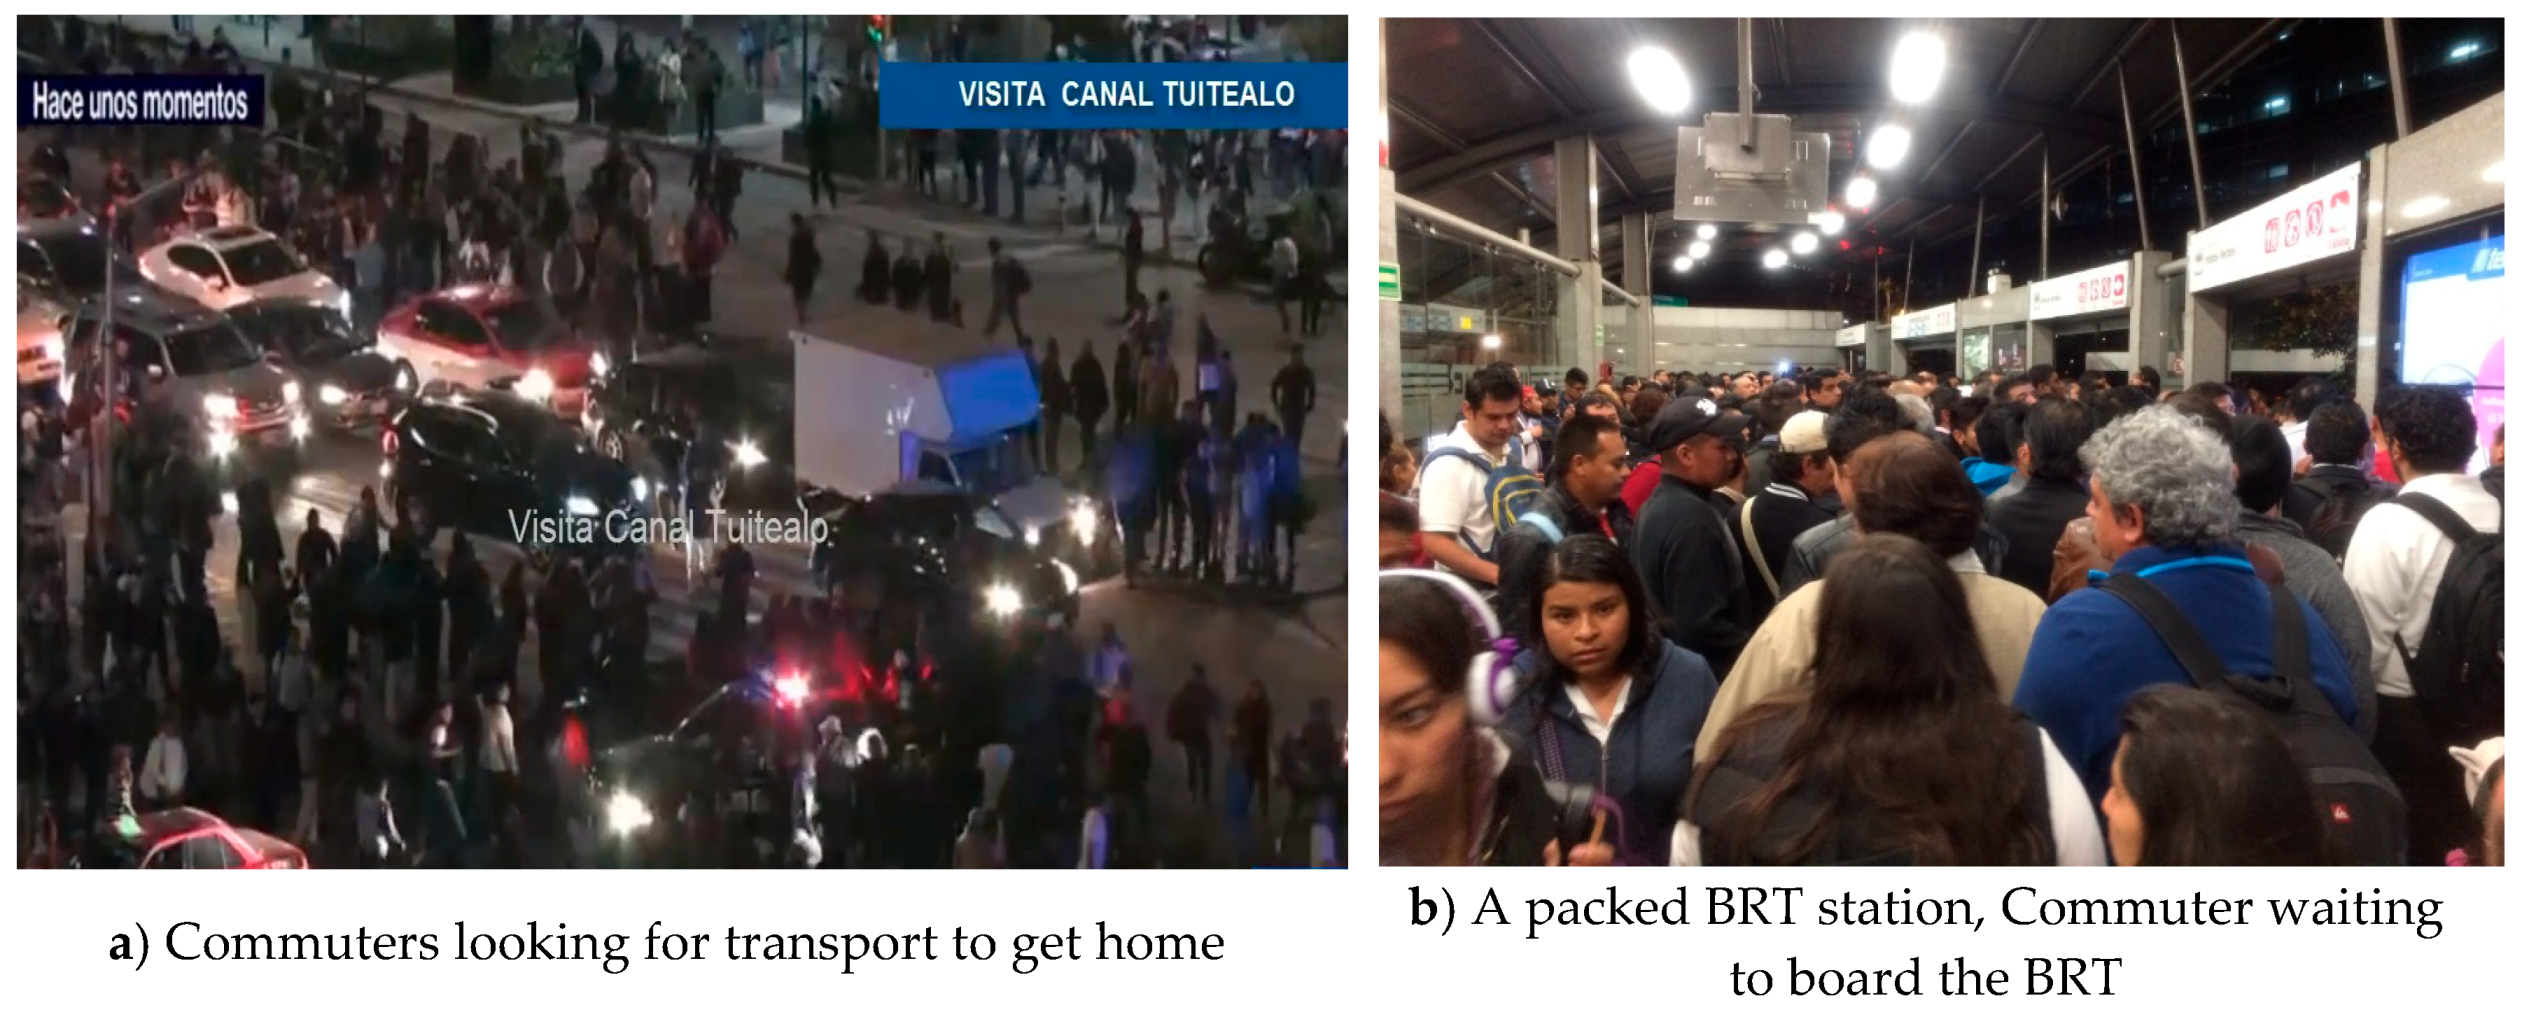
  • Local authorities dispatched about 100 buses to assist the stranded commuters but were overwhelmed by the vast amount of people.
  • Given the fact that the BRT line-A runs parallel to the affected metro line-C (Figure 1). It was heavily affected, and it did not cope with the affected commuters (Figure 2b).
  • Hundreds (if not thousands) of commuters in the city center heading to the north of the city did not have any choice but to walk.
20:22–12:00 h
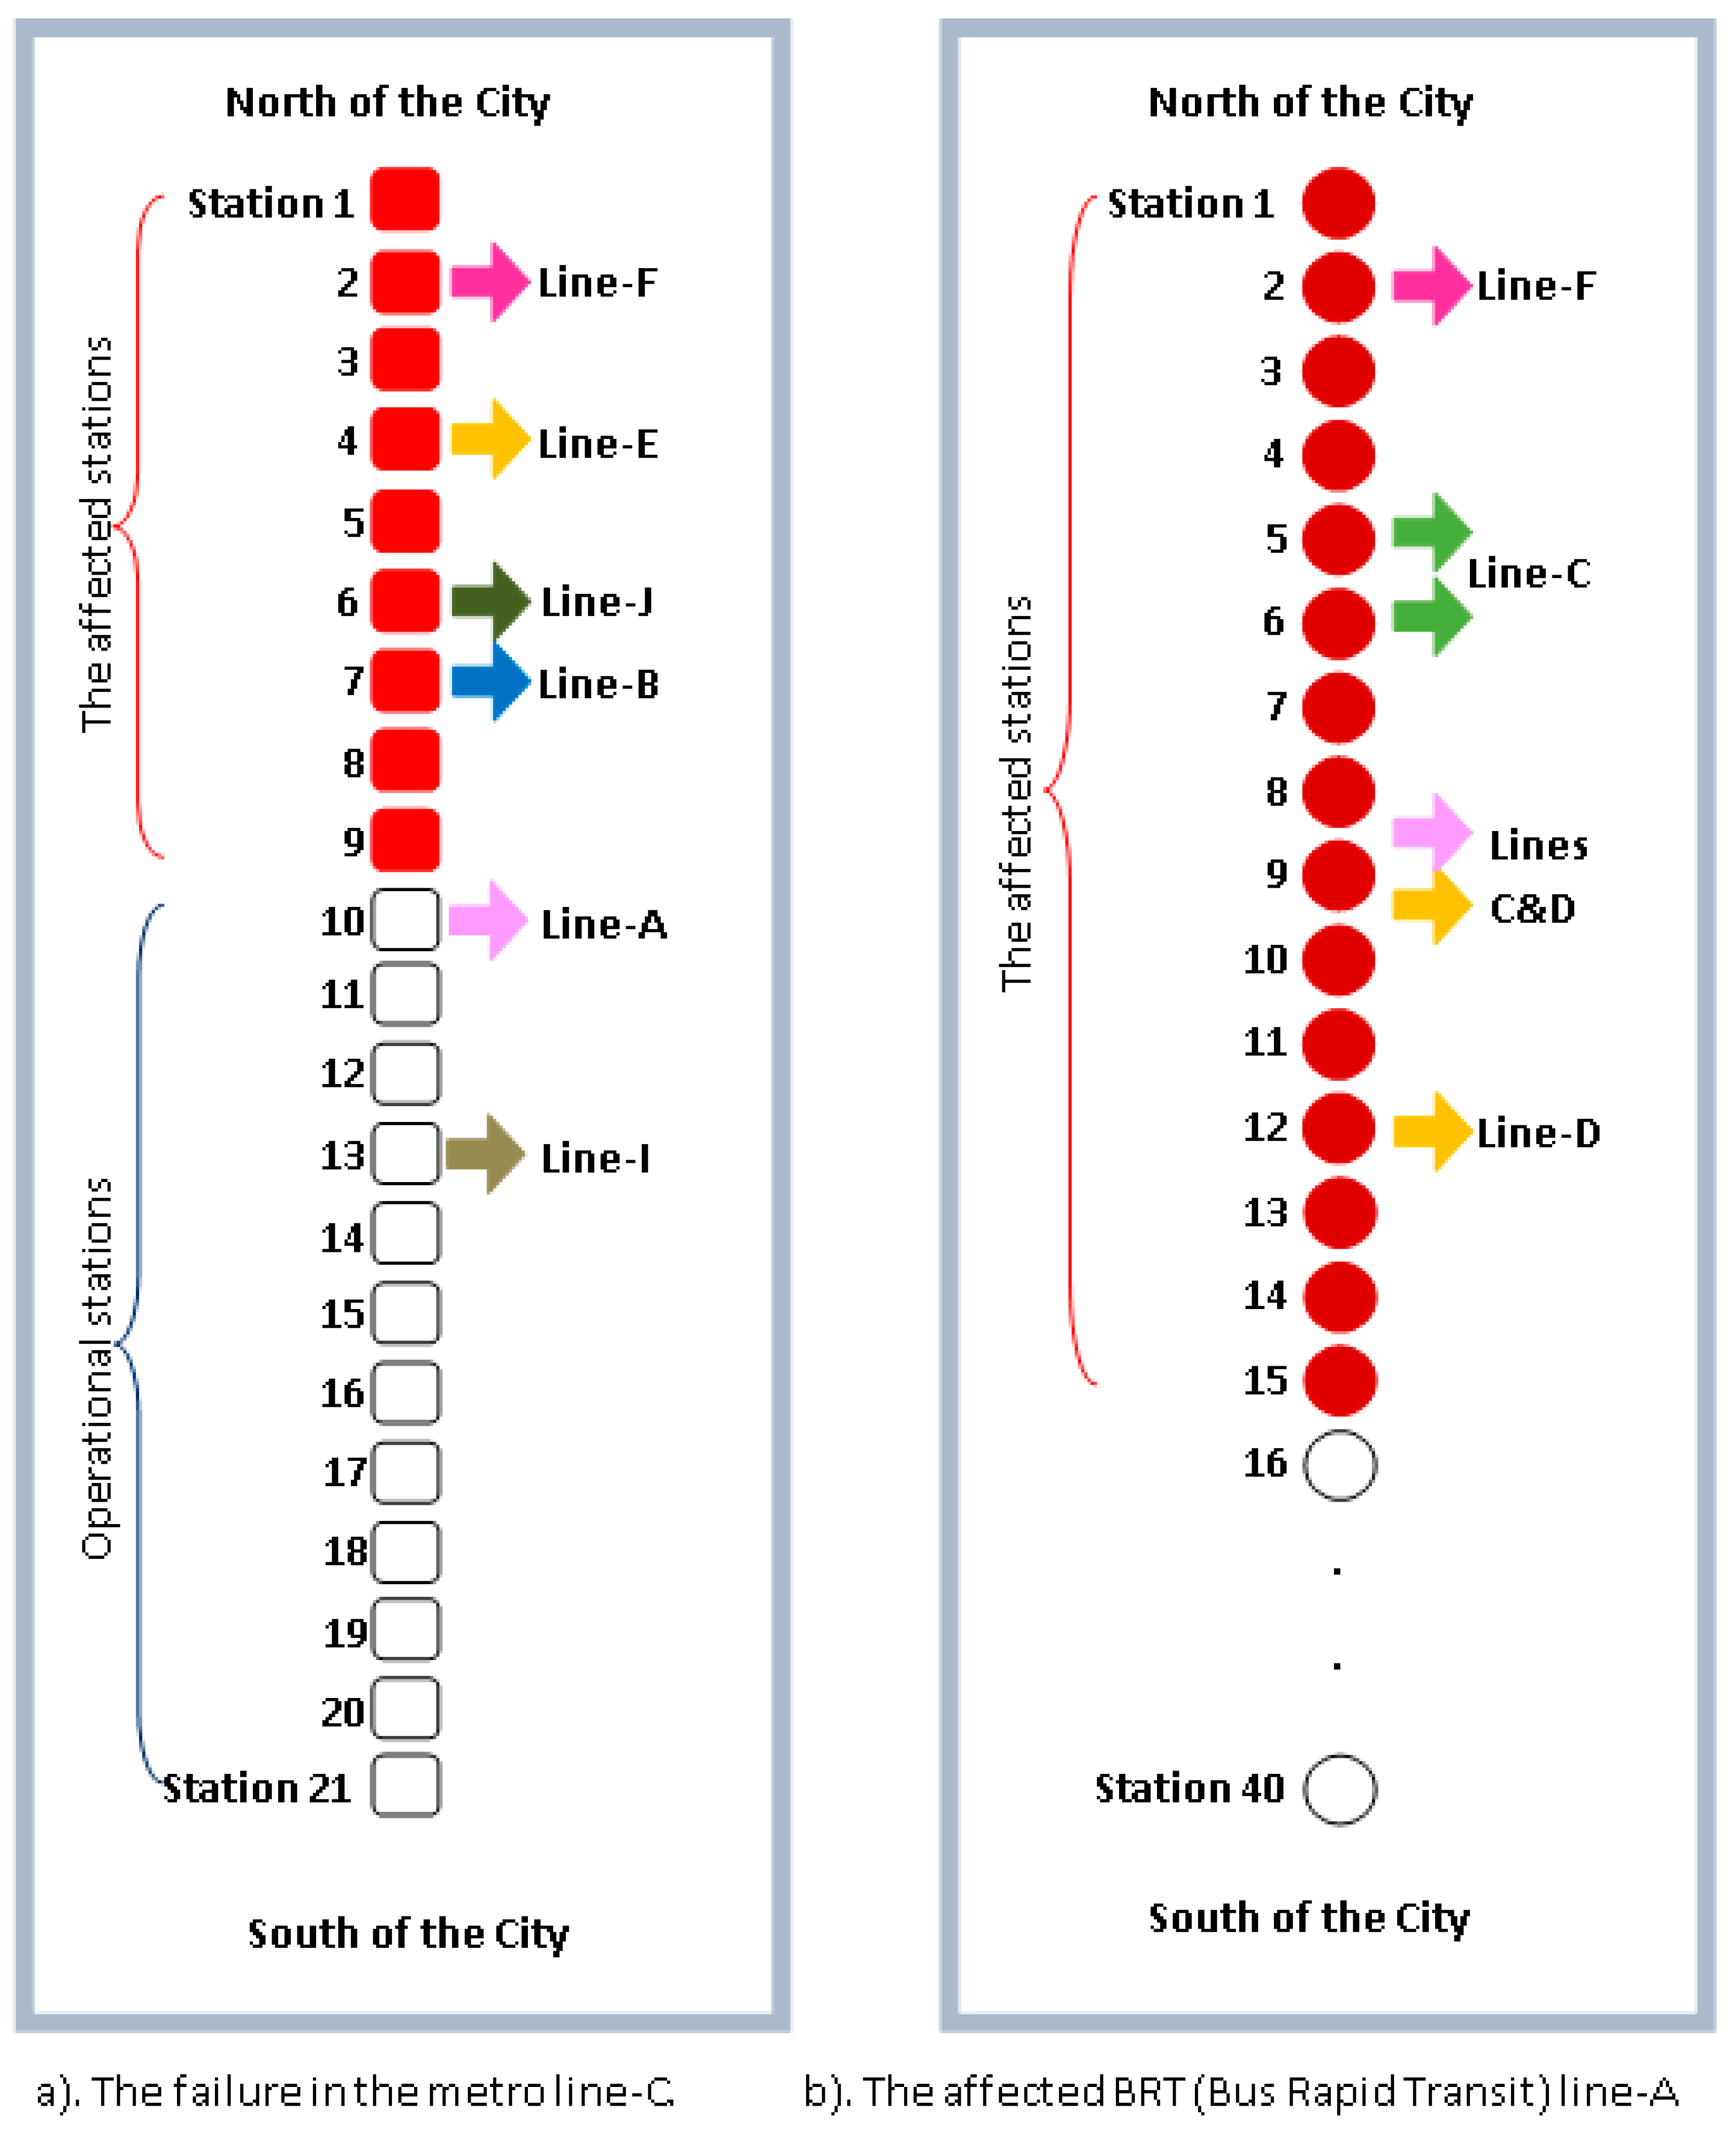
  • A chaotic situation was still seen at the entrance of BRT stations (e.g., Station 9, Figure 1b).
  • At about 20:37 h, it is believed that commuters traveling from the north to the south of the city experienced delays for up to 50 min.
  • At about 21:01 h, the BRT Station. No. 15 (Figure 1b) was still completely packed with commuters desperate to get into the BRT buses (see, for example, Figure 2b).
  • As part of the existing emergency plan, Metrobus (the organization running the BRT system) sent fifteen BRT buses; however, nothing changed.
  • It is believed that most (if not all) of the commuters reached their homes the following day early in the morning.

3. The Case Study and the SSMS Model

3.1. An Overview of the Mexico City Transport System

Mexico City is being considered as a megacity and therefore one of the most populated cities in the world [39]. In relation to its transport system, the city has one of the largest metro systems in the world, and a motorized public transport network comprised of thousands of buses, taxi, vans, etc., which are characterized by a low transport capacity; also, there are electric based transport systems, such as the trolleybus and the light rail. The city has a network of concessional taxis and private companies, such as ‘Uber’ and ‘Cabify’ [40].
Overall, the private transport has the conventional motorcar as its main choice; it is believed that more than a million motorcars run through the city; however, as mentioned above, its transport capacity is quite low in comparison, for example, with a bus. In 2005, the Mexico City’s major decided to implement the BRT mass transport system. Since then, seven BRT lines have been implemented [41]. The BRT line-A, was the first to be implemented in 2005, and the line is the longest with a total of 30 km and a total 40 stations; the line carries about 480,000 passengers per day [41].
In recent years, the city has incorporated another mode of transportation, i.e., cycling. It is believed that cycling has contributed to urban mobility, which has grown in the last two decades [40]. Although it concentrates a low percentage of use in relation to motorized transport systems, it may be considered as the fastest option during rush hours. Finally, walking is an option to mobility within the city; however, an adequate infrastructure for pedestrians in the city is non-existent [40].

3.2. A Brief Description of the SSMS Model

The ‘SSMS’ model described here builds on the Viable System Model (VSM) developed and proposed by Beer [42] and the Failure Paradigm Method (FPM) proposed by Fortune and Peters [43]. The viability of a systemic safety management system is defined as the probability that it will be able to maintain the risk within an acceptable range for a given time period. While it would be desirable to calculate the viability, the SSMS is capable of being used without doing this. It may be used to assist in the design of the safety management system (SMS), for example, of a new tunnel metro system, or as a ‘template’ to compare with an existing SMS with a view to improvement [32,33]. The model may also be employed as a tool for examining past accidents or near misses. This may be achieved by using it as a basis for comparison to see how features in a ‘real world’ system was deficient and led to an accident or near miss. In this way it has been applied to the analysis of past failure [27,28,29,30] to try to gain ‘learning points’ for safety management. The SSMS model consists of the following fundamental characteristics [34,35,36]:
a)
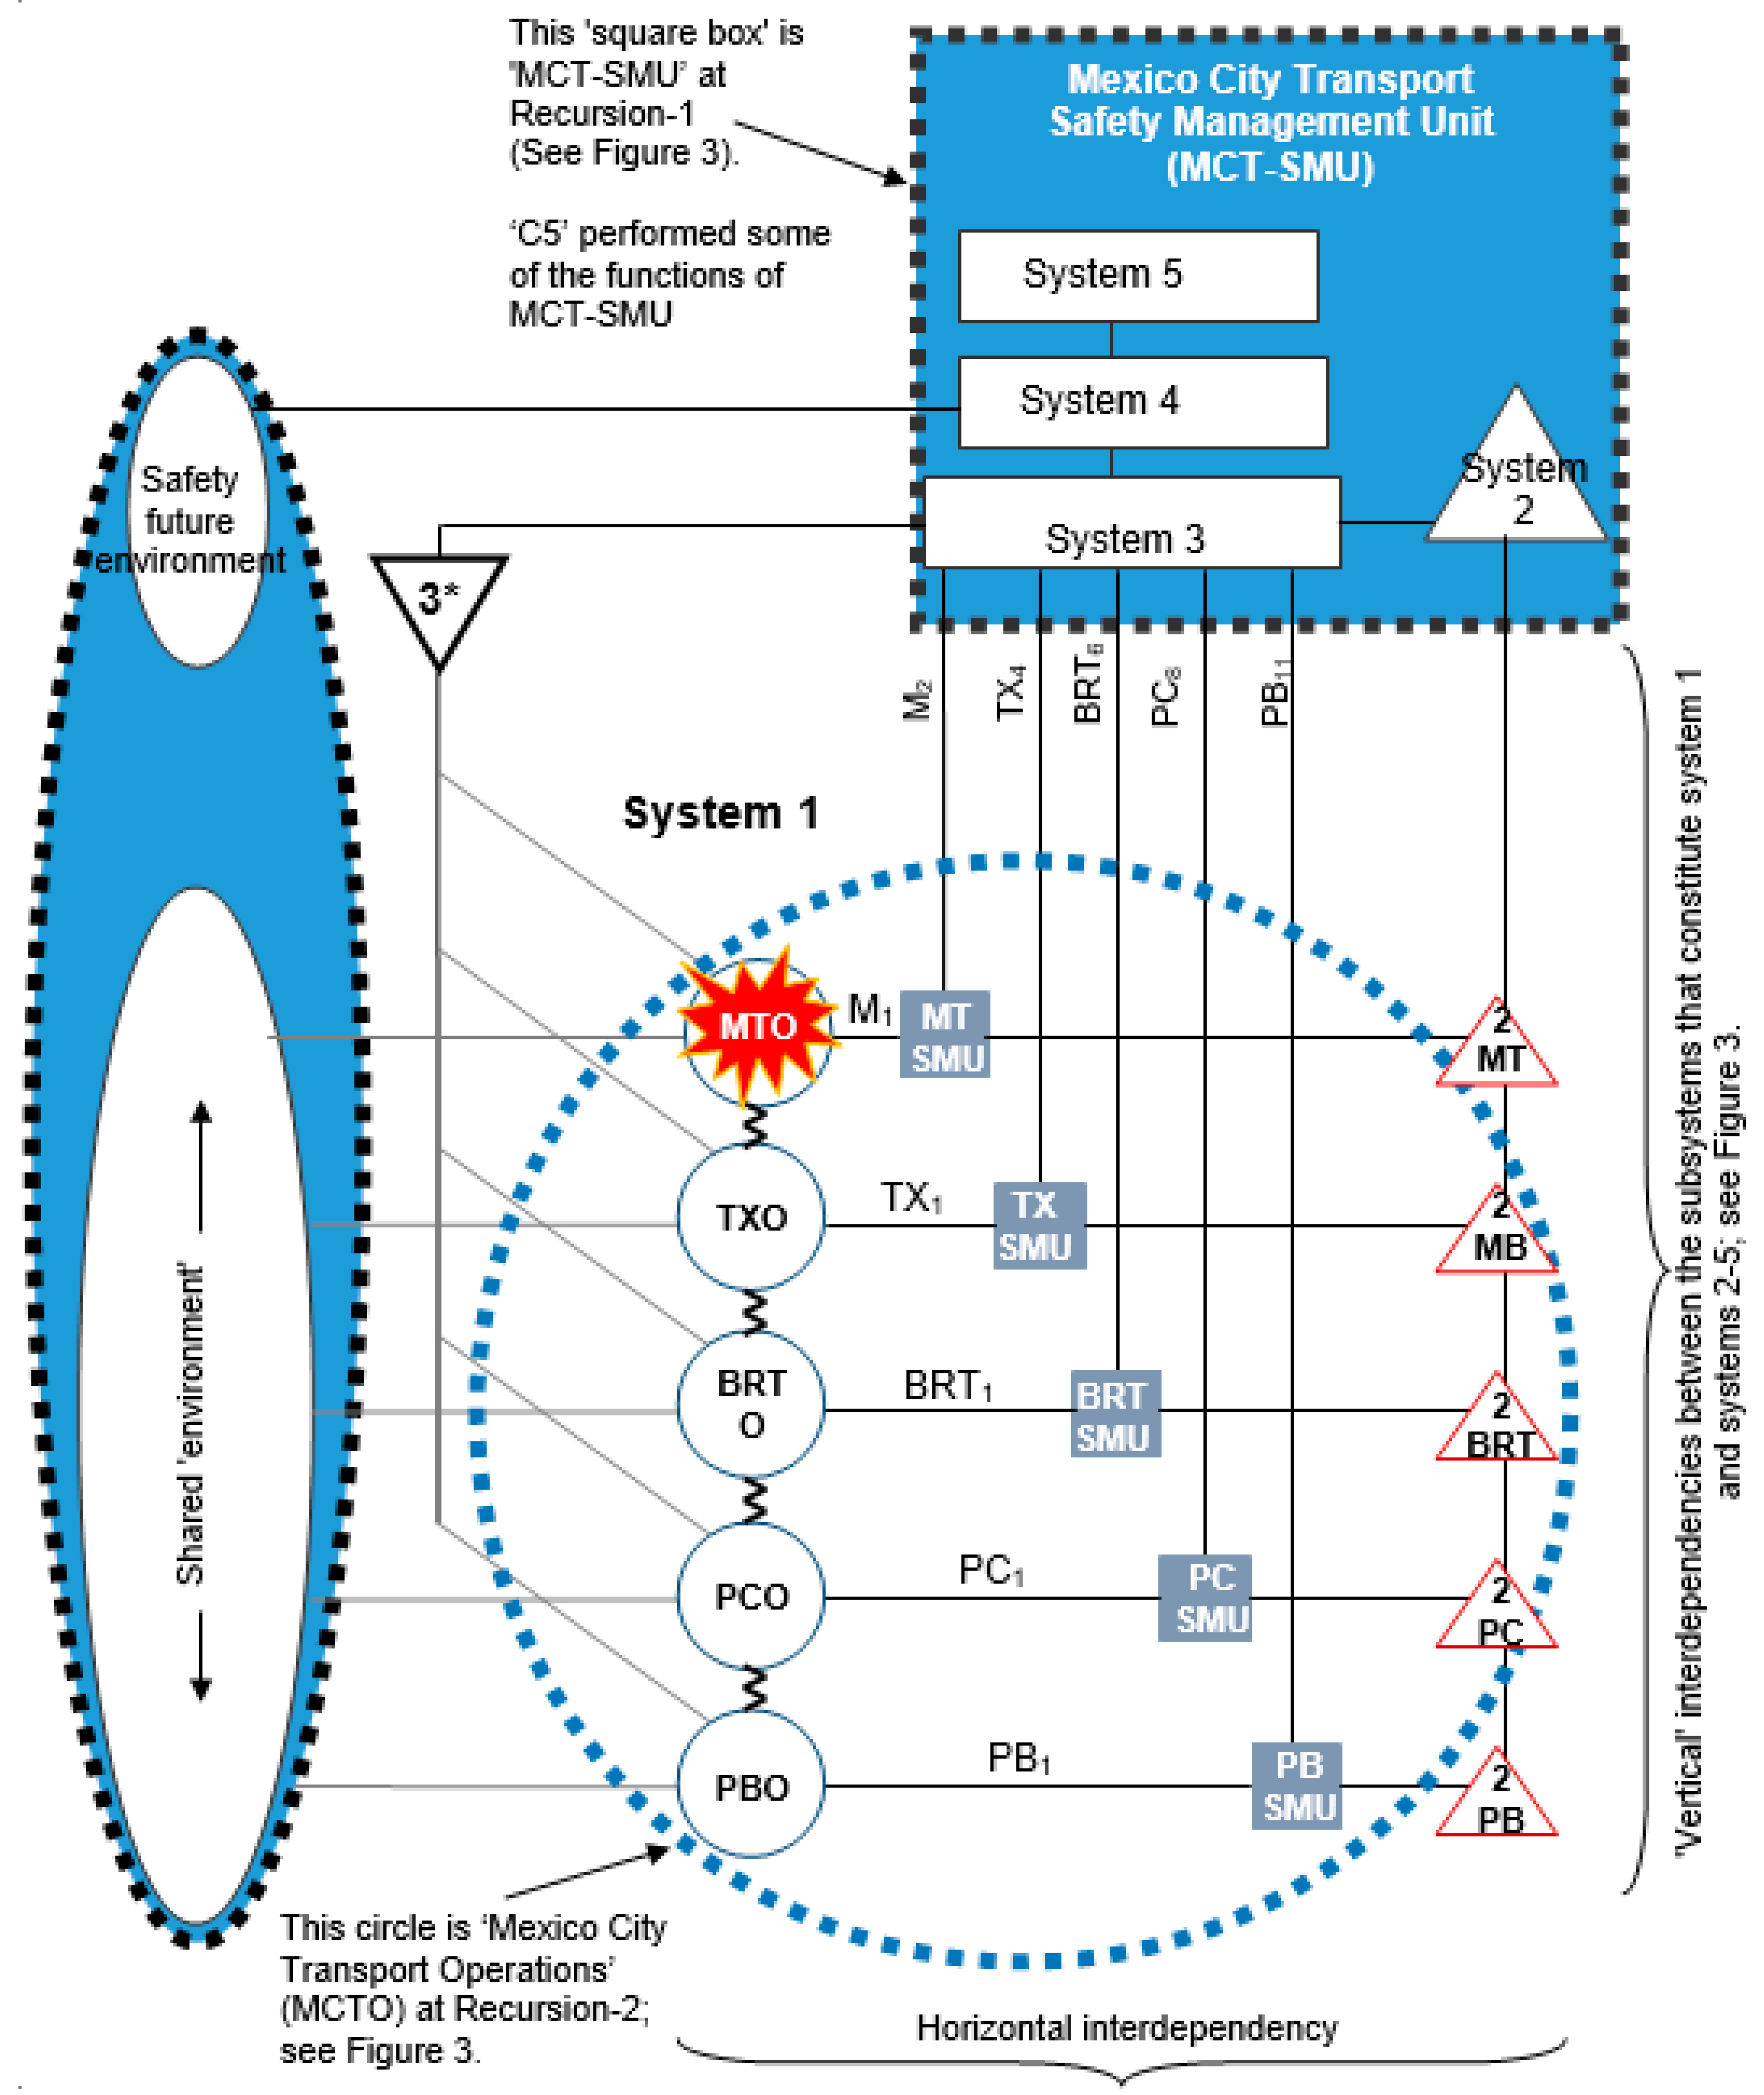
a structural organization which consists of a ‘basic unit’ in which it is necessary to achieve five functions associated with Systems 1–5, as described briefly below (Figure 4).
b)
a ‘recursive’ (i.e., layered) structure
c)
relative autonomy
d)
four organizational principles
e)
the concept of MRA (maximum risk acceptable) and acceptable range of risk
f)
the concept of ‘viability’ of a safety management system.
g)
The model is augmented by various sub-models or paradigms [43]; e.g., communication and control sub-models, ‘human factors paradigms’, etc. Such paradigms may be valuably employed as part of the overall approach.
In general, the ‘Systemic Safety Management System’ (‘SSMS’) model aims to maintain risk within an acceptable range in the operations, in principle, of any system. If the features of the model (i.e., System 2–5) are in place and working effectively then the probability of failure should be less than otherwise. In this way the systemic model has a fundamentally preventive potentiality. A full account of its features and applications are given elsewhere [14,27,28,29,30,31,32,33,34,35,36]; in the present case study, the ‘structural organization’ and the ‘recursive’ structure of the model were employed in the analysis. Regarding the ‘structural organization’ (Figure 4):
“Overall, System 2–5 facilitate the function of system 1, as well as ensuring the continuous adaptation of the systems as a whole, i.e., (the ‘México City transport system’). System 2–5 are described briefly in what follows: System 2, safety coordination, ensures that the various operations of System 1 operate in agreement. System 3, safety functional, ensures that System 1 implements the organization’s safety policies. System 3*, safety audit, is part of System 3 and it is concerned with safety sporadic audit. System 4, safety development, is responsible for identifying strengths, weaknesses, threats, and opportunities that can suggest systemic changes to the organization’s safety policies. System 4*, safety confidential reporting, is part of System 4 and it is concerned with confidential reports or causes of concern that may require direct and immediate intervention of the corporate management. Finally, System 5, safety policy, is responsible for establishing safety policies for the system as a whole” [34].
The ‘recursive’ structure of the model is described in the next section.

3.3. Modeling the Case Study

Once the capital city’s modes of transport network were identified, the next step was to model the recursive structure of the transport network. In the SSMS model, the concept of Recursion, helps us to see how the systems of interest are interconnected (i.e., “Recursion means that every ‘system’ contains, and is contained in, a ‘system’” [33]). Figure 3 shows three levels of Recursion for the transport system. For instance, Recursion 1 (or level 1) contains the system of our interest, i.e., MCTO (Mexico City Transport Operations) and its associated safety management unit (SMU), MCT-SMU (Mexico City Transport-Safety Management Unit). (It should be mentioned that at this level, other critical infrastructures were considered to illustrate, for example, that each of these could be, in principle, de-composed and analyzed, i.e., ESO (Energy Supply Operations), WSO (Water Supply Operations). However, these were not affected during the disruption, and therefore not considered in the present analysis.
At Recursion 2, it can be seen from Figure 3, that the level is comprised by four subsystems that constitute all the modes of transportation considered in the analysis, namely: MTO (Metro transport operations) and its associated SMU (MT-SMU); TXO (Taxi Operations) and TX-SMU; BRTO (BRT Operation) and BRT-SMU; PCO (Private Car Operations) and PC-SMU; and PBO (Public Bus Operations) and PB-SMU. These five interrelated subsystems constitute System 1, which is called here MCTO. Finally, moving down to the next level below Recursion 2 (at Recursion 3), it can be seen the following systems:
a)
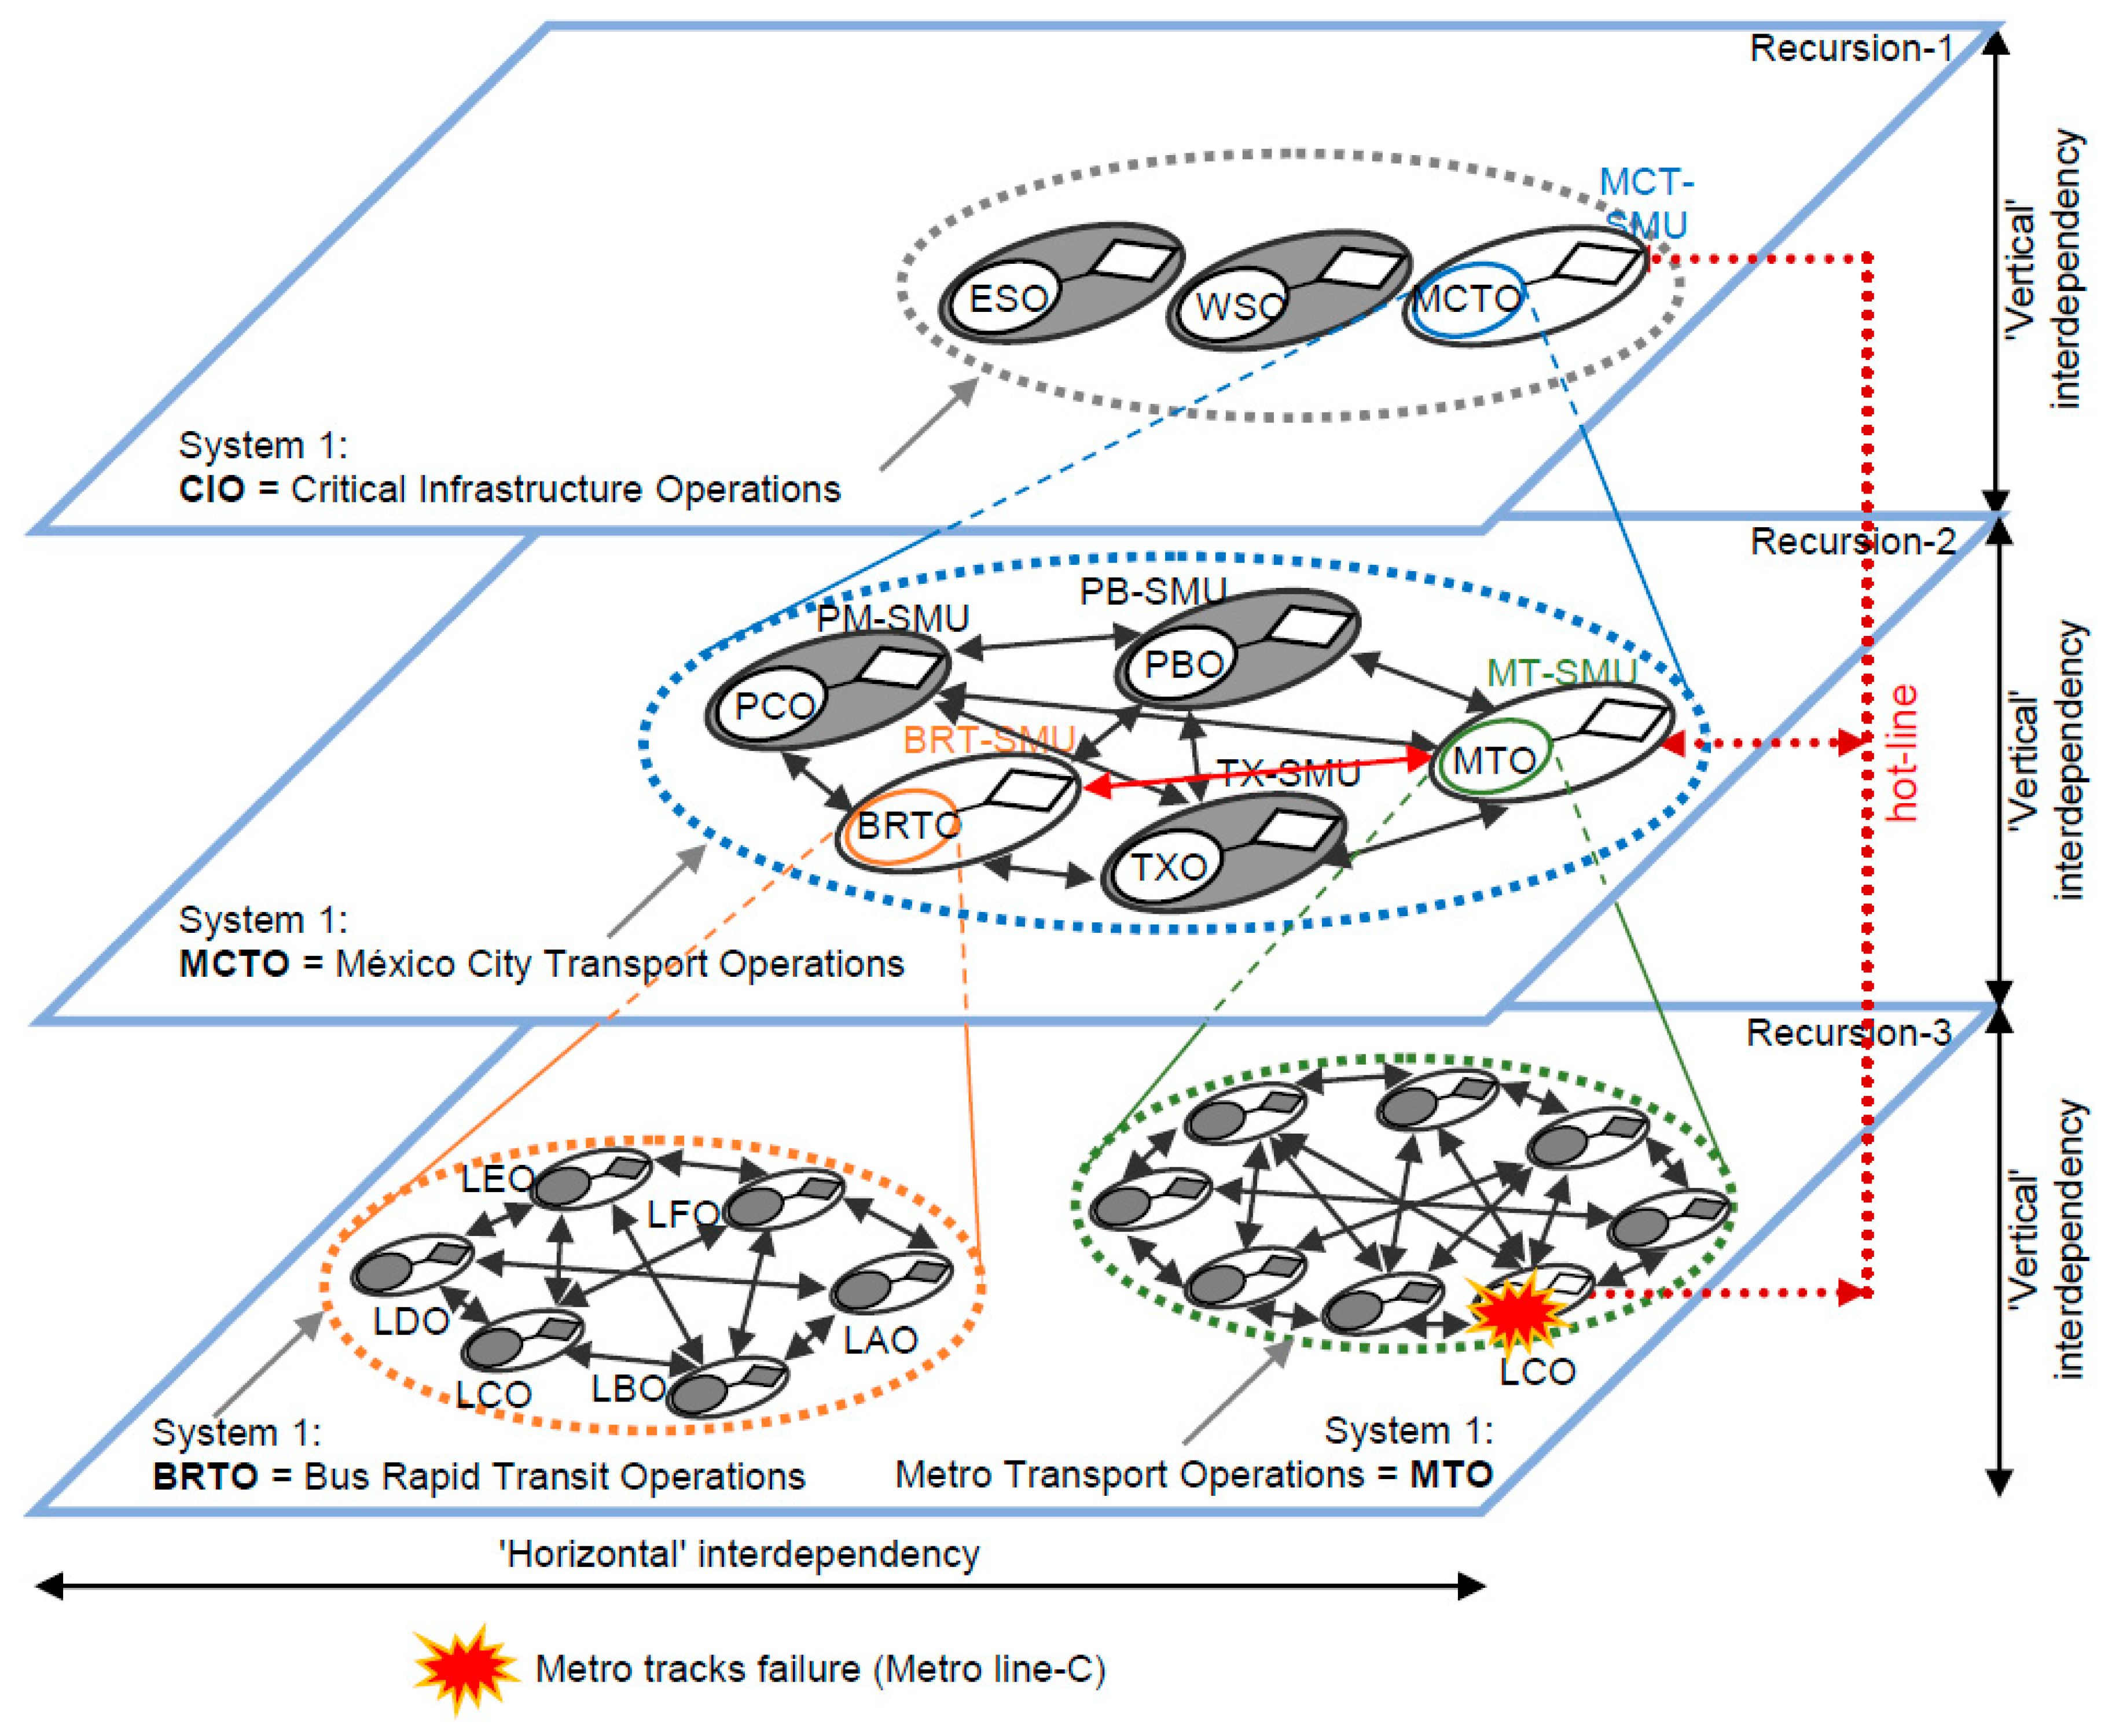
System 1: Metro Transport Operations (MTO), which comprises twelve metro lines; however, only eight are shown, including the metro line-C, where the incident occurred.
b)
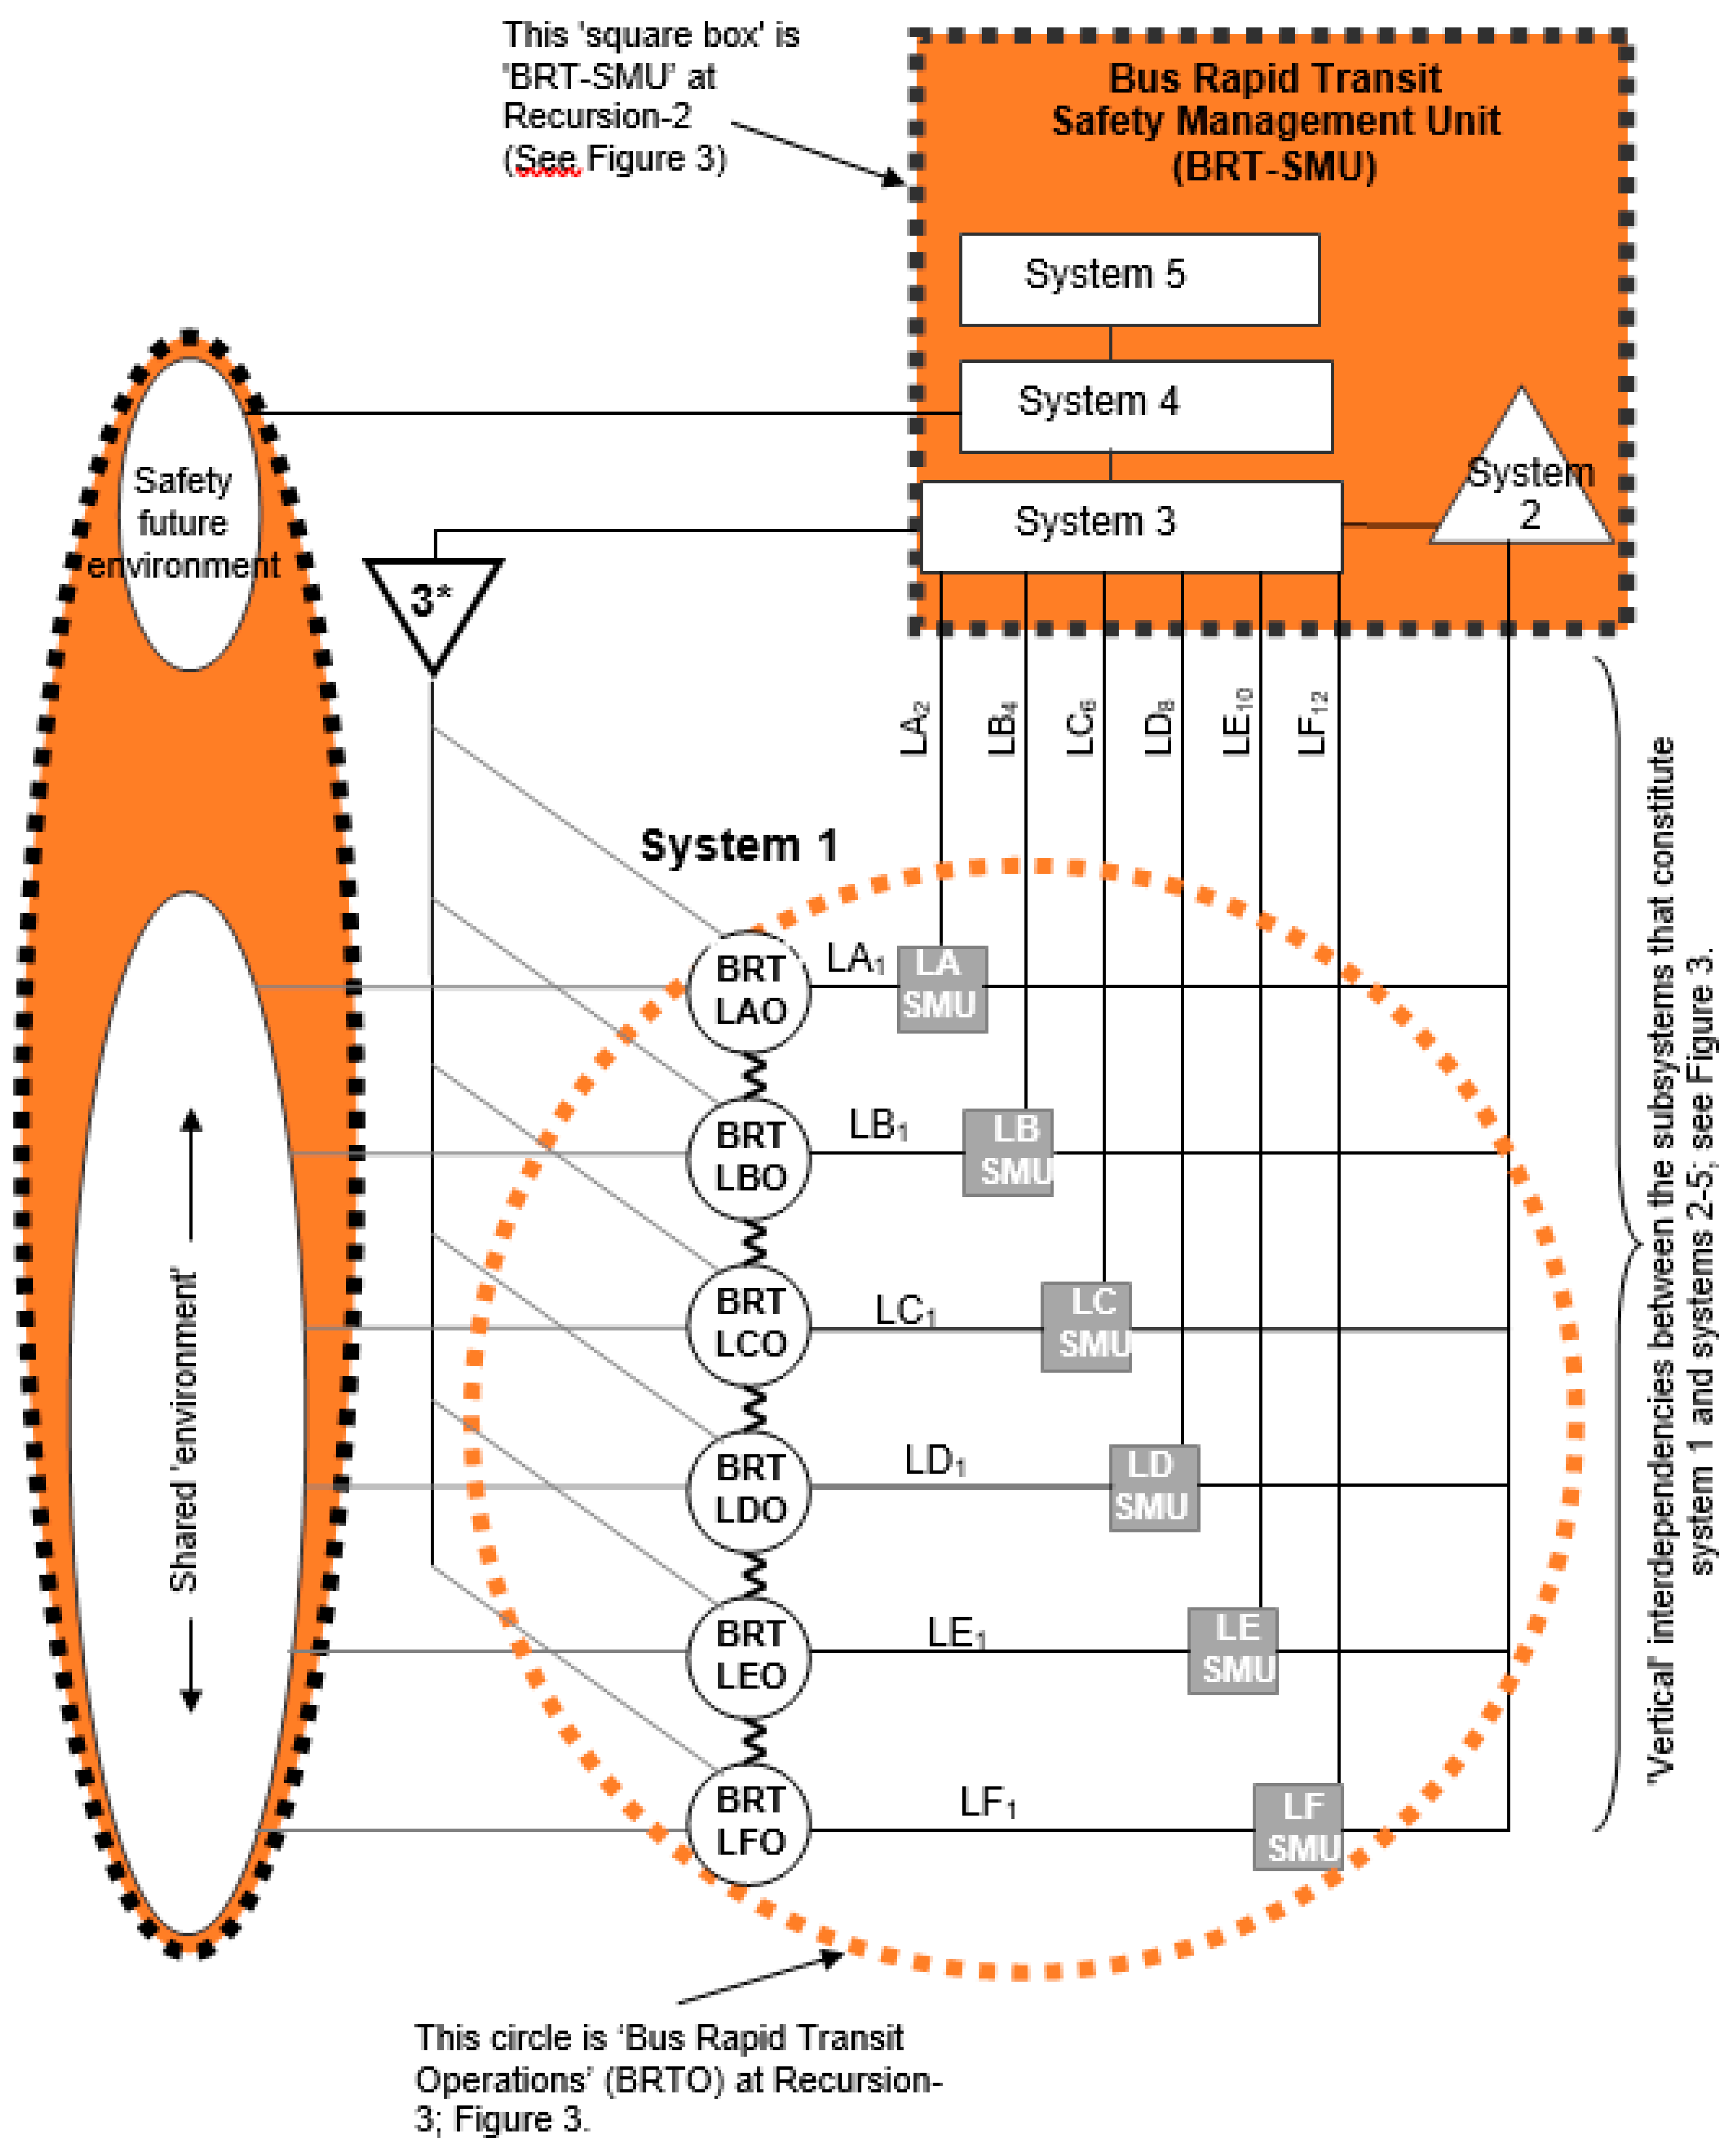
System 1: BRTO, which comprises six BRT lines.
It should be mentioned that, in principle, each of these subsystems could be analyzed further if needs to. For example, one could analyze what happened in each of the stations of the metro line-C during the emergency; e.g., how the failure propagated within the metro stations of the whole line (at Recursion 4, not shown here). However, this is not within the scope of the present analysis.
In summary, from Figure 3, one can see how the identified subsystems of interest are interconnected horizontally (at every level of Recursion) and vertically (between two levels of Recursion).

4. Results and Discussion

The section presents the results according to the following analyses (Figure 3):
a)
An analysis on how the metro failure propagated at the level of Mexico City’s transport network (i.e., Recursion 1 and 2); see Section 4.1;
b)
An analysis on how the failure of the metro line-C affected the other metro lines of the metro network (i.e., Recursion 2 and 3); see Section 4.2, and
c)
An analysis on how the BRT system was affected by the metro incident (i.e., Recursion 2 and 3); see Section 4.3.
The results of the analysis of each of these are presented in the subsequent sections.

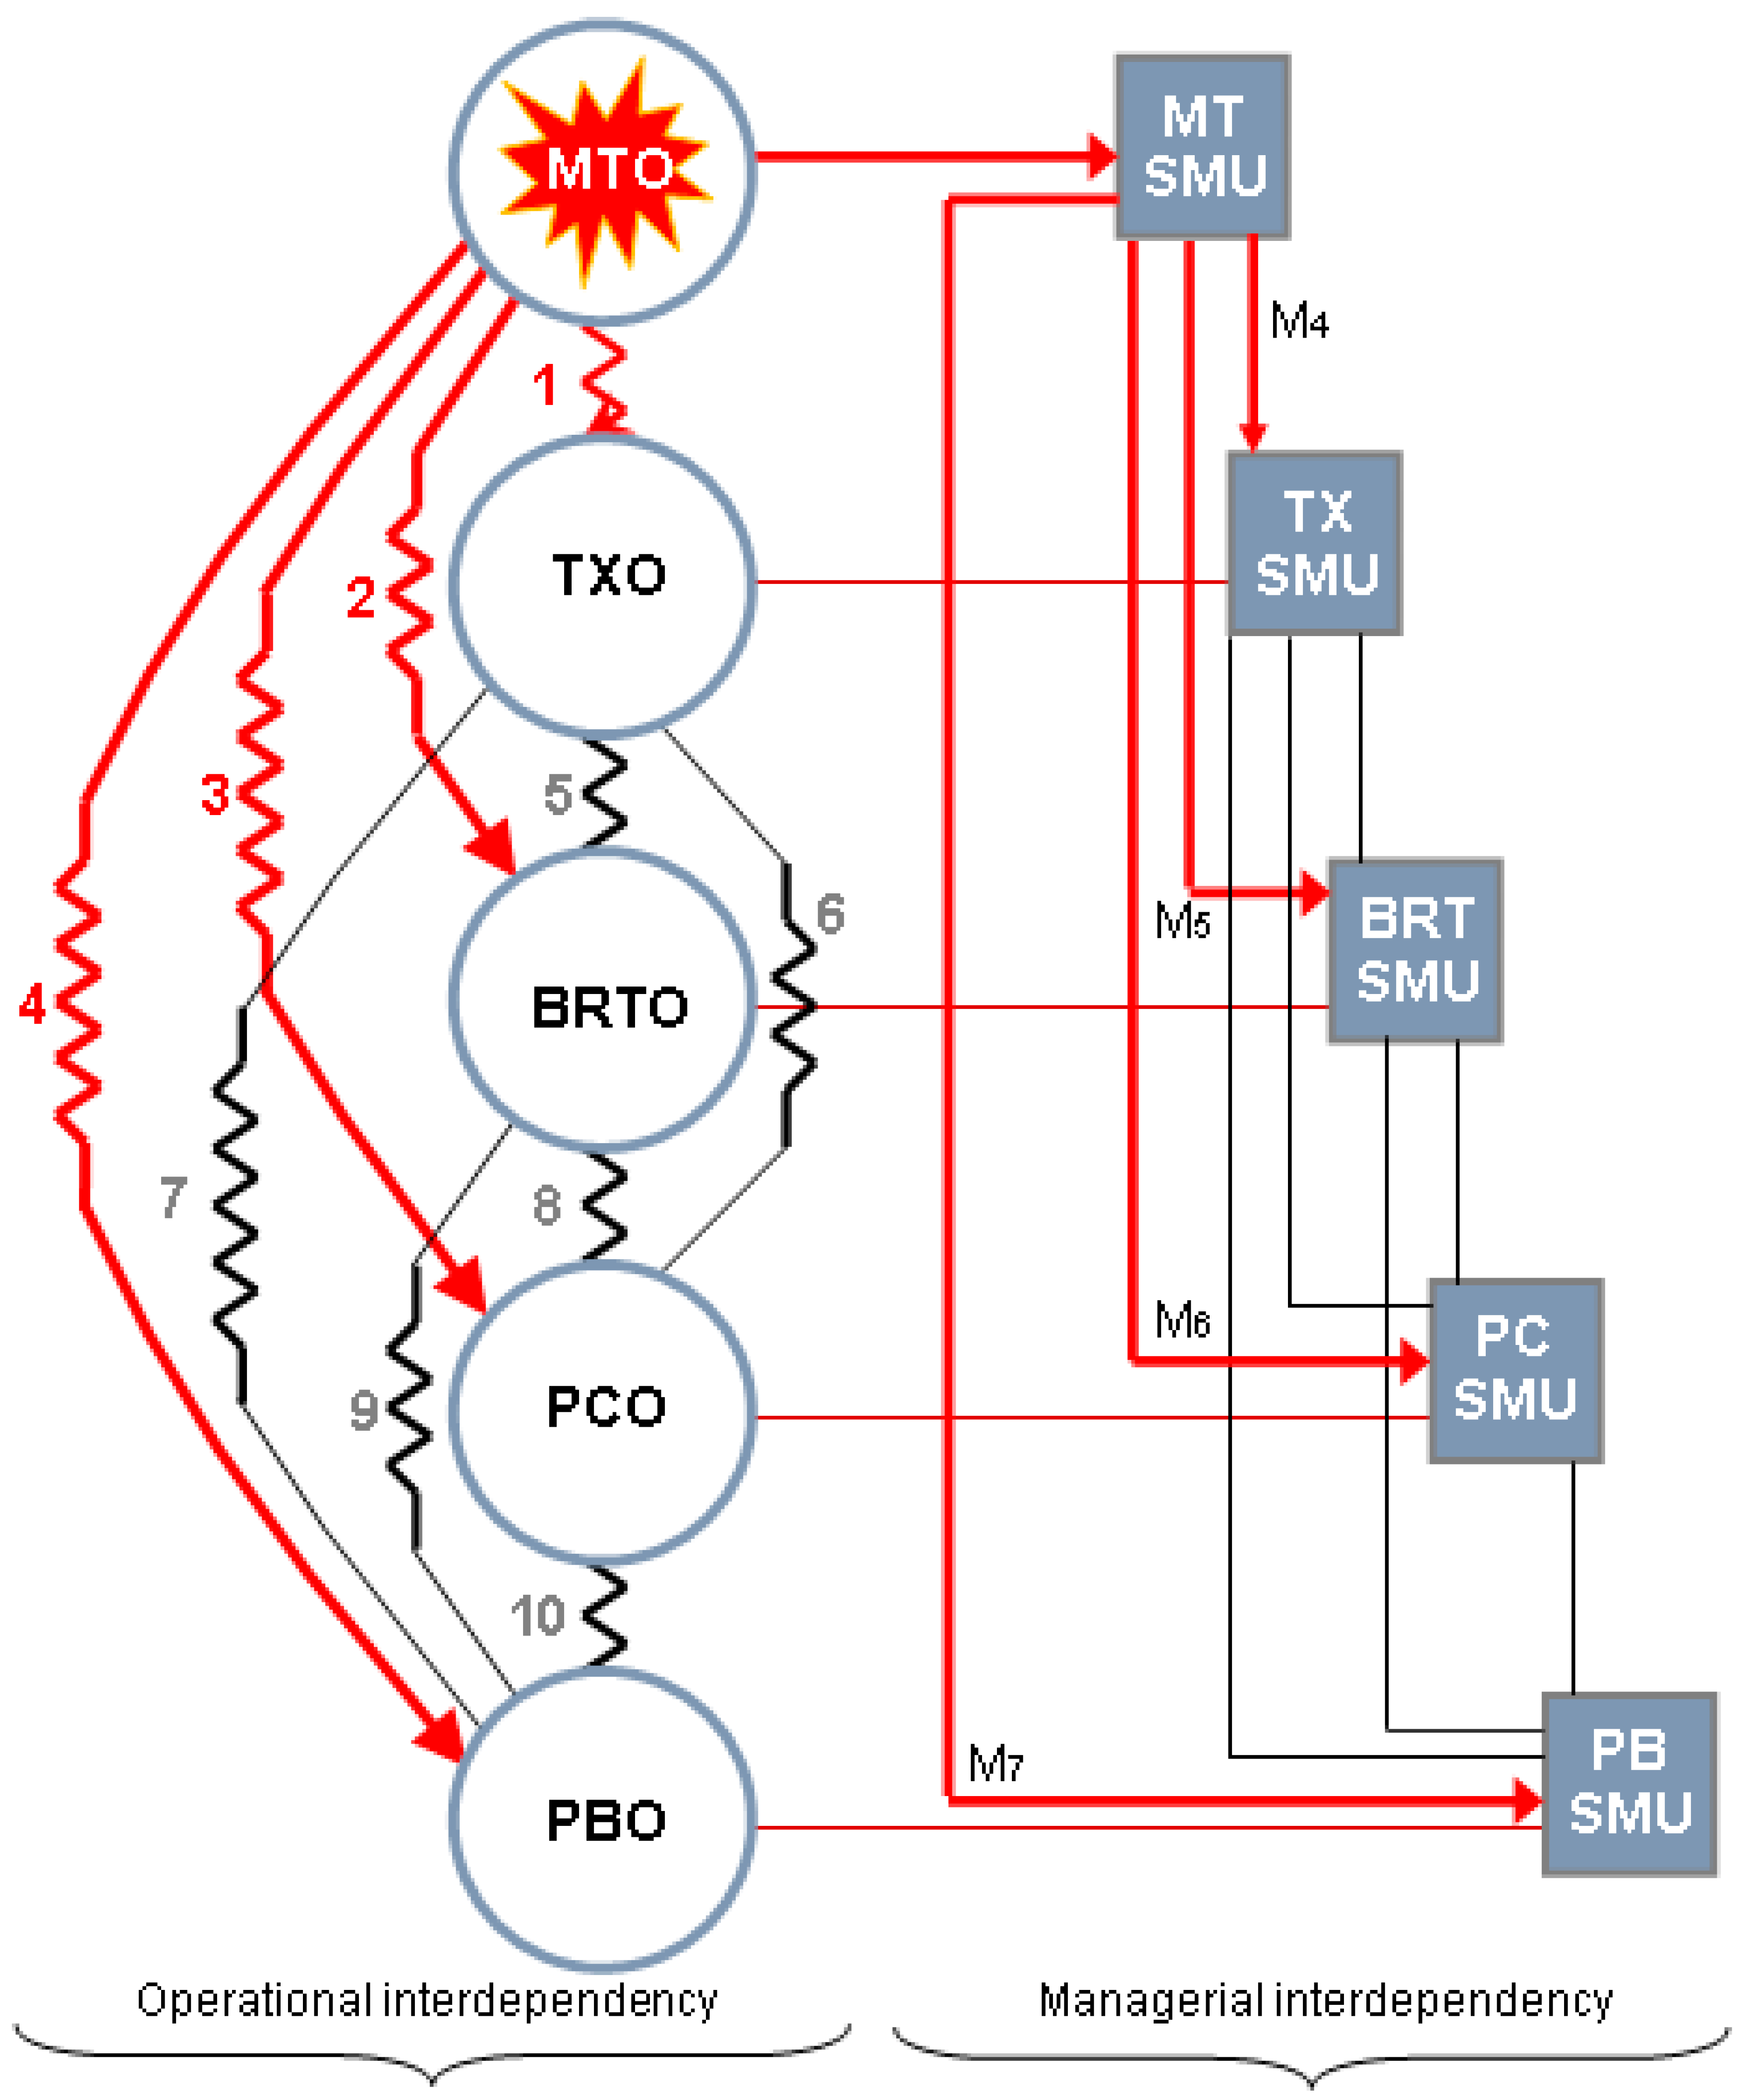
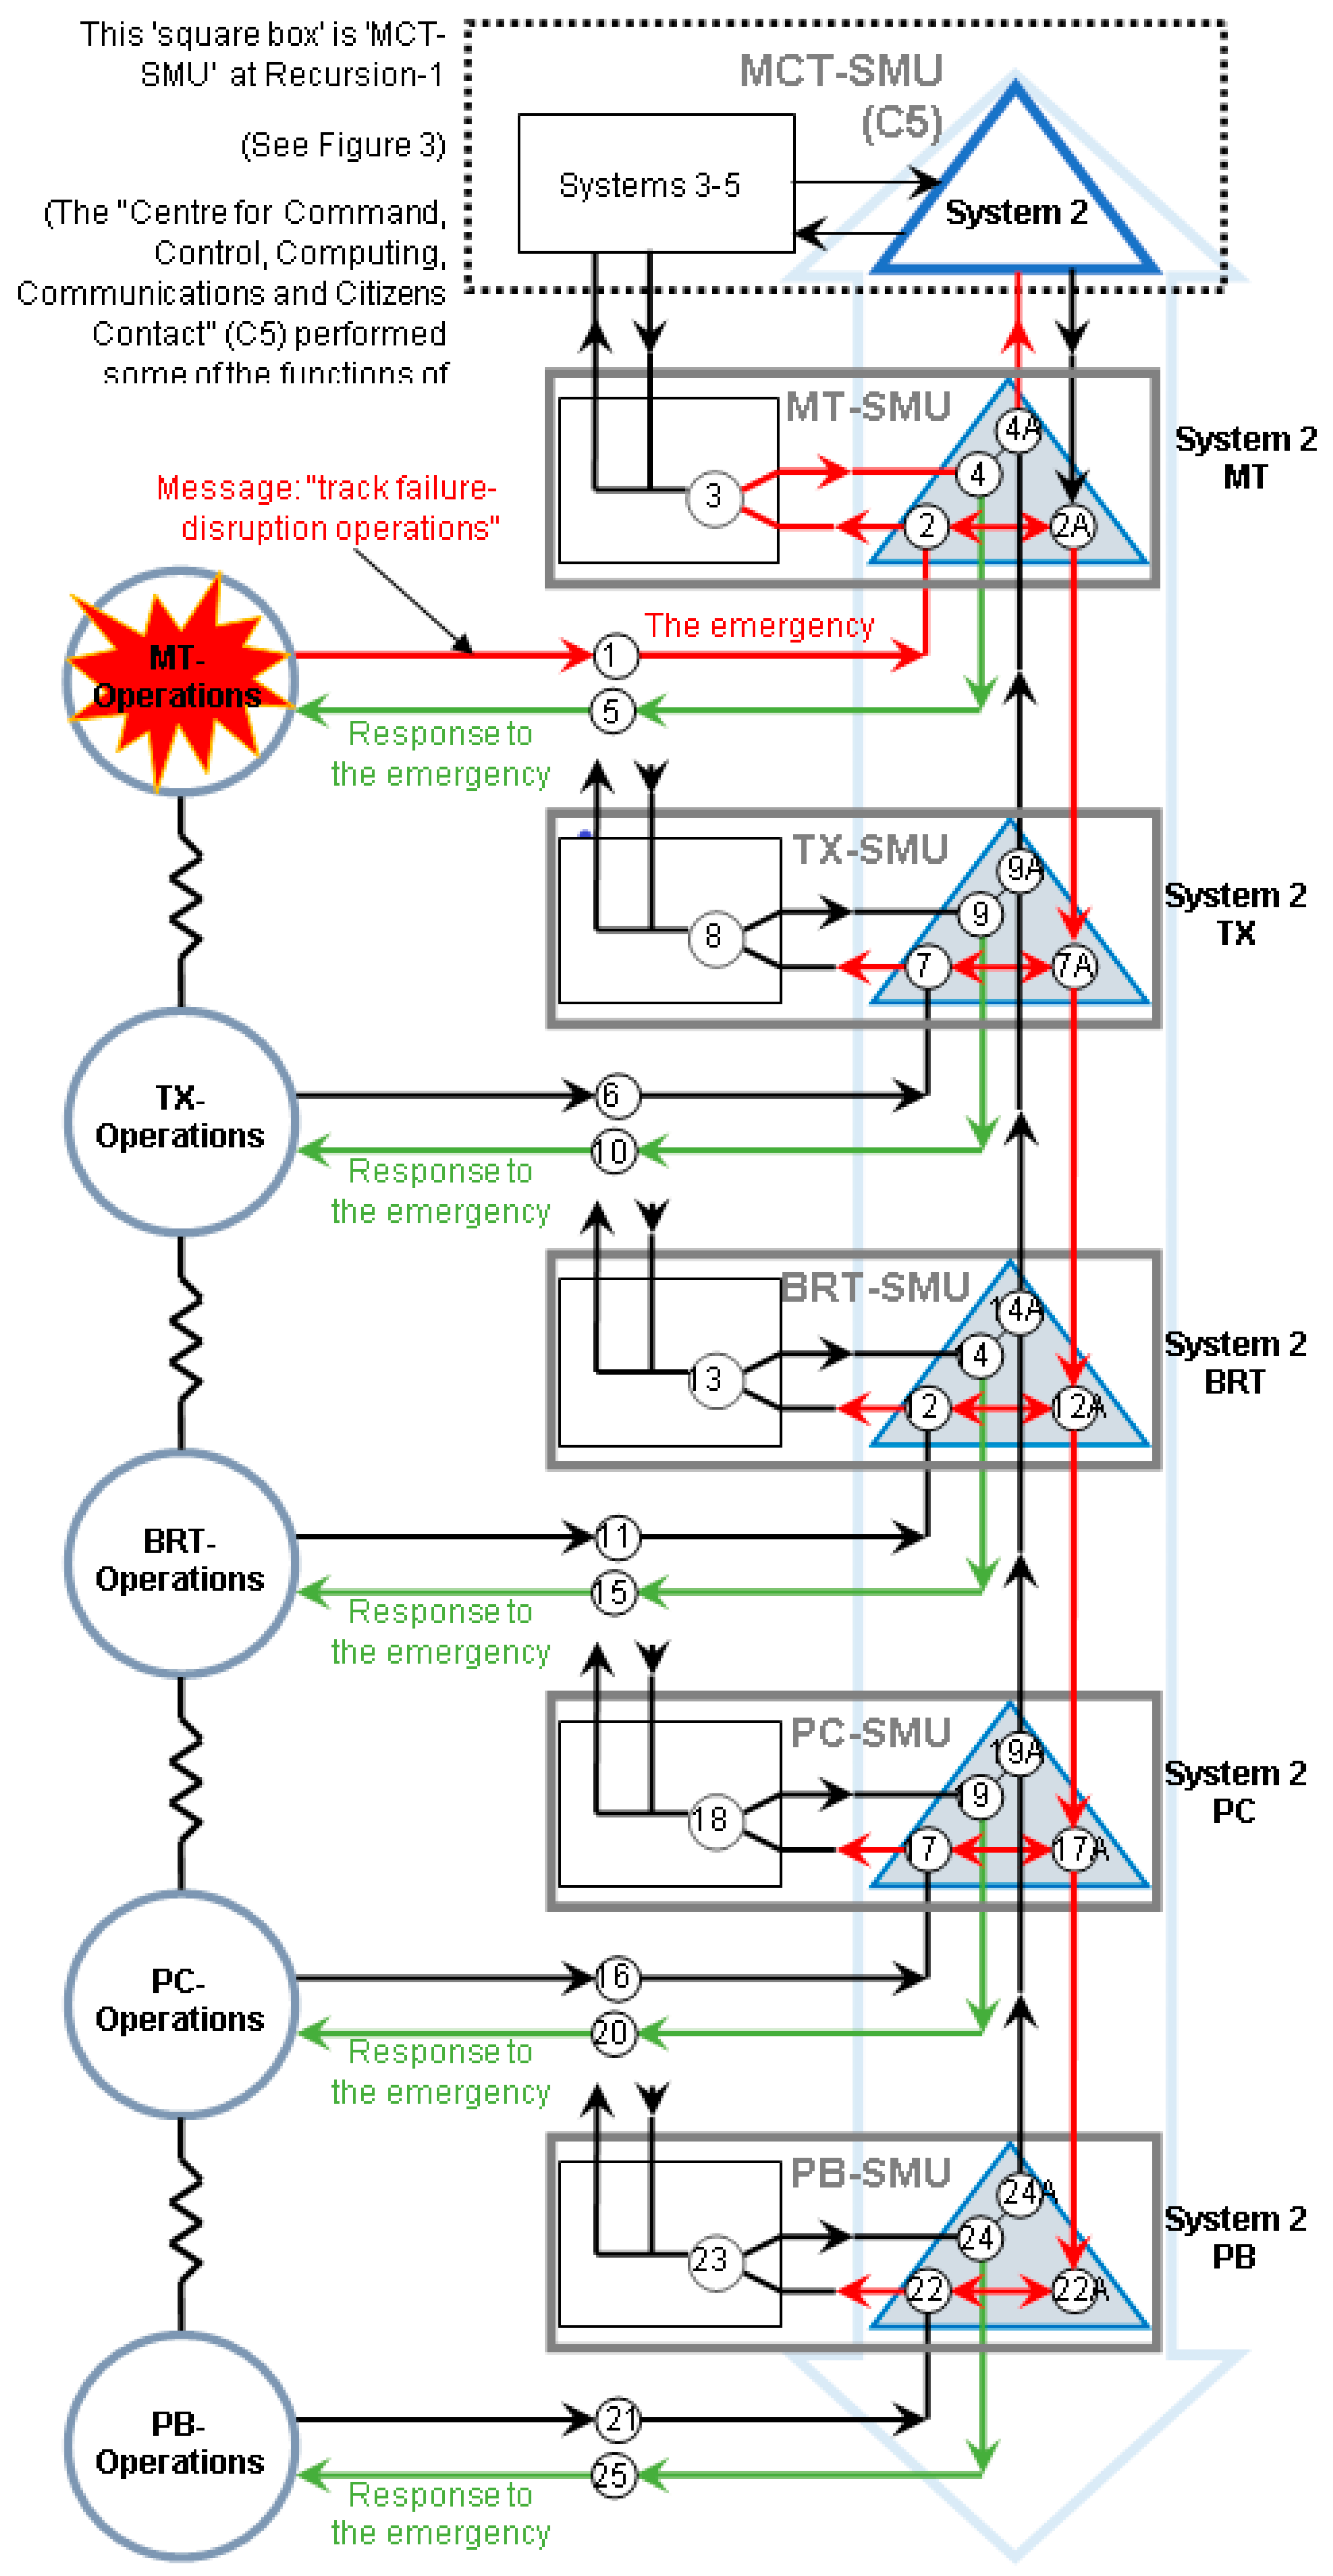
4.1. Failure Propagation in the City’s Transport Network (Recursion 1 and 2: MCT-SMU + MCTO, Figures 3–6)

The section addresses the following question: how the failure propagated within the identified key and highly interconnected subsystems? That is, those that constitute System 1 and shown at levels 1 and 2 in Figure 3.
To analyze how the different modes of transportation were affected during the emergency, the identified subsystems were mapped onto the ‘structural organization’ (i.e., System 1–5 and its associated channels of communication and control) of the model as shown in Figure 4; (it should be highlighted that the figure should be seen in the context of Figure 3).
To conduct the analysis Figure 4, Figure 5 and Figure 6 have been employed as a ‘template’ for the comparison process. In a previous study [14], it has been found that in the model, the interdependency occurs horizontally and vertically and in the subsequent sections each of them will be addressed in the context of the present case study.

4.1.1. Horizontal Interdependency (Operational and Managerial)

Operational Interdependency

The question being addressed here was this: how the metro incident affected the four subsystems that constitute system 1 (at Recursion 1 and 2), as shown in Figure 3? The results of the analysis are presented in Figure 4, Figure 5 and Figure 6 and Table 1 and Table 2.
In the model, the operational (circles) interdependencies are shown with zig-zag lines amongst them (Figure 5). The results shown in Table 1 and Table 2 highlight that all the modes of road transportation available during the emergency could not cope with vast number of commuters desperately trying to get home. It can be argued that during the emergency there was a ‘strong’ interdependency amongst these modes of transportation; see for example ‘a’, ‘b’, ‘c’, and ‘d’ in Table 1 and Table 2. Each of these modes of transportation lacked the capacity to cope with the number of commuters because a number of reasons: a) each of them was already under full operational capacity, given the fact that the emergency occurred at rush hour (i.e., 18:19 h); b) as mentioned in Section 2.2, about 50% of the metro line-C was not operational; that is, the available modes of transport, at the time, had to cope with about 45,000 extra passengers; c) most (if not all) of the commuters were desperately heading to the north of the city, in particular to Station, No. 1 (Figure 1), where it is believed most of them had to take another bus to get home.

Managerial Interdependency

Figure 6 shows the arrangement of the channels of communication and control of the ‘Mexico City transport system’ in the format of the model. The Safety Management Units (SMUs) are shown on the right-hand side of the figure. For example, the MT-SMU (Metro Transport-Safety Management Unit), which regulates and continuously monitors the MTO (Metro Transport Operations), through the action points ‘1′–‘2′–‘3′–‘4′–‘5′, as shown in the figure. (Also, Figure 4 shows a simplified and convenient way to refer to each of the channels of communication and control between every SMU (square boxes) and their associated operations (circles)).
Further, one of the key functions of the MT-SMU is to detect any disturbance within MTO (see action point ‘1′ in Figure 6); for example, the incident associated with the track failure in our case study. Once this has been detected, the primary function of the MT-SMU is to bring back the disturbance under control (action point ‘5′). It also should alert the other SMUs, through the action point ‘2A’, i.e., to TX-SMU (through action point ‘7A’); BRT-SMU (through action point ‘12A’); PC-SMU (through action point ‘17A’); and to PB-SMU (through action point ‘22A’), as shown in Figure 6. Then, each of the SMUs would device and implement measures aiming at limit the impact of the incident into their operations (circles), given the strong interdependencies amongst them (Table 1 and Table 2 and Figure 6).
However, it seems that none of the above was in place at the time and consequently the whole transport system network collapsed. Overall, it can be argued that those that performed the functions associated with MCT-SMU (including System 2) failed to act upon the metro incident and communicate about it to other SMUs. Further, Figure 3, Figure 4, Figure 5 and Figure 6 clearly show that the failure propagated horizontally.

4.1.2. Vertical Interdependency (Managerial)

Vertical interdependency occurs between two levels of Recursions only; in the context of our case study, these are Recursion 1 and 2 (Figure 3 and Figure 4). The channels of communication and control between system 1 and System 2–5 represent the vertical interdependency (i.e., M2, TX4, BRT6, PC8, and PB11, as shown in Figure 4). A detailed arrangement of the flow of information that should be in place in the context of the systemic model is shown in Figure 6. In our case study, the so called “Centre for Command, Control, Computing, Communications and Citizen Contact (C5)” [44], performed some of the functions associated with System 2, at Recursion 1 (Figure 4 and Figure 6).
For example, one of the key functions of ‘System 2-MT’, once it has received the alert (action point ‘1′) (i.e., the track failure), is to assess the consequences (action point ‘3′) and immediately implement the corrective actions to minimize the impact (action point ‘5′); further, it communicates about the measure to System 2 within the MCT-SMU, which in turn would device measures to be implemented in System 1.
Given the chaotic situation that left about 45,000 commuters stranded that night, it is clear that the performance of the “C5”, which performed some of the functions associated with System 2–5, was less than adequate.

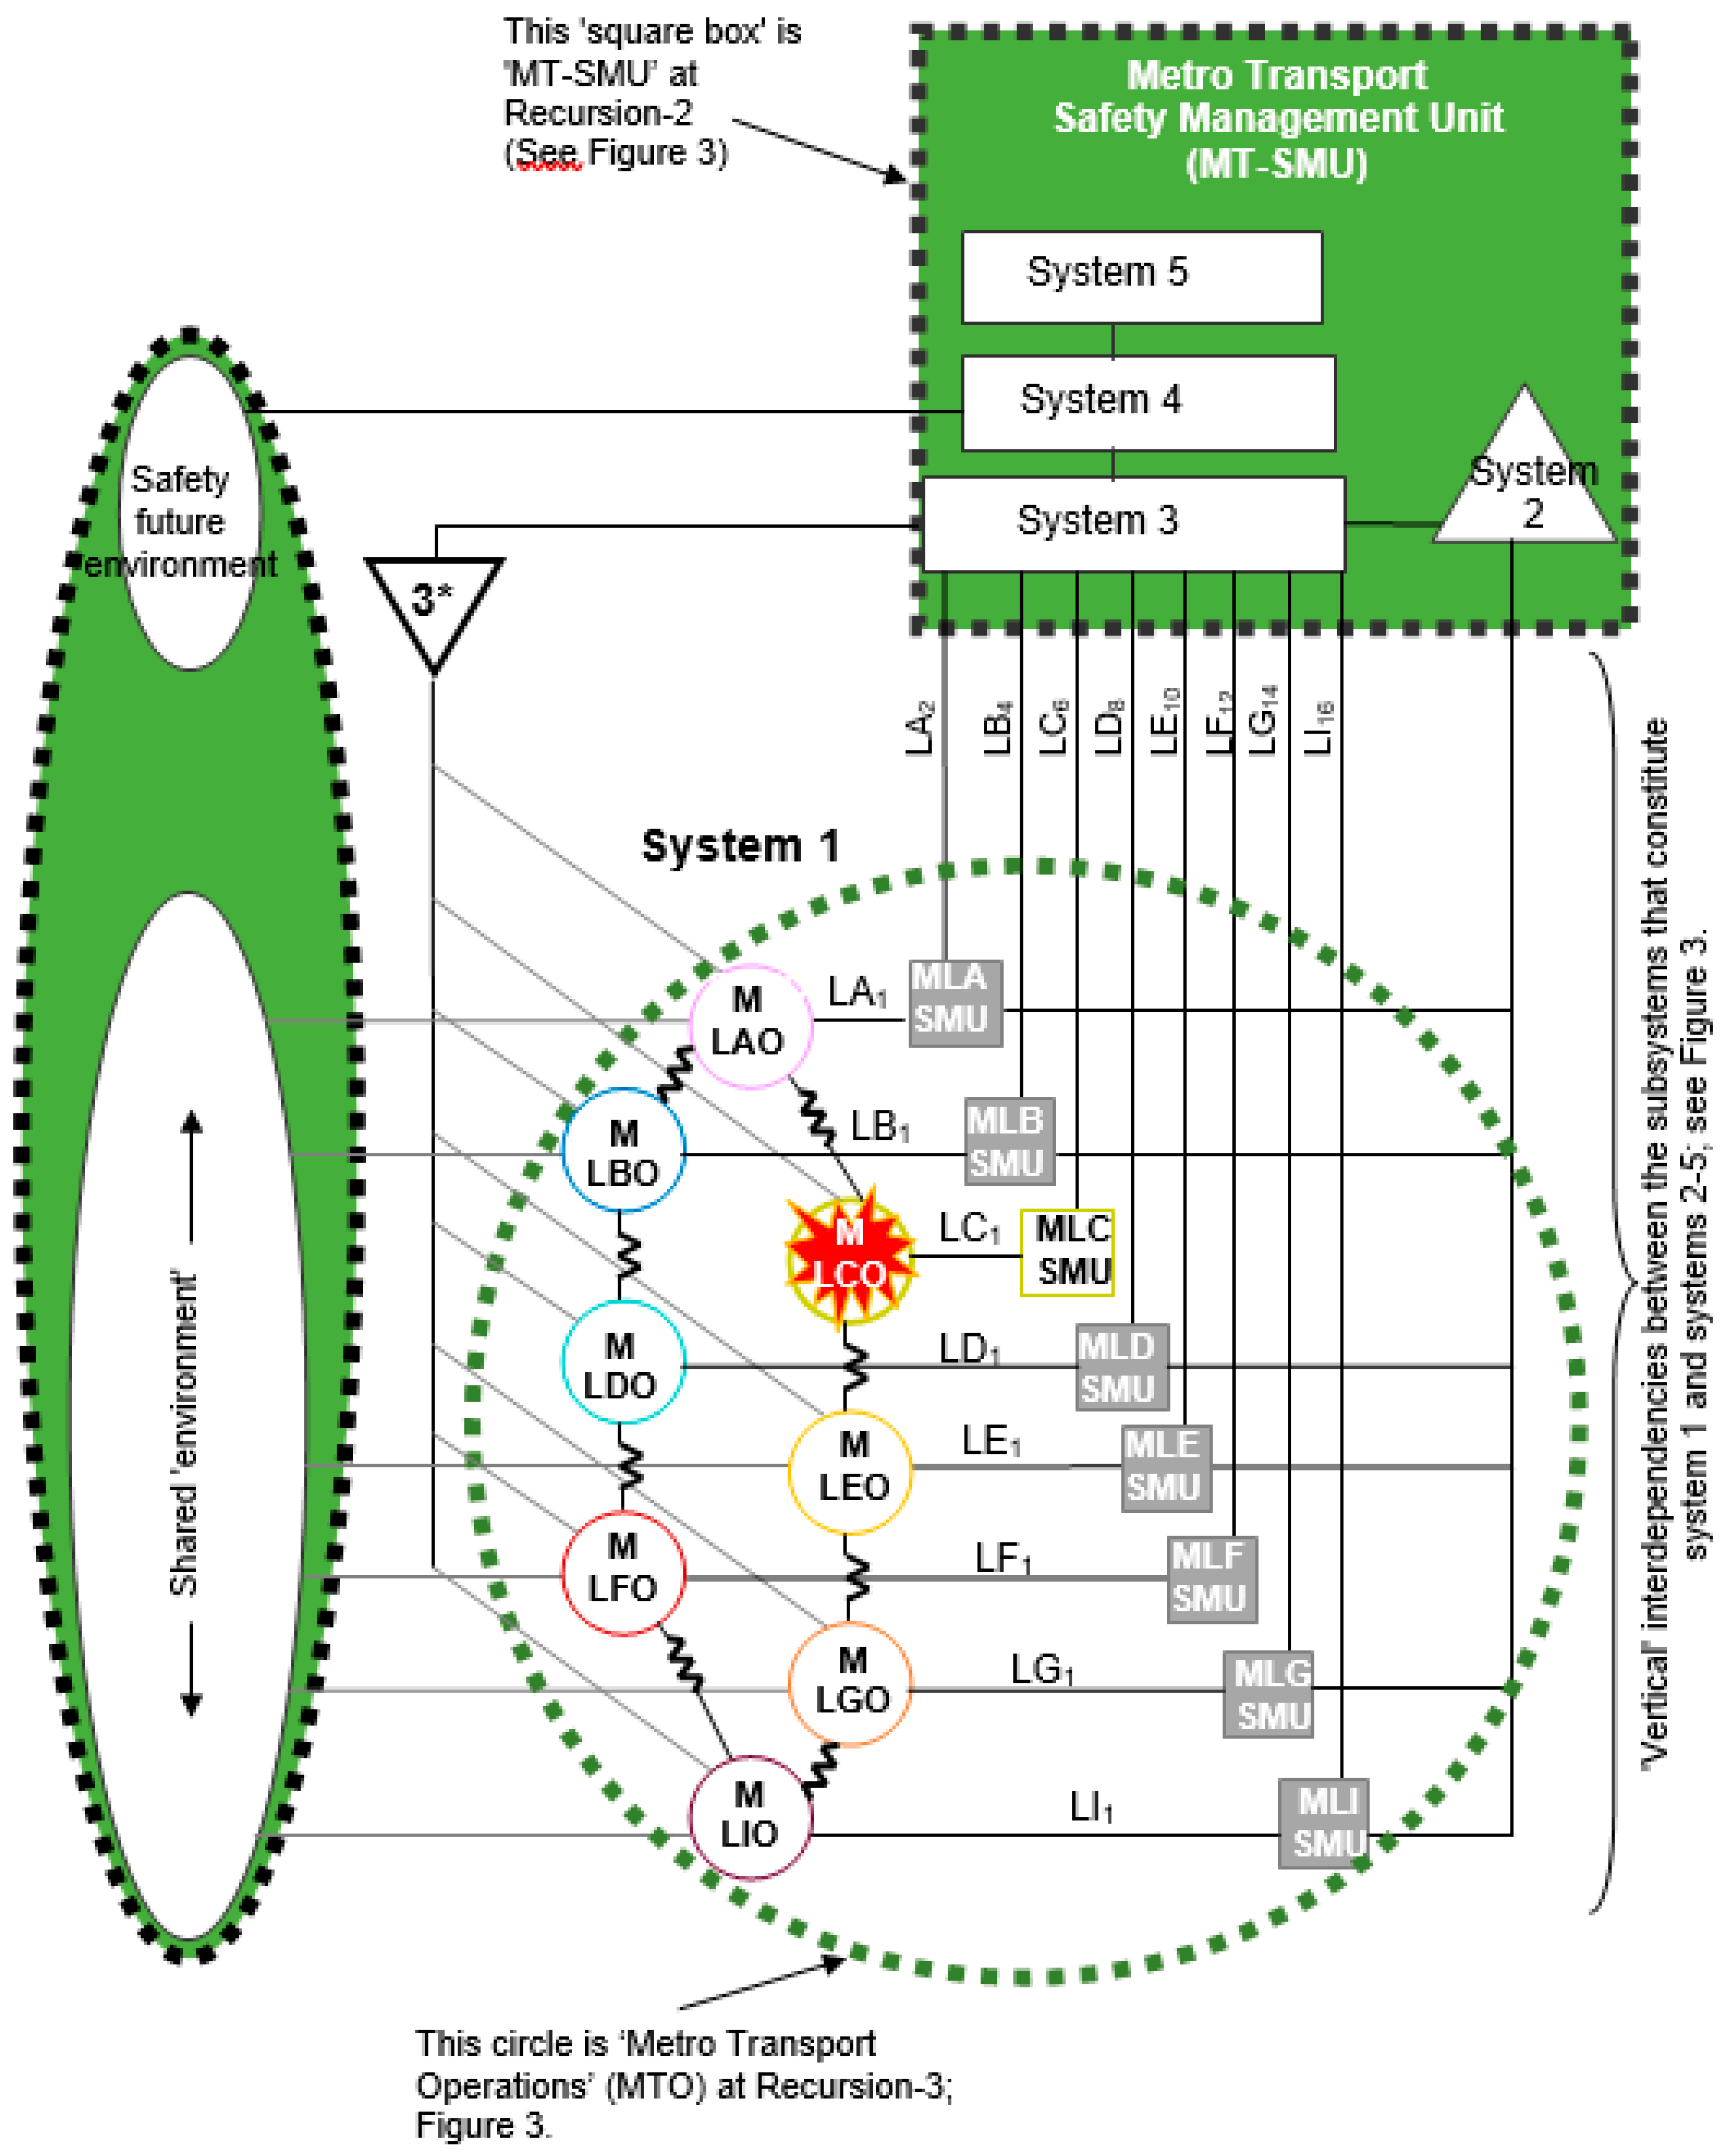
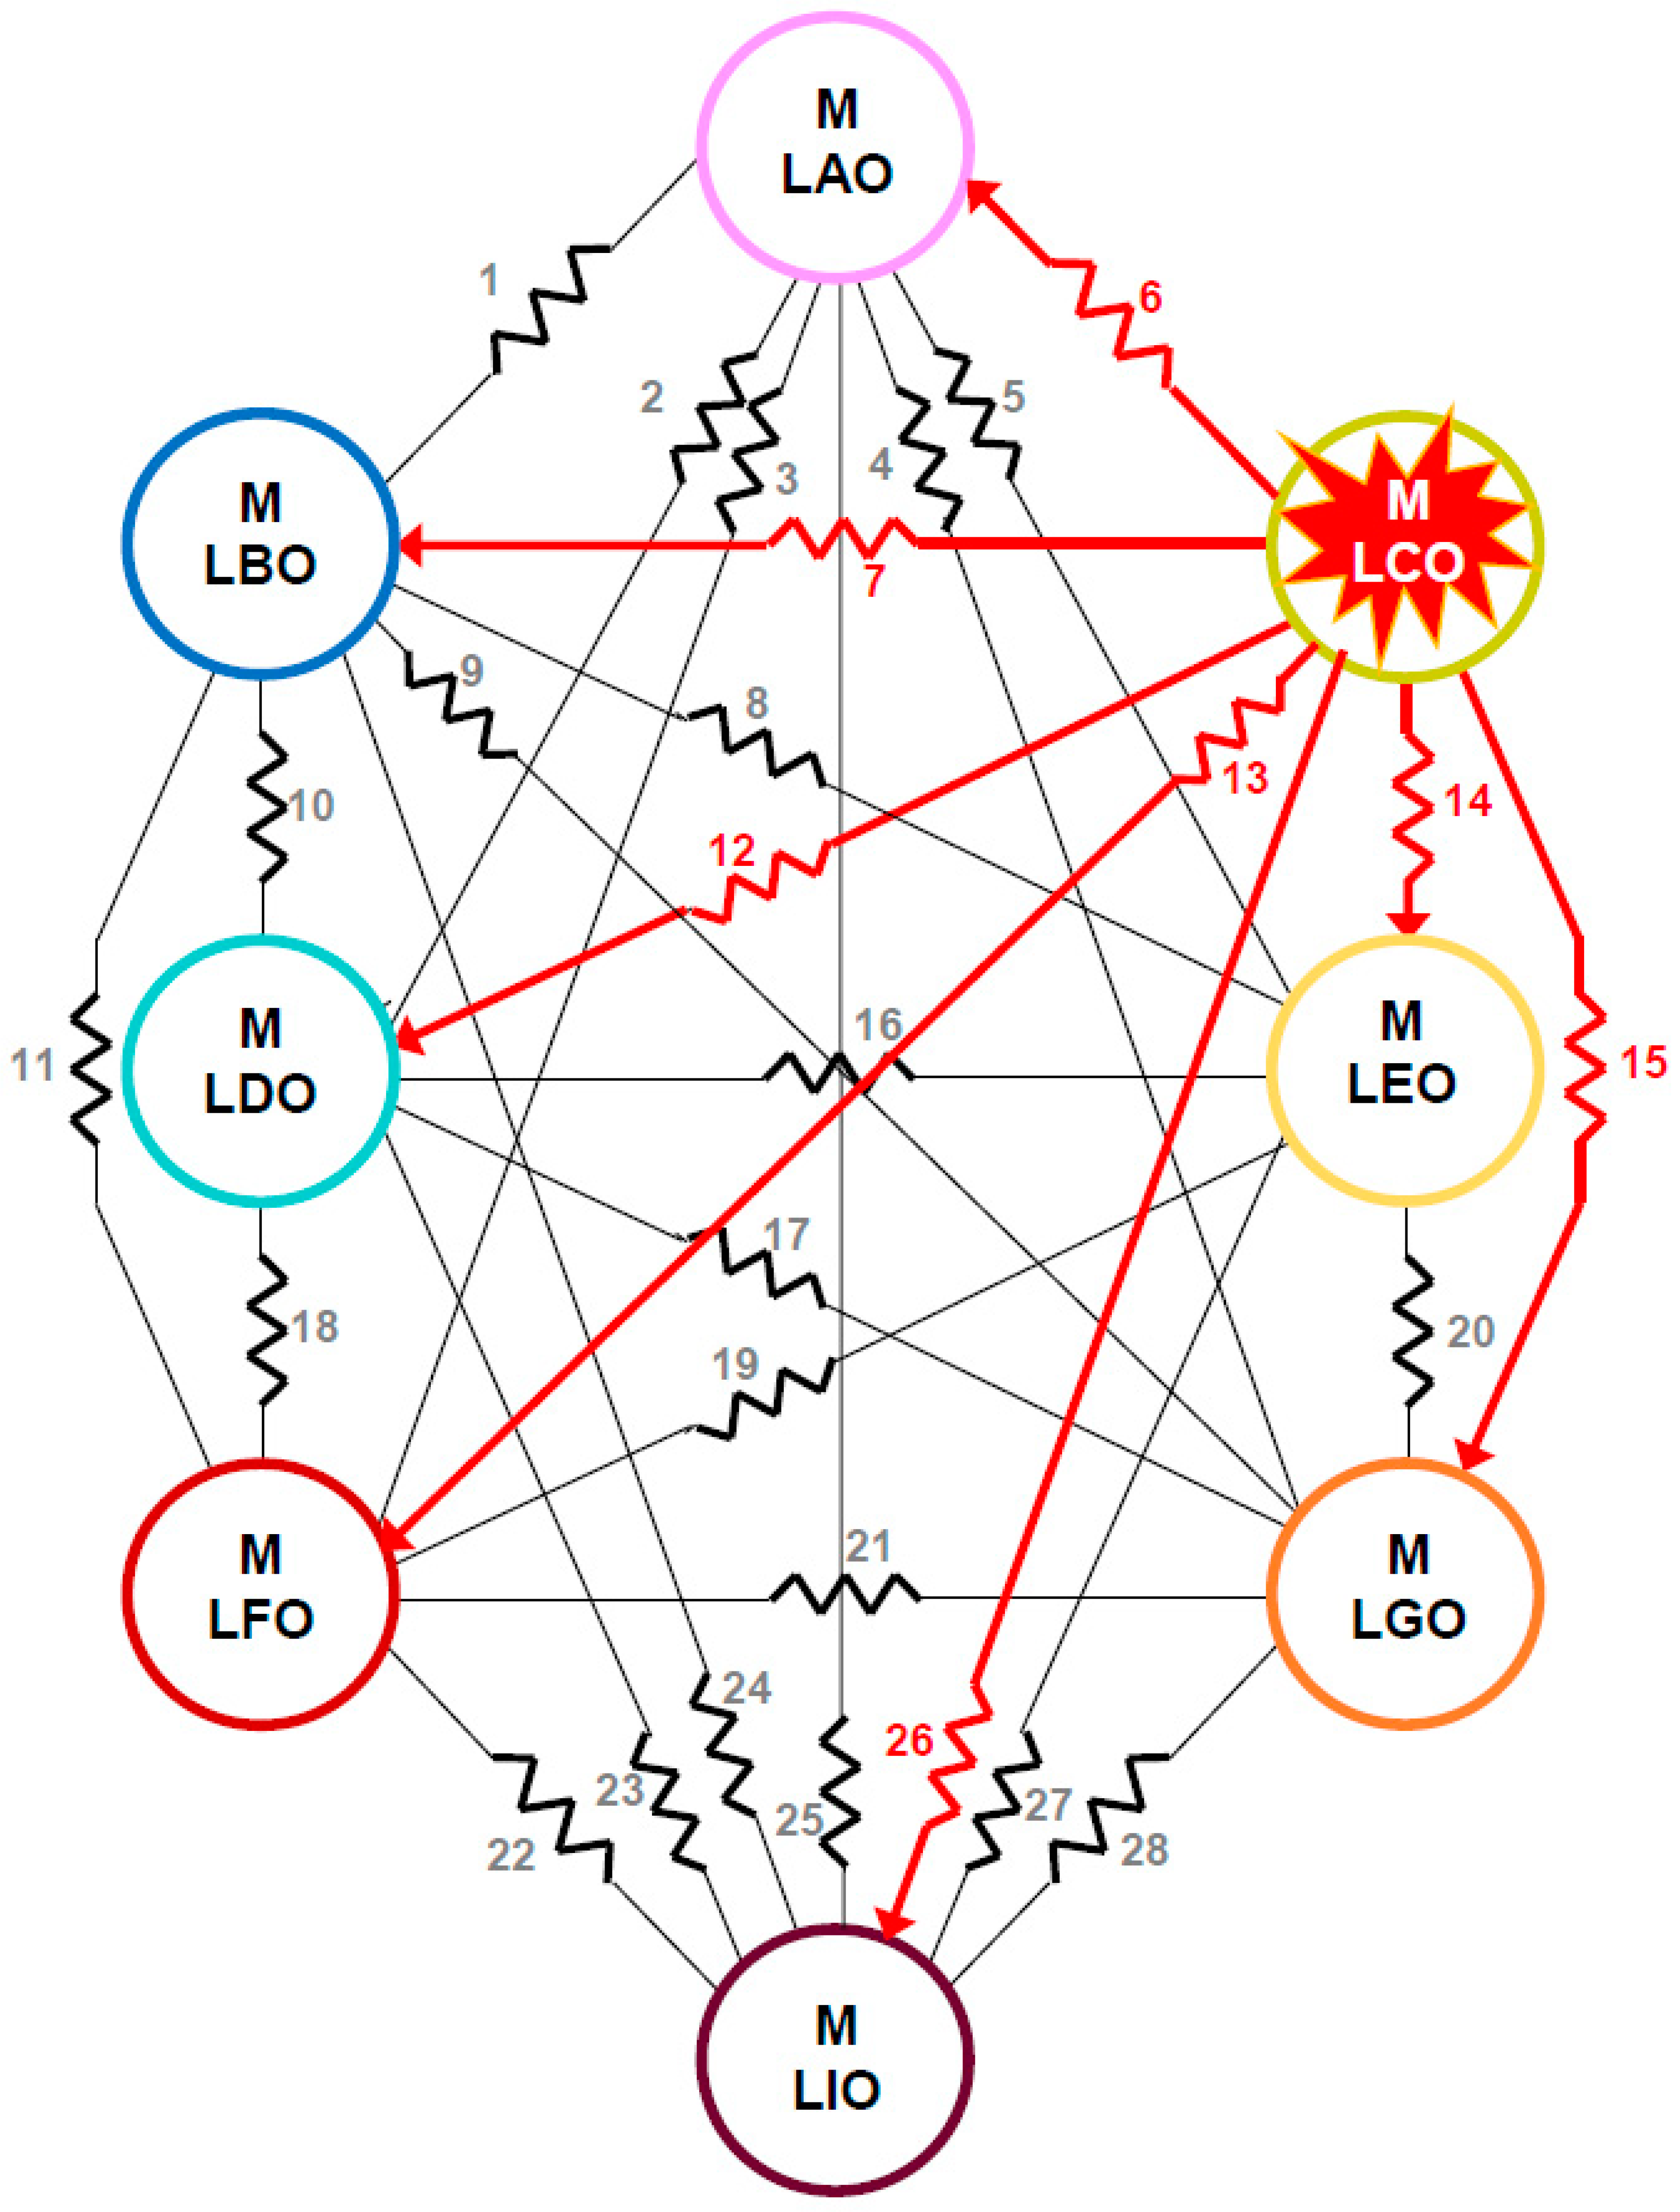
4.2. Failure Propagation Within the Metro Transport Network (Recursion 2 and 3: MT-SMU+MTO, Figures 7 and 8)

The previous section addressed how the incident of the metro line-C affected the other modes of transport of the capital city. However, this section addresses the following question, how the incident affected the other metro lines of the metro system? In the context of the model, the failure propagation could be highlighted by analyzing the subsystems MT-SMU+MTO at Recursion 2 and 3, as shown in Figure 3, Figure 7 and Figure 8.

4.2.1. Horizontal Interdependency (Operational and Managerial)

Operational Interdependency

Figure 8 shows the ‘operational’ interdependency, which are highlighted by the zig-zag lines shown in red color, ‘6′, ‘7′, ’12′, ’13′, ‘14′, ’26′, and ‘15′. Also, it should be mentioned that the figure only shows eight out of the existing twelve metro lines; however, a complete arrangement of the operational interdependency of the metro system is given in [14]). The degree of interdependency could be ‘strong’ (S) or ‘weak’ (W); for example, the metro line-C track failure affected the operation of the metro line-A (MLAO), see the zig-zag line ‘6′. Given that both metro lines shared the transfer Station 10 (Figure 1a), the nature of the interdependency between these two metro lines was considered as having a ‘strong’ relationship. Effectively this was more than evident during the emergency, as commuters heading to the north of the city were severely affected. A ‘weak’ interdependency, on the other hand, was the case when there was not a transfer station between two metro lines, such as the case of Metro Line-C Operations (MLCO) and Metro Line-D Operations (MLDO) (see the zig-zag line ‘12′ in Figure 8).

Managerial Interdependency

Figure 7 shows the channels of communication and control of the metro system in the format of the model. Every metro operation (circle) is connected with a SMU (square box). Also, there is a managerial interdependency, where there is a continuous flow of information as shown in Figure 6 and described in some detail in Section 4.1.1. In the context of the metro system, the station manager performed some of the functions associated with these SMUs. There was some communication between them, but apparently took some time to repair the failed track and to re-start the functioning of the system.

4.2.2. Vertical Interdependency (Managerial)

As mentioned in Section 4.1.2, vertical interdependency occurs between two levels of Recursions only, i.e., Recursions 2 and 3, as seen in Figure 3 and Figure 7. The channels of communication and control between system 1 and System 2–5 represent the vertical interdependency; that is, the lines connecting every SMU’ with System 2–5 (i.e., LA2, LB4, LC6, LD8, LE10, LF12, LG14, and LI16, as shown in Figure 7). In the context of the model, the MT-SMU has the synoptic view of the metro system network as a whole; given this, it can, in principle, coordinate the activities of the SMUs to bring the uncontrolled situation under control, and ultimately to restore the functioning of the metro network. However, the evidence showed that their performance was less than adequate.

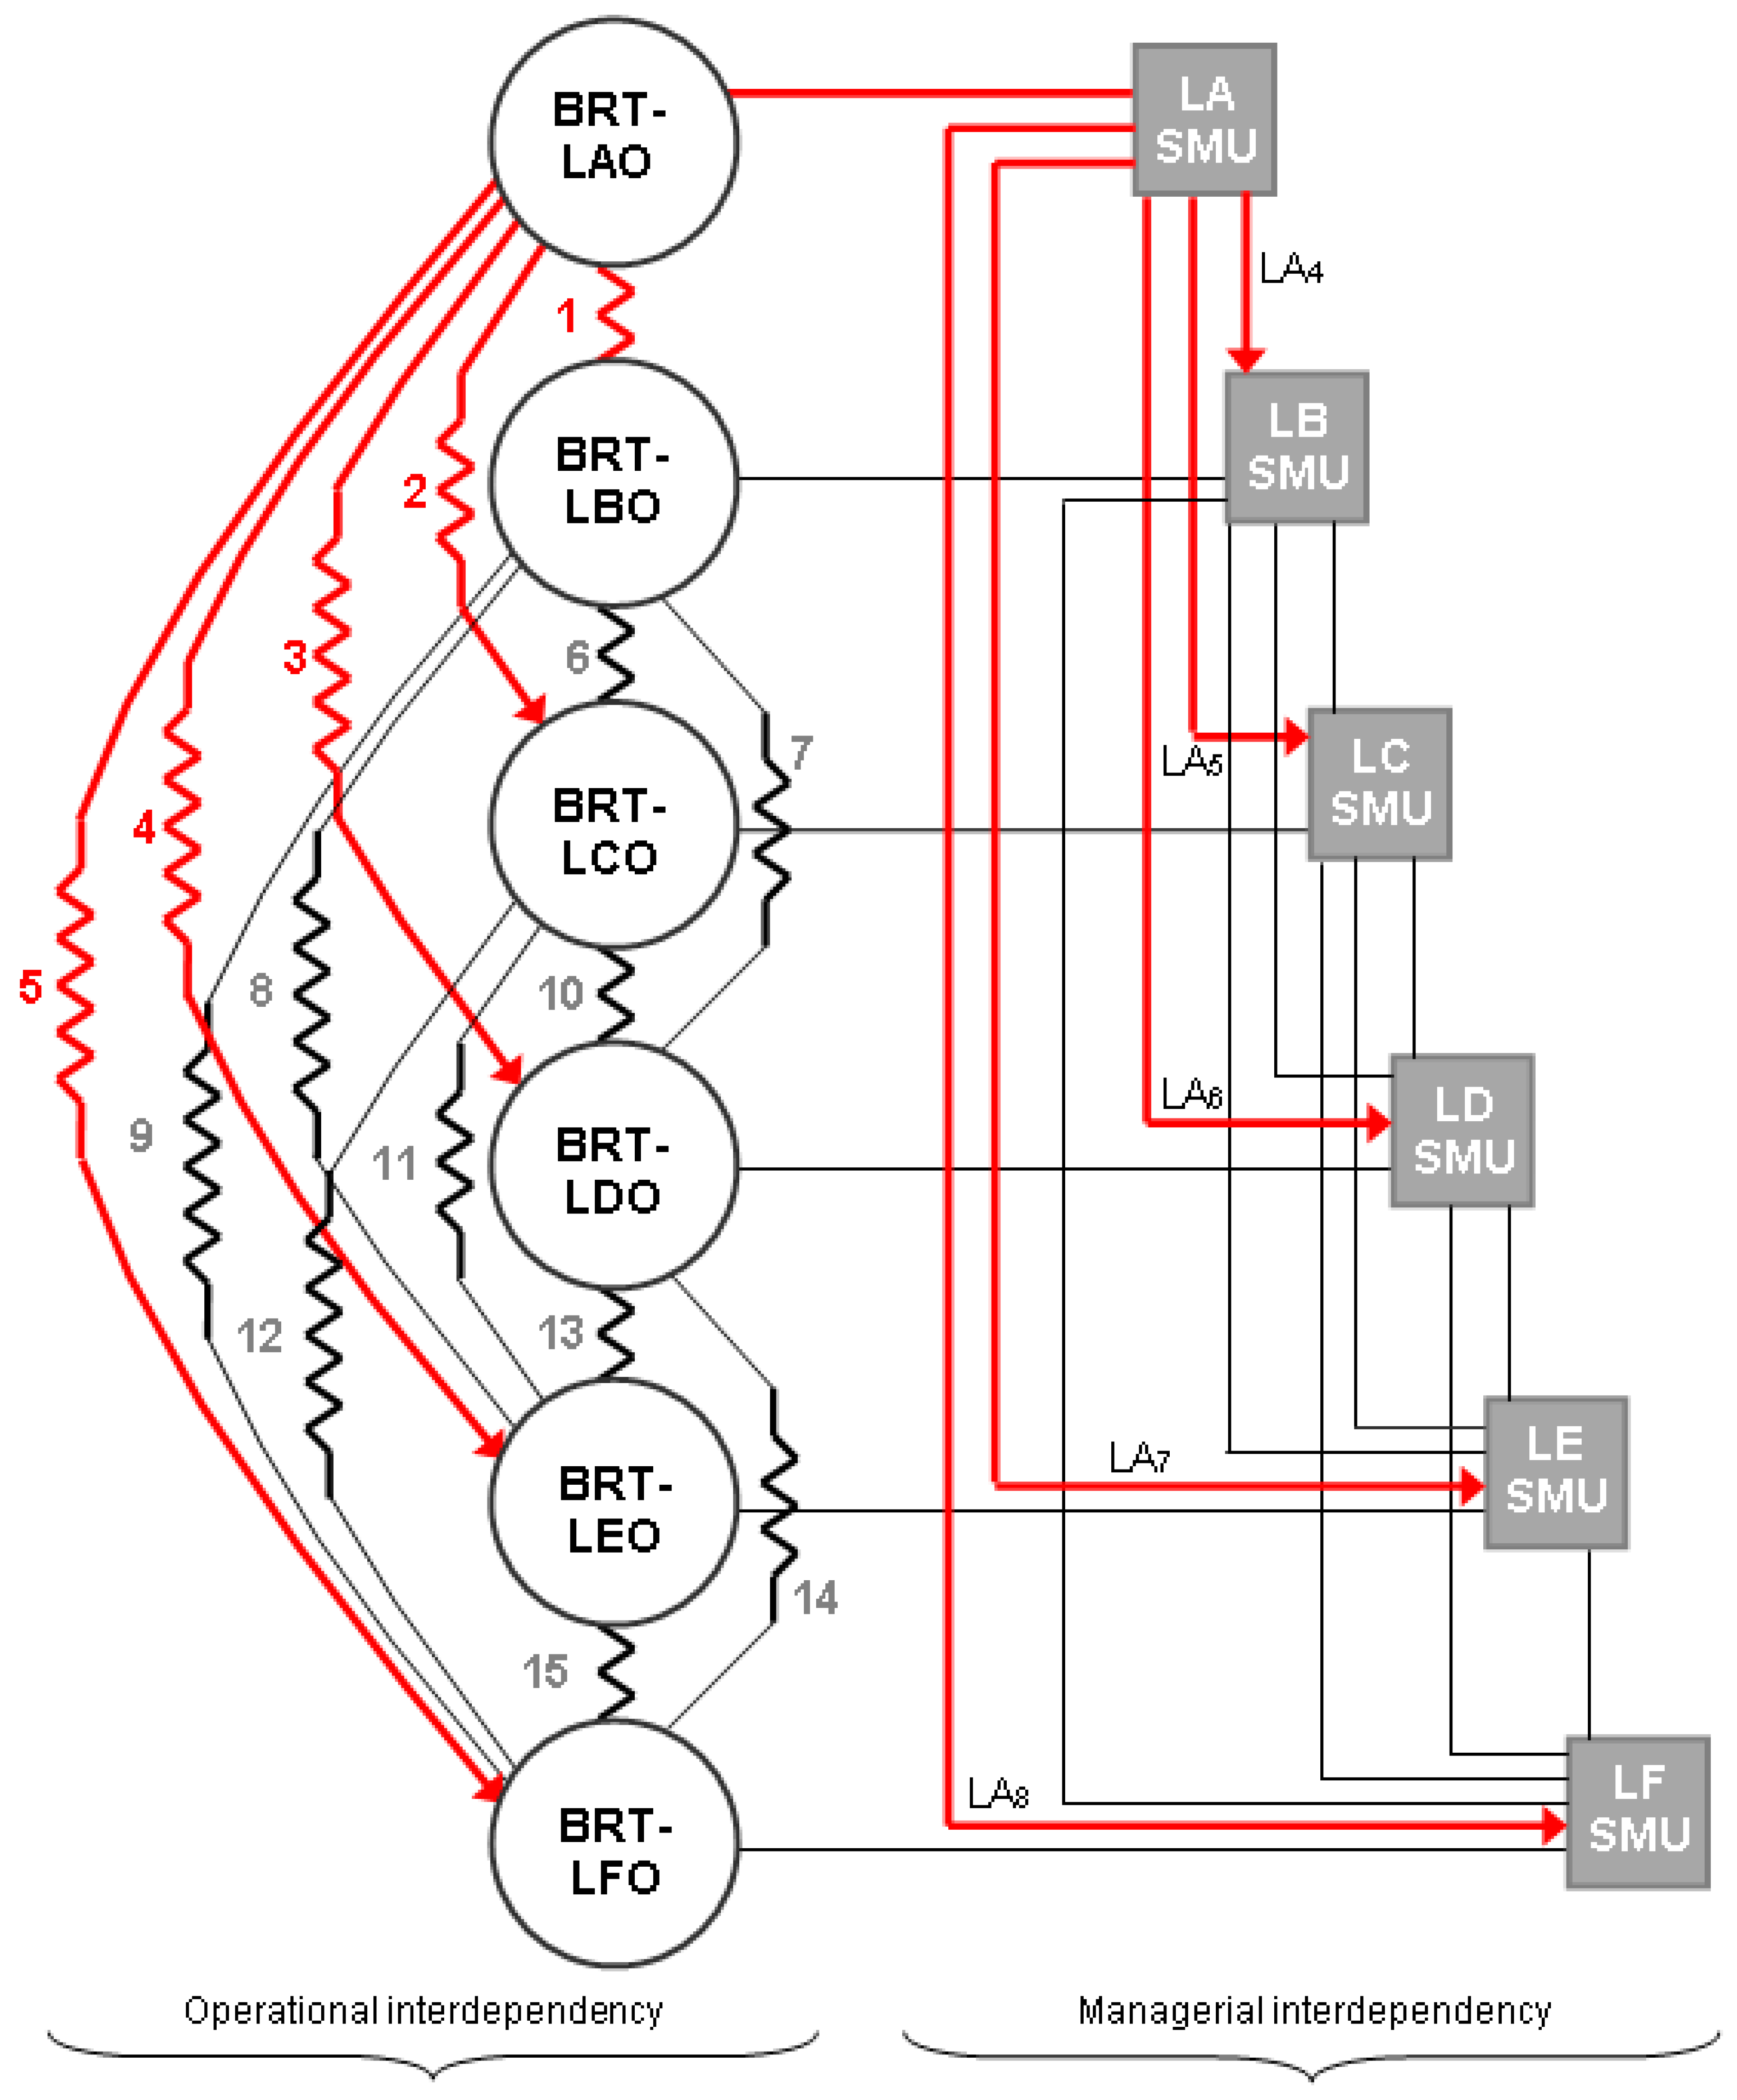
4.3. Failure Propagation within the BRT System Network (Recursion 2 and 3: BRT-SMU+BRTO, Figures 9 and 10)

As mentioned in Section 2, the BRT line-A runs parallel to the affected metro line-C (Figure 1). Geographically, both share the same route, i.e., carrying passengers from north-south-north of the city. Further, they share the same spatial location of the final stop (or terminal) in the north of the city, as shown in Figure 1. Since the BRT line-A was severely affected by the commuters stranded by the failure of the metro system, it was decided to investigate how the failure propagated through the BRT system. The results of the analysis are presented and discussed in the subsequent subsections.

4.3.1. Horizontal Interdependency (Operational and Managerial)

Operational Interdependency

Figure 9 and Figure 10 show the BRT transport system network in the context of the SSMS model, i.e., the ‘structural organization’ (i.e., System 1–5 and their interconnections). These figures have been employed as ‘templates’ for the analysis. Table 3 and Table 4 shows the results.
For the case of the BRT transport system, the criteria to assess the degree of interdependency (i.e., ‘strong’ (S) or ‘weak’ (W)) has been similar to the case of the metro system (Section 4.2.); that is, if there was an interconnection between BRT lines (i.e., when sharing a station in between them); it was considered as a strong interdependency; otherwise, the degree of interdependency was considered as weak. Figure 10 shows how the failure propagated through the whole network (see for example, the zig-zag lines in red color: ‘1′, ‘2′, ‘3′, ‘4′, and ‘5′). According to the results shown in Table 3 and Table 4, there were many BRT lines affected by the overloading of the BRT line-A as a result of the metro track failure (see for example, ‘a’, ‘b’, ‘c’, ‘e’, in Table 3 and Table 4).

Managerial Interdependency

It is unclear how the ‘BRT LA-SMU’ handled the emergency (Figure 9 and Figure 10). Further, it is not clear whether the key decision makers that performed the functions associated with ‘LA-SMU’ detected the emergency in time and acted upon it (Section 2.2). That is because a few minutes after the incident, the following message appeared in ‘Tweeter’ “the metro operation has been suspended from Station 1-9-1” (the numbered stations were added). Also, it is unclear whether the function associated with LA-SMU communicated the emergency to the other BRT-SMUs, i.e., LB-SMU (through the channel ‘LA4′), LC-SMU (through the channel ‘LA5′), LD-SMU (through the channel ‘LA6′), LE-SMU (through the channel ‘LA7′), and LF-SMU (through the channel ‘LA8′), as shown in Figure 10.
What is known is that during the emergency, fifteen additional BRT units were called in to assist the emergency. However, these were not enough to cope with the disruption; the evidence showed that the stations were packed with commuters desperately trying to get into the stations (Figure 2b). The situation got worst given the fact that the police guarding the stations did not allow the commuters to get in during the few minutes after the metro incident; as mentioned earlier on, the police actions contributed to the chaotic situation. It is clear that the police did not know what to do (they did not receive the instructions, and it seemed that there were confusion on what actions to take); this clearly highlights that the decision-maker who performed the function associated with LA-SMU was less than adequate.

4.3.2. Vertical Interdependency (Managerial)

Again, vertical interdependency occurs between the levels of Recursion 2 and 3; that is, the channels connecting the two are the following: LA2, LB4, LC6, LD8, LE10, and LF12, as shown in Figure 9. Given the fact that tens of thousands of stranded commuters, it is difficult to see whether an effective communication and control did take place during the emergency. The so-called “Centre for Command, Control, Computing, Communications and Citizen Contact (C5)” performed some of the functions related to System 2, at Recursion 2 (Figure 9).
According to the evidence during the emergency, the only action that the BRT-SMU took was that fifteen more BRT units were sent to mitigate the impact of the emergency; however, the corrective action failed during the emergency.

4.4. Discussion

Cities may be regarded as complex systems; that is, they are open systems, complex and exhibiting a chaotic behavior [45,46,47]. Further, their components are highly interdependent; this is clearly seen, for example, when a disruption occurs in one of its constituent parts. There are numerous examples of chaotic disruptions in cities as a result of either a technological failure [24,25,26,48,49] or due to natural hazards [22,50].
One of such examples of a disruption of the transport system, a critical infrastructure, occurred in Mexico City in 2017. The paper has presented the results of an analysis on how the metro track failure caused a disruption in the capital city’s transport system. The approach has been the use of a ‘systemic safety management system’ (‘SSMS’) model [14,27,28,29,30,31,32,33,34,35,36]. A key consideration for the analysis has been that the Mexico City’s transport system has been considered as a ‘system’, i.e., ‘any entity which is made of interdependent parts’ [14].

4.4.1. On the Commuter’s Destination Patterns

As mentioned in Section 2.2., the track failure affected tens of thousands of commuters, and raised the following questions: why was that so many people were heading to the north of the city? Why were the reasons commuters were aiming at reaching both the metro and BRT station No. 1 (Figure 1)? The responses to these questions have to do with the patterns of the urban mobility phenomena in megacities, such as the capital city (Section 2.1.). Origin-Destination (OD) surveys (and related studies) may be regarded as a way of knowing commuters’ destination patterns [51,52,53,54].
The study on OD conducted in Mexico City [37] may provide the answer on why commuters were so desperate to get into the north of the city. The findings of the study showed that from a total of 17.09 million of trips made between Mexico City and other municipalities from the neighboring state of Mexico (i.e., the ZMVM), 12.6% (2.25 million trips) of the trips took place between the metropolitan area and the capital city. That is, people commute to Mexico City mainly to work and effectively they were the most affected by the failure of the metro system, when heading back home. It is thought once they have reached Station No. 1 (Figure 1), then, from there they must take another bus to their homes [37].
One of the key lessons that can be inferred from the above is that those that performed the functions associated with System 2 (including the MCT-SMU, Figure 6) should consider this scenario when designing an emergency response plan. In particular, when dealing with the case of a transport disruption, such as the present case.

4.4.2. On the Failure Propagation

Figure 3 shows how the ‘Mexico City Transport’ system has been de-composed into the subsystems of interest (i.e., the case of the metro and the BRT transport systems). Also, the figure shows how these are interrelated horizontally and vertically (Section 3.3 and Section 4.1.1).
In the model, the operational (circles) interdependencies are shown with zig-zag lines amongst them. For example, the results shown in Table 1 and Table 2, indicate that all the modes of road transportation available during the emergency could not cope with vast number of commuters desperately trying to get home. It may be argued that during the emergency there was a ‘strong’ interdependency amongst these modes of road transport. Further, each of these lacked the capacity to cope with the number of commuters because of a number of reasons: a) each of the modes were already under full operational capacity, given the fact that the emergency occurred at rush hour (i.e., 18:19 h, Section 2.2.); b) given the track failure, about 50% of the metro line-C was not operational; that is, the available modes of transport at the time had to cope with about 45,000 additional passengers; and c) most (if not all) of the commuters were heading to the north of the city (Figure 1).
But what are the implications of the analysis? What has been the most important lesson after conducting the analysis? The answer has to do with co-ordination, i.e., the lack of it in the present analysis. Similar findings have been reported in the literature; for example, in [55], it has been argued that managing the interdependencies between urban infrastructures, “coordination” is the key factor in the urban infrastructure provision process.
Effectively, the transport system is exceedingly complex and highly interconnected. As mentioned in Section 4.1.1, any deviation from an accepted criterion (e.g., a track failure), the failure propagated in both directions vertically and horizontally (Figure 3 and Figure 6). Further, if these disruptions are not controlled, then by now we should be very familiar with the consequences in terms of property/human/economic losses [3,4,50,56,57]. In the SSMS model, System 2 deals with the co-ordination function explicitly (see the triangle shaped symbol within the big square box in Figure 4, Figure 6, Figure 7 and Figure 9). That is, the function of System 2 is to coordinate all the activities of the subsystems that form part of System 1 (e.g., MT-SMU, TX-SMU, BRT-SMU, PC-SMU, and PB-SMU, each with their associated operations (circles), as shown, for example, in Figure 6).
Before discussing in some detail of the functioning of the coordination function (System 2), it may be necessary to understand how the failure propagated through the total transport system. In our case study, at the level 3 (or Recursion 3) in Figure 3, the disruption originated in the metro line-C operations (MLCO) and from there it affected the whole transport system, i.e., first, it affected the metro line-C operations (Figure 1a); second, it affected the other metro lines intersecting the metro line-C (e.g., MLAO to MLIO, as shown in Figure 8); third, the disruption spread vertically to Recursion 2 (or level 2), i.e., MTO, TXO, BRTO, PCO, and PBO, each with their associated SMUs (square boxes), as shown in Figure 3 and Figure 4; fourth, if uncontrolled, it would affect other critical infrastructures at Recursion 1, i.e., ESO (Energy Supply Operations), WSO (Water Supply Operations), etc. In short, the failure propagates horizontally (at every level of Recursion) and vertically (between levels of Recursion), as shown in Figure 3.
The above raises the question as to how to deal with an uncontrolled failure propagation? The solution has to do with System 2 (a co-ordination function). To illustrate how this works, consider the BRT subsystem (‘BRTO+BRT-SMU’) and the metro subsystem (‘MTO+MT-SMU’) and Figure 3, Figure 4 and Figure 6. Apparently, there is no connection between these two modes of transport; however, commuters use both systems to get to their destinations after work and vice-versa (Table 1). Suppose the former mode under normal conditions, BRTO receives some of the commuters from the metro line-C, which runs parallel to it (Figure 1), through the zig-zag line ‘2′ connecting them (Figure 5). Again, under normal conditions BRT-SMU is aware of this when planning, for example, on the number of BRT buses running. (It is also true the other way around, i.e., some BRT users take the metro to commute daily). Referring to Figure 6, now suppose that a failure occurs in metro line-C, as was the case, its operations were severely affected. In ‘MT-SMU’ this will be detected in ‘action-point’ ‘1′, and the re-planning action process to bring it back to normal operations is carried out through ‘action-points’ ‘2–3–4–5′ (note that ‘2′, ‘2A’, ‘4′, and ‘4A’ are actions taken by System 2), as shown in Figure 6. Also, the MCT-SMU will be alerted (though action point ‘4A’), so that it will do what it needs to be done to bring the operations back to normal operations.
But the questions are, what would be the impact on the BRT system (i.e., ‘BRTO+BRT-SMU’)? Was the BRT-SMU informed about the metro disruption? How many additional BRT buses may be needed to cope with the uncontrolled situation? Will they charge the affected commuters? Will they allow the use of the BRT lanes, for example, to other modes of transport? In the context of the model, these and many other questions are address within System 2 in BRT-SMU.
To make things worse, there were other modes of transport affected too, i.e., TX-SMU, PC-SMU, PB-SMU (Figure 6). Again, were they informed about the disruption? Were they kept informed about the details of the congestion, if any, caused by the disruption?
Regarding the present case study none of the above was the case at the time of the disruption; as mentioned in Section 4.1 and Section 4.2, ‘C5′ performed some of the functions associated with System2; however, its performance was less than adequate. As shown in Figure 2, the scenes were chaotic and effectively there was a lack of coordination among the key organizations involved in running the transport system in the capital city. Again, coordination is a key concept when managing urban infrastructures [55].
To summarize, the function of System 2 (co-ordination) is two-fold (Figure 6): first, if a departure from an accepted criterion occurs in ‘action-point’ ‘1′ (e.g., disruption in the metro operations) is automatically relayed to the other SMUs by action-point ‘2A’. The System 2 within other SMUs can immediately evaluate the effect on their operations (circle). In short, the function of MT-SMU is to first and foremost to discover what went wrong, what made this happen, and to devise measures to put it right. Secondly, the System 2 in MCT-SMU (Figure 6), receiving all this information (action point ‘4A’), is enabled to take a ‘high-order’ view of the total consequences of the total system (i.e., the Mexico City’s transport systems as a whole). It will report to System 3, which in turn, can make corrective action, for example, through channels M2, TX4, BRT6, PC8, and PB11, as shown in Figure 4.

5. Conclusions

The paper has presented an analysis of the disruption caused by the failure of a metro track that propagated through Mexico City’s transport system network. The metro-line C track failure occurred at peak hour when tens of thousands of commuters were heading to their homes. According to official figures, it is believed that about 45,000 commuters were affected. The approach taken to conduct the analysis has been the use of a ‘Systemic Safety Management System’ (‘SSMS’) model. The main conclusions were the following:
a)
Overall, the systemic model has demonstrated its potential to be employed in the analysis of critical infrastructure interdependency, such as the present case study. It has shown that the complexity of the Mexico City transport system, as a whole, can be reduced by mapping it onto the format of the ‘structural organization’ (i.e., System 1–5) of the model. Moreover, it has shown that the failure propagates vertically and horizontally. Furthermore, the model has highlighted that failure propagation amongst critical infrastructures has to do with a coordination function.
b)
In relation to the case study, it has been found that the actions taken by the key decision-makers that performed some of the functions related to System 2 (a coordination function) were less than adequate.
c)
The commuters traveling patterns should be considered when designing emergency plans in case of a disruption of the transport system.
d)
More generally, there is a need for designing a system to manage critical infrastructure protection in the context of Mexico.

Author Contributions

Conceptualization: J.S.R.; methodology: J.S.R.; writing—original draft: J.S.R.; writing—review and editing: J.S.R. and A.N.B.; data curation: D.P.R.; investigation: D.P.R.; validation: A.N.B.

Funding

This research was funded by IPN under the following grant: SIP-IPN: No-20196424.

Conflicts of Interest

The authors declare no conflict of interest.

References

  1. UNSD. United Nations Sustainable Goals-Goal 11: Make cities inclusive, safe, resilient and sustainable. United Nations Sustainable Development. 2015. Available online: https://www.un.org/sustainabledevelopment/cities/ (accessed on 23 March 2019).
  2. BMZ. Urban Mobility-Strategies for Liveable Cities; Federal Ministry for Economic Cooperation and Development: Bonn, Germany, 2017. [Google Scholar]
  3. Rajé, F.; Tight, M.; Pope, F.D. Traffic pollution: A search for solutions for a city like Nairobi. Cities 2018, 82, 100–107. [Google Scholar] [CrossRef]
  4. Yua, Y.; Yang, X.; Li, K. Effects of the terms and characteristics of cadres on environmental pollution: Evidence from 230 cities in China. J. Environ. Manag. 2019, 232, 179–187. [Google Scholar] [CrossRef]
  5. Weisbrod, G.; Mulley, C.; Hensher, D. Recognising the complementary contributions of cost benefit analysis and economic impact analysis to an understanding of the worth of public transport investment: A case study of bus rapid transit in Sydney, Australia. Res. Transp. Econ. 2016, 9, 450–461. [Google Scholar] [CrossRef]
  6. Wöhrnschimmel, H.; Zuk, M.; Martínez-Villa, G.; Ceron, J.; Cardenas, B.; Rojas-Bracho, L.; Fernandez-Bremauntz, A. The impact of a Bus Rapid Transit system on commuter’s exposure to Benzene, CO, PM2.5 and PM10 in Mexico City. Atmos. Environ. 2008, 35, 8194–8203. [Google Scholar]
  7. Peprah, C.; Amponsah, O.; Oduro, C. A system view of smart mobility and its implications for Ghanian cities. Sustain. Cities Soc. 2019, 44, 739–747. [Google Scholar] [CrossRef]
  8. PCCIP (President’s Commission on Critical Infrastructure Protection). Critical Foundations: Protecting America’s Infrastructures. 1997. Available online: http://www.ciao.gov (accessed on 18 February 2018).
  9. Rehak, D.; Senovsky, P.; Hromada, M.; Lovecek, T.; Novotny, P. Cascading impact assessment in a critical infrastructure system. Int. J. Crit. Infrastruct. Prot. 2018, 22, 115–138. [Google Scholar] [CrossRef]
  10. Huang, C.N.; Liou, J.H.; Chuang, Y.C. A method for exploring the interdependencies and importance of critical infrastructures. Knowl. Based Syst. 2014, 55, 66–74. [Google Scholar] [CrossRef]
  11. Panzieri, S.; Setola, R. Failures propagation in critical interdependent infrastructures. Int. J. Model. Identif. Control 2008, 3, 69–78. [Google Scholar] [CrossRef]
  12. Rosato, V.; Issacharoff, L.; Tiriticco, F.; Meloni, S.; De Porcellini, S.; Setola, R. Modelling interdependent infrastructures using interacting dynamical models. Int. J. Crit. Infrastruct. 2008, 4, 63–79. [Google Scholar] [CrossRef]
  13. Singh, A.N.; Gupta, M.P.; Ojha, A. Identifying critical infrastructure sectors and their dependencies: An Indian scenario. Int. J. Crit. Infrastruct. Prot. 2014, 7, 71–85. [Google Scholar] [CrossRef]
  14. Santos-Reyes, J.; Padilla-Pérez, D.; Beard, A.N. Modelling critical infrastructure interdependency: The case of the Mexico City Metro transport system. Hum. Ecol. Risk Assess. Int. J. 2015, 21, 1428–1444. [Google Scholar] [CrossRef]
  15. Seppanen, H.; Luokkala, P.; Zhang, Z.; Torkki, P.; Virrantaus, K. Critical infrastructure vulnerability – A method for identifying the infrastructure service failure interdependencies. Int. J. Crit. Infrastruct. Prot. 2018, 22, 25–38. [Google Scholar] [CrossRef]
  16. CISA (Cybersecurity and Infrastructure Security Agency). Critical infrastructure sectors. 2019. Available online: https://www.dhs.gov/cisa/critical-infrastructure-sectors (accessed on 15 August 2019).
  17. CPNI (Centre for the Protection of National Infrastructure). Critical National Infrastructure. 2018. Available online: https://www.cpni.gov.uk/critical-national-infrastructure-0 (accessed on 15 August 2019).
  18. PSC (Public Safety Canada). National Cross Sector Forum-2018-2020 Action Plan for Critical Infrastructure. 2019. Available online: https://www.publicsafety.gc.ca/cnt/rsrcs/pblctns/pln-crtcl-nfrstrctr-2018-20/index-en.aspx#a11 (accessed on 15 August 2019).
  19. Hoterová, K.; Dvorák, Z.; Blaho, P. Objectification of criteria for a critical infrastructure elements in the rail transport sub-sector. Transp. Res. Procedia 2019, 40, 1349–1355. [Google Scholar] [CrossRef]
  20. Borradá, J.; Valdés, B. Strategic infrastructures. SeguriLatam-Integral Security Magazine, 2018; 10–12. (In Spanish) [Google Scholar]
  21. Calderon, J.L. Critical infrastructure in Mexico: The approach to the future. SeguriLatam-Integral Security Magazine, 2018; 10–12. (In Spanish) [Google Scholar]
  22. The Guardian. Available online: https://www.theguardian.com/uk-news/2018/jul/28/delays-to-flights-ferries-and-eurotunnel-after-storms-across-europe (accessed on 28 August 2019).
  23. Chunlei, W.; Lan, F.; Yiqi, D. National Critical Infrastructure Modeling and Analysis Based on Complex System Theory. In Proceedings of the 2011 First International Conference on Instrumentation, Measurement, Computer, Communication and Control, Beijing, China, 21–23 October 2011; pp. 832–836. [Google Scholar]
  24. Malandri, C.; Fonzone, A.; Cats, O. Recovery time and propagation effects of passanger transport disruptions. Phys. A 2018, 505, 7–17. [Google Scholar] [CrossRef]
  25. Gahemi, N.; Zilco, A.A.; Yan, F.; Cats, O.; Kurowicka, D.; Goverde, M.P. Impact of railway disruption predictions and rescheduling on passenger delays. J. Rail Transp. Plan. Manag. 2018, 8, 103–122. [Google Scholar] [Green Version]
  26. Sun, X.; Wandelt, S. Complementary strengths of airlines under network disruptions. Saf. Sci. 2018, 103, 76–87. [Google Scholar] [CrossRef]
  27. Santos-Reyes, J.; Beard, A.N. A Systemic Analysis of the Paddington Railway Accident. J. Rail Rapid Transit Proc. Imeche Part F 2006, 220, 121–151. [Google Scholar] [CrossRef]
  28. Santos-Reyes, J.; Beard, A.N. A systemic analysis of the Edge-Hill railway accident. Accid. Anal. Prev. 2009, 41, 1133–1144. [Google Scholar] [CrossRef]
  29. Santos-Reyes, J.; Beard, A.N. A Systemic Approach to Safety Management on the British Railway System. Civ. Eng. Environ. Syst. 2003, 20, 1–21. [Google Scholar] [CrossRef]
  30. Santos-Reyes, J.; Beard, A.N.; Smith, R.A. A Systemic Analysis of Railway Accidents. J. Rail Rapid Transit Proc. Imeche Part F 2005, 219, 47–65. [Google Scholar] [CrossRef]
  31. Santos-Reyes, J.; Beard, A.N. Applying the SDMS model to the analysis of the Tabasco flood disaster in Mexico. Hum. Ecol. Risk Assess. Int. J. 2011, 17, 646–677. [Google Scholar] [CrossRef]
  32. Santos-Reyes, J.; Beard, A.N. An analysis of the emergency response system of the 1996 channel tunnel fire. Tunn. Undergr. Space Technol. 2017, 65, 121–139. [Google Scholar] [CrossRef]
  33. Santos-Reyes, J.; Beard, A.N. An analysis of the 1996 Channel Tunnel fire. J. Rail Rapid Transit: Proc. ImechePart F 2017, 231, 850–876. [Google Scholar] [CrossRef]
  34. Santos-Reyes, J.; Beard, A.N. A systemic approach to safety management. J. Loss Prev. Process Ind. 2008, 21, 15–28. [Google Scholar] [CrossRef]
  35. Santos-Reyes, J.; Beard, A.N. A SSMS model with application to the oil gas industry. J. Loss Prev. Process Ind. 2009, 22, 958–970. [Google Scholar] [CrossRef]
  36. Santos-Reyes, J.; Beard, A.N. A systemic approach to fire safety management. Fire Saf. J. 2001, 36, 359–390. [Google Scholar] [CrossRef]
  37. INEGI. Origin-Destination Survey in Households of the Metropolitan Zone of Valley of Mexico; INEGI: Aguascalientes, México, 2017. (In Spanish) [Google Scholar]
  38. Padilla-Pérez, D.; Santos-Reyes, J. Report on the Failure of the Metro Line 3; SEPI- ESIME, Zac., Instituto Politécnico Nacional: Mexico City, Mexico, 2017. (In Spanish) [Google Scholar]
  39. UN (United Nations). World Urbanization Prospects: The 2003 Revision, Data, Tables and Highlights; United Nations: New York, NY, USA, 2004. [Google Scholar]
  40. FIMEVIC. Diagnosis of the Mobility of People in Mexico City; Mexico City Government: Mexico City, Mexico, 2017. (In Spanish) [Google Scholar]
  41. Metrobus. Mexico City’s Metrobus. 2019. Available online: Data.metrobus.cdmx.gob.mx/mapa.html (accessed on 23 March 2019).
  42. Beer, S. The Heart of Enterprise; Wiley: Chichester, UK, 1979. [Google Scholar]
  43. Fortune, J.; Peters, G. Learning from Failure; Wiley: Chichester, UK, 1995. [Google Scholar]
  44. C5. Mexico City’s C5. 2018. Available online: https://www.c5.cdmx.gob.mx/ (accessed on 23 March 2019).
  45. Allen, P.M.; Sanglier, M. Urban evolution, self-organization and decision making. Environ. Plan. A 1981, 13, 169–183. [Google Scholar] [CrossRef]
  46. Batty, M. Cities and Complexity: Understanding Cities with Cellular Automata, Agent-Based Models, and Fractals; MIT Press: Cambridge, MA, USA, 2005. [Google Scholar]
  47. Portugali, J. Complexity Cognition and the City; Springer: Heidelberg/Berlin, Germany, 2011. [Google Scholar]
  48. Janic, M. Modelling the resilience of an airline cargo transport network affected by a large-scale disruptive event. Transp. Res. Part D 2019. [Google Scholar] [CrossRef]
  49. Withnall, A. Waterloo disruption: London station in chaos as overrunning engineering works see all trains cancelled. Independent, 2019. Available online: https://www.independent.co.uk/news/uk/home-news/waterloo-disruption-delay-train-cancelled-london-engineering-works-a8834501.html (accessed on 23 March 2019).
  50. Xiang, H.; Jeong, C.E. Modeling the damage and recovery of interdependent critical infrastructure systems from natural hazards. Reliab. Eng. Syst. Saf. 2018, 177, 162–175. [Google Scholar]
  51. Kim, S.H.; Chung, J.H. Exploration on origin-destination-based travel time variability: Insights from Seoul metropolitan area. J. Transp. Geogr. 2018, 70, 104–113. [Google Scholar] [CrossRef]
  52. Zagattia, G.A.; Gonzaleza, M.; Avnerb, P.; Lozano-Gracia, N.; Brooks, C.J.; Albert, M.; Gray, J.; Antos, S.E.; Burcia, P.; zuErbach-Schoenberg, E.; et al. A trip to work: Estimation of origin and destination of commuting patterns in the main metropolitan regions of Haiti using CDR. Dev. Eng. 2018, 3, 133–165. [Google Scholar] [CrossRef]
  53. Pineda, C.; Schwarz, D.; Godoy, E. Comparison of passengers’ behaviour and aggregate demand levels on a subway system using origin-destination surveys and smart card data. Res. Transp. Econ. 2016, 59, 258–267. [Google Scholar] [CrossRef]
  54. Jain, S.; Singh-Jain, S.; Jain, G. Traffic congestion modelling based on origin destination. Procedia Eng. 2017, 187, 442–450. [Google Scholar] [CrossRef]
  55. Malone, T.V.; Crowston, K. The Interdisciplinary Study of Coordination. ACM Comput. Surv. 1994, 26, 87–119. [Google Scholar] [CrossRef]
  56. Janic, M. Modelling the resilience, friability and costs of an air transport network affected by a large-scale disruptive event. Transp. Res. Part A 2015, 71, 1–16. [Google Scholar]
  57. Tympakianaki, A.; Koutsopoulos, H.N.; Jenelius, E.; Cebecauer, M. Impact analysis of transport network disruptions using multimodal data: A case study for tunnel closures in Stockholm. Case Stud. Transp. Policy 2018, 6, 179–189. [Google Scholar] [CrossRef]
Figure 1. The metro line-C and the Bus Rapid Transit (BRT) line-A. (The BRT line-A runs parallel to the affected metro line-C).
Sustainability 11 04757 g001
Figure 2. Some evidence of the emergency caused by a failure of the metro line-C [38].
Sustainability 11 04757 g002
Figure 3. Recursive structure of Mexico City’s transport system network. SMU = Safety Management Unit; ESO = Energy Supply Operations; WSO = Water Supply Operations; MCTO = Mexico City Transport Operations and MCT-SMU = Mexico City Transport-SMU; PCO = Private Cars Operations and PC-SMU = Private Cars-SMU; TXO = Taxi Operations and TX-SMU = Taxi-SMU; PBO = Public Bus Operations and PB-SMU = Public Bus-SMU; BRTO = Bus Rapid Transit Operations and BRT-SMU = Bus Rapid Transit-SMU; BRT-LAO/LFO = BRT-Line A/F Operations and BRT-LA/LF-SMU = BRT-Line A/F-SMU; MTO = Metro Transport Operations and MT-SMU = Metro Transport-SMU; M-LCO = Metro-Line C Operations and M-LC-SMU = Metro-Line C-SMU.
Sustainability 11 04757 g003
Figure 4. A ‘structural organization’ (i.e., System 1–5) of Mexico City’s transport network at Recursion 1 and 2. (The figure should be seen in the context of Figure 3, i.e., the five subsystems that constitute System 1 are interrelated horizontally). SMU = Safety Management Unit; MTO = Metro Transport Operations and MT-SMU = Metro Transport-SMU; PCO = Private Cars Operations and PC-SMU = Private Cars-SMU; TXO = Taxi Operations and TX-SMU = Taxi-SMU; PBO = Public Bus Operations and PB-SMU = Public Bus-SMU; BRTO = Bus Rapid Transit Operations and BRT-SMU = Bus Rapid Transit-SMU.
Sustainability 11 04757 g004
Figure 5. Failure propagation-horizontally: operational (circle) and managerial (square box) at Recursion 1 and 2. (The figure should be seen in the contexts of Figure 3 and Figure 4, i.e., the five subsystems that constitute System 1 are interrelated horizontally). SMU = Safety Management Unit; MTO = Metro Transport Operations and MT-SMU = Metro Transport-SMU; PCO = Private Cars Operations and PC-SMU = Private Cars-SMU; TXO = Taxi Operations and TX-SMU = Taxi-SMU; PBO = Public Bus Operations and PB-SMU = Public Bus-SMU; BRTO = Bus Rapid Transit Operations and BRT-SMU = Bus Rapid Transit-SMU.
Sustainability 11 04757 g005
Figure 6. Coordination function among the different modes of transportation of Mexico City.
Sustainability 11 04757 g006
Figure 7. A structural organization (i.e., System 1–5) of the Metro transport system at Recursion 2,3. (The figure should be seen in the context of Figure 3 and Figure 4, i.e., the five subsystems that constitute System 1 are interrelated horizontally). SMU = Safety Management Unit; MLAO = Metro Line-A Operations and MLA-SMU = Metro Line A-SMU; MLBO = Metro Line-B Operations and MLB-SMU = Metro Line B-SMU; MLCO = Metro Line-C Operations and MLC-SMU = Metro Line C-SMU; MLDO = Metro Line-D Operations and MLD-SMU = Metro Line D-SMU; MLEO = Metro Line-E Operations and MLE-SMU = Metro Line E-SMU; MLFO = Metro Line-F Operations and MLF-SMU = Metro Line F- SMU; MLGO = Metro Line-G Operations and MLG-SMU = Metro Line G-SMU; MLIO = Metro Line-I Operations and MLI-SMU = Metro Line I-SMU.
Sustainability 11 04757 g007
Figure 8. Operational failure propagation (red color arrows) at Recursion 2 and 3. The figure should be seen in the context of Figure 3 and Figure 7, i.e., the five subsystems that constitute System 1 are interrelated horizontally. SMU = Safety Management Unit; MLAO = Metro Line-A Operations and MLA-SMU = Metro Line A-SMU; MLBO = Metro Line-B Operations and MLB-SMU = Metro Line B-SMU; MLCO = Metro Line-C Operations and MLC-SMU = Metro Line C-SMU; MLDO = Metro Line-D Operations and MLD-SMU = Metro Line D-SMU; MLEO = Metro Line-E Operations and MLE-SMU = Metro Line E-SMU; MLFO = Metro Line-F Operations and MLF-SMU = Metro Line F-SMU; MLGO = Metro Line-G Operations and MLG-SMU = Metro Line G-SMU; MLIO = Metro Line-I Operations and MLI-SMU = Metro Line I-SMU.
Sustainability 11 04757 g008
Figure 9. A ‘structural organization’ (i.e., Systems 1–5) of the BRT (Bus Rapid Transit) transport system-at Recursion 2 and 3 (Figure 4). The five subsystems that constitute System 1 are interrelated horizontally. (The figure should be seen in the context of Figure 3 and Figure 4). SMU = Safety Management Unit; BRT-LAO = BRT-Line A Operations and BRT LA-SMU = BRT Line A-SMU; BRT-LBO = BRT-Line B Operations and BRT LB-SMU = BRT Line B-SMU; BRT-LCO = BRT-Line C Operations and BRT LC-SMU = BRT Line C-SMU; BRT-LDO = BRT-Line D Operations and BRT LD-SMU = BRT Line D-SMU; BRT-LEO = BRT-Line E Operations and BRT LE-SMU = BRT Line E-SMU; BRT-LFO = BRT-Line F Operations and BRT LF-SMU = BRT Line F-SMU.
Sustainability 11 04757 g009
Figure 10. Failure propagation (red color arrows): operational (circle) and managerial (square box) at Recursion 2 and 3. (The figure should be seen in the context of Figure 3 and Figure 9, i.e., the five subsystems that constitute System 1 are interrelated horizontally). SMU = Safety Management Unit; BRT-LAO = BRT-Line A Operations and BRT LA-SMU = BRT Line A-SMU; BRT-LBO = BRT-Line B Operations and BRT LB-SMU = BRT Line B-SMU; BRT-LCO = BRT-Line C Operations and BRT LC-SMU = BRT Line C-SMU; BRT-LDO = BRT-Line D Operations and BRT LD-SMU = BRT Line D-SMU; BRT-LEO = BRT-Line E Operations and BRT LE-SMU = BRT Line E-SMU; BRT-LFO = BRT-Line F Operations and BRT LF-SMU = BRT Line F-SMU.
Sustainability 11 04757 g010
Table 1. ‘Operational’ interdependencies for the case of Mexico City’s transport system (Figure 5).
Operations (‘Circles’ in Figure 4, Figure 5 and Figure 6)Metro Transport
Operations
(MTO)
Taxi
Operations
(TXO)
BRT
Operations
(BRTO)
Private Cars
Operations
(PCO)
Public Buses
Operations
(PBO)
SWSWSWSWSW
No. Zig-Zag Lines in Figure 5
Metro Transport
Operations
(MTO)
1234
a b c d
Taxi
Operations
(TXO)
567
e f g
BRT
Operations
(BRTO)
89
hi
Private Cars
Operations
(PCO)
10
j
Public Buses
Operations
(PBO)
S=‘Strong’ interdependency; W= ‘Weak’ interdependency.
Table 2. Examples of the ‘operational’ interdependencies identified in Table 1.
Table 1. Id.Description
(See Figure 1 and Figure 2 and Section 2.1.)
a.Commuters were desperately trying to get home; some of them used taxis (Figure 2b).
b.Commuters boarded the BRT line-A (Figure 2b); the line runs parallel to the affected metro line-C. Both share the same geographic location of their terminals; it is here where Station No. 1 is located (Figure 1).
c.Private motorcars were heavily affected by the traffic congestion due to a failure of the metro line-C (Figure 2a).
d.Public buses were overtaken by the vastly number of commuters desperately to get home (Figure 2a).
e.Taxis were not allowed to use the BRT lanes, which further contributed to traffic congestion. As the time passed by, they avoided the area.
f.Given that most of the affected commuters were heading to the north of the city, taxis and private motorcars were heavily affected by traffic congestion. In some instances, some of them just avoided the area.
g.Similarly, taxis and public transport buses were affected by traffic congestion. In particular, public transport buses were overtaken by those affected; as a consequence of this, many commuters boarded police buses and trucks (Figure 2a).
h.During the emergency, private motorcars were not allowed to use the BRT lanes; because of this, they were affected by traffic congestion, and in most of the cases they just avoided the affected area.
i.Public buses were not allowed to use BRT lanes; also, they avoided the affected area of the city.
j.Both public buses and private motorcars shared the same road and not allowed to use the BRT lanes, which contributed to traffic congestion; also, they avoided the affected area of the city.
Table 3. ‘Operational’ interdependencies for the case of the BRT system (Figure 10).
Operations (‘Circles’ in Figure 10)BRT-LA
Operations
(BRT-LAO)
BRT-L
BOperations
(BRT-LBO)
BRT-LC
Operations
(BRT-LCO)
BRT-LD
Operations
(BRT-LDO)
BRT-LE
Operations
(BRT-LEO)
BRT-LF
Operations
(BRT-LFO)
SWSWSWSWSWSW
No. Zigzag Line in Figure 10
BRT Line-A
Operations
(BRT-LAO)
12345
a b c de
BRT Line-
BOperations
(BRT-LBO)
6789
f g h i
BRT Line-C
Operations
(BRT-LCO)
101112
j k l
BRT Line-D
Operations
(BRT-LDO)
1314
m n
BRT Line-E
Operations
(BRT-LEO)
15
BRT Line-F
Operations
(BRT-LFO)
S=‘Strong’ interdependency; W=‘Weak’ interdependency.
Table 4. Examples of the ‘operational’ interdependencies identified in Table 3.
Table 3
Id.
Description
(See Figure 1 and Figure 2 and Section 2.1)
a.BRT lines A and B are interconnected and effectively commuters were affected; e.g., people working in the south of the city use line-B to connect to line-A to travel to the north where it is believed that most of them will take another bus to their homes.
b.The affected commuters overloaded the BRT line-C given the interconnection of this line with the affected line-A. The connecting Stations 5 and 6 (Figure 1b) are the key ones that connect to BRT line-C which brings commuters to the north of the city.
c.BRT line-A interconnects with lines C and D through Station 9 (Figure 1b), but also with a rail station. Literally, thousands of commuters were affected here.
d.Although there is no direct connection with BRT line-A, however, Line-E has connections with BRT lines D and F, which in turn are connected with BRT line-A; that is, the affectation was not that significant.
e.There is a key station that shared BRT lines A and F within the network. For example, commuters heading to their homes through BRT line-A station 1, simply could not do it; the line was heavily affected.
f.Given the fact that most of the commuters were heading north of the city, there was not affectation of these lines.
g.Same as in ‘f’.
h.Same as in ‘f’.
i.Same as in ‘f’.
j.The affectation was in terms of a decrease in the number of users.
k.There was not affectation with these lines.
l.Same as in ‘j’.
m.The affectation was in terms of a decreasing number of commuters using these lines.
n.Same as in ‘m’
o.Same as in ‘m’.

