1. Introduction
Light emitting diode (LED) lamps are expected to share 74% of the lighting market by 2030, due high energy efficiency and longer life span, yet management of its end of life (EOL) is missing [
1]. In the United States, LED lighting is estimated to save 46% of energy consumption, being worth 30 billion dollars [
2]. In China, it is estimated that the phase-in of LEDs will save 48 billion kilowatt hours of electricity every year and reduce annual carbon emissions by 48 million tons [
3]. In France, in 2016, LED lamps occupied half the lighting market with 87 million units, from a very small share in 2009 [
4]. On average, the expected life span of a LED light bulb is 5–7 years [
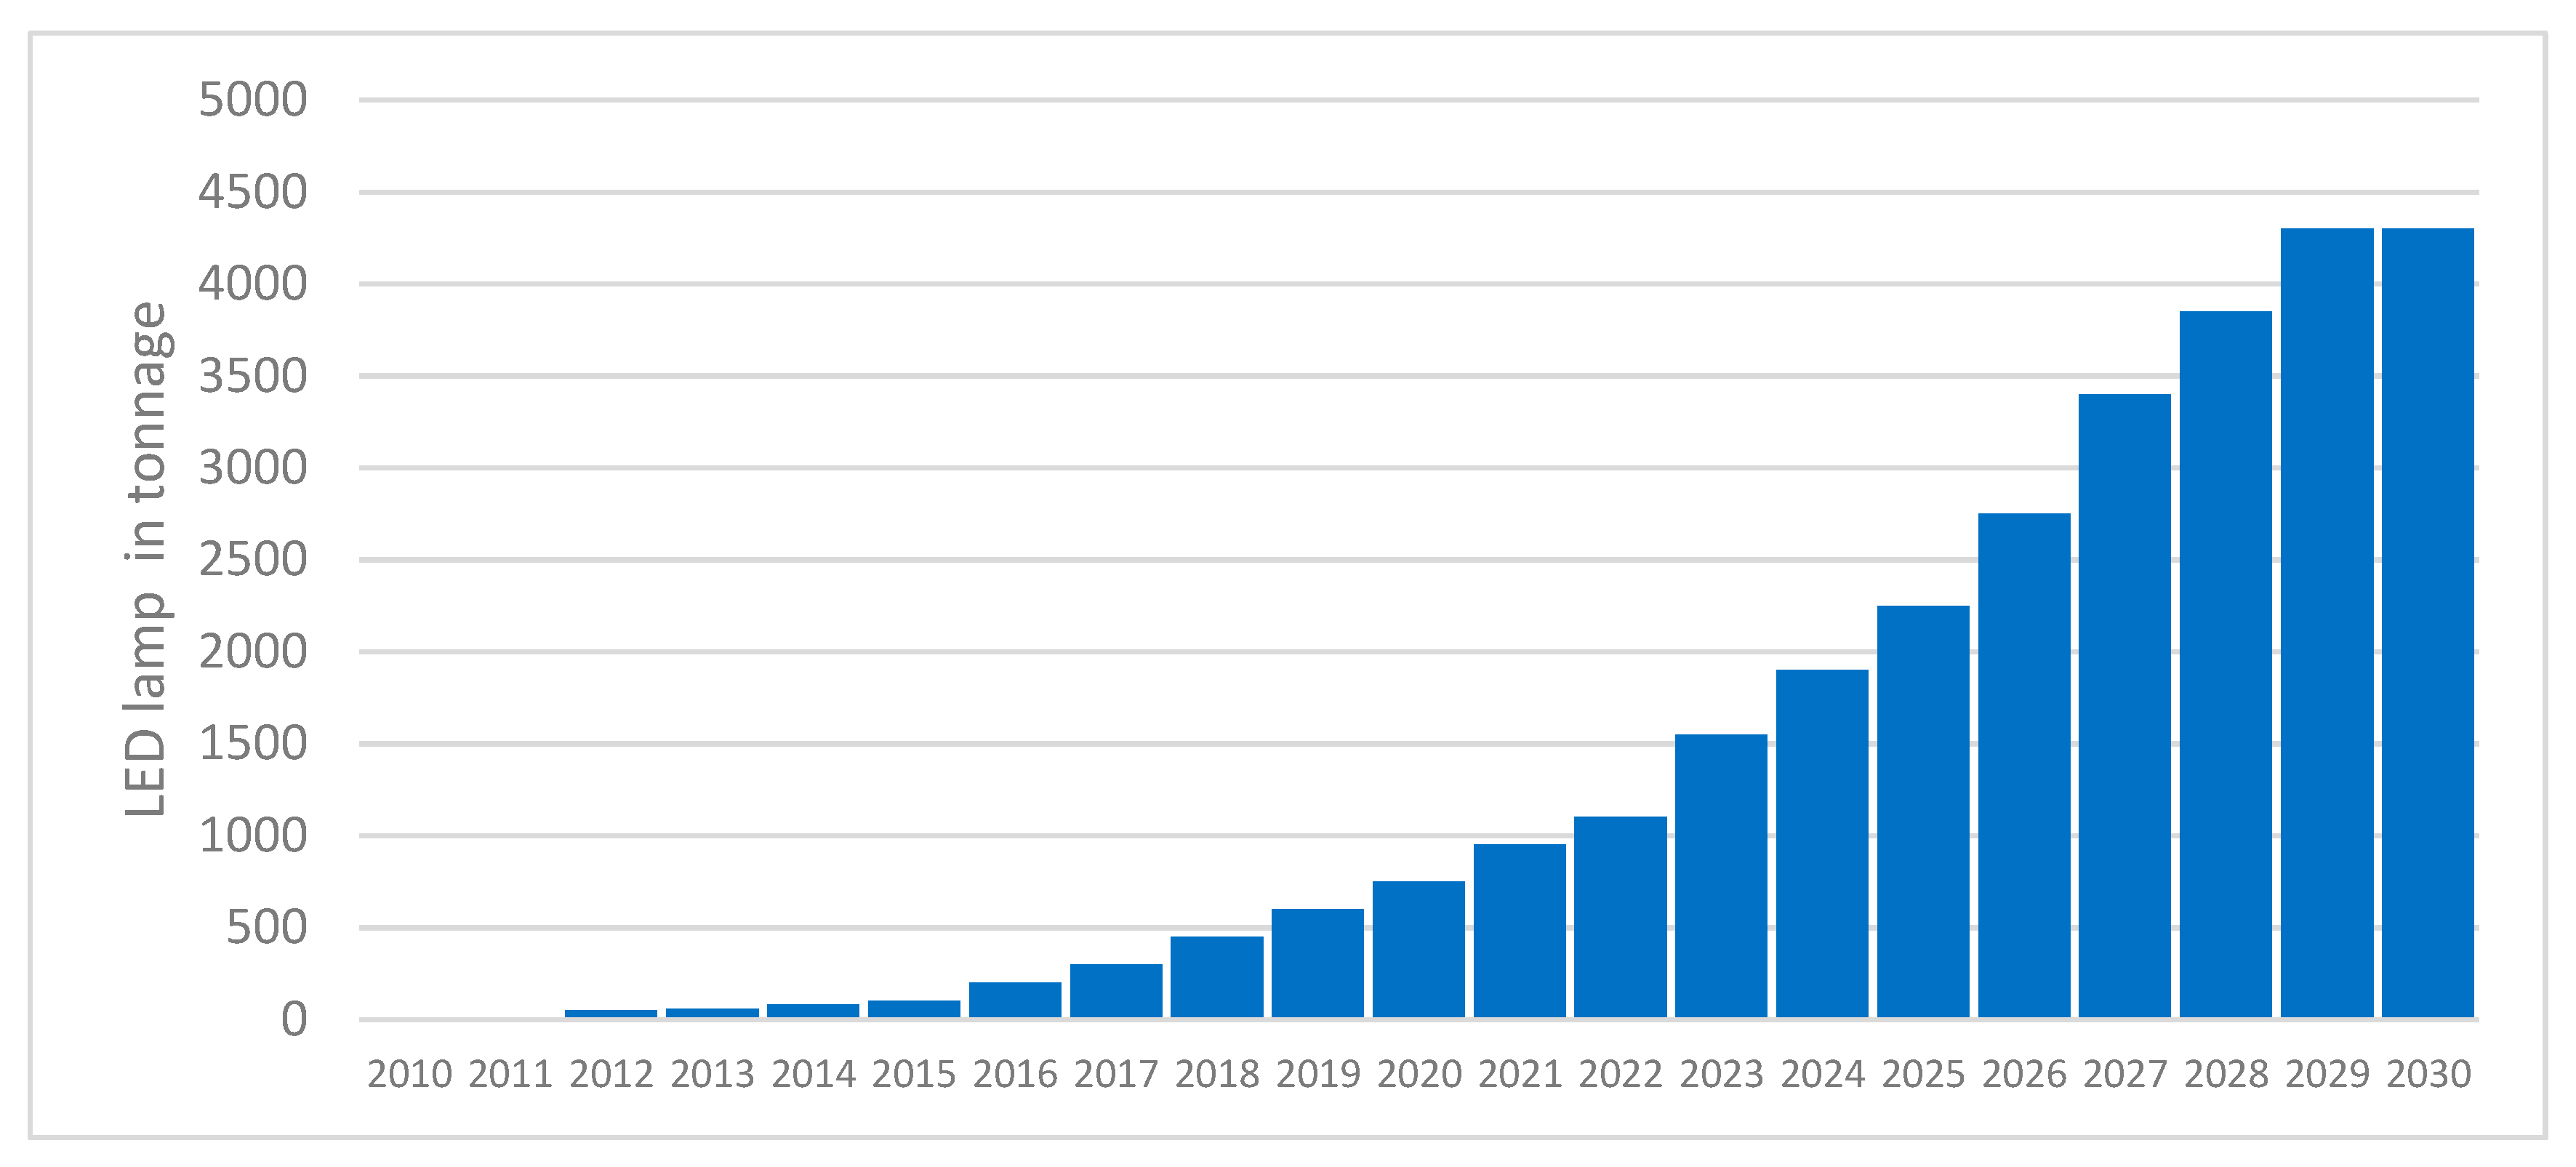
5], which means that LED lights will appear in the waste stream in massive scale in the coming decades and it will add to the current e-waste management challenges. Récylum—a non-profit eco-organization in France—is responsible for the collection and recycling of used lamps. It is estimated that LED lamp collection will increase rapidly in 10 years, from about 500 tons in 2020 to 4000 tons in 2030 (
Figure 1).
Waste LED lamps pose considerable challenges due to their novel material content and design variation. LEDs consist of group III-V semiconductor material and they pose potential environmental impacts at their EOL if not efficiently addressed. LED chips contain rare earth metals, such as Gallium and Indium, along with packaging materials that contain copper, gold, nickel and others [
6]. Brominated flame retardants may also be used with different plastics to manage heat generation. Recent studies already pointed out that LED lamps lack consistent material content. They recommended standardization of the design of LED lamps for better recycling [
7,
8].
From regulatory point of view, an Extended Producer Responsibility (EPR) scheme sets the recycling target for the recycling companies. EPR is usually executed in two ways: (1) collective producer responsibility, in which producers pay a fee to an organization that organizes and ensures treatment through the recycling companies, (2) individual producer responsibility, in which a producer organizes treatment of recycling and incurs treatment cost individually.
EOL challenges are manifold. According to European Commission [
9], due to design inconsistency and the wide range of materials used, traditional shredding-based recycling cannot achieve the 80% recycling rate set by WEEE (waste electrical and electronic equipment) directives. In addition, shredding-based recycling, without prior careful separation and disassembly, largely loses most of the minor quantity precious metals, which constitute the highest value fractions [
10,
11]. The presence of small quantities of the precious metals tends to be ignored in the context of mass-based policy requirement and presents greater challenges to the achievement of desired circularity that focuses more on reuse and value preservation [
12]. Furthermore, the gradual cost reduction of LED lamps discourages the repair of old lamps [
13]. Environmental benefits for reusing the repaired/remanufactured lamp are also not clear, especially for products, such as LED lamps, for two reasons: use-phase represents relatively higher energy consumption compared to other stages of their life cycle and newer products are more efficient than the old ones [
14,
15]. Thus, exploring different alternatives may provide useful insights regarding the feasibility of reuse at the product level (RPL) (when a waste product as a whole is treated to make it reusable) and/or component level (RCL) (when a part is reused in new or similar other product).
Circular Economy (CE) is interested in extending life cycle of materials through RPL and RCL, as much as possible by orienting socio-economic organization in order to overcome the challenges that are associated with product life extension. Reike et al. [
16] proposed a fresh framework of value retention options to capture the variability of the lifespan of the materials used in the product. They conducted a literature review on CE and proposed 10R imperatives, which placed recycling at the bottom just above recovery, whereas resale, repurpose, and remanufacturing are placed third, fourth, and fifth. They pointed out that, although recycling is the least desirable option, recycling rate—not ‘resale rate’ nor ‘reuse rate’—is still the normative basis for evaluating recovery performance.
Another relevant product life extension strategy is upgradeability, as recently reviewed by Khan et al. [
17]. They proposed three life-cycle phases: beginning of life; middle-of-life; and, end-of-life; with 19 strategies for product upgrade. Out of the 19 strategies, five strategies (Remanufacture with upgrade, Remanufacture, Refurbish, Parts use, and Recycling) are selected for the end-of-life phase, with seven for the middle-of-life and seven for the beginning-of-life phase. While value retention options (VROs) and upgradeability overlap many strategies, they differ in their approach to extension strategies. Upgradeability seems to connect the actors that are involved at different stages and focuses on reliable performance at the product level, not merely retaining values of the products and materials. Apart from these differences, both the approaches agree that preserving value at the product EOL is essential for the realization of a circular economy.
In this study, the higher VROs will be investigated, applying circular economy (CE) principles in order to understand the nature of challenges that are associated to the implementation of the VROs. This study centers on two research questions:
- (1)
To what extent can CE implementation strategy guide recycling operations on the ground?
- (2)
What are the challenges envisaged in field level activities that can facilitate CE implementation?
In the next section, VROs are analyzed and the necessary external context under which values can be optimally preserved is evaluated.
2. Circular Economy and Value Retention Options
CE is gaining increasing attention among academics, businesses, and policy makers with its promise of close looping and transforming the linear economy into a circular one [
16,
18]. Particular attention is paid to transforming an economy that is based on increasing consumption and heedless obsolescence into an economy that builds on sharing and value capture. Several themes emerged in recent literature, which include the foundation of CE, and questioning its novelty [
16], application [
19], new models [
20], implementation [
21], product design [
22], measuring circularity [
23], indicator system [
24], supply chain management [
25] and others. Theoretically, scientists are still divided on the issue of the conceptual foundation of CE, arguing over multidisciplinary origin and blurry boundaries [
26,
27]. However, companies and academics are highly motivated to develop new business models for the adoption of circular economy, but not so much in identifying challenges that are associated to its implementation in the field level, although the turn toward this direction is visible in the more recent literature [
28]. Particular concern is the lack of adequate literature that highlights success and failure of regional and small firm level CE, and how such challenges are related to the socio-institutional contexts that are often too resistant to change [
29,
30]. The accustomed mindset and conventional practices in social, business, and policy spheres continue to pose challenges in implementing CE strategies, leading to an awareness-behavior gap [
30,
31,
32].
While debating if the concept of CE is really original, the European Union (EU) and Asian countries, such as China and Japan, have already integrated CE in their policy plans as a strategy to combat climate change and resource shortages [
16]. A study of seven European nations found that a shift to a circular economy would reduce each nation’s greenhouse-gas emissions by up to 70% and grow its workforce by about 4%—the ultimate low-carbon economy. As Stahel [
33] (p 435) states: “CE would change economic logic because it replaces production with sufficiency: reuse what you can, recycle what cannot be reused, repair what is broken, and remanufacture what cannot be repaired”. This statement is explicitly outlining the hierarchy of material recovery, which means that resources undergo a hierarchical process to maximize the value capture from reuse of the product as a whole or reuse of the components or materials of the products. In the modern economy, recycling per se may not be able to retain or recover the total value of EOL ‘waste’, especially in the case of modern electronics where products are a sophisticated mixture of valuable materials with variable life span, often much longer than the product itself [
34].
The shift of strategy from recycling to other high VROs does not happen in existing organizational structures and business models [
20]. Several articles have focused on identifying the appropriate organizational and business models [
35]. The approach of those models is to form networks and clusters rather than a single organization, provide service rather than ownership, and to reorient the social and cultural settings towards reusable products [
21,
25]. The Ellen Mac Arthur Foundation [
36] has proposed four actions:
- (1)
circular product design and production that stresses adopting eco-design, increasing re-use, refurbishing and remanufacturing, and designing products and processes with substances that are less toxic;
- (2)
business models including product services systems, collaborative consumption tools and other co-sharing of materials;
- (3)
cascade or reverse skills including technological innovations to increase support for reuse, and efficient value chains for reuse markets; and,
- (4)
cross cycle and cross-sector collaboration including actions such as the formation of new value chains, effective sharing, and exchanges through industrial symbiosis.
These above-mentioned actions indicate that a fresh attitude towards resource extraction, material efficiency and environmental wellbeing must be transmitted to actors—both upstream and downstream. By conducting surveys and interviews, Kirchherr et al. [
26] found that lack of consumer interest and awareness, hesitant company culture, and lack of conducive policy interventions are the barriers to CE implementation. Lewandowski [
37] pointed out four fundamental requirements for integrating businesses into CE ideals: triple bottom line balancing; supply chain integration; customer interface motivation; and, equitable financial benefits distribution. Leipold and Petit-Boix [
38] mentioned that there is a two-fold barrier to the business implementation of CE: conflicting policy incentives and a lack of value chain relations.
Fischer and Pascucci [
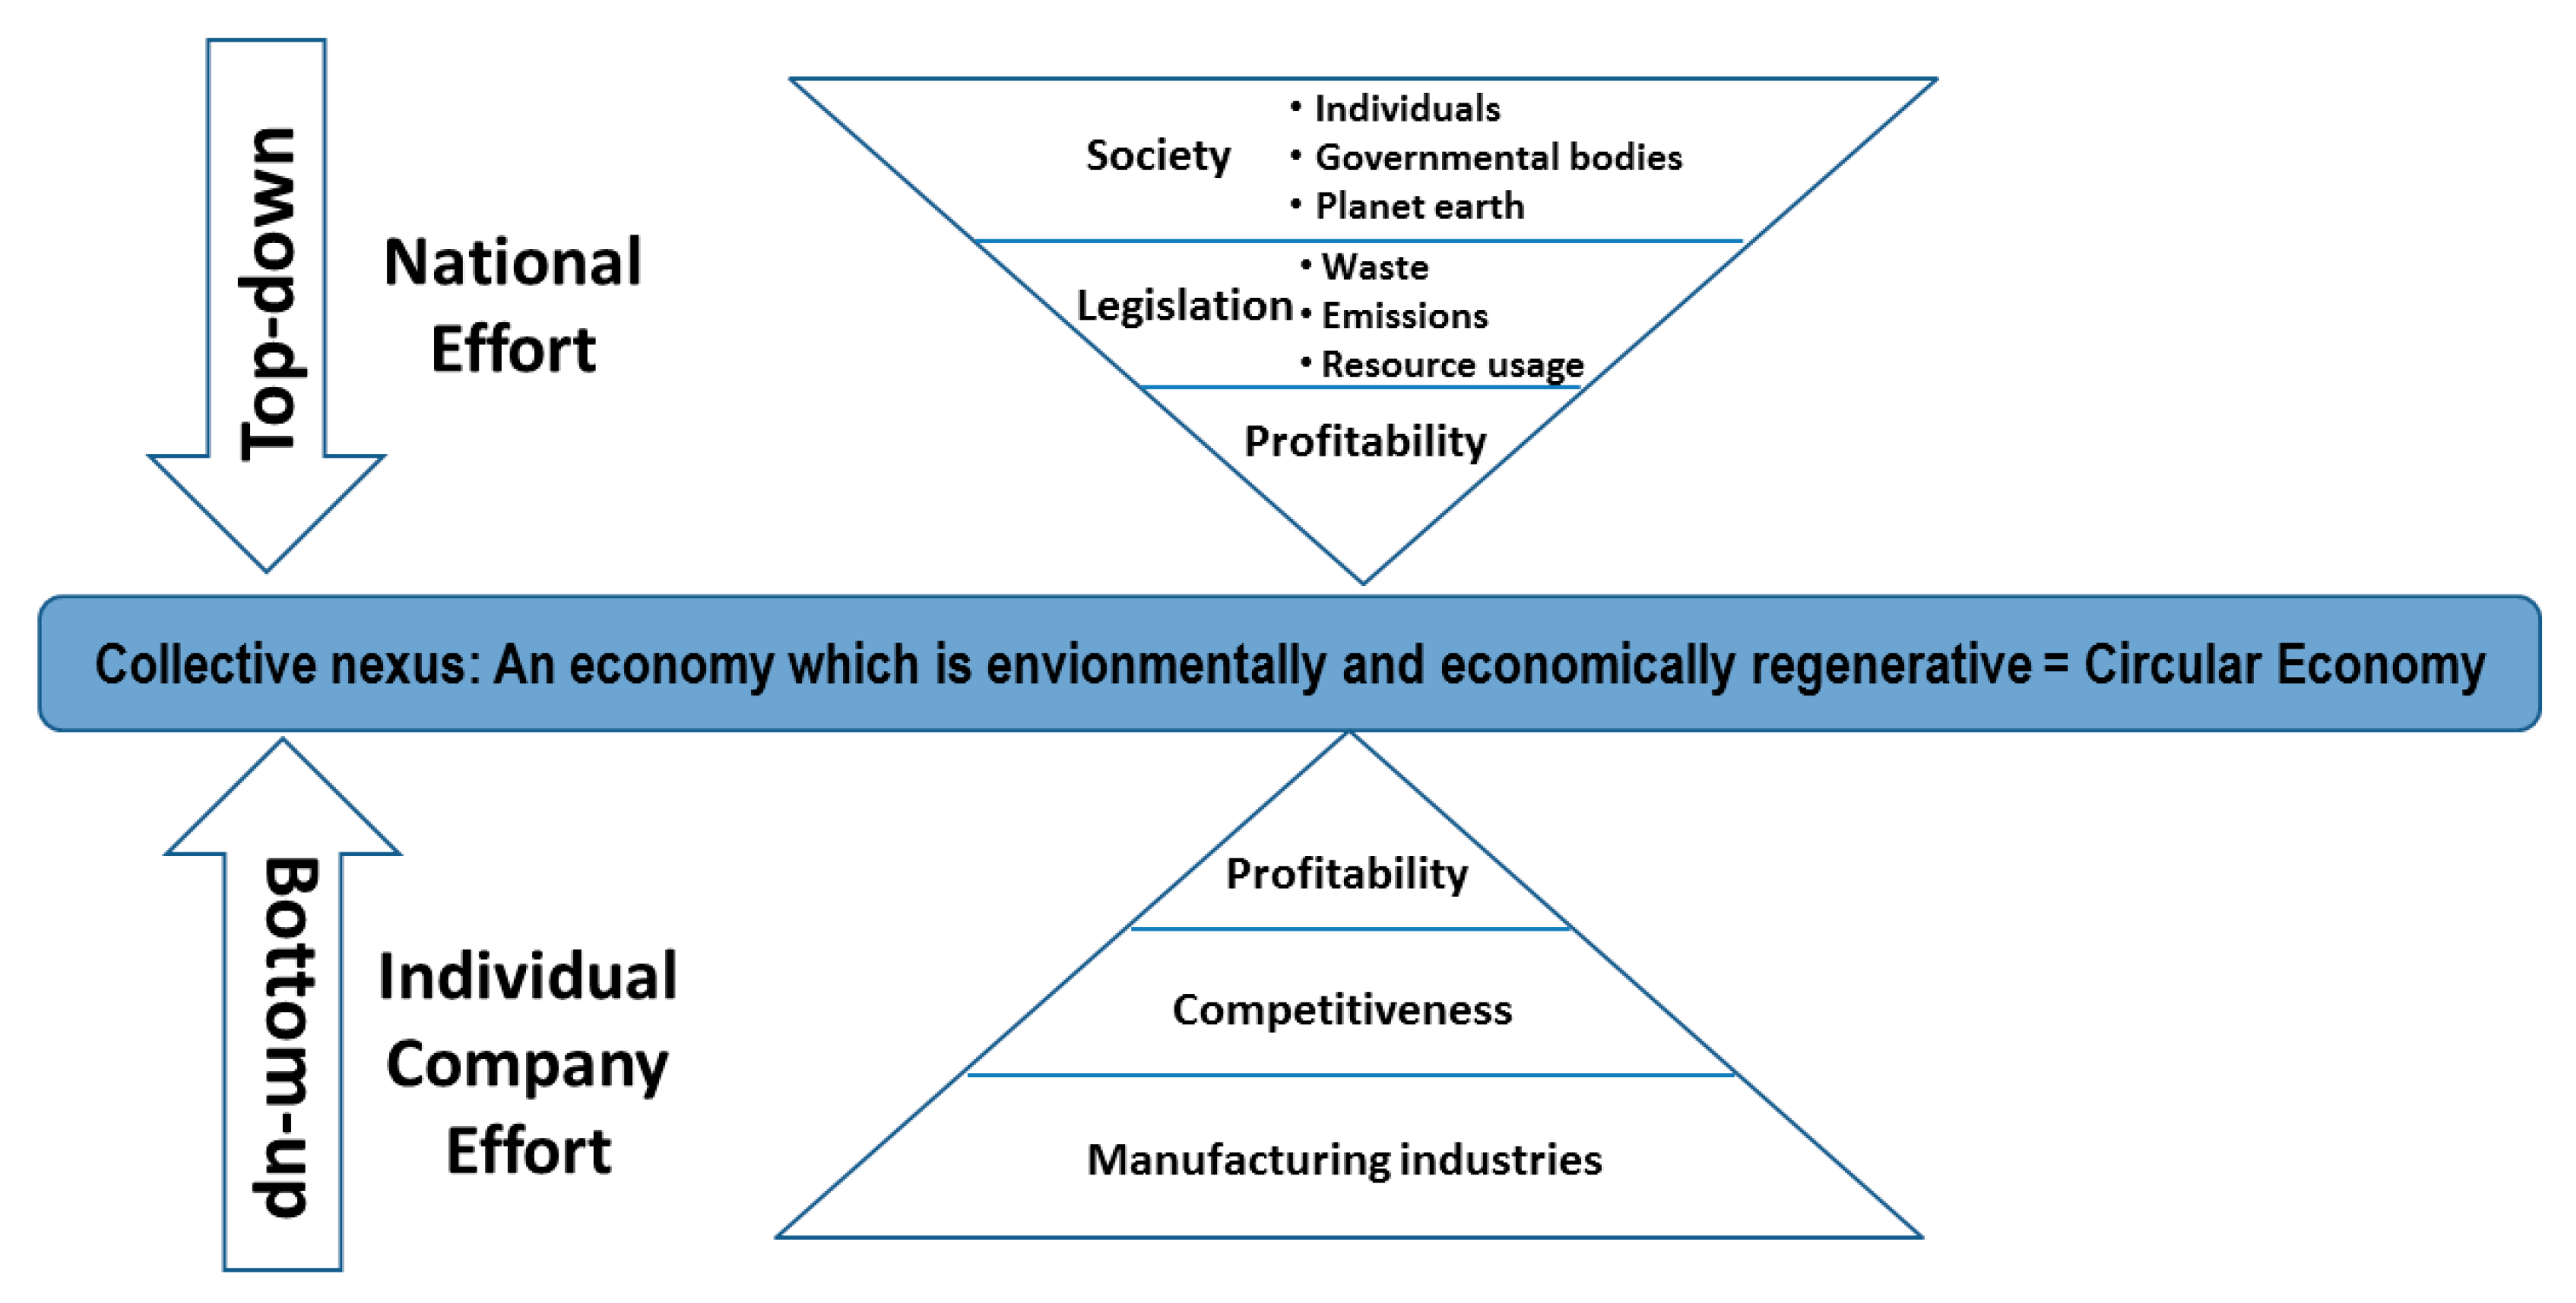
39] suggested two pathways that may overcome traditional inter-firm collaboration cultures: (1) status quo arrangements, in which companies trying to up-cycle technologies and enhance circular relations, will be supported by favorable institutional arrangements, (2) product as service arrangements, in which upstream companies will try to develop new business steps, such as chain coordination, contracting, and financial mechanisms. Lieder and Rashid [
21] provided a comprehensive framework that broadly identified the stakeholders and their role in the successful implementation of CE strategies at all micro and macro levels. This framework integrates top-down and bottom-up approaches. The top-down approach emphasizes societal considerations and acceptance over legislation and policies. In other words, they emphasize that to implement CE successfully as envisioned, legislation and policies must be embedded in renewed societal attitudes toward resource use. In the bottom-up approach, they explained that industries will have to know how to pursue economic benefits, such as profitability and maintaining competition among business entities while adhering to CE principles to maximize value retention (
Figure 2).
Policies may reinforce rapid innovation cycle. For example, LED lamps exhibit a short innovation cycle through quick design changes and policy incentives for energy efficiency gains. This produces a planned obsolescence phenomenon in the industrial realm, in which a product quickly becomes redundant while still retaining its function. In contrast, recyclers recycle the product despite its reuse potential, which could otherwise enter circulation, due to lack of incentives for a specific business (i.e., LED recycler) to adjust its priorities to those of the value chain businesses.
Therefore, in this study, the LED lamp pre-processing options and the associated issues and challenges in the light of the above-mentioned CE strategies are analyzed.
4. Method (Scenario Analysis)
Scenario analysis aims at evaluating impacts of possible future events while considering the possible alternatives and present challenges. It concerns pertinent changes in the values of system parameters in an alternative scenario and anticipates development pathways that lead to varying outcomes and corresponding implications [
40]. Three main principles of scenario analysis are: identification of the existing parameters in the context, conversion of the preconceived mindset to re-perceive emerging reality, and deeper effort to visualize microscopic variations [
40]. Generally, time frame that is chosen for scenario analysis is long term in order to adapt changes within the system effectively and the number of scenarios usually consists in the range of two to six. In this study, price, technological readiness, input quality, recyclate quality, communication pattern among business holders, and, finally, status of secondary market is considered as the system parameters. A number of guiding principles for developing scenarios are identified in Amer et al. [
40]. For example, developing fundamental hypothesis, plausible combinations of key factors, judgmental translation of optimistic and pessimistic possibilities, and ranking issues in a matrix format.
Validating scenarios requires five important attributes: Plausibility (self-capability of driving itself forward), Consistency (combination of logics of a scenario is compatible), Utility (contribute to specific insight), Challenge (challenge conventional wisdom), and Differentiation (structurally different enough to constitute different theme) [
40]. Plausibility is ensured, as all of the four scenarios are self-capable. All of the scenarios do have Utility, as they have specific outcomes that are beneficial for the business and sustainability. Consistency is ensured by closely monitoring their theoretical foundation. Every scenario poses challenge to the conventional wisdom and are distinctively different base on their theoretical origin.
In this study, overcoming management challenges rather than anticipating future direction is highlighted as the expected direction is somewhat undertaken under circular economy principles. However, challenges in social, market, and business contexts are making the expected direction uncertain. This analysis will thus help to plan strategically, so that a better alternative is approached.
The case study is conducted by developing four scenarios. Scenario I aimed to identify RPL, while using an electric board with sockets for different types of LED lamps that are available in the market. The lamps were fitted to the corresponding 24 base types of sockets in the board and the switch was turned on. The number of lamps were counted by their category and functionality. Three researchers conducted the electric testing to randomize the samples and types. In scenario II, (RCL (industry)) is tested, applying electro-comminution technology on 100 kg of LED lamp and, then, compared the recyclate output quality and value creation with scenario III. Scenario III aimed at identifying RCL (manual) by disassembling 30 LED lamps and 32 LED tubes and recorded disassembly time and fraction weights. Six workers were engaged in disassembling, but only one of them took part in our study. Simple tools were used for dismantling and a weighing machine and stopwatch were used for weighing and time. The disassembly time counted largely focusing on the time required to disassemble the lamps, which excludes time for associated tasks such as identifying knots, glue and screw, tool selection and change, and the type of materials to be disconnected (glass or plastic). Finally, scenario IV aimed at identifying the recovery of material level (RML) by using a traditional shredding technology for granulation, followed by sorting technology in company A and Company B. 10 kg samples were sent to two companies (B and C) for shredding and separation into ferrous and non-ferrous categories.
5. Results
5.1. Types and Quantity of Waste Lamps in a Big Bag
A characterization is performed on a big bag of about 7000 lamps (414 kg) based on the base size of the lamp. There were five main base categories identified: E27, E14, GU10, Bi-Pins, and B22. We found that about 90 percent of the lamps were of the categories E27, E14, and GU10 (
Table 1). Other base types, such as MR16, MR 11, and E40 were only present in negligible quantity and hence were excluded. If we categorize lamps by shape type, A and G series lamps predominate with 30% each, followed by PAR series with 20% and MR series constitutes 10% of the total share. The rest (10%) are shared by R series and BT series. Among the series, we observed that the majority of the LED lamps share the same (few) types. The overall composition is quite diverse since each series has several types, with weights varies from about 40 g to 400 g (
Table 2, for the total series and types see
Figures S1 and S2).
5.2. Material Composition of LED Lamps
The first research team conducted material content analysis of eight LED lamps of different models. The disassembly of eight LED lamps showed that LED lamp contains a majority of aluminum, followed by Printed Circuit Boards (PCBs) and plastics (
Table 3). It was also noted that plastic is further categorized as polycarbonate, polybutylene terephthalate, and other additives, such as TBBPA (flame retardant). Generally, in WEEE, flame retardant is mixed with 20% of the total plastic used. A similar trend is also observed in this sample, as Bromine Flame Retardant (BFR) is only added to Polycarbonate, not with PBT and PC used in the same LED lamp. BFR is mainly used with epoxy resin that encapsulates the PCBs and drivers to minimize the heating. In the disassembly, it was observed that epoxy resin usage hinders the easy disassembly of the lamps [
8].
5.3. Evolution of Recycled Fraction of LED Lamps
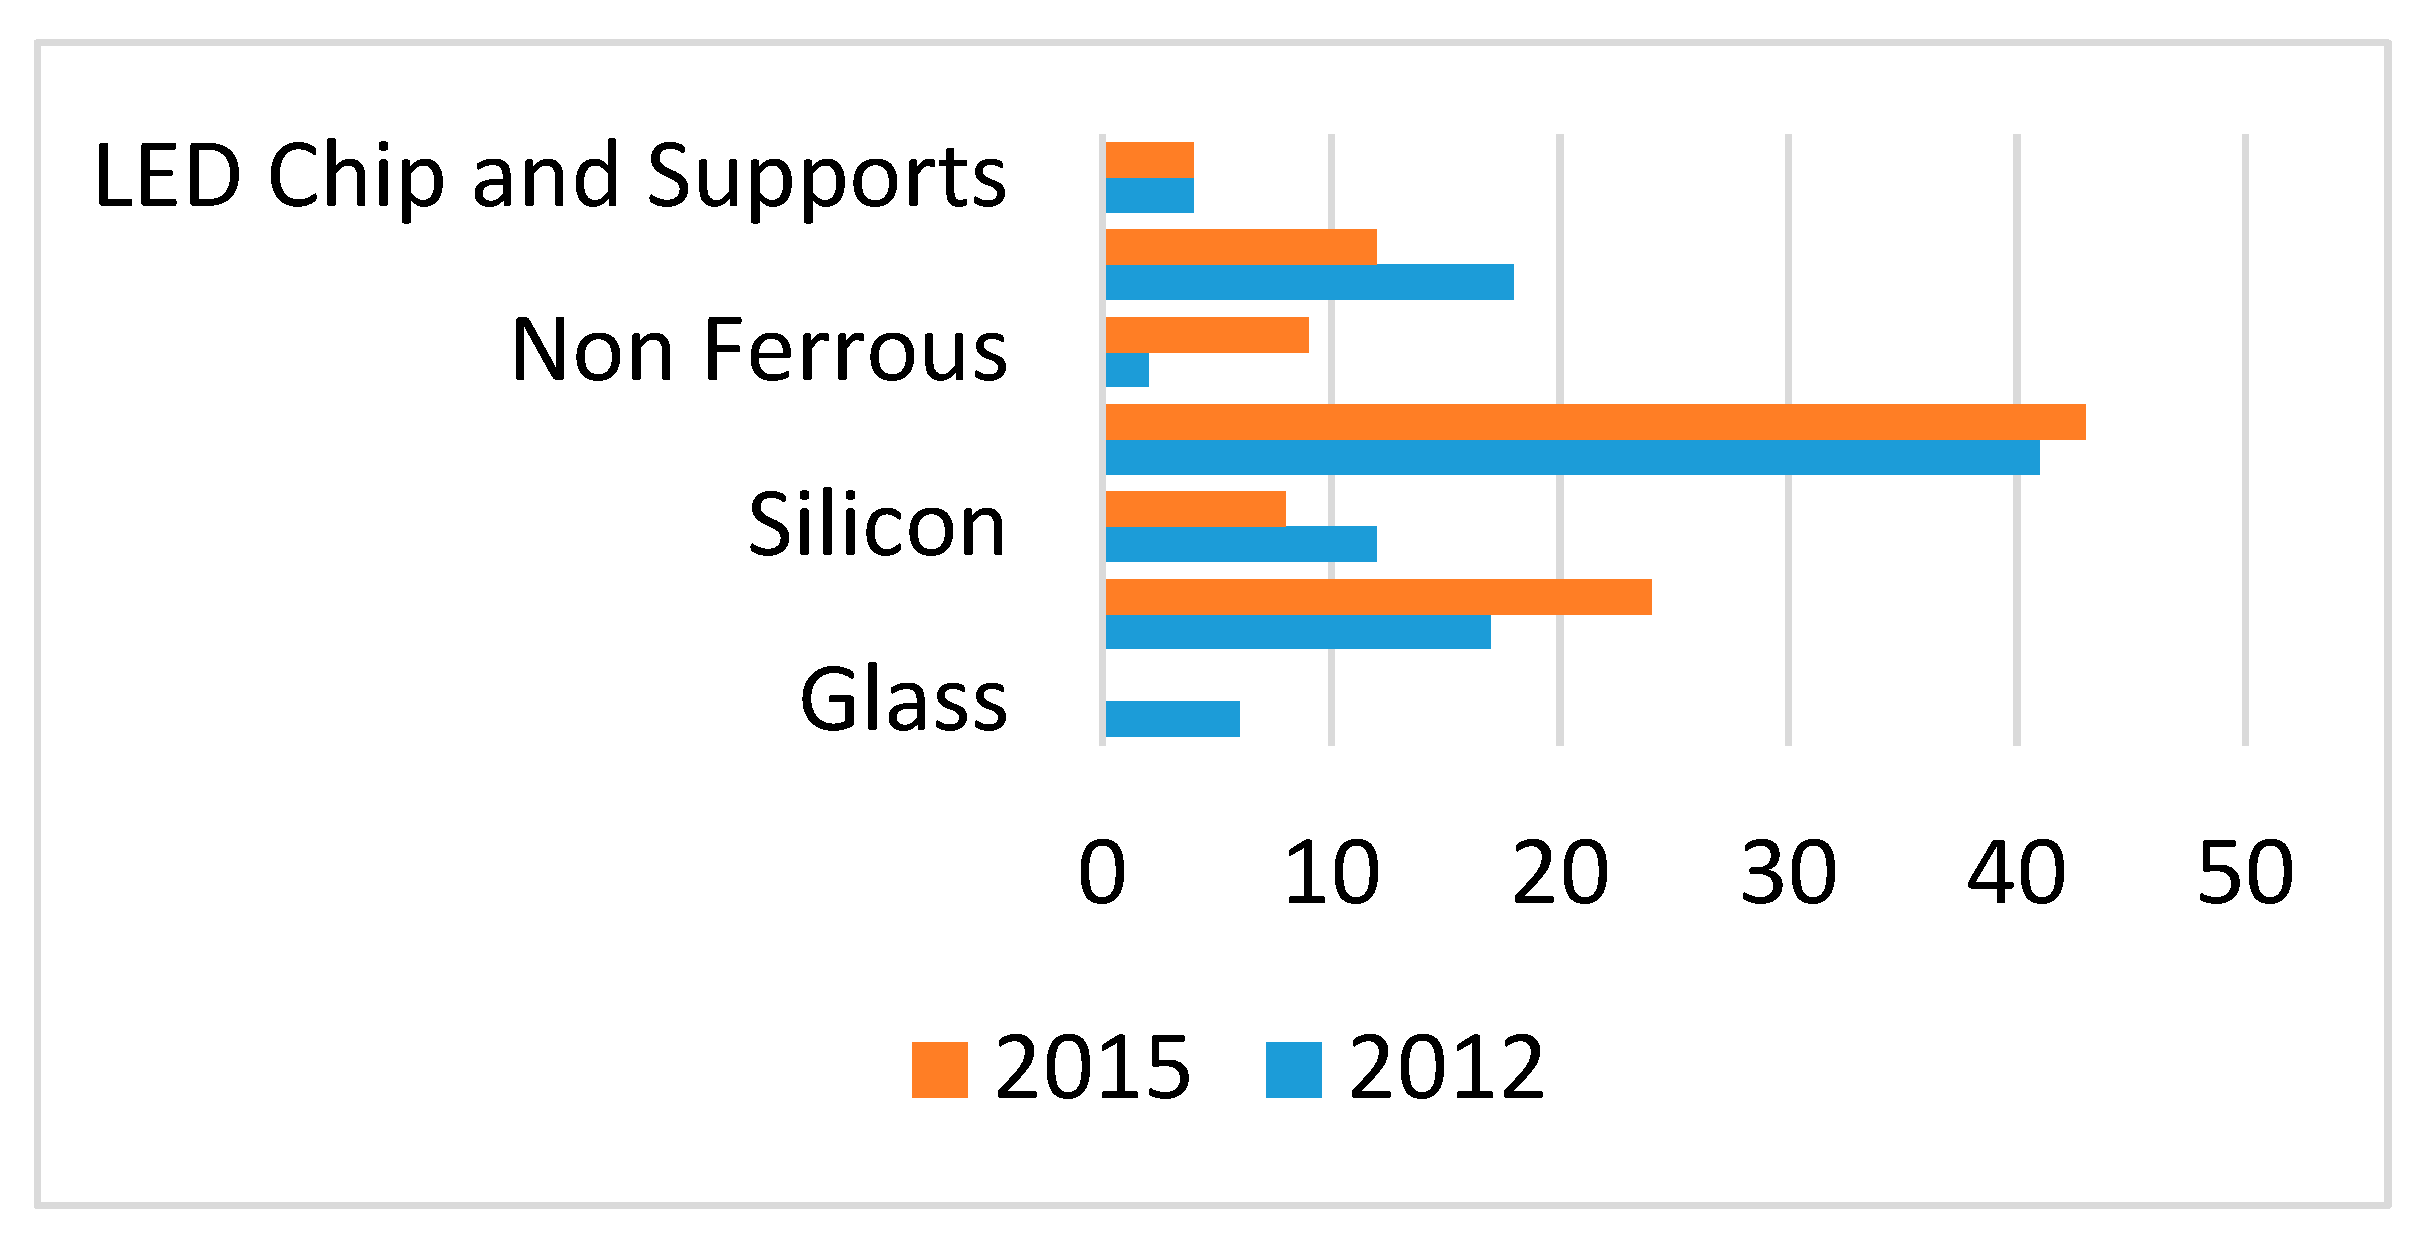
Like any technology, the material composition of LED lamps evolves and changes over time.
Figure 4 shows the change of material composition by year in LED lamps. It shows that LED chip fraction and supports are fairly constant over the period, unlike PCBs, which slightly reduced by about 50%. The use of glass reduced to zero, whereas plastic use increased by about 25% (see also S3 for difference of material composition between LED and CFL lamp).
5.4. VRO: RPL
Table 4 shows that 45 percent of the lamps tested still function, while 55 percent are non-functioning. The result varies with different samples. For example, research group 1 and 2 found that 47% and 55% of the lamps tested are functioning, whereas company workers only found 18%. Unlike these used waste lamps, 27 ‘like new’ lamps were tested and they were all found to be working. The percentage of functioning lamps is quite surprising, as the lamps had already been through processes, such as sorting, packaging, and transporting, while considering them as waste. Thus, it is safe to assume that careful handling in earlier stages would raise the number of functioning lamps. The functioning rate of the lamp may result from the nature of the bulb itself. Narendran et al. [
5] pointed out that LED lamps gradually depreciate in lumen output over time, and the functional life depends on when the lumen drops to the 60–70% level. Manufacturers claim that blue and green InGaN LEDs can maintain more than 70% of their initial lumen at 100,000 h. However, evaluating the output level of 5 mm type LEDs revealed faster depreciation, falling to 50% of their initial light output at 6000 h. Thus, it is important to measure and monitor the photometric performance (lumen output) of these LEDs to see whether the functioning lamps can be reused. Newer aesthetic features and higher efficiency gain in new LED lamps may motivate consumers to discard older lighting systems even before their ‘useful’ life ends, as the cost of replacing may be lower when compared to the benefits gained from energy savings and improved aesthetics.
Testing, inspection, and repair to upgrade the functionality of the lamps are important stages for the reuse of the functioning lamps. Checking the driver’s component and thermal management material and/or replacing them by a better-quality component might upgrade the performance of a poor-functioning LED lamp (Cloud 2016). It may also be the case that replacement of the LED chip with a new one—only costing few cents for a new set of LED arrays—may prove cost effective as the structural integrity of LED package remained intact and is reused. Furthermore, it is important to note here that manufacturers are obliged by law to make compatible spare parts available and to replace the potentially fallible component or parts. There are various organizations available to test, inspect, and validate an LED lamp after the lamp is repaired.
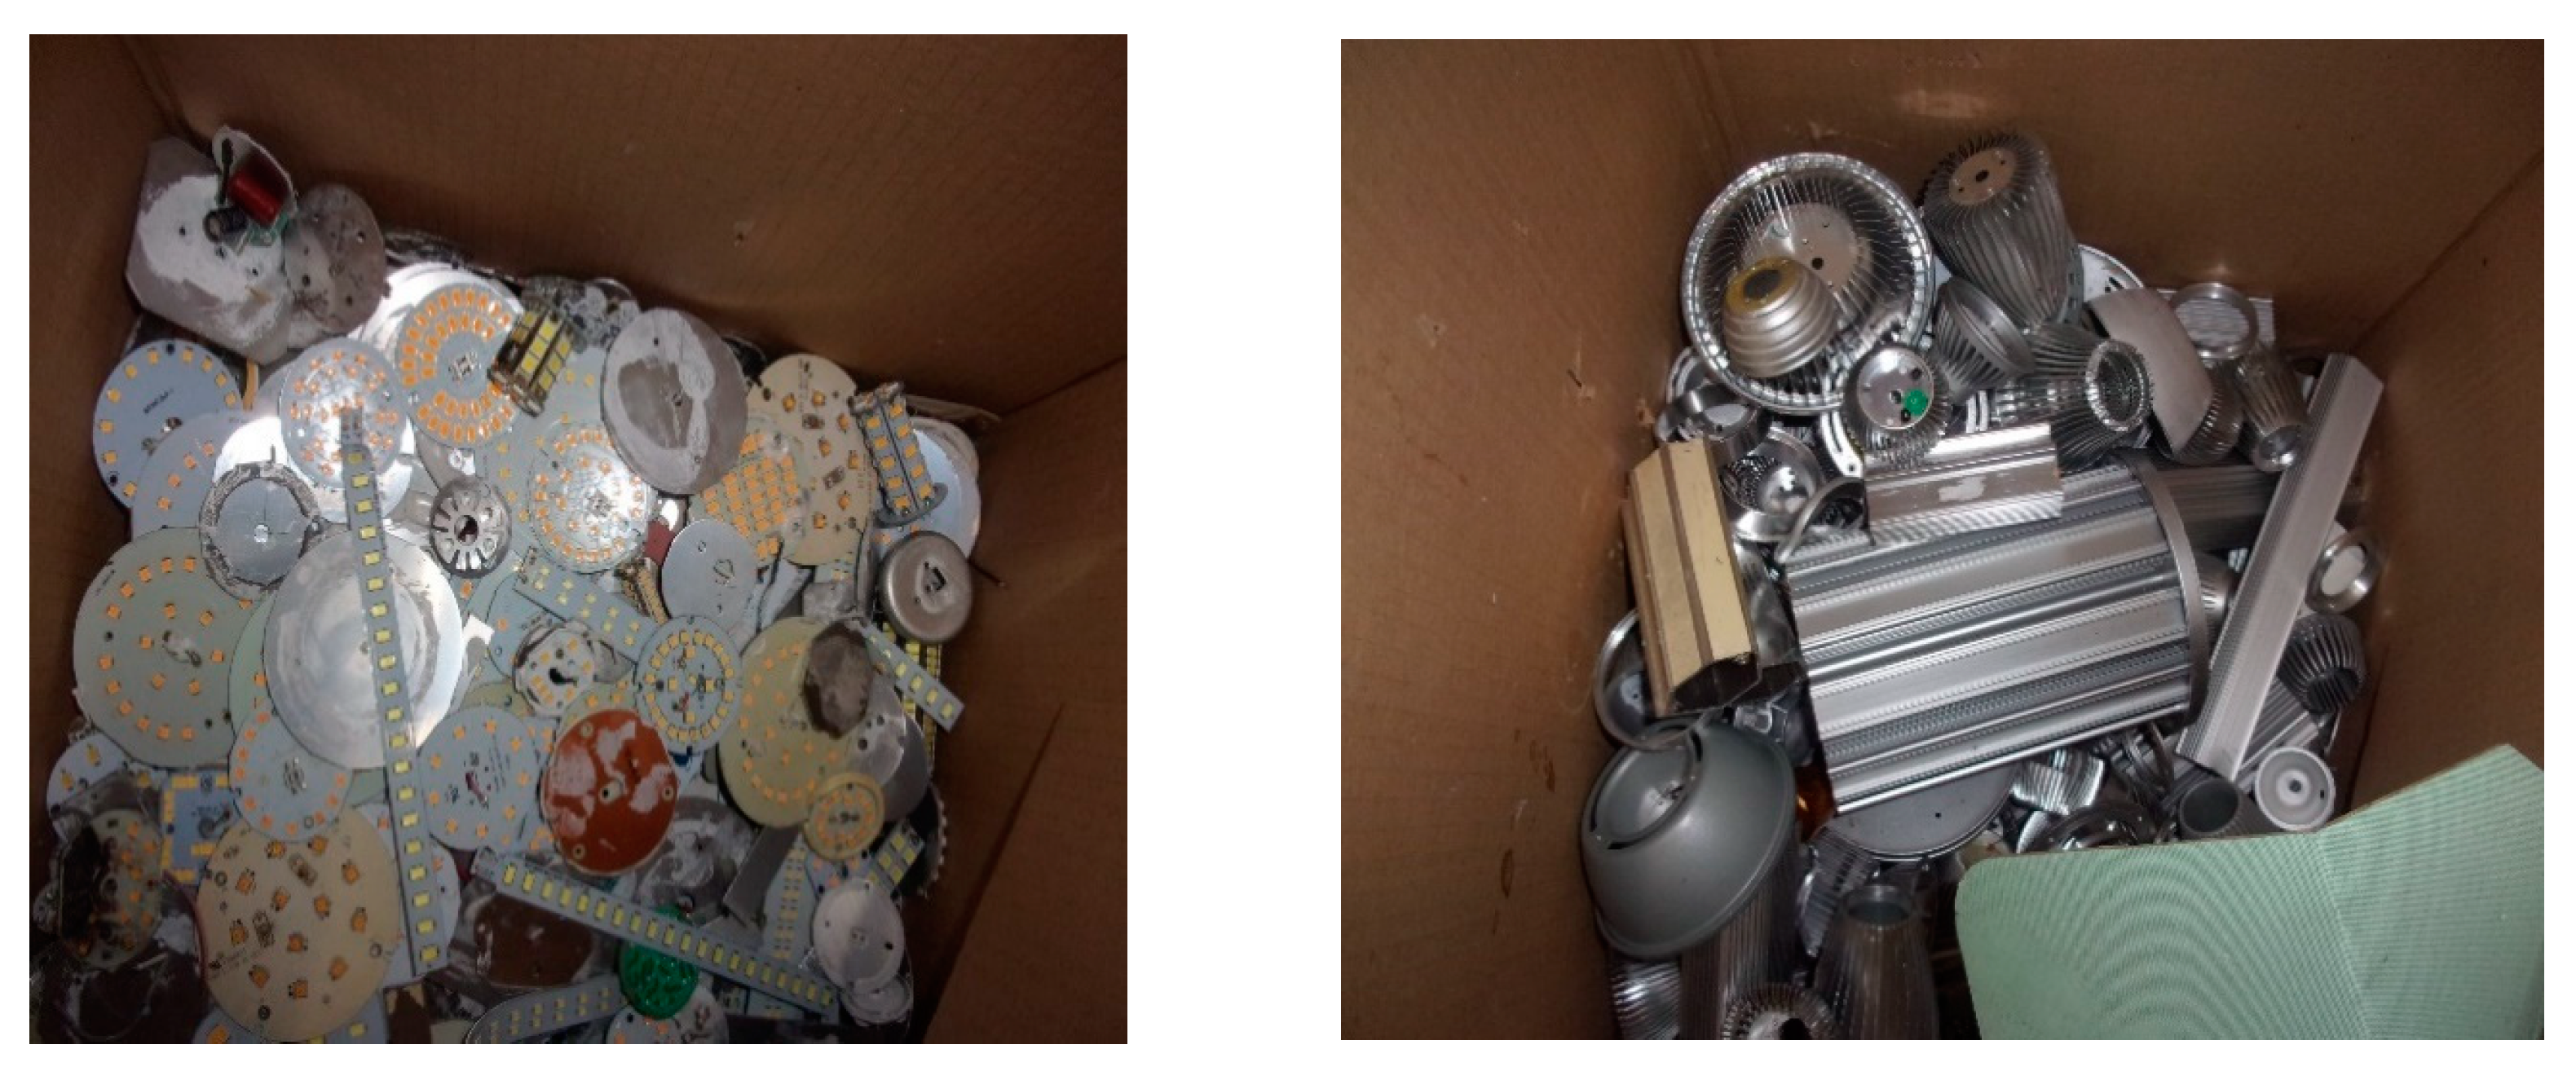
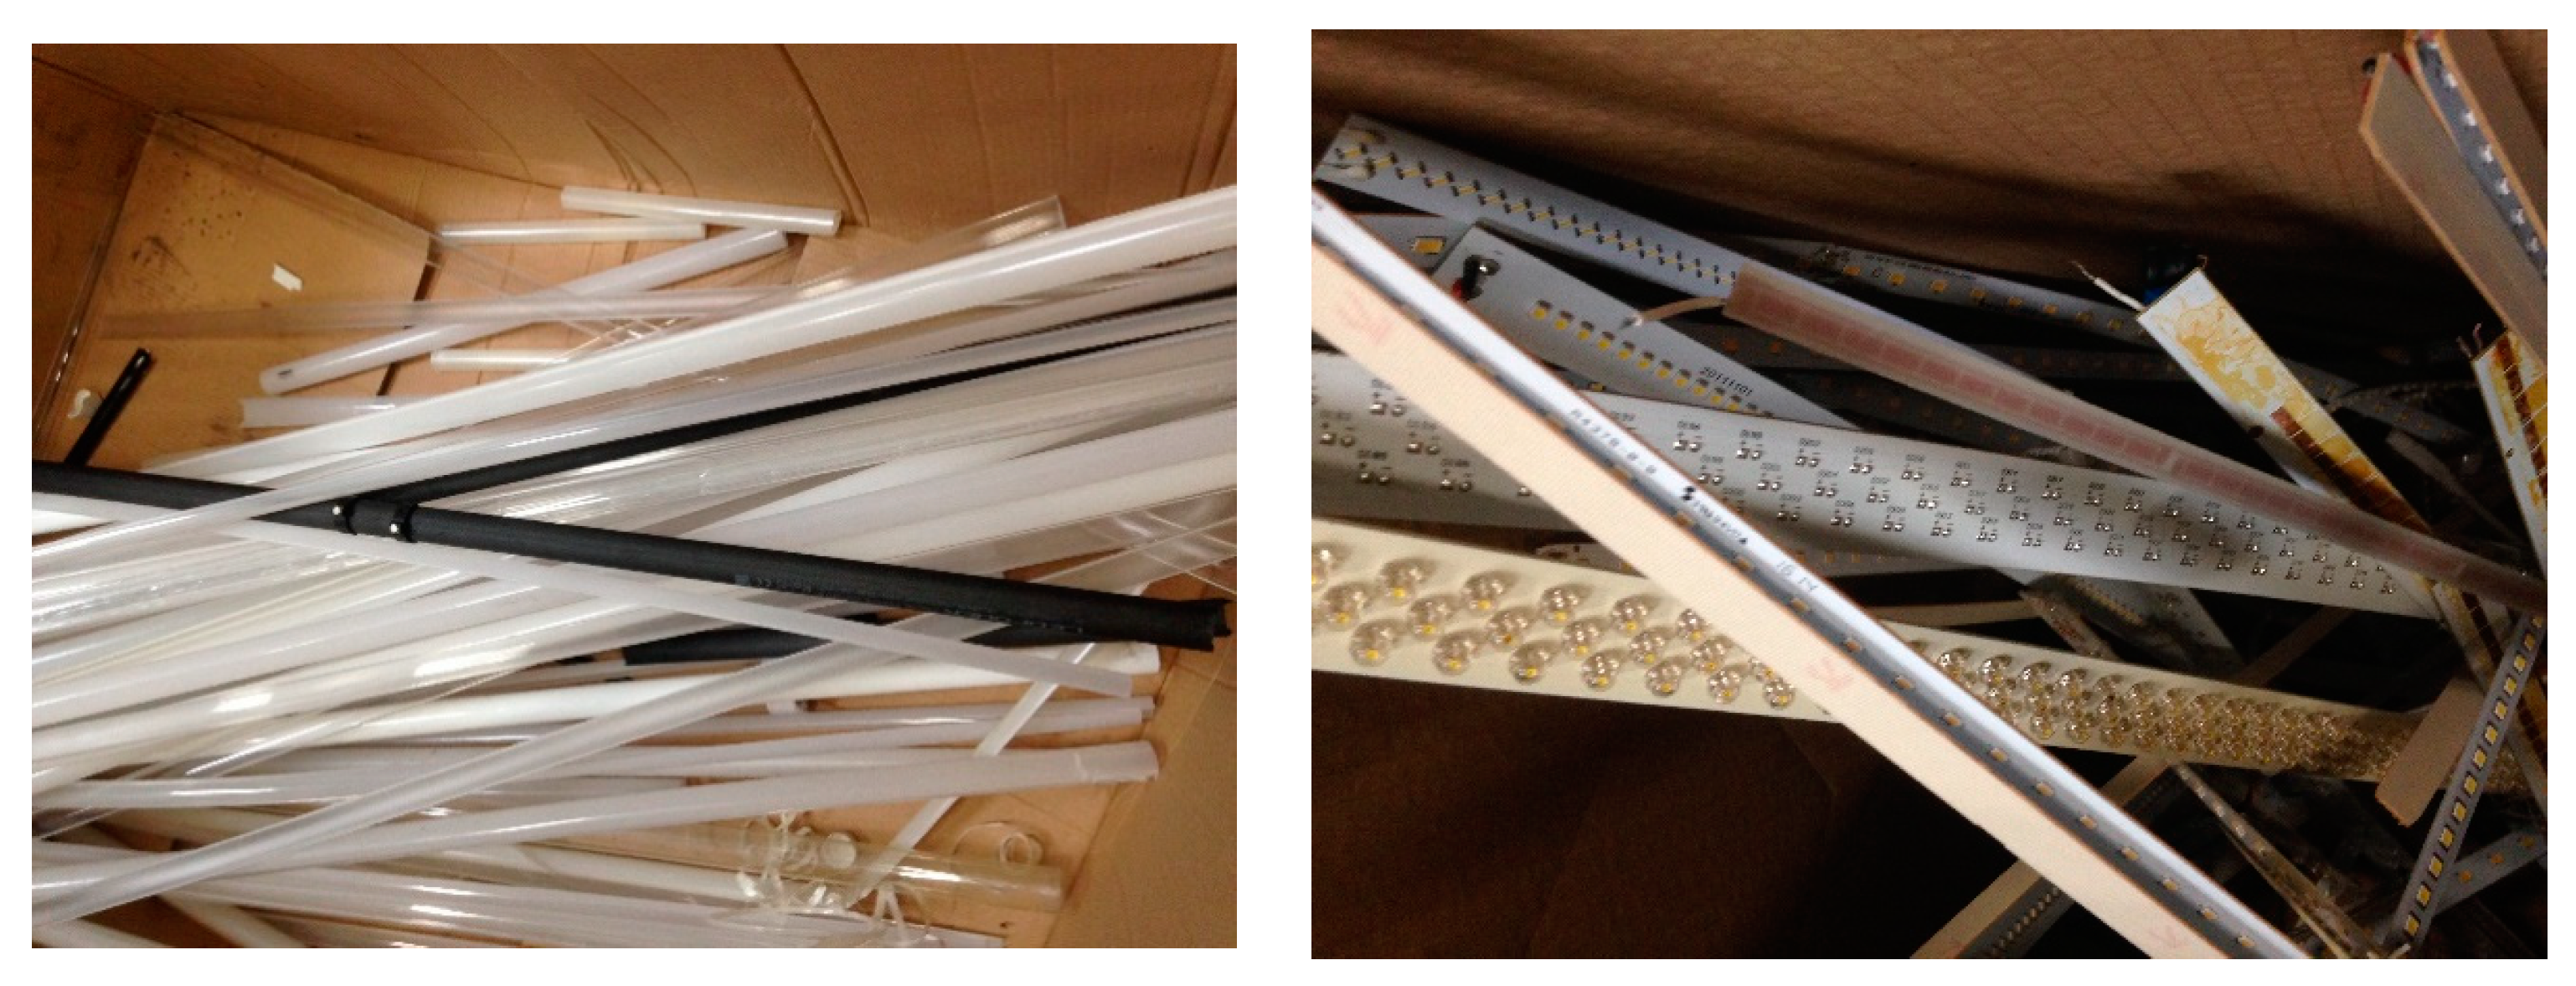
5.5. VRO: RCL (manual)
Based on the observations, only 12 LED lamps were found to be easy to disassemble manually, due to the presence of screws (and absence of epoxy resin). More tubes (25 tubes out of 32) were easily disassembled due to more consistent design. In addition, the output fraction in
Figure 5;
Figure 6, reveals that the structural integrity in LED lamp and tube remains unaltered and, hence, gives the possibility of reusing them in a new product or the other reused product. The structural integrity of the disassembled fractions, such as light diffuser, LED chip package, and aluminum housing, may be incorporated in a remanufactured lamp. Only less than half of the lamps being easily disassembled means that consistent design may double the disassembly efficiency. The main factor that precludes easy and clean fragmentation is the epoxy resin that glued PCBs [
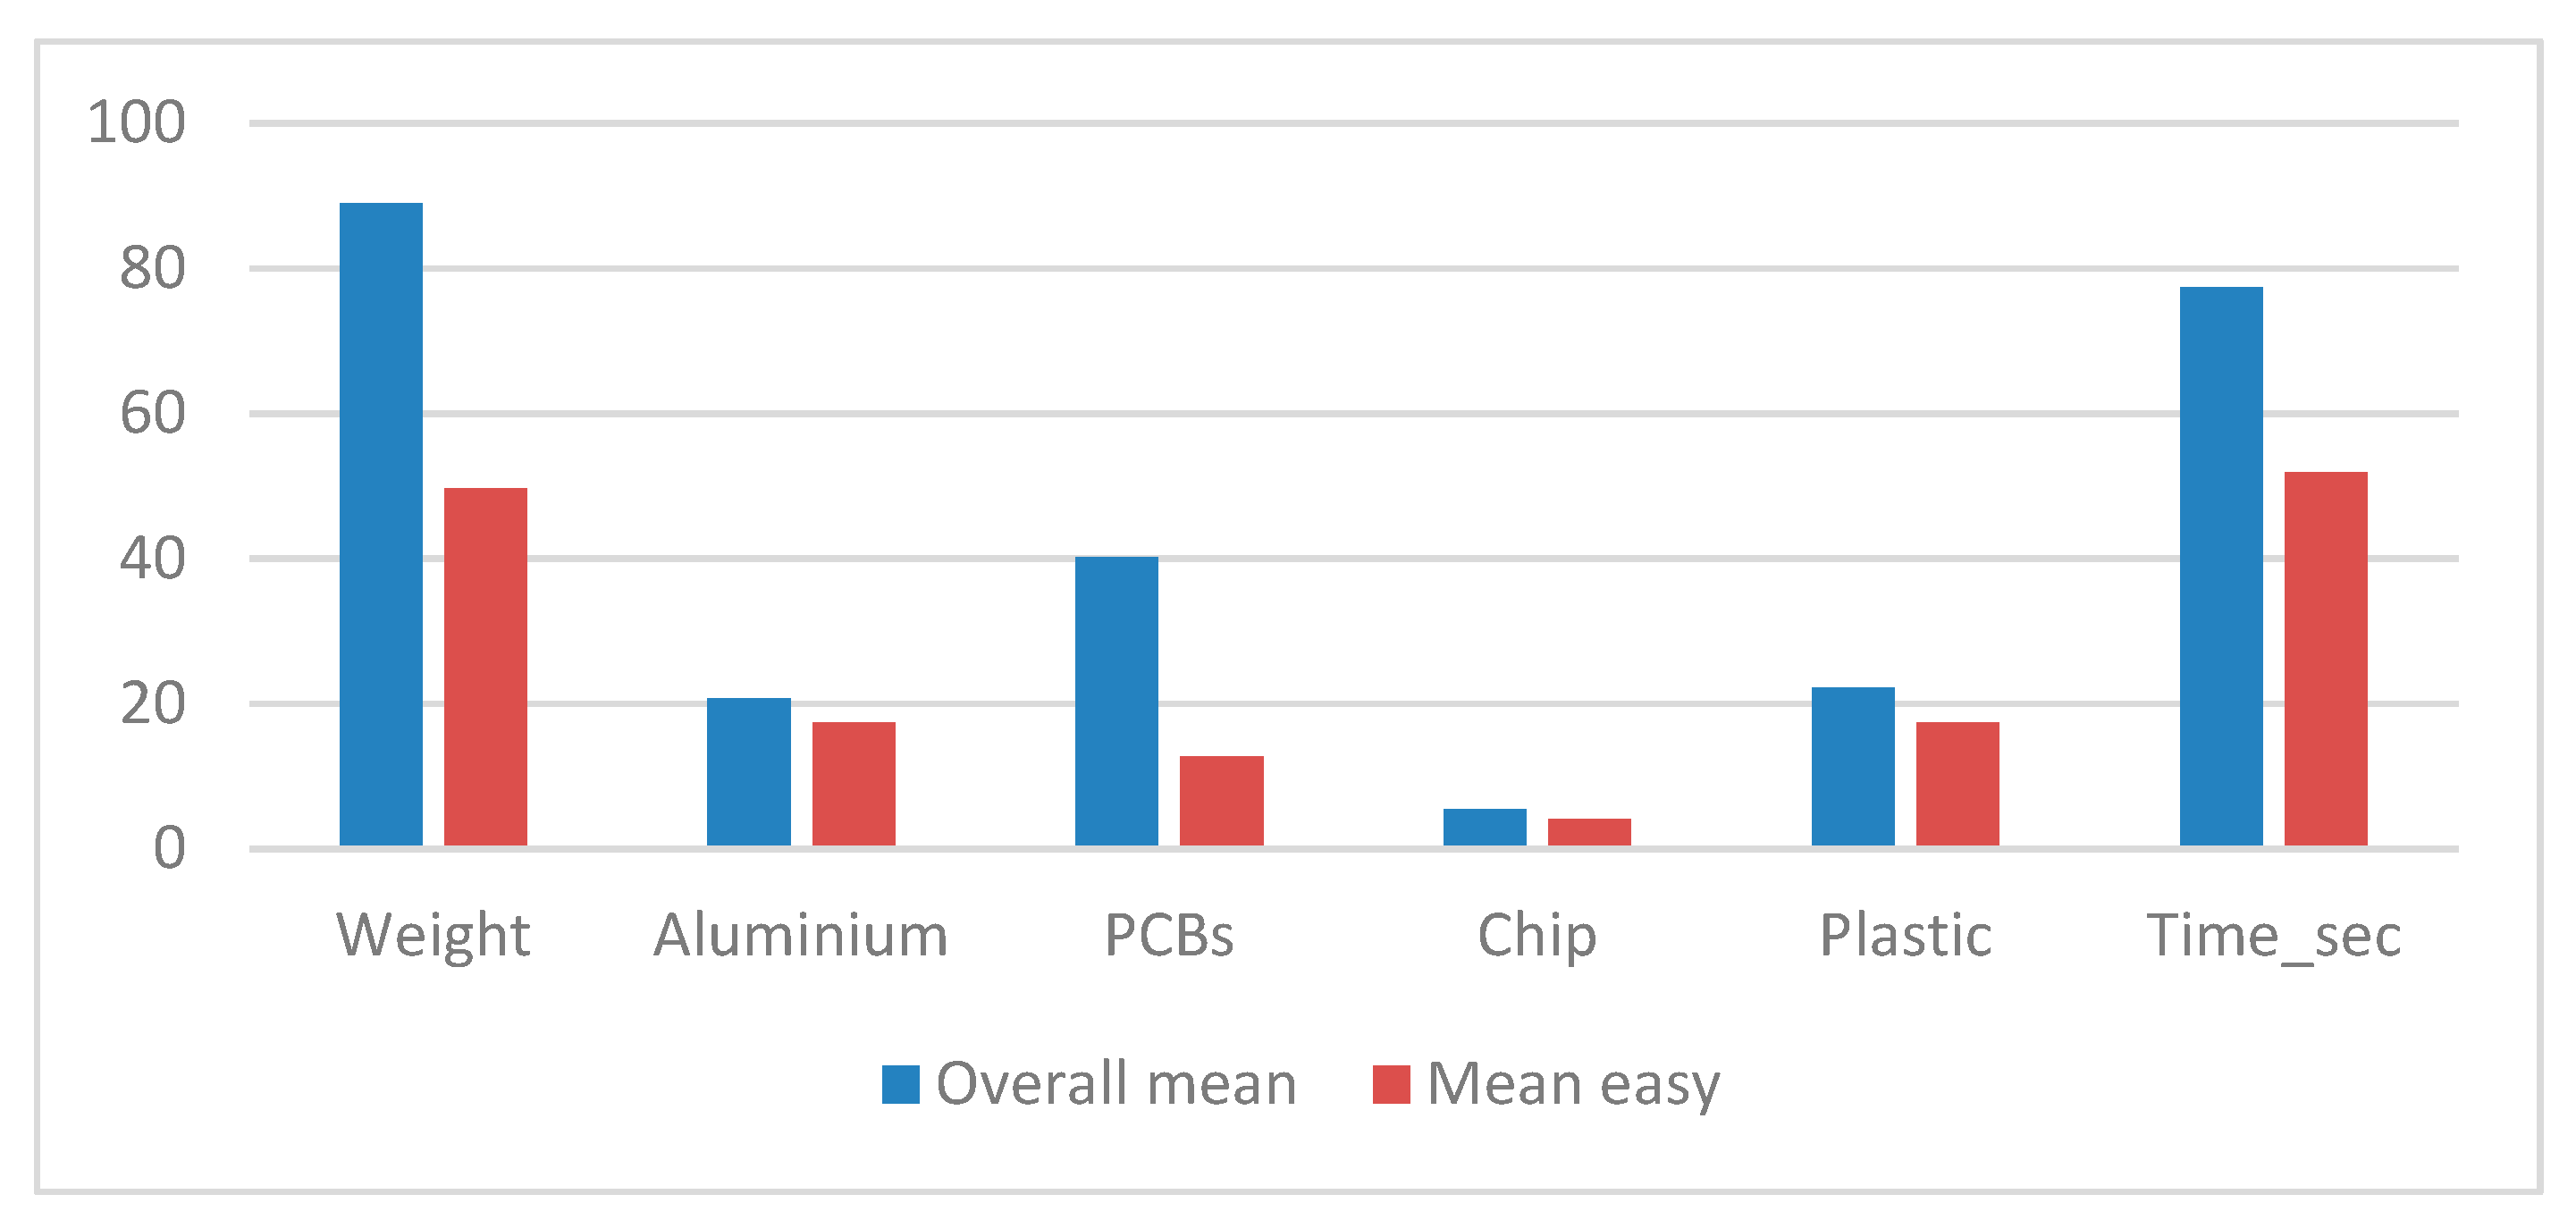
8]. It is found that the average weight of a lamp with this resin is about 40 g higher than the one without it (
Figure 7). In addition, the average time taken for easy disassembly reduces to about 26 s per lamp, raising about 40% disassembly efficiency. This means that if the lamp is redesigned without resin, the efficiency of manual disassembly will be increased by 40%. This will also lead to an improved PCB fraction and, as a result, potentially make the use of manual disassembly economically feasible. It is also important to investigate the thermal management performances of the lamp without using epoxy. A trade-off analysis may reveal the burden of using epoxy in the LED lamp, already acknowledged as an outdated method of managing heat in an electronic appliance [
8].
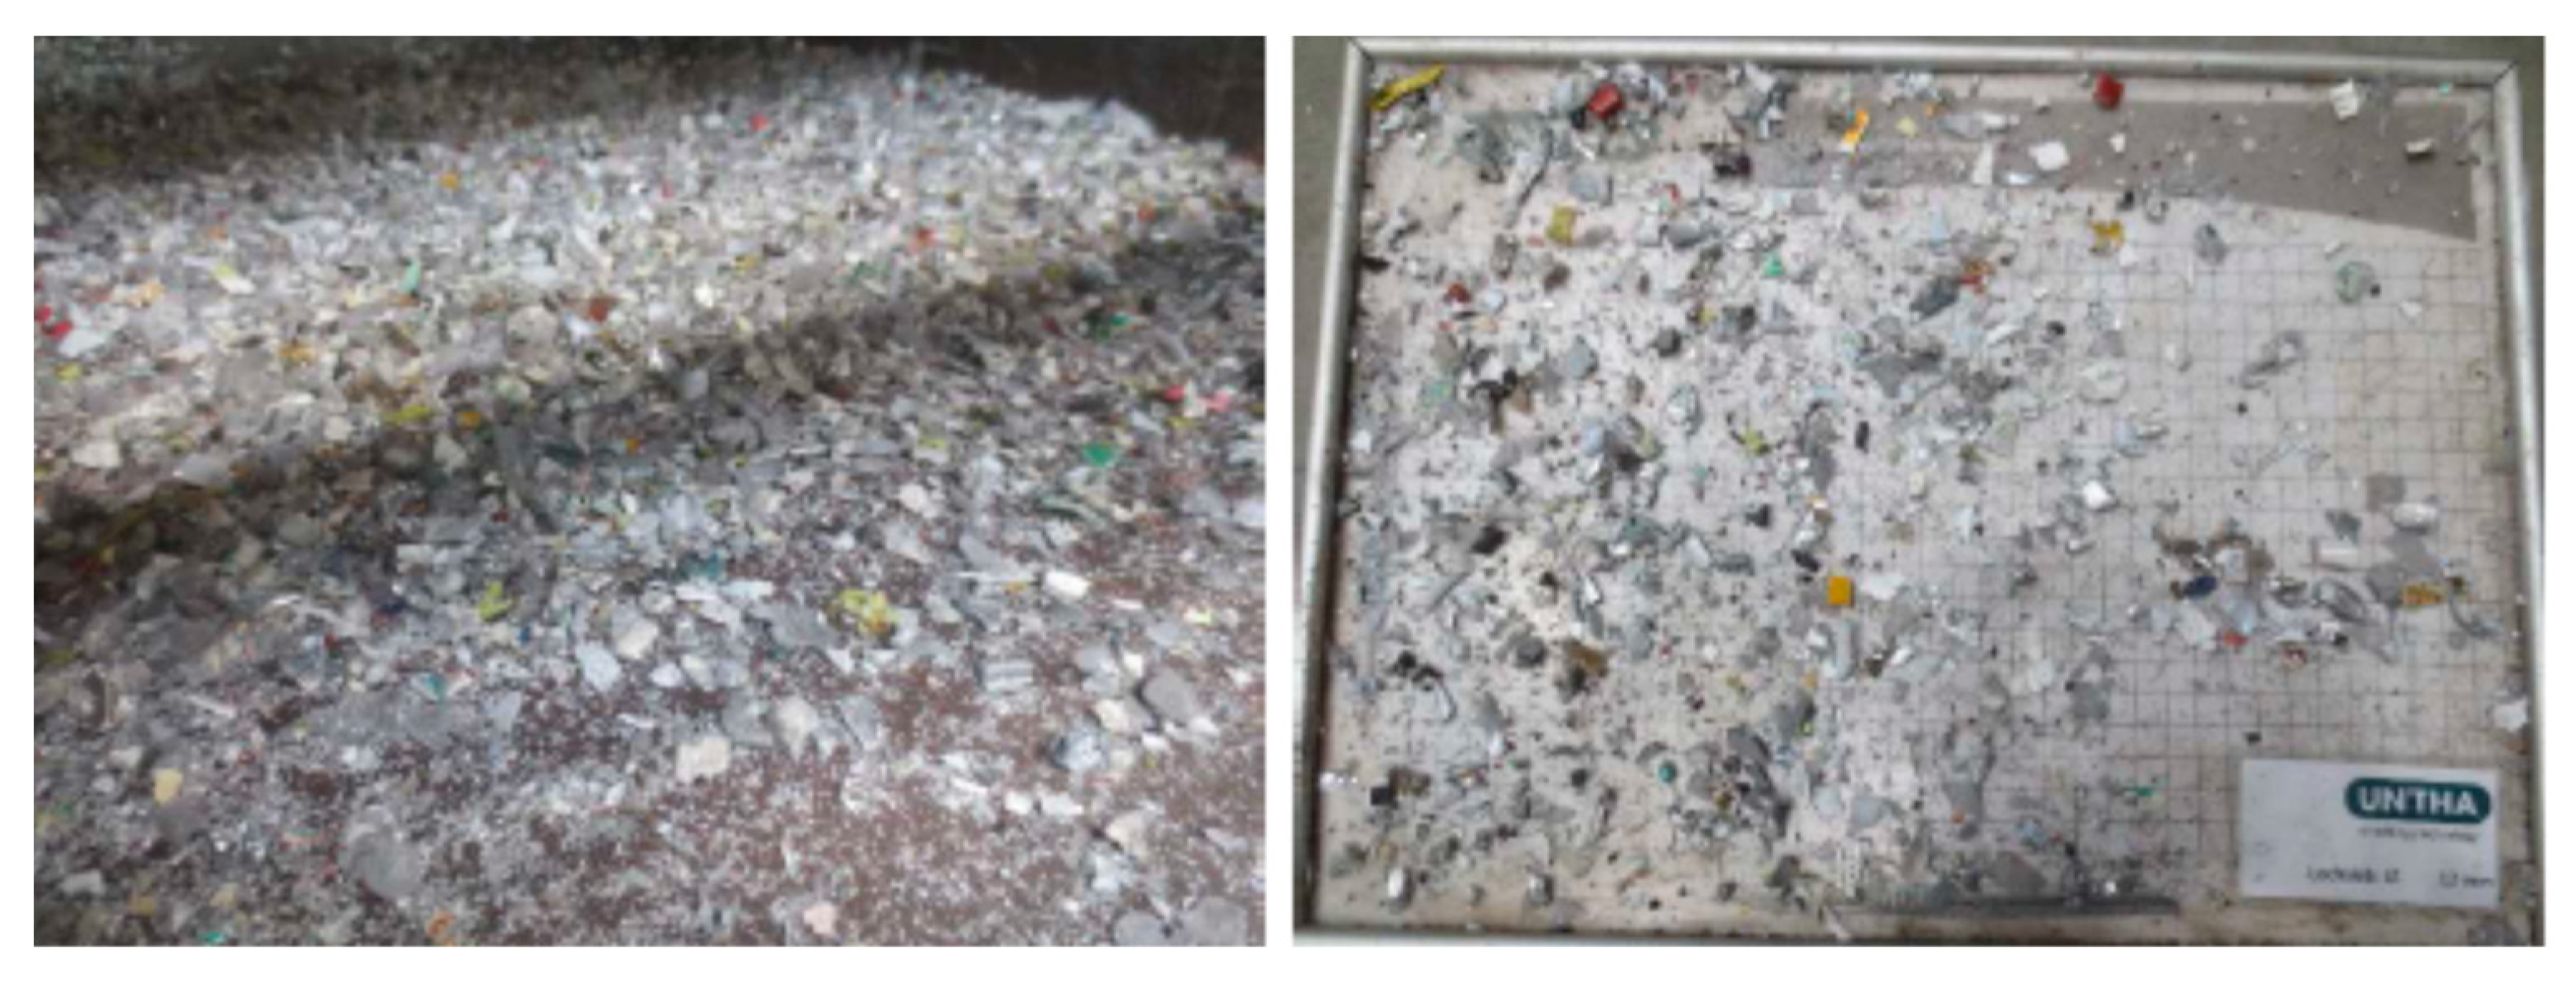
5.6. VRO: RCL (industrial)
100 kg LED lamps were disassembled under an automated disassembly technology, which works on the hydro-comminution principle. The technology generates very high pressure on a water container that fragments the content without any physical contact. As a result, LED lamps get fragmented into major fractions, such as aluminum, plastic, LED chip, and PCBs. Unlike manual disassembly, the fractions get bent, twisted, and, sometimes, broken into small pieces (
Figure 8). The advantage of this approach is its ability to attain high disassembly rates and its potential to replace the traditional shredding approach. Given that LED lamp designs are highly varied, even in the same model, this technology would perform better if the lamp design were upgraded and standardized (
Figure S4). However, the value-added in output fraction needs to be confirmed by the companies of the downstream processors of individual components, such as PCBs. This information is also crucial to estimate the relative benefits of automated and manual disassembly.
5.7. VRO: RML
In Company C, the shredder with a capacity of 460 kg/hour is set to provide its output at a size range, 12–14 mm and shred for 10 min. (
Figure 9). The output is then separated by company A with a result of Ferrous 4%, Non-Ferrous 26% and mixed portion 70%. Using company B’s crushing and sorting process, the percentage output fraction is 10%, 30%, and 60%, respectively (
Table 5). The major concern of these tests is the plastic rich portion that cannot be recycled and it is a burden for the recycling company. In addition, these results did not satisfy the minimum recycling rate as the largest portion mixed with plastic and other metals appears to be unsaleable.
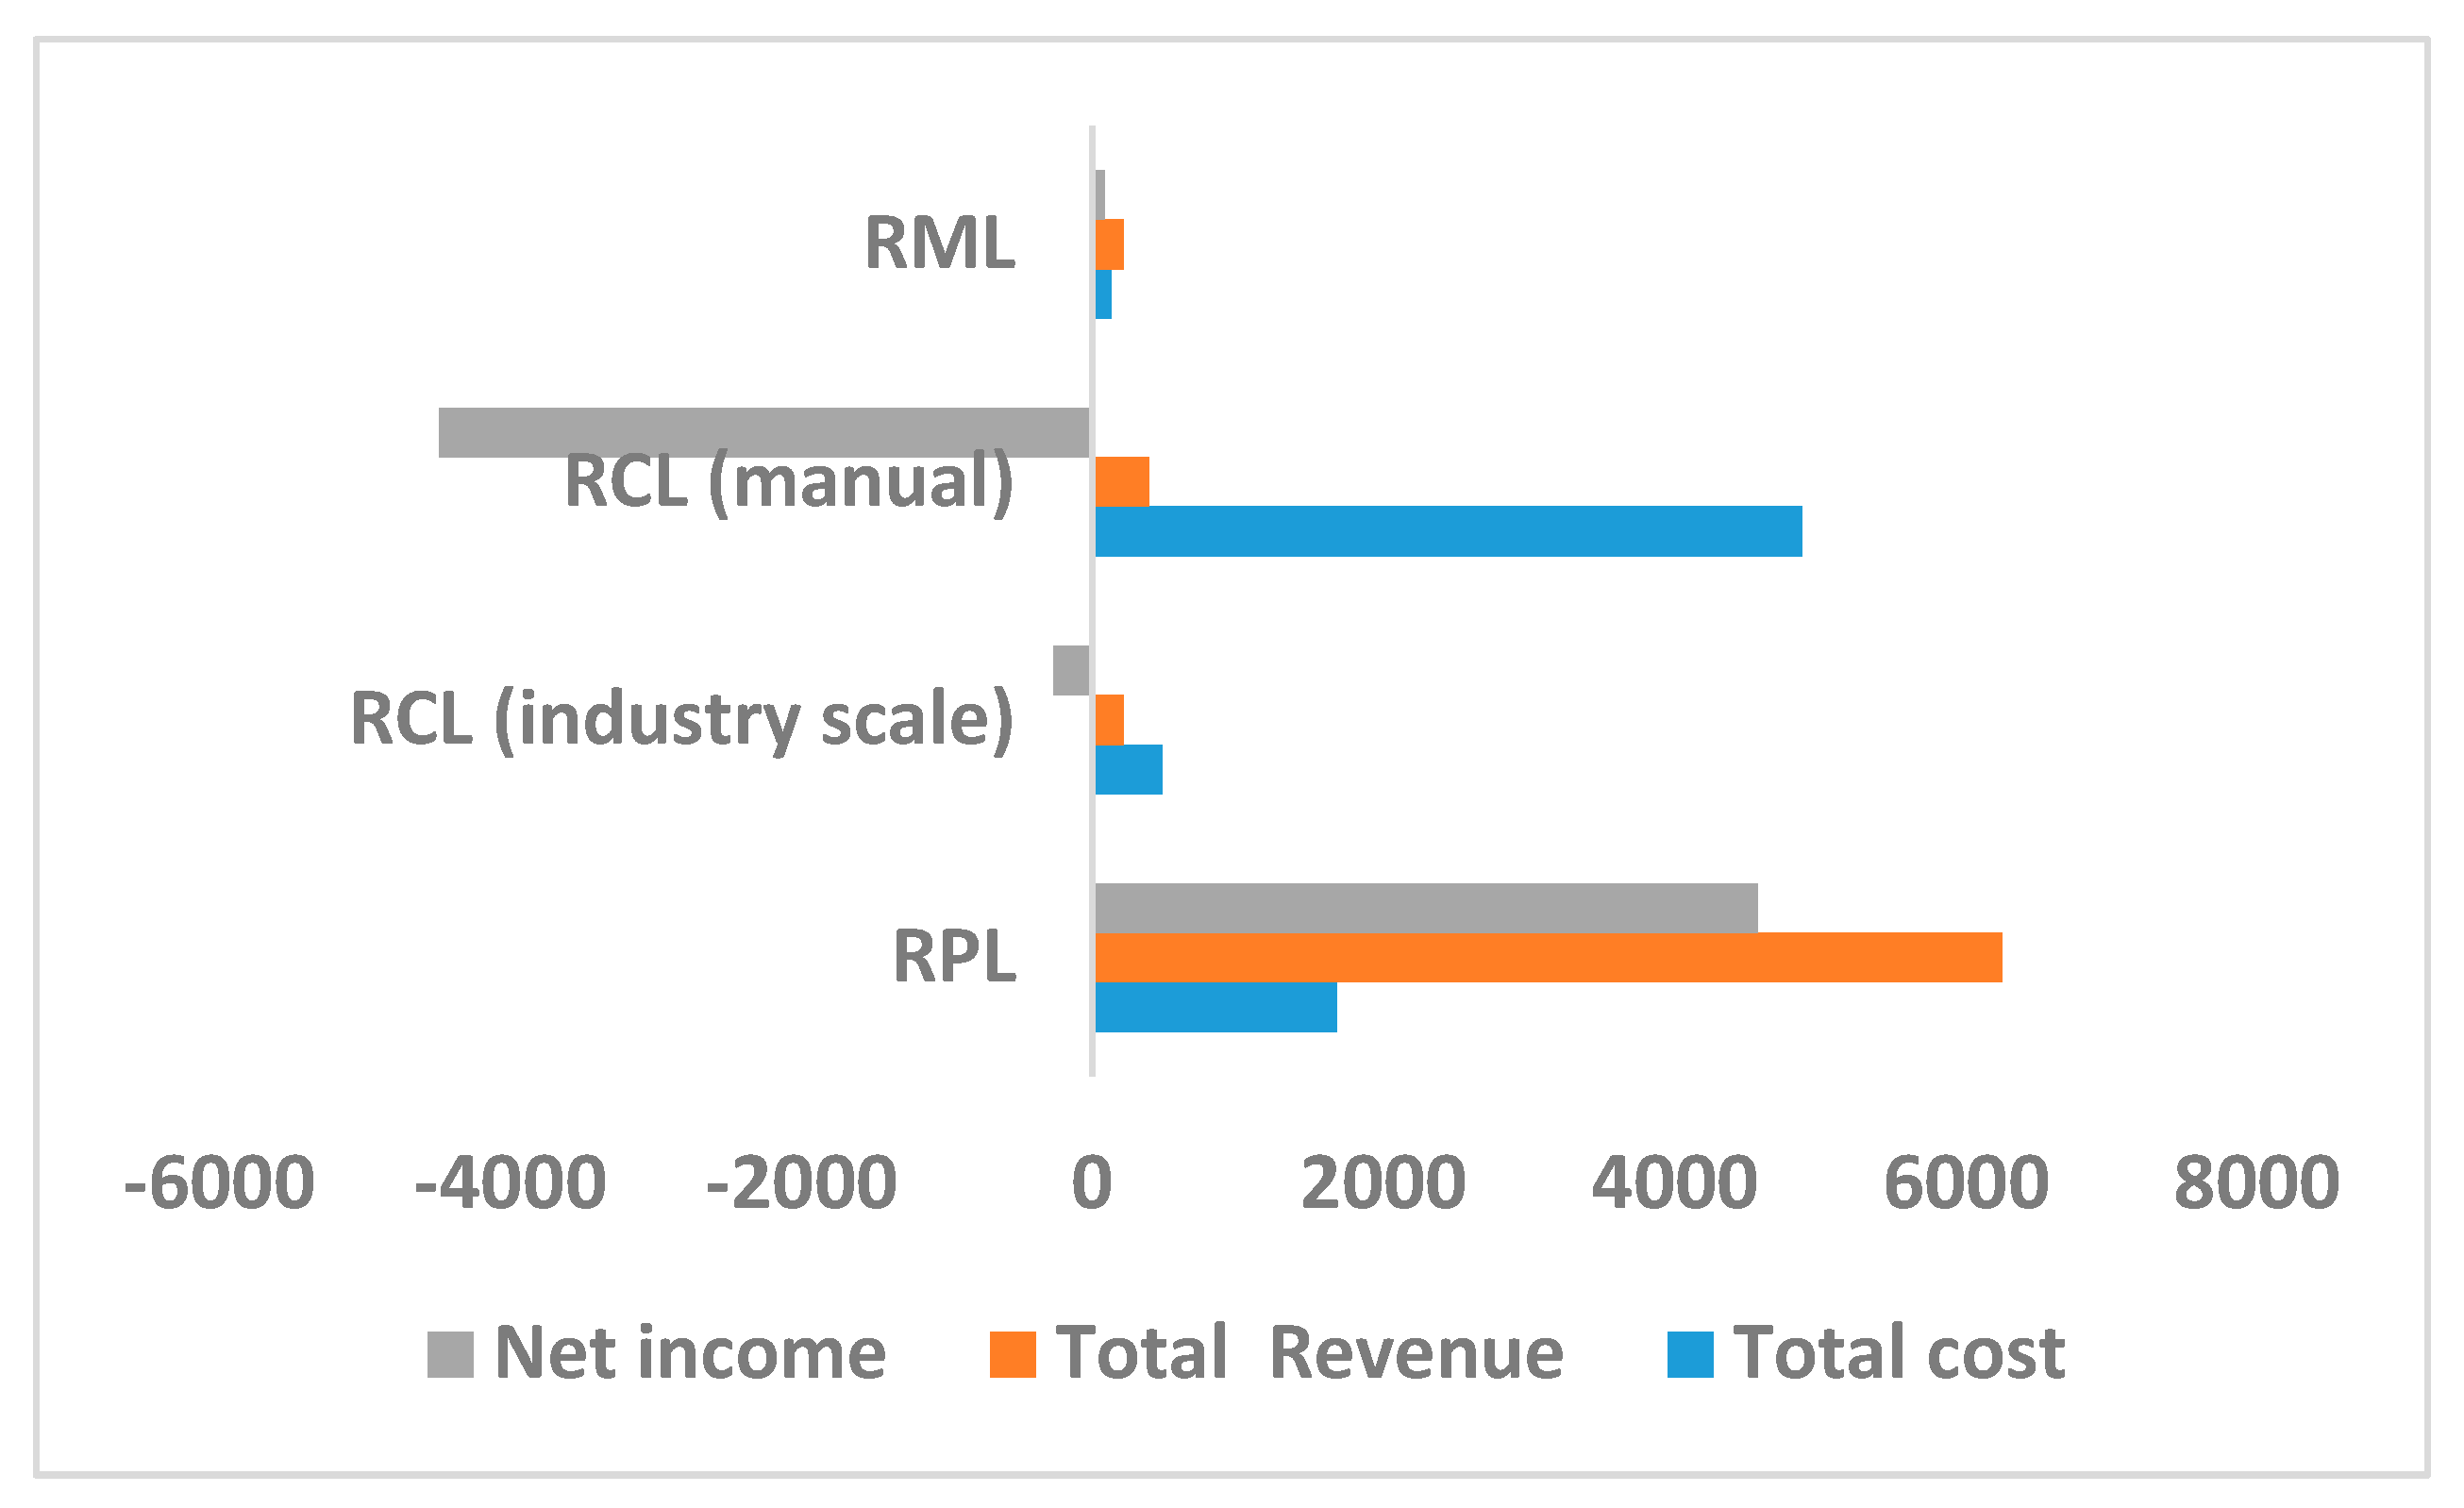
5.8. Economic Feasibility
The economic feasibility of the VROs shows that RPL earns about 4000 euro per ton, while considering that the selling price of a functioning lamp is one euro. The cost did not include testing, upgradation, validation, and standardization due to the absence of any example of secondary market for small household appliances. While considering those costs, this scenario is still far more profitable than the other scenarios. Net income in scenario IV is about 93 euro, while it is negative for Scenario II and III. Net income in scenario II is negative due to high investment and operating cost; while, in scenario III, net income is even lower, due to high labor cost. For scenario II, the output price is estimated to be the same as scenario IV. While in scenario III, labor cost is assumed to be the only cost. Based on economic criteria, a combination of the scenario I and scenario IV seems to be economically feasible (
Figure 10).
5.9. Scenario Analysis
A SWOT analysis is conducted for each scenario in
Table 6. In scenario I, RPL requires a testing, repairing, and standardization services, and therefore the development of secondary market and communication of the related information in the relevant firms are essential. However, low demand of the product and lack of supportive policy are the challenges. The strength of this scenario is possibility of profitability and high acceptance as a CE strategy. While considering the challenge associated with this scenario, the occurrence possibility is considered as low.
In scenario II, system parameters, such as recyclate quality, investment costs, and input symmetry, are very important for RCL (industry) to succeed. The challenges that are associated to this scenario are uncertain profitability, technology maturity, and input symmetry. The strength of this scenario is its potential for large scale industrial disassembly. While considering the strength and weakness, the chance of occurrence is medium, because this technology is still superior to the shredding technology and it may flourish if favorable policies are formulated and products are more consistent and modular.
In scenario III, disassembly rate is very important to determine the feasibility of RCL (manual). The learning curve of the workers in the context of improved design may lead to the attainment of desired disassembly rate. Beyond this internal factor, the selling price of the output is very important, as opposed to the high labor cost in EU. Occurrence possibility of this scenario is low as labor cost and policy update poses considerable challenge to this scenario. The development pathways may be to improve the product design and increase the selling value of the component. The strength of this scenario is that the output fraction is very clean without any twist and bent.
In scenario IV, energy cost and feedstock processing time are crucial for ensuring profitability. The challenge of this scenario is to be able to reach at the minimum recycling rate while ensuring output quality. The strength is the low-cost technology, and thus occurrence possibility is high as the current policy does not require sophisticated parameterized technology as long as recycling rate is achieved. The development pathway may be to develop shredding technology with more options for parameter setting so that the further granulation is avoided, and more sortable fraction appear.
Some parameters stand out while considering all scenarios combined. For example, the design consistency of the lamps in the market, recyclate quality, disassembly rate, selling price and upscaled technology are crucial for the implementation of the high VROs.
6. Discussion
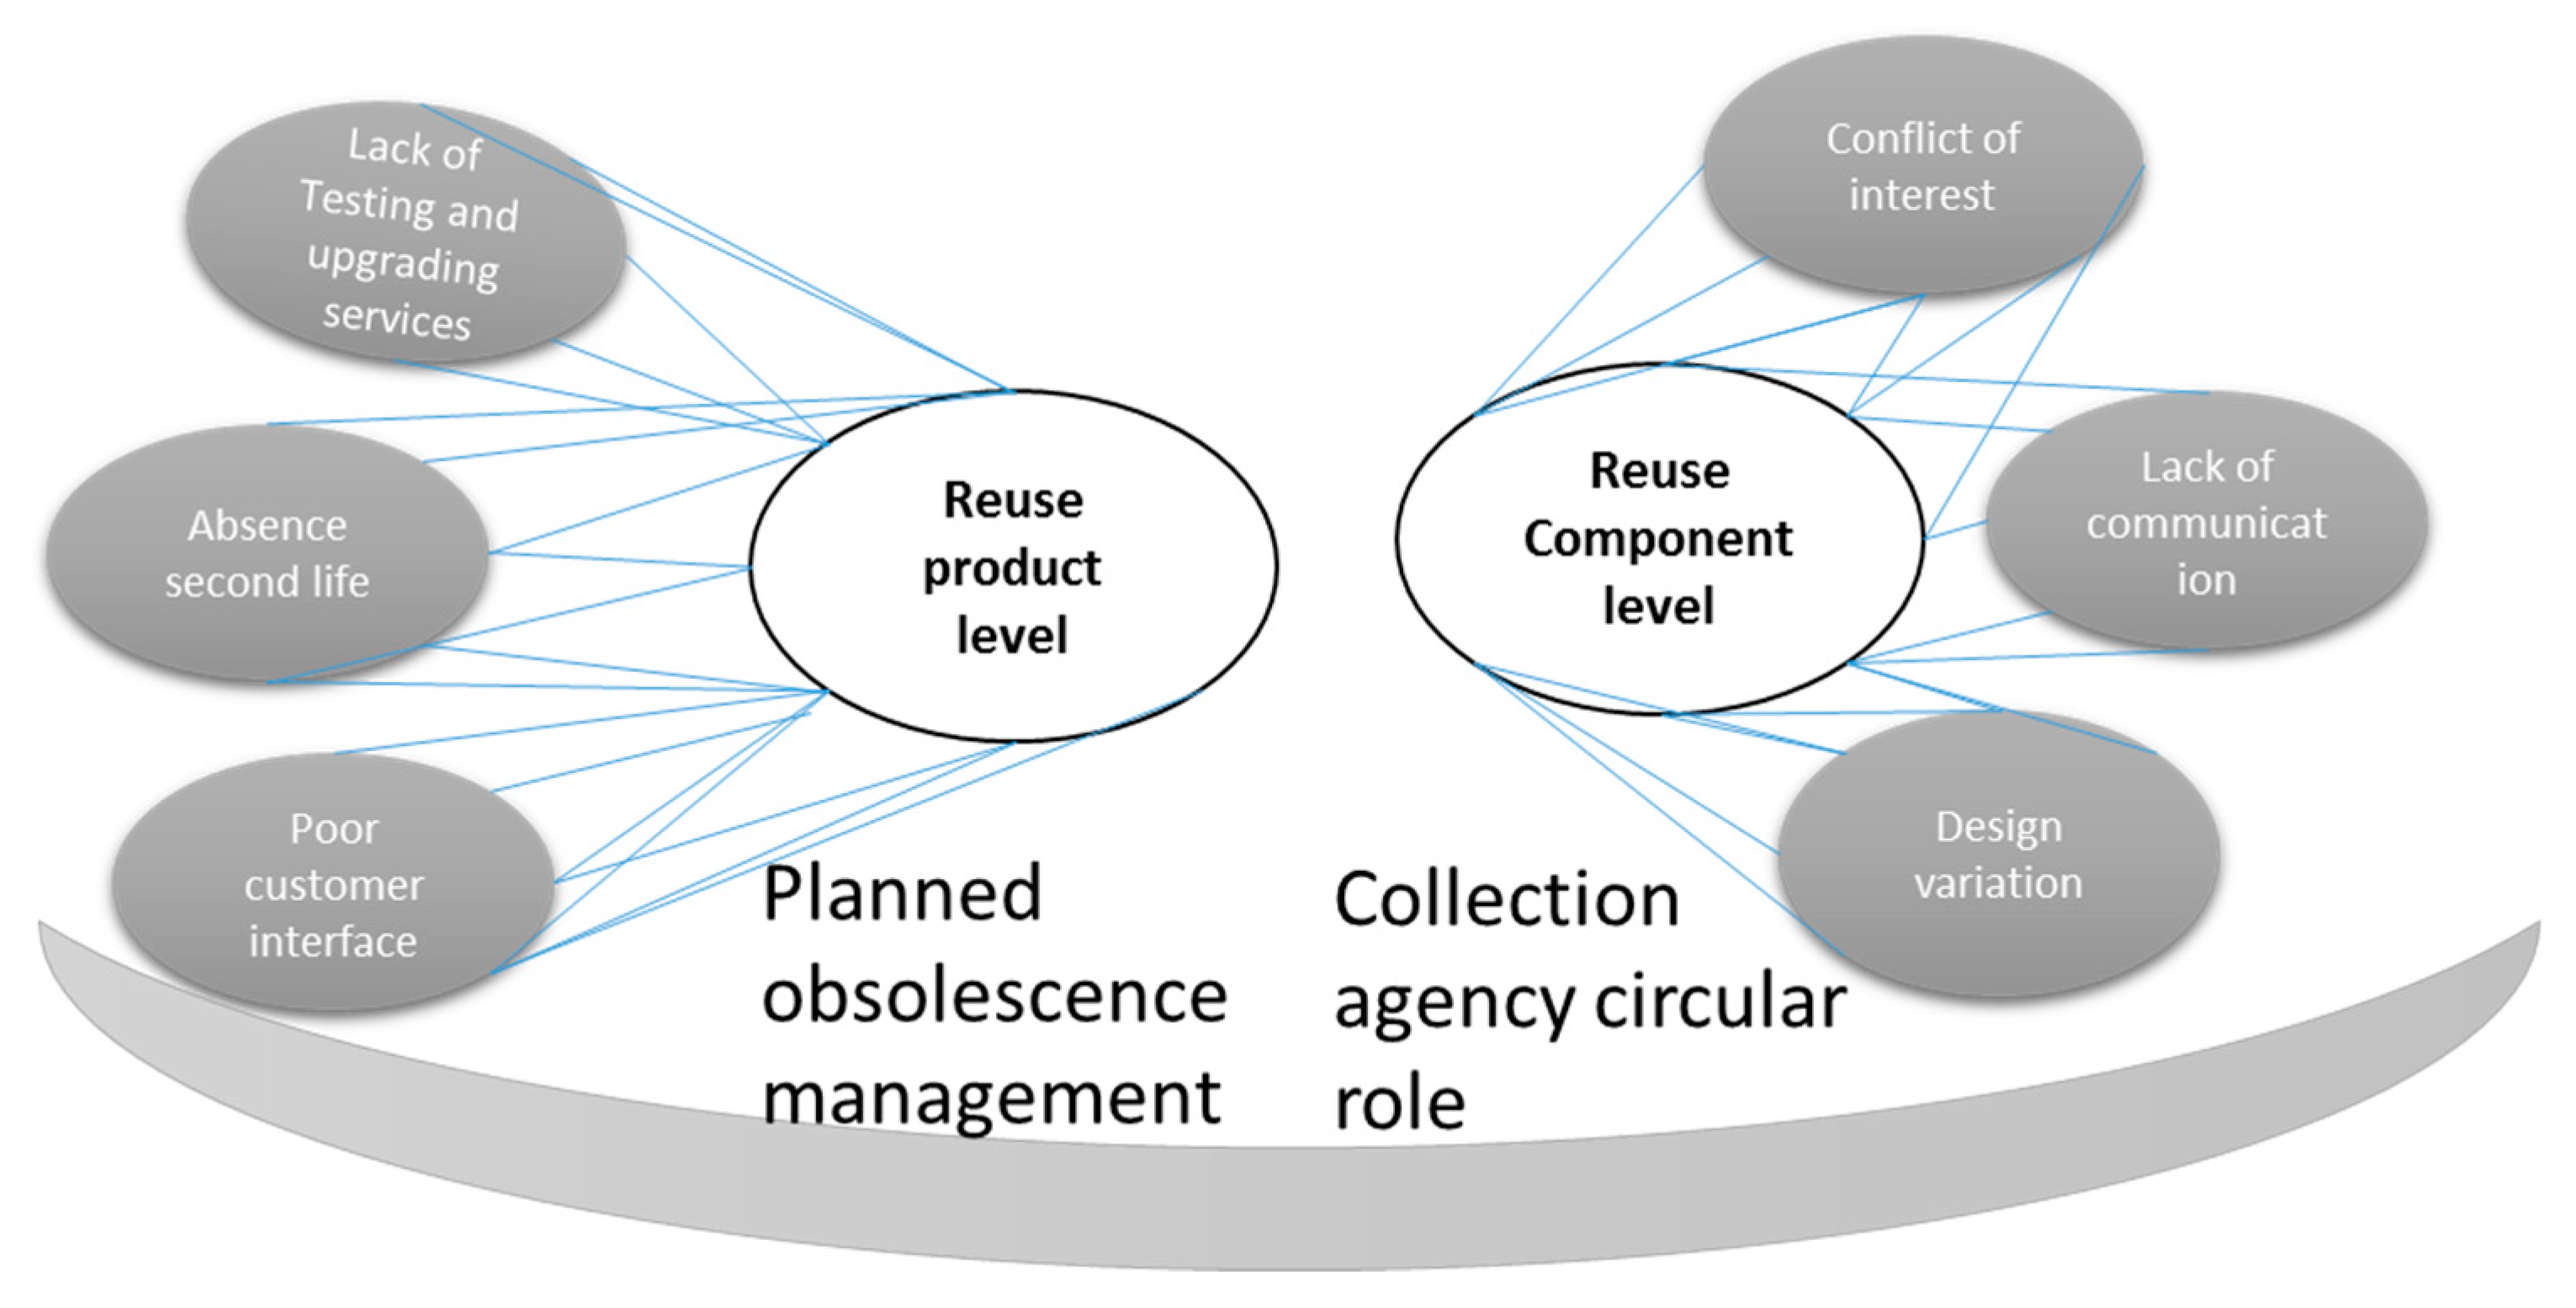
When comparing the VROs that were applied in the LED lamp preprocessing, RPL and RCL may emerge as a potential VRO of LED lamp EOL treatment, an option that is highly regarded in the circular economy strategy. RPL faces four challenges: lack of sophisticated testing and upgrading services; absence of a second-hand market; uncertainty about customer acceptance and motivation; and, conflicting policy contexts.
(1) Sophisticated technology for the identification and measurement of the functionality of the lamp at the industrial scale is missing. This study used laboratory scale technology, which has potential for automatization to increase the speed of testing. It also needs to be coupled with other testing technologies, such as photometric technology, failure detector machines, and others. Further studies are needed on this subject. Reck and Graedel [
12] pointed out that a sophisticated process model is applied to the upstream manufacturing industries, but only a basic technological approach is applied to the recycling options.
(2) An intermediate remanufacturing process that provides necessary repairs, testing, and upgrading services for the reusable LED lamps needs to be established. This will facilitate marketing opportunities and eliminate barriers for the secondary products, especially small household appliances. Usually, this type of secondhand market exists for high value appliances, such as smartphones, but not low value appliances, like LED lamps. A reusable lamp is estimated to be economically profitable if it sells at less than 1 percent of price of the new product. Literature suggests that remanufacturing a product is potentially acceptable at the prices of about 40–60% of the new product. However, the barriers are the identification of failure correction of the LED bulb, lumen testing and improvement, module replacement, and packaging—which all need to be included in the costs (
Figure 11).
(3) Due to the inexpensive nature of the LED lamp, the consumers do not consider buying second hand lamps, especially in the European market, which leads to the issue of customer attitudes to secondary products. Social acceptability is crucial. For example, the tire retreading market gradually decreased due to users’ safety concerns, while reconditioned engines and furniture from end-of-life shops are widely accepted as luxury goods for middle-class consumers in Bangladesh [
41,
42]. The literature suggests that most low value appliances either end up in landfill or find places in relatively poor countries [
15]. Consumers may be encouraged to use this type of value preserving products through tax cuts [
33].
(4) Misaligned policy context: EPR has been enacted to ensure that waste gets proper treatment at the end-of-life. The impact of such policies is supposed to result in improved interaction or increased information flow among the upstream manufacturers and downstream recyclers or processors [
41]. However, this is not the case. For example, EPR is often managed by the central collection agency, through which upstream manufacturers and downstream recyclers are linked. As collective producer responsibility is predominantly practiced throughout the recycling regime, this is, de facto, removed from the psyche of upstream industries. This is demonstrated by the lack of effectiveness of the impact of EPR on traditional design practices, which are largely oblivious to environmental externality [
43]. Disbursing funds to the EPR scheme conclude the manufacturers’ responsibility. In other words, EPR did improve the material/metal circularity through some form of recycling at the end of life, but without representational circularity, motivation for gradual improvement of design that favors recycling is lost. Here, representational circularity is defined as the presence or preservation of the identity of the producer throughout the entire value chain.
Furthermore, EOL cost is not incurred by the producers, instead, often shifted to the consumers. For example, the end-of-life vehicle directive Netherlands and the textile product eco-tax in France levy taxes (45 Euro and 0.05 Euro/kg, respectively) at the point of sale, demonstrating that it is consumers who pay for the externality—an indirect failure of achieving the targeted objective of putting the producer into the design thinking process [
41]. In addition, an EPR subsidized market does not reflect a demand-pull market, as most of the revenue share of the end-of-life operators comes from EPR funding, which raises doubts regarding the strength and compatibility of the material market under current economic contexts and existing business models [
44].
RCL faces five challenges: wide design variation; conflict of interests; individualized business communication; inappropriate methodology selection; and, mass-based recycling evaluation.
(1) The wide variability of LED lamp design precludes the adoption of sound recycling options. For example, manual disassembly does not perform at an expected level due to added epoxy resin, and the application of automotive disassembly does not attain the expected output quality due to inconsistent assembly systems (screws, snap and fit and others).
(2) Conflict of interests may well pose a challenge to the adoption of high VROs. The knowledge of value content and easiness/difficulty of liberating that value is best known to manufacturers. It does not often pass to the recyclers, due to a lack of collaboration among manufacturers and recyclers. This means that the knowledge holders (manufacturers) do not participate to the downstream recyclers to identify ways for more value recovery due to the lack of monetary incentive for their knowledge sharing [
41]. In addition, for a long-lived product, upstream designers and manufacturers do not consider the status of the recovery technologies when the products reach at end-of-life. This necessitates a continuous exchange of information and interaction among the groups of value chain actors, so that action and strategy in a changing policy and technological environment can be cooperatively adopted and value appropriation can be distributed accordingly.
(3) The lack of information regarding the value content and communication among the supply chain actors was observed during the experimentation of this study. For example, LED lamp processing companies lack information on where to sell the high value product (still-functioning lamps and the recovered components of the LED tubes that retain their functions at the component level by manual disassembly). The fractions of manual disassembly might generate high revenues due to their reuse potential by upstream manufacturers or feed into the recovery units of precious metals processing companies. In the absence of such crucial information that is related to the value chain, firms can, even unconsciously, mix up products, sacrificing the prospect of company level efficient circularity [
34]. This, in turn, demonstrates that the co-creation of values is possible when downstream companies are open to the exchange of business information with the other actors of the value chain. Studies on industrial symbiosis showed that a top-bottom approach for increasing communication among the stakeholders of the similar businesses might not be effective in the establishment of industrial symbiosis. On the other hand, it is found that an informal level of social, cultural, and institutional embeddedness may enable an efficient flow of valuable information among the connected actors, leading to the possibility of creating value that makes all actors in the node better off [
45].
Crucially, (4) the selection of method, such as choosing higher VROs instead of low VROs (shredding), is important. Bachér et al. [
46] showed the economic loss of shredding modern electronic appliances such as mobile phones. They found that for every kg of mobile phones shredded to a size above 8 mm, a total of 17.8 euro is lost, mainly in reduced value for Gold (about 14€) and Palladium (about 3€). Another study found that the careful collection and presorting of small WEEE potentially increased gold recovery from 26% to about 43% and Gallium up to 30% [
47]. Buchert et al. (2012) estimated that the additional granulation of the components led to a loss of 70% of the metal recovery at downstream processing. Bulk material is also lost due to inappropriate WEEE preprocessing. The lack of proper pre- and post-processing of WEEE results in a loss of 2.4 million tons of ferrous metals, 1.2 million tons of plastics, and 0.65 million tons of Copper. In addition, about 77% of current municipal waste ended up in landfill in 2001/2 [
48]. In this study, the plastic rich fraction resulted from shredding also demonstrate the loss, potentially leading to landfill.
(5) Mass-based recycling evaluation is at the core of policy regulations [
11]. The existing policy frameworks only oblige the preprocessing company to achieve recycling rates that are above 80%. The framework does not require other VROs to be exploited, or, at least, does not incentivize them to try and identify the higher VROs that are environmentally more demanding [
11]. At the EU level, WEEE recycling targets were re-evaluated with the aim of setting a reuse target (European commission 2017). They found that about 70,000 tons of WEEE is reused or prepared for reuse in the member states, which in the UK accounts for about 8% of their total WEEE recycling. They summarized that EU member states are not well prepared for the reuse, and for that to improve WEEE quantities and their material content need to be understood and the economic feasibility of the changing logistics needs to be assured [
49].
Achieving the Desired Level of Quality Circularity: Planned Obsolescence Management and the Circular Role of Collection Agencies
Crucially, the presence of functioning bulb in the waste stream reminds us of the Planned Obsolescence (PO) phenomenon that is associated with LED lamp use and disposal. LED lamp technology is evolving very rapidly through dramatic efficiency increases and cost reductions, which may render the existing LED lamp obsolete from a cost effectiveness point of view. Today, the average LED lamp retail price is
$23.50 per unit, a 9.4% drop from the same time last year. During the past 12 months, the lumens per dollar ratio of LED lamps has increased by 17.5 percent to 30.2 lumens per dollar [
50]. Therefore, companies find it profitable to install the more efficient and most recent LED lamps, throwing away comparatively less efficient lighting, but leading to overall cost savings. The challenges are reinforced when the cost of repair is high. E-SCOPE survey found that 68% respondents found the cost of repair determines their repairing decisions. A new washing machine prices increased by about 40% in the decade 1980–1990, but the repair costs increased by 165% [
48].
In the EU, various legislative approaches have been taken to address PO [
51]. In fact, repair and remanufacturing industries seek policy incentives to increase product durability and reparability, a crucial aspect for establishing a ‘second life’ market. Two important factors were suggested to eliminate intentional PO: access to spare parts at reasonable cost and the access to appropriate repair information. French policy against intentional PO is the strongest among the EU countries, in that the intentional PO is regarded as a ‘criminal offence’. The types of PO that were identified in French parliament are voluntary introduction of defects, a weakness, a planned or premature outage, at technical limitation, an inability to repair, or an incompatibility. Furthermore, the term, “inability to repair” is further specified by clarifying the term as “a product that cannot be dismantled or that spare parts necessary for its functioning are missing” [
51] (p 387).
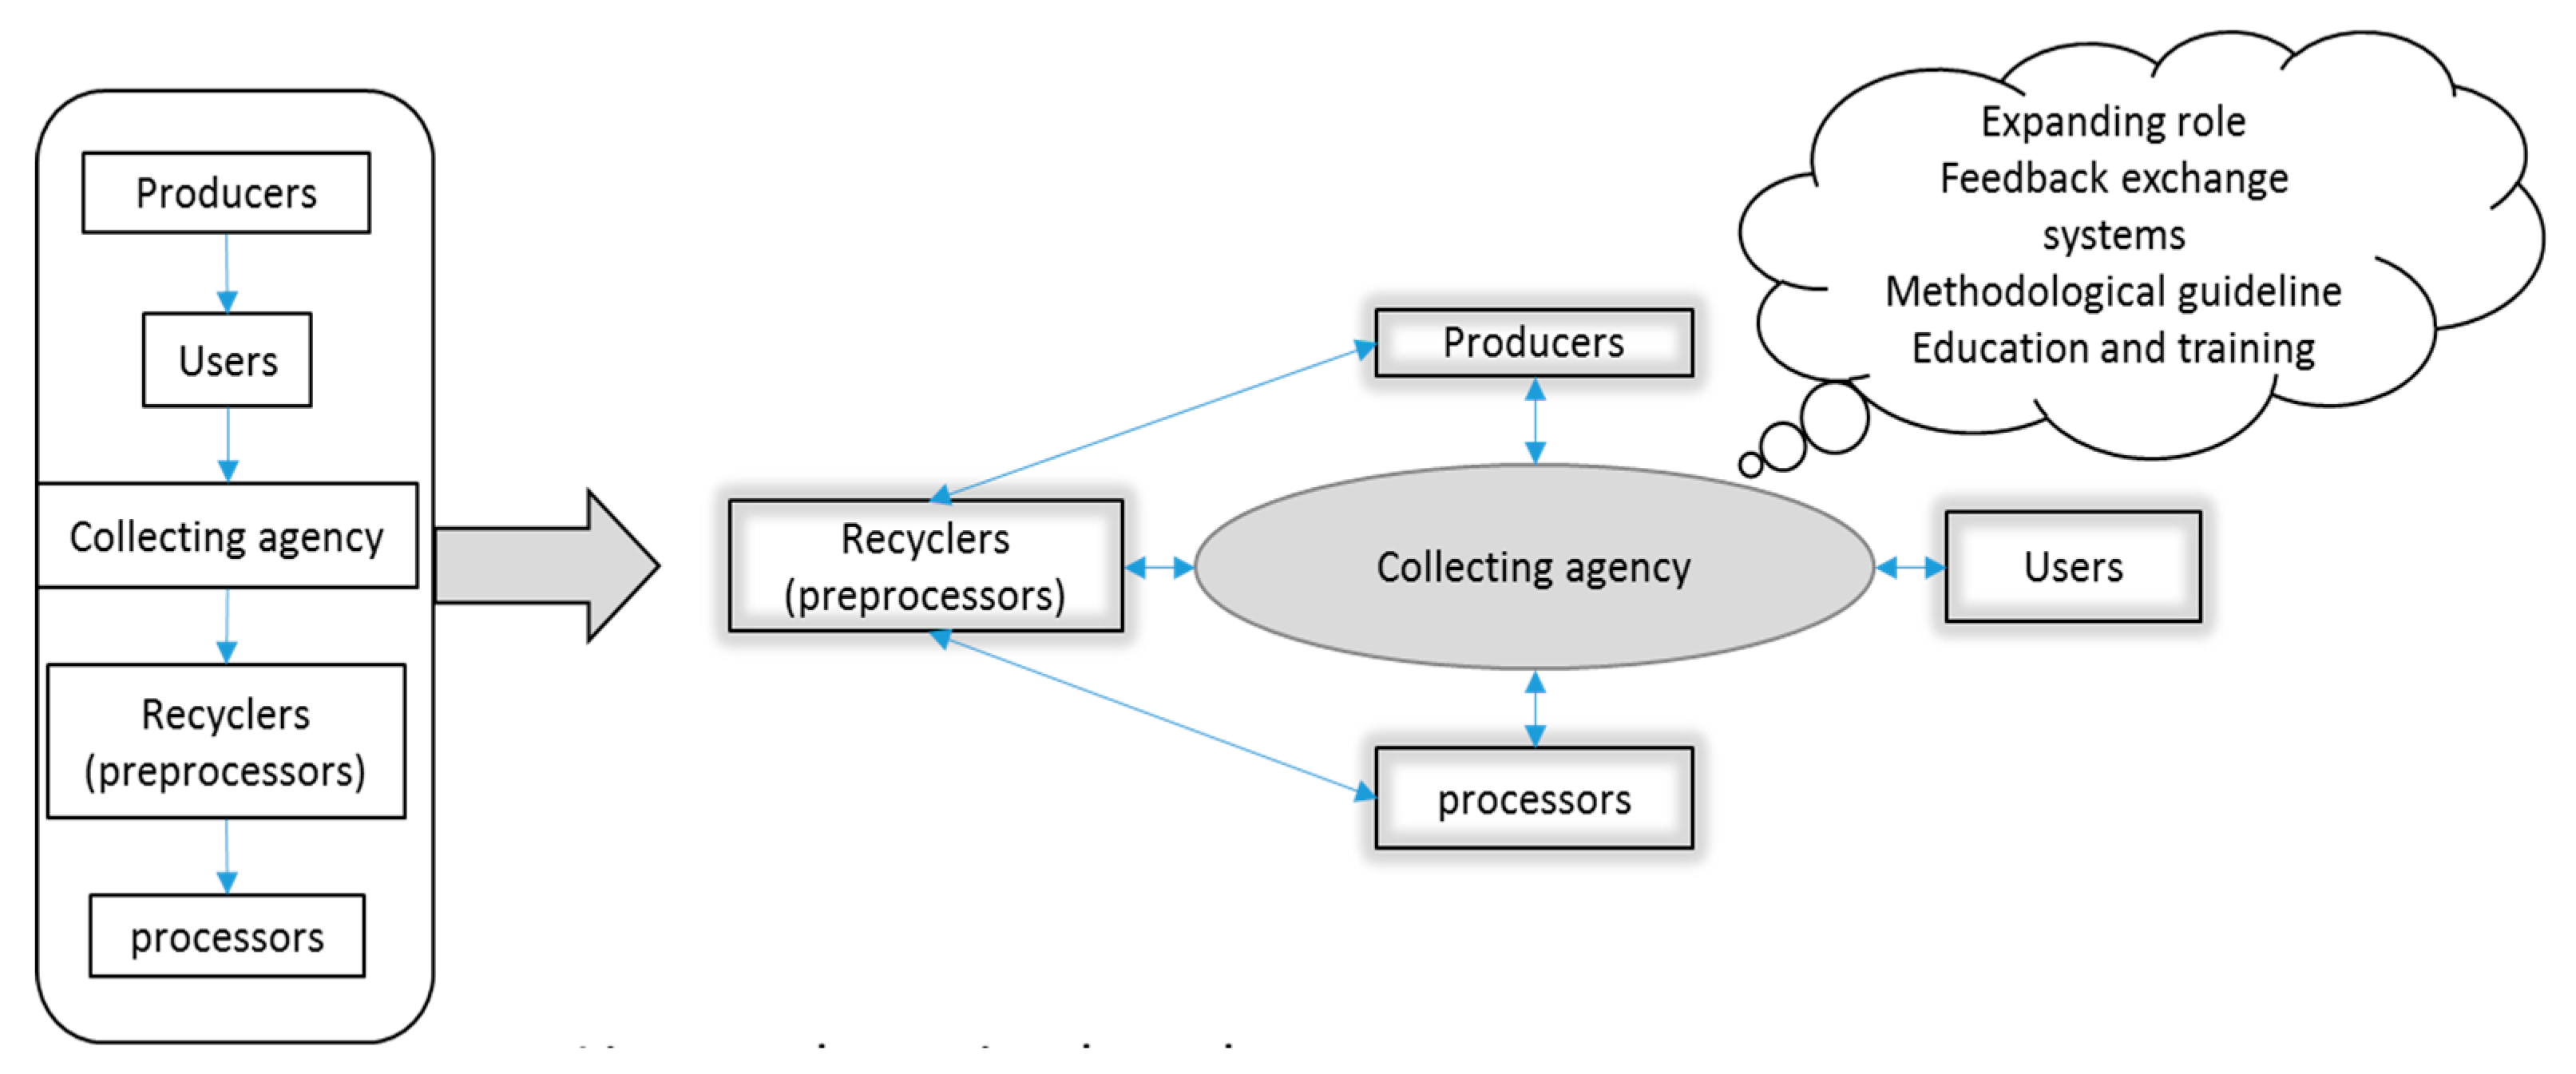
We propose a more circular role of the collection agency in France.
Figure 12 illustrates the necessary transformation of the collection agency from a linear to a circular role. In this expanding role, collection agency will identify the high VROs and establish communication among the producers, users, recyclers, and downstream processors to ensure that enough information flows between them to maximize the value retentions. To realize the CE and higher VROs, this circular role of collection agency would perform three tasks together: creating a positive consumer attitude towards the secondary products; counselling upstream manufacturers on consistency and uniformity; and, enabling recyclers to achieve the best VROs. The collection agency takes necessary steps to identify and generate incentives to form network among the value chain actors. It is necessary to note here that an embedded communication platform is prerequisite for efficient information flows, and that more social research is needed to understand the actor interests and motivation pattern [
45].
7. Conclusions
This study applied scenario analysis in order to highlight challenges and opportunities that are related to each scenario, identifying 17 system parameters, which play an important role to determine the feasibility of the scenarios (
Table 6). Particularly, testing and validation tools, recyclate quality and value added, sale price, and labor cost are some of the parameters that need to be evaluated to overcome barriers for high VROs. Product design consistency, demand based secondary market, and interfirm collaboration are the qualitative external factors that need further evaluation to develop product specific indicators. The novelty of this study is that the parameters were identified in relation to each scenario, different from recent studies where barriers were identified in general [
26,
35]. For example, Kirchherr et al. [
26] identified several qualitative indicators under the four-fold barriers—namely cultural, regulatory, market, and technological—to analyze CE implementation challenges. However, those are not linked with any specific processes.
It is also important to understand the impact of mutual interaction of the system variables on the occurrence possibility of those scenarios. Despite being economically promising, the occurrence possibility of RPL is low due to the low demand of secondary product and lack of social acceptance. Overcoming these challenges (secondary market development, increased information flow among value chain actors) requires a collective effort towards the reorientation of social vision, which cannot be achieved by an individual business entity. This finding is in line with Kircherr et al. [
26]. For example, they have highlighted ‘lack of consumer interest and awareness as a potential barrier to CE implementation and ranked as one of the most important barriers in CE implementation. This study further supports the ‘hesitant company culture’ as one of the barriers for the realization of high VROs. However, the hesitation is largely caused by (1) the dominant communication pattern that exclusively centers on a single organization and (2) not being able to draw lines between competition and collaboration, which affects which VROs to choose (Lieder and Rashid 2016). To realize high VROs, a new form of inter-firm collaboration is required that induces an ever-increasing interdependence and complexities.
Identifying barriers in relation to a specific process may help to eliminate ambiguity in understanding a specific product system. For example, lack of consumer interests and awareness may be more relevant only to those behaviors that are largely related to collection and disposal, not to the purchase behavior of the consumers. A more relevant parameter may be value based acceptance pattern, in that consumers tend to revise purchasing behavior, depending on their purchasing power. A consumer may buy refurbish cellphones, but not a refurbish LED lamp in a developed country due to value biased purchase behavior—constraining the spontaneous development of the demand based second hand market. Thus, the challenge is more profound—a matter of individual mental model that is again economically and geographically implicated.
Fischer and Pascucci [
39] presented three typologies: chain coordination mechanisms, contracting and financial mechanisms. In chain coordination, different actors (along with relevant information) will be coordinated by a third party. In contracting, upstream and downstream actors will be brought under new contracting procedure that is unified by the CE vision. Contracting is intended to grow from a product or a particular process for a longer period of time, while keeping intact the other non-disclosure contracts. This will lead to increased trust among partners and an environment of collaboration will be initiated while keeping competition alive. Financing mechanism may be initiated, so that a small firm can afford to upcycle circular technologies. The role of institutions, such as the role of a collecting agency, may potentially play a management role in order to increase information flows among the value chain actors.
This work signifies some relevance of global reverse networks. For example, can the LED lamp be transported to other countries where a demand based secondary market to reuse the functioning lamp exist. In addition, manual disassembly, which is marked with high labor cost that makes this scenario uncompetitive, can be competitive in countries that have low wage rate. This resonates international division in labor [
12]. Similarly, other studies such as Rahman and Kim [
52] and Wilts et al. [
53] suggested that the global system boundary for the waste management may be more cost-effective for the low labor cost and high social acceptance for low value secondary product [
52].
Overcoming technological barriers to implementing high VROs, especially in RPL and RCL level, becomes essential. For example, Jesus and Mendonça [
35] mentioned that technological innovation is the crucial barrier that threatens smooth CE transition, which supports our finding in RPL, RCL (industrial), and RML technology. However, our finding suggests that regulatory and institutional initiatives (e.g., mass-based recycling rate, role of collection agency) are still missing. However, the required level of technological innovation might also reduce the need to a global system arrangement for waste management. However, this is a daunting task, as we have seen that RCL (industry) scenario poorly performs due to largely inconsistent design of LED lamps, which is hard to correct in the short period of time. Other studies also found technological barrier to be an important barrier for CE.
This paper demonstrates that CE strategies can be implemented in different product systems to retain values. However, it is necessary to address the challenges that are derived from existing business models and communication patterns. It is argued that new forms of business models incorporating upstream and downstream business actors, and favorable policies that stimulate the effort to identify and implement higher VROs are important for material circularity. Nevertheless, elements of PO still hinder the smooth implementation of high VROs, as demonstrated in this study. We contend that CE strategy provides useful pathways for realizing the maximum value preservation processes, but with marked challenges from social, environmental, and business points of view, although not from the economic point of view. This study thus signals the incorporation of these challenges in the discussion of future CE initiatives.


