Abstract
Air pollution in China attracts the world’s attention, so it is important to study its driving factors for air pollutants. The combined Production Decomposition Analysis and Logarithmic Mean Divisia Index (PDA–LMDI) model is applied to construct a regional contribution index in this study to explore the regional differences in factors affecting sulfur dioxide (SO2), nitrogen oxides (NOx), and particulate matter with diameter not greater than 2.5 µm (PM2.5) from 2005 to 2015 in China. The regional emission coefficient had a great inhibitory effect, which reduced SO2, NOx, and PM2.5 by 25,364.9, 10,449.3, and 11,295.3 kilotons (kt) from 2005 to 2015, respectively. For this inhibitory effect, the degree to emission reduction was great for North and East China, followed by South and Central China, and small for Southwest. Northwest. and Northeast China. The regional technical efficiency, technology improvement, capital-energy substitution and labor-energy substitution effects each reduced SO2, NOx, and PM2.5 by about 3500, 3100, and 1500 kt from 2005 to 2015, respectively. For the regional technical efficiency and technology improvement effects, the degree to emission reduction was great in East and Central China, and small in South Northwest and Northeast China. For the regional capital- and labor-energy substitution effects, the degree of emission reduction was great for North East and Central China, and small for Northwest and South China. The regional output proportion effect increased SO2, NOx, and PM2.5 by 1211.2, 320.1, and 277.8 kt from 2005 to 2015, respectively. The national economic growth had a relatively great promoting effect and increased SO2, NOx, and PM2.5 by 26,445.5, 23,827.5, and 11,925.5 kt from 2005 to 2015, respectively. Each region should formulate relevant policies and measures for emission reduction according to local conditions.
1. Introduction
Air pollution has attracted worldwide attention. As the world’s second largest economic community, China has made great achievements in its economic development. Meanwhile, serious haze has frequently occurred in China especially during the high economic growth period. The monitoring data from China Ministry of Ecology and Environment indicates that haze days in pilot cities accounted for 25–50% of the total year, and showed a growing trend. Air pollution has led to serious health problems and economic losses for China. Studies suggested that the health and economic losses caused by particulate matter with diameter not greater than 2.5 µm (PM2.5) emissions for Beijing were 4.83–6.63 billion Chinese Yuan (CNY) in 2014, and 4.32–6.32 billion CNY in 2015 [1]. China’s air pollutants come mainly from the fossil energy consumption. The total fossil energy consumption for China in 2017 reached 4.49 billion tons of coal equivalent (tce), and continues to grow at present [2]. The energy intensity which is denoted by the energy consumption per unit Gross Domestic Product (GDP) is often used to reflect the energy utilization efficiency. China’s energy intensity is now still high, and the energy utilization efficiency is still in an inferior position compared with developed countries. Thus, how to reduce energy intensity is an important issue for China. As for China, there are large disparities in regional economic development, industrial structure, and resource endowment because of vast land area, which leads to extreme unbalances in regional energy consumption and air pollutants. For example, the energy consumption for East China was larger than this consumption in Central and West China, but the energy intensity was the reverse of this [3,4]. The energy saving and emission reduction targets for 13th Five-Year Plan (FYP) period (from 2016 to 2020) issued in 2016 states that, by 2020, China’s energy intensity, and sulfur dioxide (SO2) and nitrogen oxide (NOx) emissions will decrease by 15%, 15%, and 15%, respectively, compared with the 2015 level; the total fossil energy consumption would then be within 5 billion tce. Specific emission reduction targets for each province or municipality have been allocated at present. In this regard, considering factors affecting the energy intensity from China’s regional perspectives, the driving and inhibitory factors for China’s air pollutants and regional differences in effects on air pollutants are examined, so as to provide the theoretical basis for formulating reasonable air pollutant reduction policies based on different regions.
2. Literature Review
Previous studies have mainly used econometric models to discuss different impact of economic growth, energy consumption, industrial structure, and urbanization on air pollutants [5,6,7,8]. Some studies have focused on the non-linear relationship between air pollutant emissions and economic growth, and urbanization from the regional perspective, and verified the existence of the environmental Kuznets curve [9,10]. Compared with the econometric analysis, the decomposition analysis can decompose energy consumption or energy-related emissions into several related factors, which are usually classified into the structural decomposition analysis (SDA), index decomposition analysis (IDA), and production decomposition analysis (PDA). The SDA method decomposes energy consumption or emissions into direct and indirect factors based on input–output tables from countries and regions; the limitation for SDA is that it cannot conduct a time series analysis because input–output data is usually issued every 3–5 years. The IDA method mainly decomposes energy consumption or emissions based on the time series data into different influencing factors without residual terms, so this method is suitable for time series analysis. The Logarithmic Mean Divisia Index (LMDI) method in IDA is widely used to analyze influencing factors for energy consumption or emissions. Thus, at present, the LMDI method is applied to analyze carbon emissions; see Zhang et al. [11], Xu et al. [12], Moutinho et al. [13], and Liao et al. [14].
As for the studies on air pollutant emissions using the LMDI method, Wu and Zeng, Yang et al., Wang et al., and He et al. conducted a decomposition analysis of SO2 emissions [15,16,17,18]. Lyu et al. analyzed the contribution of multiple effects on PM2.5, NOx, and SO2 emissions during 1997–2012, and found that economic growth and energy intensity were the key driving factors, whereas emission efficiency, production structure, and population growth had a little effect [19]. Wang et al. pointed out that economic growth and industrial structure increased NOx, whereas energy efficiency and technological progress decreased NOx [20]. Chang et al. applied the LMDI method to conduct a decomposition analysis of industrial SO2 and NOx emissions from Japan and China; the results showed that the energy intensity and economic development levels had different contributions to emission reduction, and the contributions of industrial and economic structures were different for Japan and China [21]. Zhang et al. analyzed the main influencing factors for PM2.5 concentration in 152 cities from eastern, central, and western China, and found that emission intensity and energy intensity restrained pollution, but economic output and population promoted PM2.5 concentration in most cities [22]. The PDA method is based on the production theory and data envelopment analysis, which is frequently used to analyze the influencing factors for energy and carbon emission efficiencies in the the production process. For example, Wang used the PDA method to decompose energy productivity into the ratio of non-energy input into energy consumption, energy supply and energy output compositions, technology efficiency, and technology change [23]. Zhou and Ang, Zhang et al., Wang et al., and Chen and Duan decomposed the changes in carbon emissions into factors such as the economic growth, energy intensity, technological progress, technological efficiency, and scale effects based on the PDA, and the results indicate that the economic growth and scale effects promoted carbon emissions, whereas technological progress, technological efficiency and energy intensity curbed the emissions [24,25,26,27]. Lin and Du, and Du and Lin conducted a decomposition analysis of the changes in energy intensity by combining IDA and PDA, and found the technology progress and capital-energy substitution were the main factors for decreased energy intensity [28,29].
The current research is still insufficient regarding influencing factors for emissions. First, econometric methods or single decomposition models were used to analyze the influencing factors for air pollutants [22,30,31]. Secondly, most previous studies applying the IDA–PDA decomposition model analyzed the influencing factors related to energy and carbon emissions, whereas only a few studies adopted this model to analyze the influencing factors for air pollutants, especially multiple air pollutants. Third, previous studies have mainly focused on influencing factors for air pollutants at a national or specific regional level, whereas very few studies have focused on the regional differences in influencing factors. Therefore, the novelties of this paper are as follows. The combined Production Decomposition Analysis and Logarithmic Mean Divisia Index (PDA–LMDI) model is used to construct a regional contribution index of influencing effects on air pollutants and investigate the regional differences in contributions of these effects to SO2, NOx, and PM2.5 emissions to reveal what factors drive air pollutants in China, which can provide some new insight on regional emission reduction policies.
3. Methodology and Data
3.1. Method
The Kaya identity is an identity stating that the total emission level can be expressed as the product of four factors: Human population, GDP per capita, energy intensity (energy consumed per unit of GDP), and emission intensity (emissions per unit of energy consumed), which is expressed in the form [32]:
where F is emissions (unit: tons (t)), P is population (unit: 104), G is GDP (unit: Japanese yen (JPY)), and E is energy consumption (unit: tons of coal equivalent (tce)). Based on the Kaya identity [11,12], the total air pollutant emissions can be expressed as Equation (2) to investigate the affecting factors for air pollutants in China.
where AP represents the total air pollutants (unit: t), APi represents regional air pollutants (unit: t), Ei represents regional energy consumption (unit: tce), Y represents national GDP (unit: CNY), Yi represents regional GDP (unit: CNY), APIi represents regional air pollutant emission coefficient (unit: t/tce), EIi represents regional energy intensity (unit: tce/ CNY), and OPi represents regional output proportion (unit: %). The total air pollutants can be decomposed into the following effects through the LMDI method based on Equation (2).
Regional emission coefficient effect:
Regional energy intensity effect:
Regional output proportion effect:
National economic growth effect:
is defined as:
where the superscript 0 and t, and subscript i denote the base period, target period, and region, respectively.
For this decomposition, the effect of regional energy intensity on air pollutants can be investigated, whereas it is impossible to examine the factors affecting regional energy intensity changes. More important factors on air pollutant emissions cannot be explored using this LMDI method. Thus, it is necessary to apply the PDA method to decompose the factors for changes of regional energy intensity that affect air pollutant emissions. The production technology set is defined as follows:
where Kit represents the capital, Lit represents the labor, Eit represents the energy consumed, and Yit represents the output for region i in period t, respectively.
The corresponding Shepard Distance Function for region i in period t is expressed as
The reciprocal of is 1/θ, which measures the maximum expansion proposition for region i in period t if the inputs and production technology remain unchanged. In theory, , and the less value it is, the less efficient the decision-making unit is. If , this means the decision-making unit is on the production frontier, and in this case, the production technology is efficient. Taking the production technology in period t as the benchmark, the change for region i from the period 0 to period t can be decomposed as
where
The change in region i from the period 0 to period t can be decomposed as follows, if the production technology in period 0 is regarded as the benchmark:
The geometric mean values are used as the decomposition result to avoid the inconformity caused by different benchmarks. Thus, the change in EIi from period 0 to period t can be decomposed as
where, TECi and TEi represent the changes in technological efficiency and production technology for region i, which are respectively defined as the regional technical efficiency effect and regional technology improvement effect. KEi and LEi are respectively defined as capital-energy substitution effect and labor-energy substitution effect for region i.
Equation (4) can be rewritten as Equation (13), based on Equation (12).
Thus, the total effects on air pollutants from the base period 0 to target period t can be written as,
The contribution for all effects (CR) can be defined as
Equation (15) means that the total air pollutants increase (decrease) from the base period 0 to target period t, if the contribution of all effects is 100% (−100%). The regional contribution of one certain effect (Effecti) to total air pollutants can be expressed as
Equation (16) indicates that the positive effect has a positive contribution to air pollutants, which increases air pollutants; whereas the negative effect has a negative contribution, which decreases air pollutants. This means that a certain effect increase (decrease) total air pollutants if its contribution is positive (negative).
3.2. Data Description
The data for labor and fossil energy consumption were from China Statistical Yearbook (2006–2016) [33]. The unit of energy consumption was unified into 104 tce according to the conversion coefficients for different fossil energy types (2008). The air pollutant emission (SO2, NOx, PM2.5) data come from China Statistical Yearbook, China environment protection database, and the emission inventory database from Tsinghua University and obtained through the emission factor method [34,35,36,37]. The data for GDP in each province and municipality came from the corresponding China Statistical Yearbook and Provincial Statistical Yearbook, which were adjusted by a price index (the index for 2005 is 100). The capital stock was calculated based on perpetual inventory method [38]. The labor was measured by the number of employees in each province and municipality at the end of year, which came from the corresponding China Statistical Yearbook and Provincial Statistical Yearbook. Tibet, Hong Kong and Macao were not included in our study for the lack of relevant statistical data.
4. Empirical Results
China’s provinces and municipalities can be grouped into seven regions based on the geographical distribution: North China, East China, Central China, South China, Southwest China, Northwest China, and Northeast China (Table 1).

Table 1.
China’s geographical distribution (2018).
4.1. Holistic Analysis
The emission coefficient effect reduced air pollutants (Figure 1).
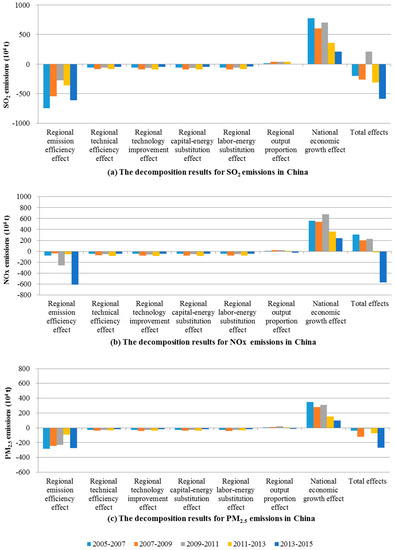
Figure 1.
The decomposition results for SO2 (a), NOx (b), PM2.5 (c) emissions in China during 2005–2007, 2007–2009, 2009–2011, 2011–2013, and 2013–2015.
The inhibitory effect of emission coefficient on SO2 and PM2.5 was weak and then strong; the inhibitory effect on NOx was strong during 2009–2011 and 2013–2015 but weak in other periods. The regional emission coefficient effect reduced SO2, NOx, and PM2.5 by 25,364.9, 10,449.3, and 11,295.3 kilotons (kt) from 2005 to 2015, respectively. The technical efficiency effect, technology improvement effect, capital-energy substitution effect, and labor-energy substitution effect curbed air pollutants over the whole study period, and each effect reduced SO2, NOx, and PM2.5 about by 3500, 3100, and 1500 kt from 2005 to 2015, respectively. The output proportion effect on air pollutants was slight, and this effect promoted air pollutants during 2005–2013, but curbed air pollutants during 2013–2015. The regional output proportion effect increased SO2, NOx, and PM2.5 by 1211.2, 320.1, 277.8 kt from 2005 to 2015, respectively. The economic growth effect promoted air pollutants greatly, which increased SO2, NOx, and PM2.5 by 26,445.5, 23,827.5, and 11,925.5 kt from 2005 to 2015, respectively; but this promoting effect generally showed a downward trend.
4.2. Regional Analysis
The influencing factors for air pollutants were examined from the holistic perspective in the above analysis. In this section, the influencing factors, such as regional emission coefficient effect, regional technical efficiency effect, regional technology improvement effect, regional capital-energy substitution effect, regional labor-energy substitution effect, regional output proportion effect, and national economic growth effect, will be explored to reveal the regional differences in factors affecting air pollutants in China.
4.2.1. Regional Emission Coefficient Effect
The contributions of regional emission coefficient effects on air pollutants were negative for all regions, indicating that regional emission coefficient effects inhibited air pollutants (Figure 2). The contribution of emission coefficient effect was great for East and North China, which effectively reduced air pollutants. The main reason is as follows. As for North China, the air pollutants per unit energy consumption for Hebei, Shanxi, and Inner Mongolia in North China were lower than the national average level. By comparison, air pollutants per unit energy consumption for Shandong, Jiangsu, and Zhejiang in East China were relatively high, and the emission reduction potential is great as well. Indeed, SO2, NOx, and PM2.5 emissions per unit energy consumption in East China decreased by 75.27%, 35.52%, and 70.36%, respectively, from 2005 to 2015. Moreover, the number of industrial waste-gas treatment facilities in China’s northern and eastern provinces increased by 9500 from 2005 to 2009, and 476,000 people and 126 billion CNY were engaged in research and development (R&D) for large- and medium-sized industrial enterprises in 2009; investment funds for industrial pollution treatment accounted for 6.36% of the total GDP for these provinces [33]. Thus, the end-of-pipe treatment for air pollutants and industrial production technology were improved, which effectively curbed air pollutants. The Joint Prevention and Control of Air Pollution in Key Regions for 12th FYP issued in September 2012 claimed that, by 2015, SO2, NOx, and industrial soot and dust will decrease respectively by 12%, 13%, and 10% in Beijing–Tianjin–Hebei, Yangtze River Delta, Pearl River Delta, and Shandong urban agglomerations. Thus, the proportion of industrial added value for East and North China decreased by 5.22% and 7.81%, respectively, and the proportion of fossil energy consumption for these regions decreased as well. Advanced desulfurization and denitrification facilities were actively installed, and facilities that failed to meet the standards were upgraded to control SO2 and NOx in an all-round way. Meanwhile, the industrial soot and dust control was strengthened to reduce PM2.5. Thus, the cleaner production and terminal treatment effectively reduced air pollutants.
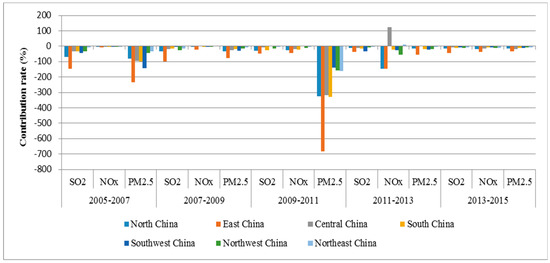
Figure 2.
The regional emission coefficient effect on China’s air pollutants during 2005–2007, 2007–2009, 2009–2011, 2011–2013, and 2013–2015.
The inhibitory effect of regional emission coefficient for Northwest and Northeast China was small. This is because air pollutant emission coefficient in these areas was low, and the air pollutants per unit energy slowly decreased. About 90% China’s fossil energy consumption was used in the industrial sector, and the industrial sector added value accounted for the highest proportion of GDP [39]. Therefore, the end-of-pipe treatment for the industrial sector directly affected air pollutants. Northwest China was the key region for China’s Western Development Strategy, and Northeast China was an old industrial base; these regions have high industrial proportions and large energy consumption. During the period 2005–2015, the investment in waste-gas treatment and R&D for large- and medium-sized industrial enterprises accounted for only 19.22% and 12.37% of the national total, respectively, and this resulted in a slight air pollutant reduction.
4.2.2. Regional Technical Efficiency Effect
The technical efficiency effect means that the promotion of energy utilization efficiency through the improvement of management, system, and scale reduces the energy intensity, thereby inhibiting air pollutants [40]. The contribution of regional technical efficiency effect was negative during 2005–2007 and 2007–2009, indicating that the regional technical efficiency effect inhibited air pollutants (Figure 3). The contributions of regional technical efficiency effect were great for North, East and Central China, which effectively curbed air pollutants. This is because East China is developed in its economic development, and has high energy utilization efficiency; Shanxi and Inner Mongolia in North China and Henan in Central China possess rich fossil energy resources, and have high energy intensity currently. An increase in the investment for resource utilization systems and management can easily form a scale effect in the energy utilization efficiency, which effectively reduces air pollutants. The contributions of technical efficiency effect for South and Northwest China were low, which indicated that the regional technical efficiency effect had a slight inhibition on air pollutants. Especially, the technical efficiency effect for Hainan and Qinghai had a slightly promoting effect on air pollutants, because of the relatively low energy intensity and the low potential for reducing energy intensity. During the period 2009–2011, the order for the inhibition of regional technical efficiency effect on air pollutants was as follows: East China > Southwest China > North China > Central China > Northeast China > Northwest China > South China. It is worth mentioning that the technical efficiency effect for Southwest China had a great inhibition on air pollutants. This is mainly because the energy intensity in Southwest China was relatively high, and the potential was large for reducing energy intensity. During this period, an increase in investment for management and systems reduced the energy intensity, thereby inhibiting air pollutants. During the periods 2011–2013 and 2013–2015, the contribution of technical efficiency effect for different regions showed a downward trend, indicating that this inhibitory effect was weakened. This may be because the regional energy intensity was relatively low during this period, and the impact of energy resource management system reform and scale optimization on energy intensity was relatively small, which weakened the inhibitory effect of technical efficiency on air pollutants. The inhibitory effect of regional technical efficiency for North China declined significantly because of large energy resources and low energy utilization efficiency in Shanxi and Inner Mongolia. Moreover, the energy intensity for Shanxi increased during this period, thereby promoting air pollutants.
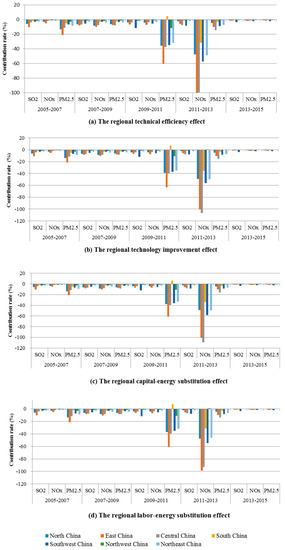
Figure 3.
The regional substitution effects on China’s air pollutants during 2005–2007, 2007–2009, 2009–2011, 2011–2013, and 2013–2015.
4.2.3. Regional Technology Improvement Effect
The technology improvement effect means that the energy production efficiency improved by the technological innovation reduces energy intensity, thereby reducing air pollutants [41]. The contributions of the technology improvement effect for all regions were negative, indicating that regional technology improvement effect curbed air pollutants (Figure 3). During the periods 2005–2007 and 2007–2009, the inhibitory effect of technology improvement was great for North, East, Central and Southwest China, but small for South, Northwest and Northeast China. The contribution of regional technology improvement was great for Hebei, Shanxi, Inner Mongolia in North China, and Shandong, Jiangsu, and Zhejiang in East China. The reasons were as follows. The investment for science and technology in Hebei, Shanxi, and Inner Mongolia grew rapidly, which intensified the technological innovation and improved energy utilization efficiency, thereby effectively decreasing air pollutants. Shandong, Jiangsu, and Zhejiang had high economic development and technical innovation levels and more investment in R&D, thereby effectively reducing energy intensity and inhibiting air pollutants. During the period 2009–2011, the contribution of regional technology improvement effect for North, East, Central, Southwest, Northwestern, and Northeast China was negative, indicating that the technology improvement effect decreased air pollutants in these regions. The technology improvement effect for South China promoted air pollutants. This is because the contribution of technology improvement for Guangxi was positive. Guangxi is underdeveloped in its economy; its technological innovation level is relatively low; its energy intensity constantly increased during this period, which promoted the emissions of air pollutants. During the periods 2011–2013 and 2013–2015, the contribution of regional technology improvement effect for all regions showed a downward trend, which indicates that this inhibitory effect was weakened. This may be because the energy intensity was relatively low and the space for reducing energy intensity was small during this period. The inhibitory effect for North and Northeast China declined significantly, because the technological progress for resource-rich provinces, such as Shanxi and Inner Mongolia, and the old industrial bases in Northeast China, had not greatly improved the energy utilization efficiency.
4.2.4. Regional Capital-Energy Substitution Effect
The regional capital-energy substitution effect means that allocation for capital and energy inputs in a region is optimized by substituting energy with capital, which reduces energy intensity and inhibits air pollutants. The contribution of capital-energy substitution effect was negative for all regions, indicating that the optimal allocation for capital and energy inputs reduced energy intensity, and curbed air pollutants as a result (Figure 3). During the periods 2005–2007 and 2007–2009, the contribution of the capital-energy substitution effect was great for North and East China, followed by Central, Southwest and Northeast China. This contribution for South and Northwest China was small. The inhibitory effect of capital-energy substitution on air pollutants for Central China showed an increasing trend. The reasons may be as follows. The energy intensity for Central China was relatively high, so an increase in capital investment can easily reduce energy input, which effectively reduced air pollutants. During the period 2009–2011, the contribution of capital-energy substitution effect was negative for North, East, Central, Southwest, Northwest and Northeast China, which indicates that the effect in these regions decreased energy intensity, and effectively reduced air pollutants. The capital-energy substitution effect for South China promoted air pollutants. The capital-intensive industries were developed for this region, and the potential was low for substituting energy with capital, and even capital substituted energy in this region, so this effect slightly promoted air pollutants. In the periods 2011–2013 and 2013–2015, the contribution of the capital-energy substitution effect was great for East, Central and Southwest China, followed by North and Northeast China, whereas this contribution for Southern and Northwestern regions was small. The effect of capital-energy substitution on air pollutants for North and Northeast China decreased because the capital investment growth rate for these two regions slowed down significantly during this period, which weakened the inhibitory effect.
4.2.5. Regional Labor-Energy Substitution Effect
The regional labor-energy substitution effect means that the allocation for labor and energy inputs in a region is optimized through substituting energy with labor to reduce energy intensity, thereby reducing air pollutants. The contribution of the labor-energy substitution effect was negative for all regions, which indicates this effect inhibited air pollutants (Figure 3). During the periods 2005–2007 and 2007–2009, the contribution of regional labor-energy substitution effect for North, East and Central China was great, followed by Southwest and Northeast China, and the labor-energy substitution effect for South and Northwest China had a small inhibitory effect on air pollutants. This is because this inhibitory effect for Zhejiang, Jiangsu and Shandong in East China, and Henan and Hunan in Central China was great. These provinces were densely populated, and the number of employees in these provinces was far larger than the national average; the labor input substituted energy input at a high rate, which reduced the energy intensity and effectively decreased air pollutants. In the periods 2009–2011 and 2011–2013, the contribution of the regional labor-energy substitution effect for East, Central and Southwest China was great, followed by North and Northeast China, and the labor-energy substitution for South and Northwest China had a small inhibitory effect. It is worth mentioning that the contribution of the labor-energy substitution effect for Southwest China was great in this period. The reason is that the labor had a large potential to substitute energy in Southwest China for the abundant labor resources and low pay. During the period 2013–2015, this contribution for all regions declined significantly, so it slightly reduced air pollutants. The reason is as follows. During this period, the wage for labor continuously rose and the employment growth rate slowed down. Thus, the labor-energy substitution rate reduced, which slowed down the degree of energy intensity decrease, and weakened the inhibitory effect of regional labor-energy substitution.
4.2.6. Regional Output Proportion Effect
The regional output proportion had a slight promoting or inhibitory effect on air pollutants (Figure 4). During 2005–2007, the contribution of the regional output proportion effect for North, Central, South, and Northwest China was positive, because the output proportion for Central, South and Northwest China increased by 1.61%, 0.44%, and 2.42%, respectively. Thus, the regional output proportion effect promoted air pollutants in North, Central, South, and Northwest China. The contribution of output proportion for East, Southwest, and Northeast China was negative. During periods 2007–2009 and 2009–2011, the growth rate of output proportion for North, Central, Southwest, Northwest, and East China was positive (Figure 5), thereby promoting air pollutants. However, the growth rate of output in other regions was negative, thereby inhibiting air pollutants to a certain extent. During 2011–2013, the output proportion for North, East, South, and Northeast China showed a downward trend, thereby inhibiting air pollutants, while the output proportion in other regions showed an upward trend. During 2013–2015, the output proportion for North, Southwest, and Northeast China showed a downward trend, whereas the output proportion in other regions showed an upward trend.
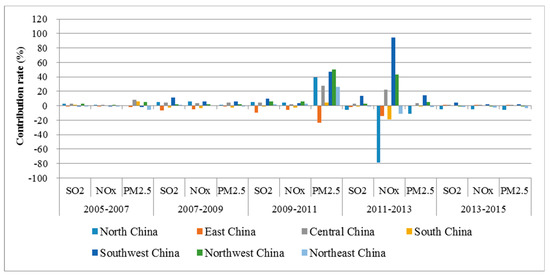
Figure 4.
The regional output proportion effect on China’s air pollutants during 2005–2007, 2007–2009, 2009–2011, 2011–2013, and 2013–2015.
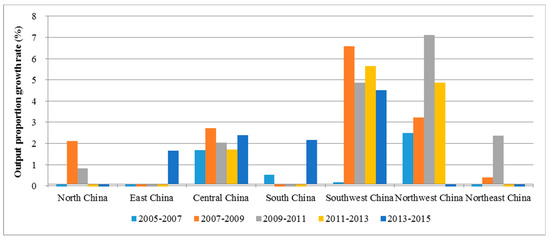
Figure 5.
The output proportions for different regions during 2005–2007, 2007–2009, 2009–2011, 2011–2013, and 2013–2015.
4.2.7. National Economic Growth Effect
The contribution of the national economic growth effect was positive, indicating that national economic growth promoted air pollutants (Figure 6). During periods 2005–2007 and 2007–2009, the national economic growth effect promoted air pollutants in different regions [41]. The order of promoting effect is as follows: east China > north China > central China > southwest China > south China > northeast China > northwest China. During 2009–2011, the promoting effect of national economic growth on air pollutants (especially PM2.5) was great in different regions. This is because the national economic grew rapidly and consumed a large amount of fossil energy over this period, thereby increasing air pollutants. During periods 2011–2013 and 2013–2015, the contribution of national economic growth declined significantly, which curbed air pollutants to a certain extent. Overall, the promoting effect of national economic growth on air pollutants showed a downward trend over the whole study period, because national economic growth slowed down.
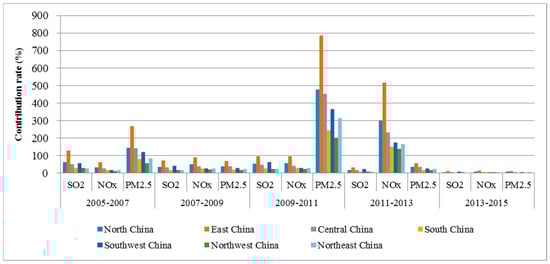
Figure 6.
The economic growth effect on China’s air pollutants during 2005–2007, 2007–2009, 2009–2011, 2011–2013, and 2013–2015.
4.3. Discussion
The emission coefficient effect is the greatest in reducing air pollutants. Decreases in air pollutants per unit energy consumption indicate terminal treatment technology for air pollutants were improved [42,43]. The inhibitory effect of the regional emission coefficient presented a decreasing trend for SO2 emissions, an increasing trend for NOx emissions, and an increasing and then decreasing trend for PM2.5 emissions. This may be because different emission reduction policies were adopted for different air pollutants in different periods [44]. SO2 emissions decreased by 14.3% after the 11th FYP period, and the target for SO2 emission reduction by 10% was achieved, so a huge SO2 reduction potential was released; the target for SO2 emission reduction by 8% during the 12th FYP period weakened the inhibitory effect of regional emission coefficient. This inhibitory effect on NOx was small, and even showed a decreasing trend in 2007–2009. Thus, there is a great emission reduction potential for NOx [45]. The reduction target for NOx was proposed, and end-of-pipe treatments such as desulfurization and denitrification projects were constructed and renovated during the 12th FYP period, which released the emission reduction potential for NOx and enhanced the inhibitory effect of the regional emission coefficient on NOx. As for PM2.5, the atmospheric suspended particulate matter decreased by 30% during the 11th FYP period, and the emission reduction potential for PM2.5 was released. Thus the inhibitory effect on PM2.5 was great during 2009–2011. So far, the dust can decrease by 96% through electrostatic precipitation, and even decrease by 99% through more advanced equipment, which reduces the potential of end-of-pipe treatment technology and the inhibitory effect of the regional emission coefficient on PM2.5 [33].
At the regional level, the regional emission efficiency effect for North and East China was great, followed by South and Central China, and it was small for Southwest, Northwest, and Northeast China. Statistics from the National Bureau of Statistics show that 90% of China’s air pollutants come from the industrial sector, so the energy-saving and emission reduction efforts for the industrial sector directly affects the air pollutant emission efficiency. According to the R&D data for large- and medium-sized industrial enterprises in different regions, the order of R&D funds was: East China > North China > South China > Central China > Southwest China > Northeast China > Northwest China. Thus, the regional emission efficiency had inhibitory effects on air pollutants, and this inhibition degree differed for different regions (Figure 7).
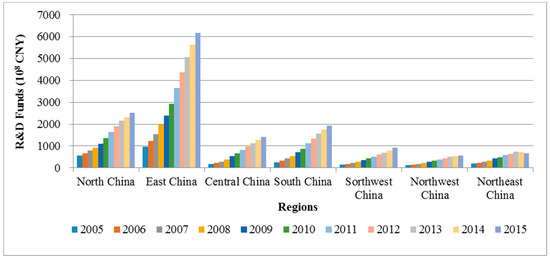
Figure 7.
The regional R&D funds for large- and medium-sized industrial enterprises from 2005 to 2015.
The regional technical efficiency effect and regional technology improvement effect generally inhibited air pollutants through regional energy intensity decreases, and this inhibitory effect showed a downward trend. The inhibition degree of these effects differed among regions. The improvement of technical efficiency and technology improvement promoted energy utilization efficiency, thereby reducing energy intensity and inhibiting air pollutants, which was consistent with Seifert et al. [46], and Gao and Zhang [47]. The technical efficiency and technology improvement for East and Central China greatly curbed air pollutants. This is because the East China had a developed economy and reasonable industrial structure, and the R&D expenditure in Jiangsu, Shandong, Zhejiang, and Shanghai accounted for a high proportion of the national total. Therefore, the technology level for these provinces was relatively high. Statistical data show that the R&D expenditure in Central China increased more than seven times during 2005–2015 [33], with the highest growth rate. This resulted in the promotion of technical efficiency. The inhibitory effects of technical efficiency and technology improvement on air pollutants for North China show a decreasing trend. The reason is as follows. The energy consumption for Hebei, Shanxi, and Inner Mongolia in North China was great, and their science and technology was underdeveloped. The R&D expenditure growth rate in North China declined recently. In contrast, the inhibitory effect for Southwest China presented an upward trend. This is because the adjustment of industrial structure and increases in R&D expenditure in Southwest China improved the energy utilization efficiency for energy-intensive industries. These inhibitory effects on air pollutants were small for South, Northwest, and Northeast China. The economic development for South China was dominated by the secondary industry, and there were low total energy consumption and a high level of science and technology in the region. Thus, the regional technical efficiency and technology improvement effects had a low potential to reduce the energy intensity. In addition, the R&D investment in Northwest and Northeast China was low and the industrial structure was unreasonable.
The regional capital-energy substitution effect and the regional labor-energy substitution effect reduced air pollutants; these effects were slight for all regions during 2013–2015, and the degree of these effects differed among regions. The growth rates of national capital stock and labor employment were 15.92% and 1.94% respectively, whereas the growth rate for energy consumption was only 1.05% during 2005–2015 [33]. This resulted in a certain energy substitution, which is consistent with the findings of Lin and Du [28], and Tan and Lin [48]. The substitution of energy by labor or capital leads to a decrease in energy consumption per unit of output, and this is helpful for the decline in energy intensity [41]. From 2013 to 2015, the growth rate of capital stock and labor employment slowed down, whereas the growth rate of energy consumption increased rapidly, which reduced the effects of capital- and labor-energy substitutions on air pollutants. The regional capital-energy substitution effect and the regional labor-energy substitution effect were great for North, East, and Central China. The capital stock and labor employment for East China were much higher than the national average, especially Shanghai, Jiangsu, Zhejiang, and Shandong, and the capital stock and labor employment for North and Central China were relatively high, maintaining a comparatively high growth rate annually. This greatly curbed pollutants in these regions because substitution of energy by labor or capital decreased energy consumption per unit of output. It was worth mentioning that the capital stock and labor force for South China were relatively large. However, the substitution effects for Northwest and South China were small. The reason is that these regions had developed economies and high capital- and labor-energy substitution levels in a long term, which led to a low substitution potential.
Generally the regional output proportion effect on air pollutants was relatively slight. The regional output proportion effect for North, East, South, and Northeast China reduced air pollutants on the whole during 2005–2015, because there was a large economic output proportion in these regions, and the regional output proportion showed a decreasing trend. The regional output proportion effect for Central, Southwest and Northwest China mainly promoted air pollutants, because the economy in these regions was relatively undeveloped, and the national policy inclination towards the central and western regions accelerated the economic growth for these regions. Thus, the regional output proportion in these regions showed an increasing trend.
Economic growth has had a great promoting effect on air pollutants, which is consistent with the studies by Chang et al. [21] and Chen et al. [49]. Magazzino analyzed the relationship between economic growth, carbon dioxide emissions, and energy use for 19 APEC countries over 1960–2013, and suggested that no causal relationship emerges between real GDP and energy use, which is in line with the “neutrality hypothesis” [50], This may be because the economic structure has been improved in the economic growth. Xu et al. pointed out that about 90% of China’s fossil energy was used by the industrial sector, and the proportion of secondary industry was more than 40%, so economic growth led to a large amount of fossil energy consumption [39]. In the course of economic growth, if the economic structure does not improve significantly, energy consumption may increase substantially, and this promoted air pollutants. Because China’s economic growth rate slowed down and the industrial structure was optimized in the recent period, the promoting effect of economic growth showed a decreasing trend, which is consistent with Wang [51]. Due to the financial crisis, the economic growth rate was extremely low in 2009. The economic growth rebounded sharply in 2010, thereby strengthening the promoting effect of national economic growth on air pollutants. East and North China had the largest economic aggregates, which led to the greatly promoting effect on air pollutants. However, over the whole study period, the secondary industry proportion for East and North China decreased by 4.7% and by 6.5%, and the tertiary industry proportion for the regions increased by 8.5% and by 9.2% [33]. The industrial structure optimization decreased air pollutants continuously. The tertiary industry proportion for Central, South, and Southwest China slightly increased, but the secondary industry proportion increased by 1.1%, 0.6%, and 0.4%, respectively [33]. This resulted in a relatively sight promoting effect of economic growth in these regions. Northwest and Northeast China have small economic aggregates, accounting for only about 13% of the national GDP. The economic growth rate was extremely low. Thus, the promoting effect of economic growth on air pollutants was relatively small for Northwest and Northeast China.
5. Conclusions and Policy Implications
The combined PDA–LMDI model was applied to extend the traditional decomposition analysis and investigate the regional differences in driving factors for air pollutant emissions, which provides new insights in research area of emission reduction. The findings are as follows. The regional emission coefficient effect reduced SO2, NOx, and PM2.5 by 7489.4, 795.0, and 2851.3 kt from 2005 to 2007; 5435.5, 410.6, and 2469.8 kt from 2007 to 2009; 2723.1, 2585.5, and 2304.3 kt from 2009 to 2011; 3595.5, 555.8, and 908.9 kt from 2011 to 2013; and 6121.4, 6102.6, and 2761.0 kt from 2013 to 2015, respectively. This inhibitory effect showed a decreasing trend for SO2, an increasing trend for NOx, and an increasing and then decreasing trend for PM2.5. The regional technical efficiency effect, regional technology improvement effect, regional capital-energy substitution effect and labor-energy substitution effect generally inhibited air pollutants. The emission reduction degree for these inhibitory effects differed among regions. The regional output proportion effect had a small promoting impact on air pollutants. The national economic growth effect increased SO2, NOx, and PM2.5 by 7724.4, 5583.2, and 3510.9 kt from 2005 to 2007; 6005.9, 5376.8, and 2807.8 kt from 2007 to 2009; 6990.4, 6824.5, and 3090.0 kt from 2009 to 2011; 3592.7, 3612.3, and 1531.6 kt from 2011 to 2013; and 2132.1, 2430.7, and 985.2 kt from 2013 to 2015, respectively. This effect had a relatively great promoting impact. The degree to the promotion of air pollutants differed among regions.
These conclusions point to the following policy implications. As for China, coal accounted for 60% in China’s energy consumption structure, and relatively clean energy only accounted for 22% [33]. Thus, each region should made use of its own regional geographical advantages to increase clean energy supply and consumption, thereby optimizing energy consumption structure. Fuel should be pretreated (such as desulfurization before combustion) and combustion technology should be improved. In addition, dust removal technology, condensation technology, liquid absorption technology, recovery and treatment technology should be used, so as to reduce air pollutant emissions. It is necessary to adhere to technology improvement and continuously improve technological efficiency for all regions. The investment in R&D should be earnestly encouraged to improve regional energy efficiency through cost saving and technological innovation. Meanwhile, all regions should strengthen the mechanism innovation and system innovation to tap the potential of energy-saving technology. The input resources for all regions should be optimized. For example, there is a need to be equipped with more advanced and high-efficiency machinery, and to update old production equipment; the technical training and re-education for workers should be strengthened to improve their capabilities, so as to improve the efficiency of capital- and labor-energy substitutions. Regional governments should transform traditional industries and upgrade industrial structures, and develop modern service industries to improve economic quality. Meanwhile, more attention should be focused on accelerating the catch-up pace of emerging industries, actively cultivating new economic growth points, and developing an environment-friendly tertiary industry according to local conditions. It is necessary to strengthen the green environmental protection industry. Environmental and economic policies should be reformed and improved to accelerate the development for the green tertiary industry, cultivate a number of backbone enterprises of environmental protection, and enhance green development capacity.
Author Contributions
Conceptualization, S.X. Methodology and software, S.X., Y.M. and Y.L. Validation, Y.Z. Formal analysis, Z.H. Investigation, X.M. Resources, S.X. Data curation, B.Z. and S.W. Writing—original draft preparation, S.X. and Y.M. Writing—review and editing, S.X. and Y.L. Visualization, B.Z.
Funding
This study was financially supported by the Fundamental Research Funds for the Central Universities (grant No. 2017XKQY100).
Conflicts of Interest
The authors declare no conflict of interest. The funders had no role in the design of the study; in the collection, analyses, or interpretation of data; in the writing of the manuscript, and in the decision to publish the results.
References
- Li, L.; Lei, Y.; Wu, S.; Chen, J.; Yan, D. The health economic loss of fine particulate matter (PM 2.5) in Beijing. J. Clean. Prod. 2017, 161, 1153–1161. [Google Scholar] [CrossRef]
- Dong, K.Y.; Sun, R.J.; Li, H.; Jiang, H.D. A review of China’s energy consumption structure and outlook based on a long-range energy alternatives modeling tool. Pet. Sci. 2017, 14, 214–227. [Google Scholar] [CrossRef]
- Jiang, X.; Duan, Y.; Green, C. Regional disparity in energy intensity of China and the role of industrial and export structure. Resour. Conserv. Recycl. 2017, 120, 209–218. [Google Scholar] [CrossRef]
- Feng, C.; Wang, M. Analysis of energy efficiency and energy savings potential in China’s provincial industrial sectors. J. Clean. Prod. 2017, 164, 1531–1541. [Google Scholar] [CrossRef]
- Chen, H.; Huang, Y.; Shen, H.; Chen, Y.; Ru, M.; Chen, Y.; Lin, N.; Su, S.; Zhuo, S.; Zhong, Q.; et al. Modeling temporal variations in global residential energy consumption and pollutant emissions. Appl. Energy 2016, 184, 820–829. [Google Scholar] [CrossRef]
- Liu, C.; Hong, T.; Li, H.; Wang, L. From club convergence of per capita industrial pollutant emissions to industrial transfer effects: An empirical study across 285 cities in China. Energy Policy 2018, 121, 300–313. [Google Scholar] [CrossRef]
- Gill, A.R.; Viswanathan, K.K.; Hassan, S. The Environmental Kuznets Curve (EKC) and the environmental problem of the day. Renew. Sustain. Energy Rev. 2018, 81, 1636–1642. [Google Scholar] [CrossRef]
- Dong, K.; Sun, R.; Dong, C.; Li, H.; Zeng, X.; Ni, G. Environmental Kuznets curve for PM2.5 emissions in Beijing, China: What role can natural gas consumption play? Ecol. Indic. 2018, 93, 591–601. [Google Scholar] [CrossRef]
- Li, M.; Li, C.; Zhang, M. Exploring the spatial spillover effects of industrialization and urbanization factors on pollutants emissions in China’s Huang-Huai-Hai region. J. Clean. Prod. 2018, 195, 154–162. [Google Scholar] [CrossRef]
- Xu, S.-C.; Miao, Y.-M.; Gao, C.; Long, R.-Y.; Chen, H.; Zhao, B.; Wang, S.-X. Regional differences in impacts of economic growth and urbanization on air pollutants in China based on provincial panel estimation. J. Clean. Prod. 2019, 208, 340–352. [Google Scholar] [CrossRef]
- Zhang, W.; Li, K.; Zhou, D.; Zhang, W.; Gao, H. Decomposition of intensity of energy-related CO2 emission in Chinese provinces using the LMDI method. Energy Policy 2016, 92, 369–381. [Google Scholar] [CrossRef]
- Xu, S.-C.; He, Z.-X.; Long, R.-Y.; Chen, H.; Han, H.-M.; Zhang, W.-W. Comparative analysis of the regional contributions to carbon emissions in China. J. Clean. Prod. 2016, 127, 406–417. [Google Scholar] [CrossRef]
- Moutinho, V.; Madaleno, M.; Inglesi-Lotz, R.; Dogan, E. Factors affecting CO2 emissions in top countries on renewable energies: A LMDI decomposition application. Renew. Sustain. Energy Rev. 2018, 90, 605–622. [Google Scholar] [CrossRef]
- Liao, C.Y.; Wang, S.G.; Fang, J.K.; Zheng, H.B.; Zhang, Y.Y. Driving forces of provincial-level CO2 emissions in China’s power sector based on LMDI method. Energy Procedia 2019, 158, 3859–3864. [Google Scholar] [CrossRef]
- Wu, L.Y.; Zeng, W.H. Research on the Contribution of Structure Adjustment on SO2 Emissions Reduction---Case Study Shijingshan District, Beijing. Procedia Environ. Sci. 2013, 18, 849–855. [Google Scholar] [CrossRef][Green Version]
- Yang, X.; Wang, S.; Zhang, W.; Li, J.; Zou, Y. Impacts of energy consumption, energy structure, and treatment technology on SO2 emissions: A multi-scale LMDI decomposition analysis in China. Appl. Energy 2016, 184, 714–726. [Google Scholar] [CrossRef]
- Wang, Y.Z.; Wang, Q.W.; Hang, Y. Driving Factors of SO2 Emissions in 13 Cities, Jiangsu, China. Energy Procedia 2016, 88, 182–186. [Google Scholar] [CrossRef]
- He, S.B.; Yan, T.; Zhou, H.R. Decomposition and Spatial Clustering Analysis of China’s SO2 Emissions. Procedia Comput. Sci. 2016, 91, 1064–1072. [Google Scholar] [CrossRef]
- Lyu, W.; Li, Y.; Guan, D.; Zhao, H.; Zhang, Q.; Liu, Z. Driving forces of Chinese primary air pollution emissions: An index decomposition analysis. J. Clean. Prod. 2016, 133, 136–144. [Google Scholar] [CrossRef]
- Wang, J.; Qiu, Y.; He, S.; Liu, N.; Xiao, C.; Liu, L. Investigating the driving forces of NOx generation from energy consumption in China. J. Clean. Prod. 2018, 184, 836–846. [Google Scholar] [CrossRef]
- Chang, M.; Zheng, J.; Inoue, Y.; Tian, X.; Chen, Q.; Gan, T. Comparative analysis on the socioeconomic drivers of industrial air-pollutant emissions between Japan and China: Insights for the further-abatement period based on the LMDI method. J. Clean. Prod. 2018, 189, 240–250. [Google Scholar] [CrossRef]
- Zhang, Y.; Shuai, C.; Bian, J.; Chen, X.; Wu, Y.; Shen, L. Socioeconomic factors of PM2.5 concentrations in 152 Chinese cities: Decomposition analysis using LMDI. J. Clean. Prod. 2019, 218, 96–107. [Google Scholar] [CrossRef]
- Wang, C. Decomposing energy productivity change: A distance function approach. Energy 2007, 32, 1326–1333. [Google Scholar] [CrossRef]
- Zhou, P.; Ang, B. Decomposition of aggregate CO2 emissions: A production-theoretical approach. Energy Econ. 2008, 30, 1054–1067. [Google Scholar] [CrossRef]
- Zhang, X.-P.; Tan, Y.-K.; Tan, Q.-L.; Yuan, J.-H. Decomposition of aggregate CO2 emissions within a joint production framework. Energy Econ. 2012, 34, 1088–1097. [Google Scholar] [CrossRef]
- Wang, Q.; Chiu, Y.-H.; Chiu, C.-R. Driving factors behind carbon dioxide emissions in China: A modified production-theoretical decomposition analysis. Energy Econ. 2015, 51, 252–260. [Google Scholar] [CrossRef]
- Chen, L.; Duan, Q. Decomposition analysis of factors driving CO2 emissions in Chinese provinces based on production-theoretical decomposition analysis. Nat. Hazards 2016, 84, 267–277. [Google Scholar] [CrossRef]
- Lin, B.Q.; Du, K.R. Decomposing energy intensity change: A combination of index decomposition analysis and production-theoretical decomposition analysis. Energy 2014, 129, 158–165. [Google Scholar] [CrossRef]
- Du, K.; Lin, B. Understanding the rapid growth of China’s energy consumption: A comprehensive decomposition framework. Energy 2015, 90, 570–577. [Google Scholar] [CrossRef]
- Yuan, X.; Zhang, M.; Wang, Q.; Wang, Y.; Zuo, J. Evolution analysis of environmental standards: Effectiveness on air pollutant emissions reduction. J. Clean. Prod. 2017, 149, 511–520. [Google Scholar] [CrossRef]
- Ji, X.; Yao, Y.; Long, X. What causes PM2.5 pollution? Cross-economy empirical analysis from socioeconomic perspective. Energy Policy 2018, 119, 458–472. [Google Scholar] [CrossRef]
- Kaya, Y.; Yokoburi, K. Environment, Energy, and Economy: Strategies for Sustainability; United Nations University Press: Tokyo, Japan, 1997. [Google Scholar]
- China Statistical Yearbook (2006–2016); China Statistics Press: Beijing, China, 2006–2016.
- Zhao, B.; Wang, S.X.; Liu, H.; Xu, J.Y.; Fu, K.; Klimont, Z.; Hao, J.M.; He, K.B.; Cofala, J.; Amann, M. NOx in China: Historical trends and future perspectives. Atmos. Chem. Phys. 2013, 13, 9869–9897. [Google Scholar] [CrossRef]
- Zhao, B.; Wang, S.; Wang, J.; Fu, J.S.; Liu, T.; Xu, J.; Fu, X.; Hao, J. Impact of national NOx and SO2 control policies on particulate matter pollution in China. Atmos. Environ. 2013, 77, 453–463. [Google Scholar] [CrossRef]
- Wang, S.X.; Zhao, B.; Cai, S.Y.; Klimont, Z.; Nielsen, C.P.; McElroy, M.B.; Morikawa, T.; Woo, J.H.; Kim, Y.; Fu, X.; et al. Emission trends and mitigation options for air pollutants in East Asia. Atmos. Chem. Phys. Discuss. 2014, 14, 2601–2674. [Google Scholar] [CrossRef]
- Cai, S.Y.; Wang, Y.J.; Zhao, B.; Wang, S.X.; Chang, X.; Hao, J.M. The impact of the “Air Pollution Prevention and Control Action Plan” on PM2.5 concentrations in Jing-Jin-Ji region during 2012–2020. Sci. Total Environ. 2016, 580, 197–209. [Google Scholar] [CrossRef] [PubMed]
- Meinen, G.; Verbiest, P.; Wolf, P.P. Perpetual Inventory Method: Service Lives, Discard Patterns and Depreciation Methods 1998; CBS Statistics Netherlands: Voorburg, The Netherlands, 1998. [Google Scholar]
- Xu, S.-C.; He, Z.-X.; Long, R.-Y. Factors that influence carbon emissions due to energy consumption in China: Decomposition analysis using LMDI. Appl. Energy 2014, 127, 182–193. [Google Scholar] [CrossRef]
- Song, M.; Li, H. Estimating the efficiency of a sustainable Chinese tourism industry using bootstrap technology rectification. Technol. Forecast. Soc. Chang. 2019, 143, 45–54. [Google Scholar] [CrossRef]
- Song, M.; Peng, J.; Wang, J.; Zhao, J. Environmental efficiency and economic growth of China: A Ray slack-based model analysis. Eur. J. Oper. Res. 2018, 269, 51–63. [Google Scholar] [CrossRef]
- Wang, Z.; Lu, M.; Wang, J.-C. Direct rebound effect on urban residential electricity use: An empirical study in China. Renew. Sustain. Energy Rev. 2014, 30, 124–132. [Google Scholar] [CrossRef]
- Rafaj, P.; Amann, M. Decomposing Air Pollutant Emissions in Asia: Determinants and Projections. Energies 2018, 11, 1299. [Google Scholar] [CrossRef]
- Xu, S.; Zhang, W.; Li, Q.; Zhao, B.; Wang, S.; Long, R. Decomposition Analysis of the Factors that Influence Energy Related Air Pollutant Emission Changes in China Using the SDA Method. Sustainability 2017, 9, 1742. [Google Scholar] [CrossRef]
- Wang, K.; Tian, H.; Hua, S.; Zhu, C.; Gao, J.; Xue, Y.; Hao, J.; Wang, Y.; Zhou, J. A comprehensive emission inventory of multiple air pollutants from iron and steel industry in China: Temporal trends and spatial variation characteristics. Sci. Total. Environ. 2016, 559, 7–14. [Google Scholar] [CrossRef]
- Seifert, S.; Cullmann, A.; Von Hirschhausen, C. Technical efficiency and CO2 reduction potentials—An analysis of the German electricity and heat generating sector. Energy Econ. 2016, 56, 9–19. [Google Scholar] [CrossRef]
- Gao, Y.; Zhang, M. The measure of technical efficiency of China’s provinces with carbon emission factor and the analysis of the influence of structural variables. Struct. Chang. Econ. Dyn. 2019, 49, 120–129. [Google Scholar] [CrossRef]
- Tan, R.P.; Lin, B.Q. What factors lead to the decline of energy intensity in China’s energy intensive industries? Energy Econ. 2018, 71, 213–221. [Google Scholar] [CrossRef]
- Chen, J.; Zhou, C.; Wang, S.; Li, S. Impacts of energy consumption structure, energy intensity, economic growth, urbanization on PM2.5 concentrations in countries globally. Appl. Energy 2018, 230, 94–105. [Google Scholar] [CrossRef]
- Magazzino, C. The relationship among economic growth, CO2 emissions, and energy use in the APEC countries: A panel VAR approach. Environ. Syst. Decis. 2017, 37, 353–366. [Google Scholar] [CrossRef]
- Wang, L. Study on NOx emissions reduction potential and its strategies of China’s 30 provinces based on LMDI. Acta Sci. Circumstantiae 2017, 37, 2394–2402. [Google Scholar]
© 2019 by the authors. Licensee MDPI, Basel, Switzerland. This article is an open access article distributed under the terms and conditions of the Creative Commons Attribution (CC BY) license (http://creativecommons.org/licenses/by/4.0/).