Abstract
Sustainable food production and consumption are currently key issues. About one third of food produced for human consumption is wasted. In developed countries, consumers are responsible for the largest amount of food waste throughout the supply chain. The unwillingness to purchase and consume suboptimal food products is an important cause of food waste, however, the reasons behind this are still insufficiently studied. Our research addresses the question of how combinations of color, shape and damage of apples influence consumer liking and perceived sensory attributes. In a laboratory study based on factorial design of visual appearance (color, shape and damage varied from optimal to suboptimal) a total of 130 consumers evaluated sensory perception of flavor and texture attributes in apple samples. Liking was also evaluated. The results showed a significant difference in liking between an optimal apple and all apple categories with at least two out of three suboptimal properties. Further, it was a clear trend that the optimal apple was perceived as sweeter, crispier, less bitter, and less earthy than all the other apples by the participating consumers, however, the results were not statistically significant. A suboptimal appearance, therefore, had a negative effect on both perception and liking.
1. Introduction/Background
Sustainable food production and consumption are currently key issues of today. Food waste reduction initiatives and programs have received increased attention in both science and society during the past decade, and research has given more attention in recent years to wastage in production [1]. About one third of food produced for human consumption is wasted throughout the supply chain [2]. A quarter of crops in worldwide production and consumption has been found to be wasted or lost [3]. It is not possible to avoid all food waste; however, redistribution or conversion of food to animal feed is generally considered less favorable than avoiding food waste. Developed countries typically produce a lot of wastage at the end of the supply chain whereas developing countries have a larger amount of loss in the earlier stages due to supply chain inefficiencies [4].
It has been found that 15% of all fresh and consumer-friendly food is discarded before it becomes available for sale in supermarkets/stores [5], and producers of fruits and vegetables discard up to 30% because of aesthetic imperfections, meaning that a lot of food is wasted before entering the supermarkets [6]. As an example, of the approximately 30,000 tons of apples produced in Sweden, 7–10% is wasted each year; this does not include all the fruit that is wasted in peoples’ gardens. Wastage is partly due to products being discarded because they do not comply with tight international trade regulations and standard specifications for size, weight, shape etc. Foods that do not fulfill these standards are either processed into other products or, unfortunately, wasted in the supply chain due to the belief that consumers do not want to purchase or consume such products [7]. Therefore, knowledge about consumer liking and perception is of importance in order to avoid food waste.
For sustainability to increase, our consumption patterns need to change [8]. An unwillingness to purchase and consume imperfect food products is thought to be an important cause of food waste [7,9], however, the reasons behind consumer-related food waste have been insufficiently studied. In a purchase situation, the consumer most often cannot evaluate the whole product prior to purchase, but instead has to rely on the information given—if any—and what can be interpreted from the appearance. If consumers would be more willing to buy and consume products with minor defects, discoloration, unusual shape or other minor damage, this would surely reduce food waste. Consumer attitudes tend to vary depending on the type of defect; there is also a difference between being in a store situation and at home [3]. It has further been shown that red apples are more liked than green ones, and that red colored apples may be seen as more optimal than green [10,11].
According to the literature, there are three main categories of factors that consumers find relevant concerning the visual appearance of apples: (1) Color, (2) shape and (3) physical form/damage [12,13,14]. These characteristics affect the purchase intentions of consumers, but only if they deviate significantly from the norm and may be perceived as suboptimal [10,14]. These three main categories are of importance when studying the perception of optimal and suboptimal apples. This research aims to evaluate how combinations of color, shape and damages influence consumer liking and perceived sensory attributes. From a sustainability perspective, the overall goal is to increase the awareness of consumers’ perceptions of suboptimality.
2. Material and Methods
Two slices of randomly selected and peeled apples were served to the participating consumers while they were looking at picture collages of apples, where each collage represented a specific combination of the visual three-dimensional aspects of color, shape and damage, i.e., collages that differed in suboptimality. The randomly selected taste samples were assessed by the consumers with respect to liking and perceived sensory characteristics. For each of the eight pictures, two new slices of the randomly selected apples were served, thus, each consumer participated in eight trials to assess the eight combinations of pictures and apple slices. The assumption was that there would not be any differences in either liking the apples or how they were perceived.
The study took place in 2017 at the Dept. of Agrifood and Bioscience, RISE—Research Institute of Sweden in Gothenburg. A random sample of 130 Swedish consumers (68% (n = 88) women, 32% (n = 42) men) aged between 20–80 years (mean 50 years) participated in the study. The inclusion criteria were open except that the participants had to regularly purchase and/or eat apples. Background data were collected. Participation was anonymous and voluntary; ethical review was not required in this study according to the Swedish Ethical Review Act (SFS 2003:460) [15].
The study was based on a cubic full factorial design of visual appearance (color, shape and damage) presented in a total of eight samples, each consisting of a combination of pictures in a collage describing the optimality-suboptimality. The categories were ranging from optimal to suboptimal in all three dimensions (based on combinations of color (red-to-green), shape (normal-to-odd), and damage (none-to-damage). The design is presented in Table 1 and visualized in Figure 1. The picture collages consisted of combinations of pictures for each category and were combined with the tasting of eight randomly selected apples. The apples served as taste samples, were all cultivated in Sweden and of different cultivars. They were peeled, sliced, mixed up and served, one at a time, in random order, in three-digit coded cups together with one picture combination of apple categories from the cubic design, also marked with the three-digit code. The amount of the taste sample was approximately one quarter of an apple, divided into two slices per serving. The consumers were told to eat a part of or the whole serving. Consumer perception was using the following thirteen flavor and texture attributes: Mealiness, dryness, juiciness, crispiness, chewiness, tastefulness, tastelessness, sweetness, acidity, bitterness, earthiness, spiciness and freshness. These attributes were based on former descriptive sensory analyses performed by Smaka Sverige, a national compilation report completed by Jordbruksverket (The Swedish Board of Agriculture) in 2015 [16].

Table 1.
The eight apple categories included in the study according to a cubic design. Color: 0 = red (optimal), 1 = green (suboptimal). Shape: 0 = normal (optimal), 1 = odd shaped (suboptimal). Damage: 0 = no damage (optimal), 1 = damage (suboptimal).
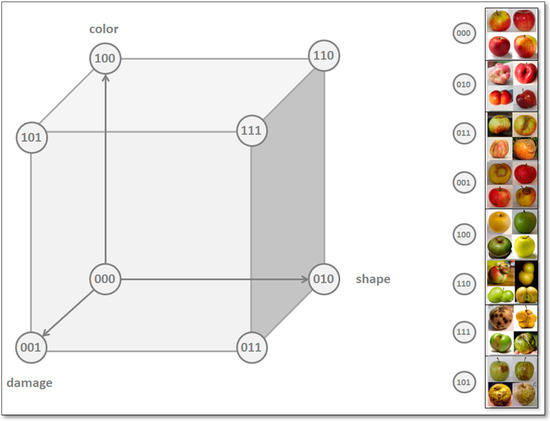
Figure 1.
Visualization of the cubic design of the visual design factors: Appearance (color (red-to-green); shape (normal-to-odd); damage (none-to-damage) with a total of eight combinations ranging from optimal to suboptimal in all three dimensions.
The assessments of the attributes with no further descriptions than given above were performed on a self-instructive questionnaire by all consumers on a 7-point scale ranging from “does not exist” (= 0) to “exists to a large extent” (= 6). Further, the liking of each apple slice was assessed on a 7-point hedonic scale ranging from “dislike extremely” to “like extremely” [17].
3. Statistical Evaluation
The statistical evaluation was performed using MATLAB (MathWorks, Natick, MA, USA). We performed a multiple comparison test using one-way Analysis of Variance (ANOVA) in conjunction with a Tukey-Kramer multiple comparison test (i.e., the Tukey honest significant difference criterion) at the 0.05 significance level to assess how appearance attributes (i.e., color, shape, and damage) influence liking. Further, we performed the same ANOVA and Tukey-Kramer procedure for all the perceived sensory attributes. Note that these were one-way analyses using eight groups/levels instead of three-way analyses with the three appearance factors separate and two levels each. This is because we felt that this made the comparison easier to comprehend than a full (with interactions) three-way analysis and the significance of differences between apple categories remains the same. The outcome is an assessment of which differences between apple categories are significant with respect to liking and with respect to each sensory attribute separately. For the perceived sensory attributes, we add a Bonferroni correction for multiple comparisons because there are 13 identical statistical procedures performed (this entails effectively dividing the alpha = 0.05 value by the number of tests, i.e., 13). Inspection of within-group average values of liking and sensory attributes reveals the direction in which the significant differences point.
4. Results
From the sample of 130 consumers, 89% ate apples at least once a week and 76% ate apples every day or several times a week. All consumers had complete or partial responsibility for the grocery shopping in their household; 95% of the consumers lived in a medium to larger city in Sweden (> 50,000 inhabitants).
The results showed that there were no significant differences between any of the eight apple categories regarding how the consumers perceived the sensory attributes. Before the Bonferroni multiple comparison correction, there was one significant difference in perceived earthiness between the two apple categories (011) (red, odd shape, and damaged) and the most optimal apple [000], but not after. The lowest p-values for each sensory attribute separately were p = 0.8136 (mealiness), 0.8991 (dryness), 0.1813 (juiciness), 0.4133 (crispiness), 0.4994 (chewiness), 0.1878 (tastefulness), 0.5820 (tastelessness), 0.0672 (sweetness), 0.3269 (acidity), 0.0397 (earthiness), 0.2610 (bitterness), spiciness (0.5806), and 0.0544 (freshness). Note that a p-value would need to be lower than 0.05/13 = 0.0038 to be judged significant in this procedure. The results also indicated that the optimal apple category (000) was perceived as the sweetest, crispiest, least bitter, and least earthy of all categories; however, these results were not significant at the 0.05 level. In addition, the results indicated that the most bitter apple category was (111) (green, odd shape, and damaged) and that green apples were generally perceived as less sweet; however, these results were also not significant.
The sensory profiles for the random apples tasted in combination with the picture of each apple category are presented in spider diagrams, Figure 2; Figure 3, separated by texture and flavor/taste attributes.
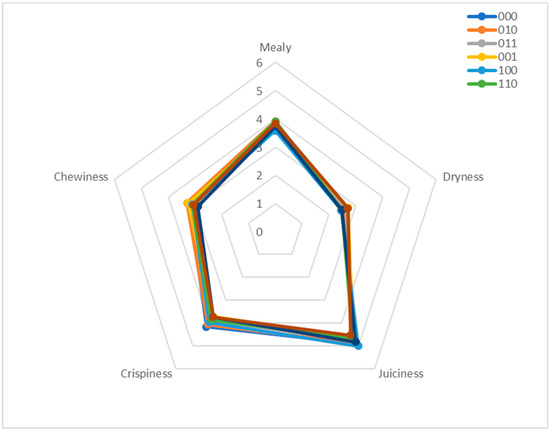
Figure 2.
Texture attributes.
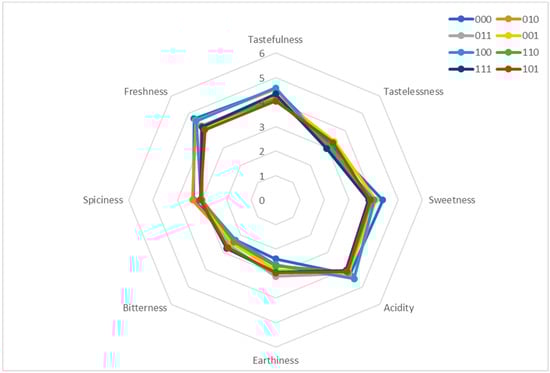
Figure 3.
Taste and flavor attributes.
The mean values of liking are shown in Table 2. All eight categories of apple were rated above average on the 7-point hedonic scale and the most optimal apple (000) was the most liked. The multiple comparison test indicated that all apples with at least 2 out of 3 suboptimal properties (i.e., (011), (101), (110), and (111)) had significantly lower liking scores (p = 0.0034, 0.0010, 0.0480, and 0.0140, respectively) than the most optimal apple (000). No significant differences were found between the most optimal apple and apples with only one suboptimal property. The apple samples served randomly, implied that there should be no significant, true differences between the apple categories. The fact that there were some significant differences with respect to liking indicates that appearance has a significant impact on sensory perception.
Table 2.
Mean value for liking of the apples measured on a 7-point scale. * Significant difference (p ≤ 0.05) from the optimal apple category (000).
5. Discussion
This research addressed the question of how combinations of different visual aspects of color, shape and damage of apples influence consumer preferences and perceived sensory attributes. Consumers today have a continuously large range of appealing fruits to choose from in the supermarket, always fresh. Cultivation development and global trade restrictions have resulted in most products looking the same due to tight specific standardizations and with the assumption that this is what consumers want. However, as already stated in the introduction, this causes considerable food waste and assumed consumer preferences are responsible for the largest share of food waste in Western countries [18].
The design of this research included eight different pictures with collages of apples, each representing a specific combination of the visual three-dimensional aspects of color, shape and damage. The pictures with each apple category were presented and served with randomly selected apples. The consumers’ task was to evaluate sensory attributes of the randomly served apples while looking at the picture collage with apples varying in suboptimality. Hence, sensory attributes were not expected to significantly differ between categories. However, it was a clear trend that the results indicated that the randomly served apple together with the picture of the most optimal apple category (000) was perceived as the sweetest, crispiest, least bitter, and least earthy of all the apple categories. However, even if the trend was clear, the results were not statistically significant. Further, randomly served apples together with pictures of green apples were perceived as less sweet, although neither of these results was statistically significant. The highest average score for bitterness was observed for apples served together with a picture showing the category with a combination of green color, odd shape, and damage (111) indicating that visual appearance influenced perception. This is perfectly in line with Wendin et al. (2019) who showed that visual appearance, such as color and shape, has a great impact on the preference of strawberries [19].
The data is scattered and some samples were perceived both mealy and juicy which might be considered contrasting. However, consumers are not trained and should not be compared to trained sensory panelists since consumers are less sensitive to differences between samples, as has been seen in other studies [20]. Jaeger et al. (1998) found that consumers considered mealiness a negative attribute for apples and associated it with an inferior texture [20]. Mealiness was also linked to a stale flavor and a less fresh apple. Bitterness was also generally a disliked attribute. In our research, all but one (110) of the significantly least liked apple categories received comparably higher scores for bitterness, meaning that the more liked apples scored lower for bitterness. These results are, however, not significant and all the apples in our study scored overall rather low in bitterness. The trend seen by Jaeger et al. (1998) was not seen for the attribute of mealiness in our data. Consumers might also struggle to notice attributes since one attribute can be easier to perceive or more dominant than others, e.g., when apples are perceived high in acidity this attribute is more dominant than mealiness, as presented by Jaeger et al. (1998) [20]. Regarding earthiness (or comparable stale flavor), some apple-category pictures scored higher than others but still scored high in liking; however, the lowest score of earthiness was, as discussed above, connected to the most optimal apple−picture category (000). Freshness has been shown to be a very important attribute for the consumer liking of apples [21]. The most liked apple in our study also scored highest in freshness, which supports the results of Péneau et al. (2006) [21], closely followed by the apples with only shape suboptimality and the green apple. The lowest scores for freshness were seen for the random apple samples served with pictures of apples that were suboptimal due to damage, categories (101), (001) and (111).
As discussed by e.g., Harker et al. (2003) [22], consumer preference is a combination of the experience of both flavor and texture, meaning that consumers are not (and should not be) trained in noticing differences between attributes; however, they know and should focus upon what they like and dislike. This means that attributes and liking scores are assumed to differ between consumers, which was also seen in our data. Harker et al. (2003) mention two groups of consumers, one group that prefers sweet and crispy apples and the other that prefers juicy and acidic apples [22]. This might also explain the high scores for the apple which was suboptimal only in color; some consumers appreciate the Granny Smith-like apples for their freshness, acidity and hard texture [23], which might have affected their ratings.
89% of our consumers ate apples at least once a week and 76% every day or several times a week. Research by Péneau et al. (2006) [21] showed that consumers who ate less than two apples a week were more sensitive to appearance than more frequent eaters. Since our participants were frequent consumers, the visual effect might have been lower than if we had included only participants with less frequent apple consumption.
Generally, data showed that red apples were more liked than green apples, which has also been seen in previous research [10,11,24,25]. In our data, green apples had to be combined with other suboptimal properties for the liking scores to be significantly affected. Damage also seems to significantly affect liking, which is similar to results by, e.g., de Hooge et al. (2017) [7]; however, in our data this was first seen when combined with another dimension. De Hooge showed that an apple with a brown spot had low purchase intention and only 21% of the consumers would eat the apple if they had it at home [7]. Similar results were seen by Aschemann-Witzel et al. (2017) [26] where consumers simply did not like products in supermarkets that they assumed would be wasted in their homes (and therefore a waste of money). Willingness-to-pay and purchase intention were not measured in this study, but other studies have shown [7,27] that consumers are generally positive to price reductions of suboptimal products, meaning that the acceptance of such products is connected to reduced prices, with the conclusion that suboptimal products are seen as products with lower value. Neither color, odd shape nor damage individually had a significant negative effect on liking in our study since the mean values were close to the liking score of the most optimal apple. However, the randomly served apples in combination with pictures of damaged apples tended to be perceived as less crispy, less tasteful, less sweet, less acidic and with less freshness and instead, with an earthier flavor and a more bitter taste. Crispiness has been shown to be the most critical of attributes for liking regarding apples [11,25]. As for purchase intention, shape abnormalities of fruits and vegetables have been shown to have a negative impact since consumers think that odd shapes imply lower quality products [13]. It can be assumed that consumers in our study would have a lower purchase intention for the apples with at least two suboptimal dimensions since they generally received lower scores in the sensory profiling.
6. Conclusions
Consumers evaluated the sensory attributes of apples with different grades of visual suboptimality as not significantly different; however, liking differed significantly between the apples, where the apples with no or low visual suboptimality had the highest scores. It can be concluded that visual appearance of color, shape and damage has a significant impact on consumer liking. From a sustainability perspective, the awareness of suboptimality needs to increase among consumers and along the food supply chain.
Author Contributions
Conceptualization, A.N. and K.W.; methodology, A.N. and K.W.; validation, A.N., M.R. and K.W.; formal analysis, M.R.; investigation, A.N.; writing—original draft preparation, A.N.; writing—review and editing, M.R. and K.W.; visualization, A.N.
Funding
This research was funded by the Swedish Research Council FORMAS as part of the project Consumers in a Sustainable Food Supply Chain (COSUS), grant number 2014-00051.
Acknowledgments
Laura Andreea Bolos and Carl-Johan Lagerkvist, Swedish University of Agricultural Sciences, are acknowledged for their participation in discussions and experimental issues.
Conflicts of Interest
The authors declare no conflict of interest.
References
- Willett, W.; Rockström, J.; Loken, B.; Springmann, M.; Lang, T.; Vermeulen, S.; Jonell, M. Food in the Anthropocene: The EAT–Lancet Commission on healthy diets from sustainable food systems. Lancet 2019, 393, 447–492. [Google Scholar] [CrossRef]
- FAO. Food Wastage Footprint: Impacts on Natural Resources, Summary Report 2013; FAO: Rome, Italy, 1998; ISBN 978-92-5-107752-8. [Google Scholar]
- Aschemann-Witzel, J.; De Hooge, I.E.; Normann, A. Consumer-Related Food Waste: Role of Food Marketing and Retailers and Potential for Action. J. Int. Food Agribus. Mark. 2016, 28, 271–285. [Google Scholar] [CrossRef]
- Parfitt, J.; Barthel, M.; Macnaughton, S. Food waste within food supply chains: Quantification and potential for change to 2050. Philos. Trans. R. Soc. 2010, 365, 3065–3081. [Google Scholar] [CrossRef]
- Brody, A.L.; Bugusu, B.; Han, J.H.; Koelsch Sand, C.; McHugh, T.H. Innovative food packaging solutions. J. Food Sci. 2008, 73, 107–116. [Google Scholar] [CrossRef] [PubMed]
- Rohm, H.; Oostindjer, M.; Aschemann-Witzel, J.; Symmank, C.; Almli, V.L.; De Hooge, I.E.; Normann, A.; Karantininis, K. Consumers in a Sustainable Food Supply Chain (COSUS): Understanding Consumer Behavior to Encourage Food Waste Reduction. Foods 2017, 6, 104. [Google Scholar] [CrossRef] [PubMed]
- De Hooge, I.E.; Oostindjer, M.; Aschemann-Witzel, J.; Normann, A.; Mueller Loose, S.; Lengard Almli, V. This Apple is Too Ugly for Me! Consumer Preferences for Suboptimal Food Products in the Supermarket and at Home. Food Qual. Prefer. 2017, 56, 80–92. [Google Scholar] [CrossRef]
- United Nations. About the Sustainability Goals; United Nations: Washington, DC, USA; Available online: https://www.un.org/sustainabledevelopment/sustainable-development-goals/ (accessed on 10 June 2019).
- Aschemann-Witzel, J.; De Hooge, I.E.; Amani, P.; Bech-Larsen, T.; Oostindjer, M. Consumer-related food waste: Causes and potential for action. Sustainability 2015, 7, 6457–6477. [Google Scholar] [CrossRef]
- Bolos, L.A.; Lagerkvist, C.J.; Kulesz, M.M. Complementarity of implicit and explicit attitudes in predicting the purchase likelihood of visually sub-optimal or optimal apples. Food Qual. Prefer. 2019, 75, 87–96. [Google Scholar] [CrossRef]
- Cliff, M.A.; Stanich, K.; Lu, R.; Hampson, C.H. Use of descriptive analysis and preference mapping for early-stage assessment of new and established apples. J. Sci. Food Agric. 2016, 96, 2170–2183. [Google Scholar] [CrossRef] [PubMed]
- Blasco, J.; Aleixos, N.; Gómez, J.; Moltó, E. Citrus sorting by identification of the most common defects using multispectral computer vision. J. Food Eng. 2007, 83, 384–393. [Google Scholar] [CrossRef]
- Loebnitz, N.; Schuitema, G.; Grunert, K.G. Who Buys Oddly Shaped Food and Why? Impacts of Food Shape Abnormality and Organic Labeling on Purchase Intentions. Psychol. Mark. 2015, 32, 408–421. [Google Scholar] [CrossRef]
- Seppä, L.; Railio, J.; Vehkalahti, K.; Tahvonen, R.; Tuorila, H. Hedonic Responses and Individual Definitions of an Ideal Apple as Predictors of Choice. J. Sens. Stud. 2013, 28, 346–357. [Google Scholar] [CrossRef]
- Vad Säger Lagen? Swedish Ethical Review Authority. Available online: https://etikprovning.se/for-forskare/vad-sager-lagen/ (accessed on 8 May 2019).
- 15Jordbruksverket Smaka Sverige. Available online: http://smakasverige.jordbruksverket.se/ravaror/informationsartiklar/artiklar/resultatapple.939.html (accessed on 4 February 2015).
- Lawless, H.; Heymann, H. Sensory Evaluation of Food—Principles and Practices, 2nd ed.; Springer: New York, NY, USA, 2010. [Google Scholar]
- Naturvårdsverket. Matavfall i Sverige—Uppkomst och Behandling 2014; Rapport 8765; Naturvårdsverket: Stockholm, Sweden, 2016. [Google Scholar]
- Wendin, K.; Egan, P.A.; Olsson, V.; Forsberg, S.; Nilsson, A.; Stenberg, J.A. Is there a best woodland strawberry? A consumer survey of preferred sensory properties and cultivation characteristics. Int. J. Gastron. Food Sci. 2019, 16, 100151. [Google Scholar] [CrossRef]
- Jaeger, S.; Andani, Z.; Walkeling, I.N.; MacFie, H.J.H. Consumer preference for fresh and aged apples: A cross-cultural comparison. Food Qual. Prefer. 1998, 9, 355–366. [Google Scholar] [CrossRef]
- Péneau, S.; Hoehn, E.; Roth, H.R.; Escher, F.; Nuessli, J. Importance and consumer perception of freshness of apples. Food Qual. Prefer. 2006, 17, 9–19. [Google Scholar] [CrossRef]
- Harker, F.G.; Gunson, F.A.; Jaeger, S. The case for fruit quality: An interpretive review of consumer attitudes, and preferences for apples. Postharvets Biol. Technol. 2003, 28, 333–347. [Google Scholar] [CrossRef]
- Alston, F.H.; Evans, K.M.; MacFie, H.J.H.; King, G.J.; Beyts, P.K. The potential for improving organoleptic quality in apples through marker assisted breeding related to consumer preference studies. In Agri-Food Quality: An Interdisciplinary Approach; Royal Society of Chemistry, Agris: Cambridge, UK, 1996; pp. 35–38. [Google Scholar]
- Denver, S.; Jensen, J.D. Consumer preferences for organically and locally produced apples. Food Qual. Prefer. 2014, 31, 129–134. [Google Scholar] [CrossRef]
- Manalo, A.B. Assessing the importance of apple attributes: An agricultural application of conjoint analysis. Northeast. J. Agric. Resour. Econ. 1990, 19, 118–124. [Google Scholar] [CrossRef]
- Aschemann-Witzel, J.; Haagen Jensen, J.; Hyldetoft Jensen, M.; Kulikovskaja, V. Consumer behaviour towards price-reduced suboptimal foods in the supermarket and the relation to food waste in households. Appetite 2017, 116, 246–258. [Google Scholar] [CrossRef] [PubMed]
- Aschemann-Witzel, J.; Giménez, A.; Ares, G. Consumer in-store choice of suboptiomal food to avoid food waste: The role of food category, communication and Perception of quality dimensions. Food Qual. Prefer. 2018, 68, 29–39. [Google Scholar] [CrossRef]


© 2019 by the authors. Licensee MDPI, Basel, Switzerland. This article is an open access article distributed under the terms and conditions of the Creative Commons Attribution (CC BY) license (http://creativecommons.org/licenses/by/4.0/).