Article

Investigating Road-Constrained Spatial Distributions and Semantic Attractiveness for Area of Interest

1
School of Tourism and Geography Science, Yunnan Normal University, Kunming 650500, China
2
Center for Myanmar Studies of Yunnan Normal University, Kunming 650500, China
3
College of Geography and Environment, Shandong Normal University, Jinan 250300, Shandong, China
4
Research and Development Centre for Big Geo-Data, Shandong Normal University, Jinan 250300, Shandong, China
*
Authors to whom correspondence should be addressed.
Sustainability 2019, 11(17), 4624; https://doi.org/10.3390/su11174624
Submission received: 3 August 2019 / Revised: 20 August 2019 / Accepted: 24 August 2019 / Published: 26 August 2019

Abstract

:
An area of interest (AOI) refers to an urban area that attracts people’s attention within different urban functions through cities. The wide availability of big geo-data that are able to capture human activities and environmental socioeconomics enable a more nuanced identification of AOIs. Current research has proposed various approaches to delineate continuous AOI patterns using big geo-data. However, these approaches ignore the effects of urban structures such as road networks on reshaping AOIs, and fail to investigate the attractiveness and certain functions within AOIs. To fill this gap, this paper proposes a systematic framework to investigate the spatial distribution of road-constrained AOIs and analyze the semantic attractiveness. First, we propose an Epanechnikov-based kernel density estimation (KDE) with a bandwidth selection strategy to extract road-constrained AOIs. Then, we establish semantic attractiveness indices regarding AOIs based on the textual information and the number of review data. Finally, we investigate in detail the spatial distribution and semantic attractiveness of AOIs in Yuexiu, Guangzhou. The results show that road-constrained AOIs can not only effectively capture the human activity patterns influenced by urban structures, but also depict certain urban functions including entertainment, public, service, hotel, education, and food functions. This method provides a quantitative reference to monitor urban structures and human activities to support city planning.

1. Introduction

An area of interest (AOI) refers to an urban area that attracts people’s attention [1]. Numerous types of AOI are widely spread with different urban functions through cities, including commercial centers, entertainment areas, and residential regions [2,3], and are assigned higher priorities in urban facility and resource allocation. Therefore, investigating AOIs plays a significant role in city planning, tourism development, and resource management [4,5,6]. However, because AOIs are generally gathering various human activities and influenced by socioeconomic changes [7], it is challenging to detect AOIs through traditional approaches and data such as field survey and image interpretation.
The wide availability of big geo-data has shown potential to capture human activities and the environmental socioeconomics [8]. Numerous studies have examined the correspondence between big geo-data and urban functions that can reflect certain AOIs. Zhu et al. [9] analyzed the temporal variation of taxi data to detect different urban functions from a street-level perspective. Xing et al. [10] investigated the usability of Twitter check-ins and examined the relationship between the variation of Twitter textual information and land-use mixtures. With regard to commercial functions, Lloyd and Cheshire [11] focused on the spatial distribution of retail locations and catchments according to the retailer-generated Twitter data. In addition, geo-tagged photos such as social media photos and street view images have also been used in current research. Samany [12] proposed a framework to automatically extract landmarks from geo-tagged social media data using a deep neural network. By detecting the hourly variation of taxi trips, Zhang et al. [13] explored street view images for sensing socioeconomic changes.
Despite the ability to effectively utilize big geo-data in detecting AOIs, they are usually displayed in spatial point patterns, and cannot directly represent continuous area patterns of AOIs. Faced with this issue, a large number of researchers have proposed various approaches to delineate AOI patterns. Hu, Gao, Janowicz, Yu, Li, and Prasad [1] considered the point density of geo-tagged photos and utilized a DBSCAN (Density-Based Spatial Clustering of Applications with Noise) clustering method and a chi-shape algorithm to generate AOI polygons based on data distributions. Spyrou et al. [14] designed a tile-shaped AOI delineation approach to distinguish AOIs from independent geo-tagged photos in spatial and semantic perspectives. The above studies have showed effective strategies to aggregate independent data and form continuous AOIs. However, they only considered the distribution characteristics of data that capture human activities and failed to investigate the influences of urban structures on reshaping AOIs.
In fact, the urban structures have been considered important factors to delineate various forms of the urban functions that constitute AOIs [15]. Among the presentation of urban structures, road networks serve as one of the five elements depicting city images [16], and are capable of reflecting heterogeneously spatiotemporal properties from the perspective of linear units [17,18]. Much of the literature has verified the effectiveness of depicting road-constrained distribution. Using traffic flow data, Yu et al. [19] proposed a network-constrained kernel density estimation (KDE) to represent the intensity of central activities and constrain the density estimation, and further delineate the central business district. Similarly, Wang et al. [20] applied the network KDE to characterize commercial facilities by depicting the spatial distribution patterns of customer numbers and satisfaction. Moreover, Popa et al. [21] compressed trajectory data in road networks with deterministic error bounds to systematically transmit and store such data. Brinkhoff [22] proposed a framework that supports generating network-based moving objects for the further exploration of spatiotemporal database analyses.
These researchers provide insights for an alternative way to investigate AOIs from the perspective of road networks. However, applying road-constrained approaches in AOI detection are faced with the following challenges: (1) Unlike traffic flow data, data that can reflect AOI distributions such as check-ins and review data are usually distributed irregularly through road networks and other built-up areas [23,24]. Effective approaches need to be designed to depict road-constrained AOIs. (2) AOIs contain various urban functions including food, entertainment, residential, etc., and cannot be detected solely based on their distribution characteristics [25,26]. Thus, it is necessary to explore the semantic information and the attractiveness within each AOI.
To fill this gap, this paper proposes a systematic framework for investigating the spatial distribution of road-constrained AOIs, and analyzes the semantic attractiveness. Specifically, to extract road-constrained AOI, we utilize Epanechnikov-based KDE and propose a bandwidth selection strategy. On this basis, the textual information and the number of review data are utilized to build semantic attractiveness indices for better understanding the road-constrained AOI. The contributions of this research are listed as follows:
(1) A systematic framework is proposed for extracting road-constrained AOI and measure the semantic attractiveness using review data.
(2) A bandwidth selection strategy is proposed to delineate AOI based on the road distribution characteristics.
(3) A semantic index and attractiveness index are established to detect road-constrained AOI from a thematic perspective.
(4) Road-constrained AOIs in Yuexiu, Guangzhou are investigated to support city planning.
The remainder of this paper is organized as follows. Section 2 illustrates the overall framework for identifying the road-constrained spatial distribution and semantic attractiveness of AOI. Section 3 describes the datasets and the study area used in this research. Section 4 analyzes the results of spatial distribution and semantic attractiveness of the road-constrained AOI. Section 5 summarizes this work and discusses the future directions.

2. Methodology

2.1. Preliminary Definition

AOIs usually comprise both physical and socioeconomic properties. The formal includes urban structures and landscapes, while the latter describes urban functions, income, consumption, etc., which are influenced by human activities.
With regard to the physical properties, we focus on the delineation of AOI boundaries and how road networks influence them. In this study, road-constrained AOIs are defined as the places that attract people’s attention that are accessible by the roads. Therefore, this particular form of AOI is constructed on the basis of the street network. Compared with hot spots that represent locations in which people are aggregated at a specific time, road-constrained AOIs are considered to be regions that show potential attractiveness without time limitations.
An Epanechnikov-based KDE is defined as an area estimation method that is controlled by the Epanechnikov kernel. It shows potential to be utilized in delineating road-constrained AOIs. The key point of determining the boundaries of AOI considers road networks.
Considering the socioeconomic properties, urban functions in the road-constrained AOI are explored. In this study, we propose and conceptualize semantic attractiveness as the attractiveness of different urban functions such as hotels, food, and entertainment from the perspective of semantics. The utilization of latent Dirichlet allocation (LDA) can model different topics corresponding to various urban functions. By calculating the probabilities of different topics, the semantics in each road-constrained AOI can be analyzed.

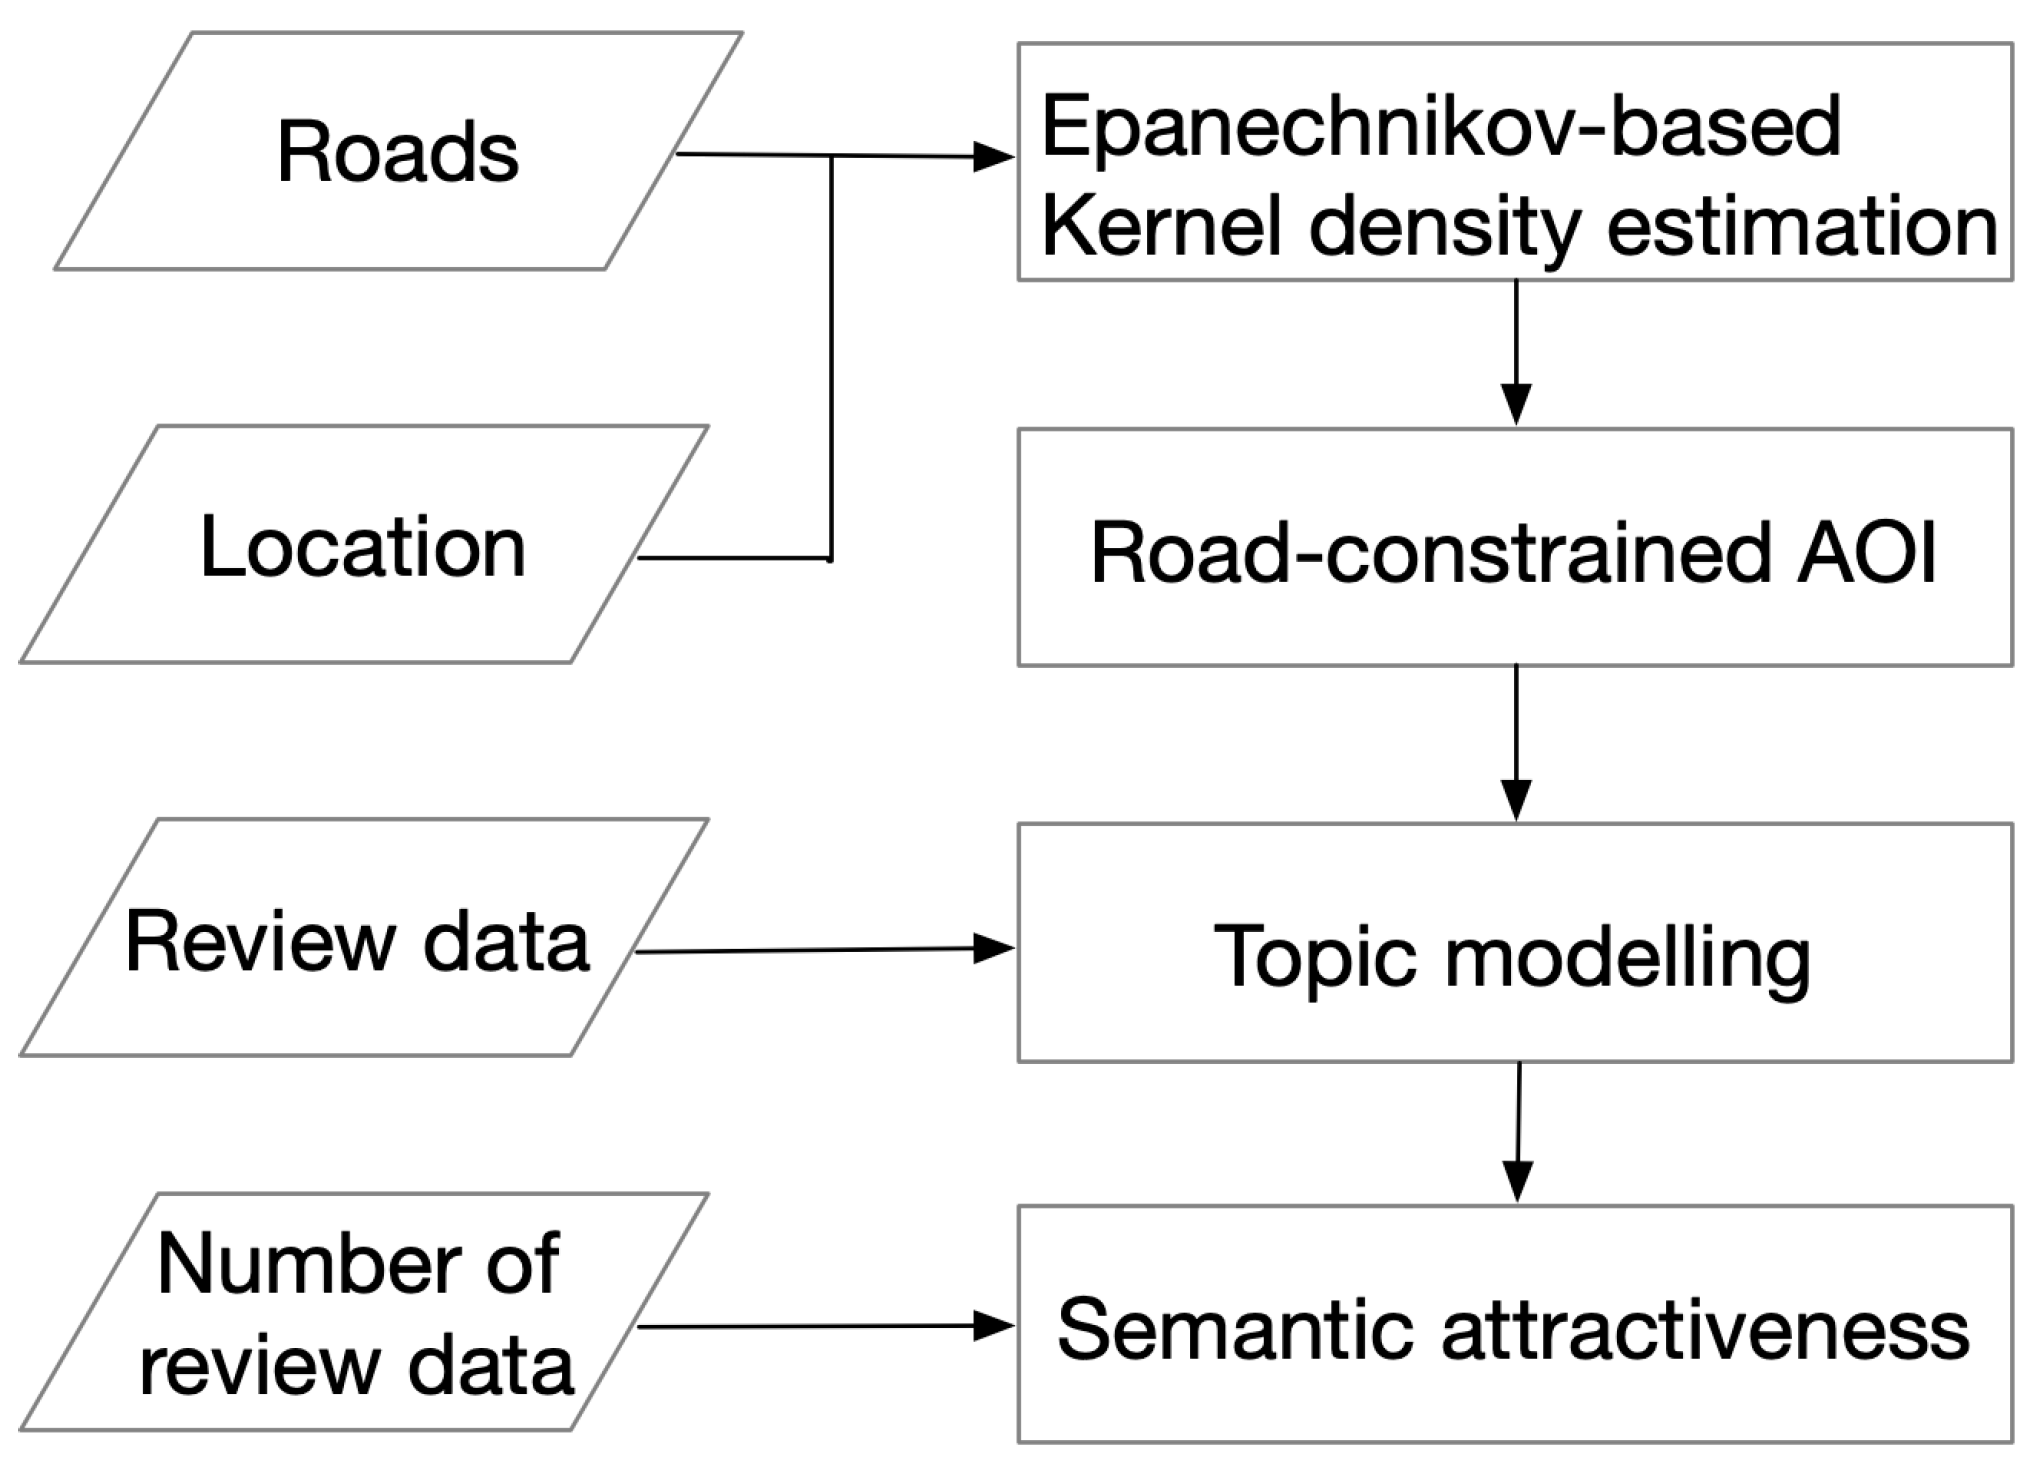
2.2. The Framework for Investigating AOI

2.2.1. Overview

In this study, a novel framework is proposed to investigate road-constrained spatial distribution and semantic attractiveness for AOI. The overall framework is shown in Figure 1. First, kernel density estimation (KDE) is modified using an Epanechnikov kernel function. On this basis, the road distribution is considered, and road-constrained AOIs are extracted. Then, with regard to each AOI, the semantic information is explored using a topic modeling method. We established indices for assessing the semantic attractiveness of AOIs through considering both potential semantic topics and number of review data.

2.2.2. Extracting Road-Constrained AOIs

The aim of this section is to extract road-constrained AOIs from the locations of review data. As an effective approach to estimate the potential regions, KDE [27] has been widely utilized in various applications, including flood assessment [28], facility hotspot detection [29], and urban–rural boundary delineation [30]. However, the traditional KDE approach is limited to detecting the actual AOI distribution affected by road networks. Therefore, we consider the distance between roads and the review data locations as an indicator, and then apply an Epanechnikov-based KDE to extract road-constrained AOIs.
Conventionally, the equation of KDE f ^ ( x )   is shown as follows:
f ^ ( x ) = i = 1 n 1 h 2 k ( x x i h )
where h represents the bandwidth of KDE, n indicates the number of review data that are within the distance of bandwidth h, x represents the location of review data, and x i represents the surrounding review data within the bandwidth.   k ( · ) is the kernel function in which an Epanechnikov kernel function is applied. Compared with other kernel functions, the Epanechnikov kernel function shows potential to provide sufficient smoothing in the present independent data [31]. It helps determine the boundaries of road-constrained AOIs with adaptive bandwidths. The Epanechnikov kernel function is displayed as follows:
k ( x ) = 3 4 ( 1 x 2 ) ,         x [ 1 ; 1 ]
As the bandwidth h determines the generation of AOI, it is set based on the distance between review data locations and road distributions, which is calculated according to the following steps:
(1) Group the locations of review data according to the distribution of road networks. As road networks usually comprise major roads such as highways and main roads, these roads naturally delineate cities into regions [25]. Considering that a region shares similar socioeconomic urban functions, each region is delineated as a road network unit, and is further considered as an independent parcel.
(2) Calculate the average distance d i between the ith review data location to other review data locations within the same parcel and the near parcel:
d i = j = 1 n d i j n
where n indicates the total number of the review data that are near the ith review data. d i j refers to the Euclidean distance between the ith and the jth review data location.
(3) For the ith review data, we generate a new location along the roads that takes the shortest distance to the ith review data, and define the shortest distance as r i .
(4) Choose the target locations for applying KDE according to the following equation:
f ^ ( x ) = { i = 1 n 1 r i 2 k ( x x i r i ) ,             r i < d i j                           0 ,                                                 r i > d i j
A detailed illustration of extracting road-constrained AOI is shown in Figure 2. In general, the review data in which the shortest distance to the road r i is larger than the average distance d i are excluded from extracting road-constrained AOIs. Figure 2a displays an AOI based on traditional KDE, where all review data are captured, while only road-constrained AOIs are extracted in Figure 2b.

2.2.3. Establishing Semantic Attractiveness Indices

Based on the road-constrained spatial distributions of AOIs, their functions and level of attractiveness to the citizens should be recognized. Therefore, the semantic attractiveness indices are proposed in this study for better understanding the road-constrained AOIs. Considering each AOI as an independent unit, reviewing both information and the number of review data are utilized to measure the semantic attractiveness.
For indicating the semantic information in each AOI, we utilize the LDA topic model [32]. First, the total textual information in the review data are considered as one corpus C. Documents D are separated from corpus C according to the road-constrained AOIs. In particular, documents D are defined as follows:
D = { d 1 , d 2 , d 3 d i d n }
where d i indicates the document d in the ith road-constrained AOI. n is the number of AOIs. On this basis, the document D is established as the input for the LDA topic modeling:
p ( θ , z , w | α , β ) = p ( θ | α ) n = 1 N p ( z n | θ ) p ( w n | z n , β )
where w represents the words in the review data, z refers to the topics calculated by topic modeling, n is the number of words, and α , β are hyperparameters where α = 50 / K , β = 0.1 [33]. In addition, K represents the number of topics. Since each topic corresponds to a certain urban function, the number of topics is determined manually, in which topics represent distinguished semantic information. Θ refers to topic distributions in document D, which is defined in the ith AOI as the vector data:
Θ i = { p i , 1 , p i , 2 , p i , 3 p i , k p i , K }
where p i , k represents the probability of the kth topic in the ith AOI. Based on the topic distributions Θ , the semantic index for representing the kth topic in the ith AOI is established as:
S e m a n t i c i , k = p i , k A i
where S e m a n t i c i , k represents the measured semantic value for the kth topic in the ith AOI, and A i is the area of the ith AOI.
For measuring the attractiveness of AOIs, the number of review data is considered as an important indicator. Based on this, the attractiveness index can be established as follows:
A t t r a c t i v e n e s s i = N u m i A i
where A t t r a c t i v e n e s s i refers to the attractiveness value in the ith AOI. N u m i indicates the number of review data in the ith AOI.

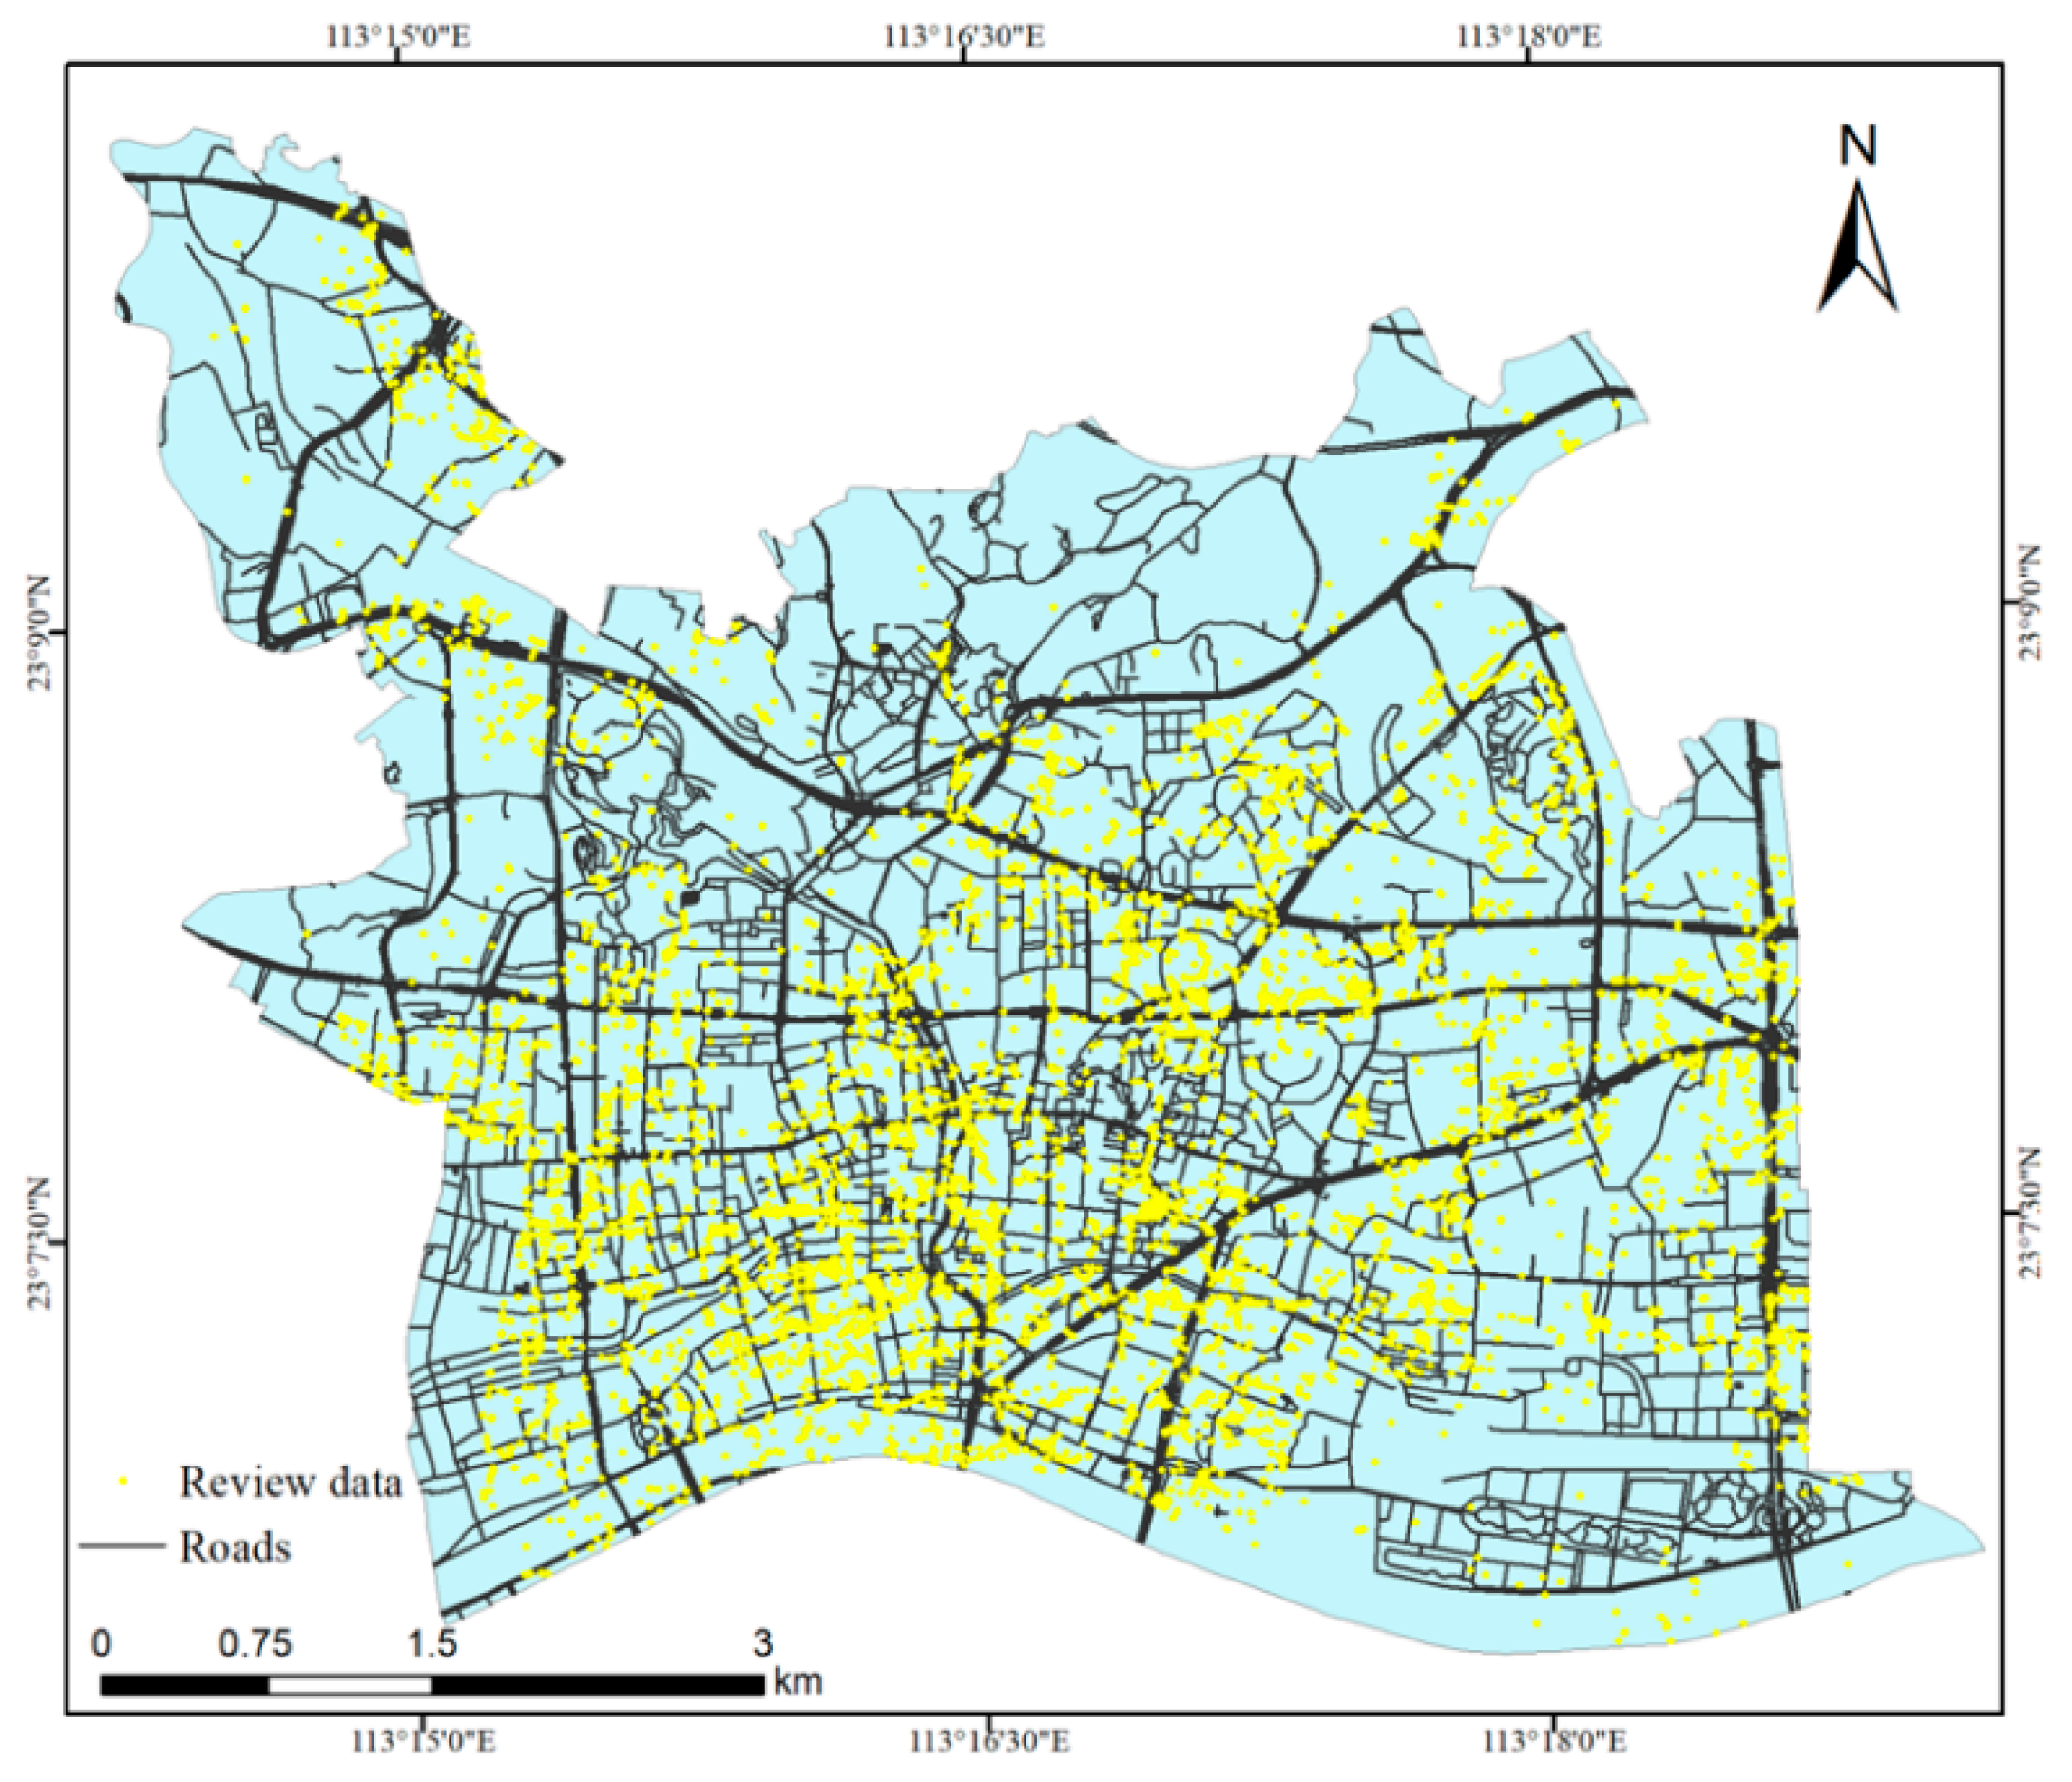
3. Study Area and Data

The study area is located in Yuexiu District of Guangzhou in Guangdong Province. Since Guangzhou has been considered the political, economic, and cultural center of southern China, various AOIs and urban functions are potentially distributed and influenced by complex road networks. To investigate the AOI patterns, we utilized review data to infer the distribution of road-constrained AOIs.
The study area and data sources are displayed in Figure 3. The road networks are collected from AutoNavi, which are available at lbs.amap.com. Meanwhile, the review data are collected from Dianping (developer.dianping.com). Similar to the social network “Yelp”, Dianping is the first independent consumer review website in China. It provides users with business information, consumer comments, and consumer promotions. Thus, it can represent the spatial distribution of human activities related to urban functions to some extent. In this study, we collected a total number of 180,089 review data in 2017 that contain locations and consumer comments. In particular, to exclude noise data, reviews that are generated by the same user within five minutes have been removed. Considering the spatial distribution of roads, we utilize both locations and consumer comments in the review data to delineate the road-constrained AOIs and their semantic attractiveness in the following section.

4. Results

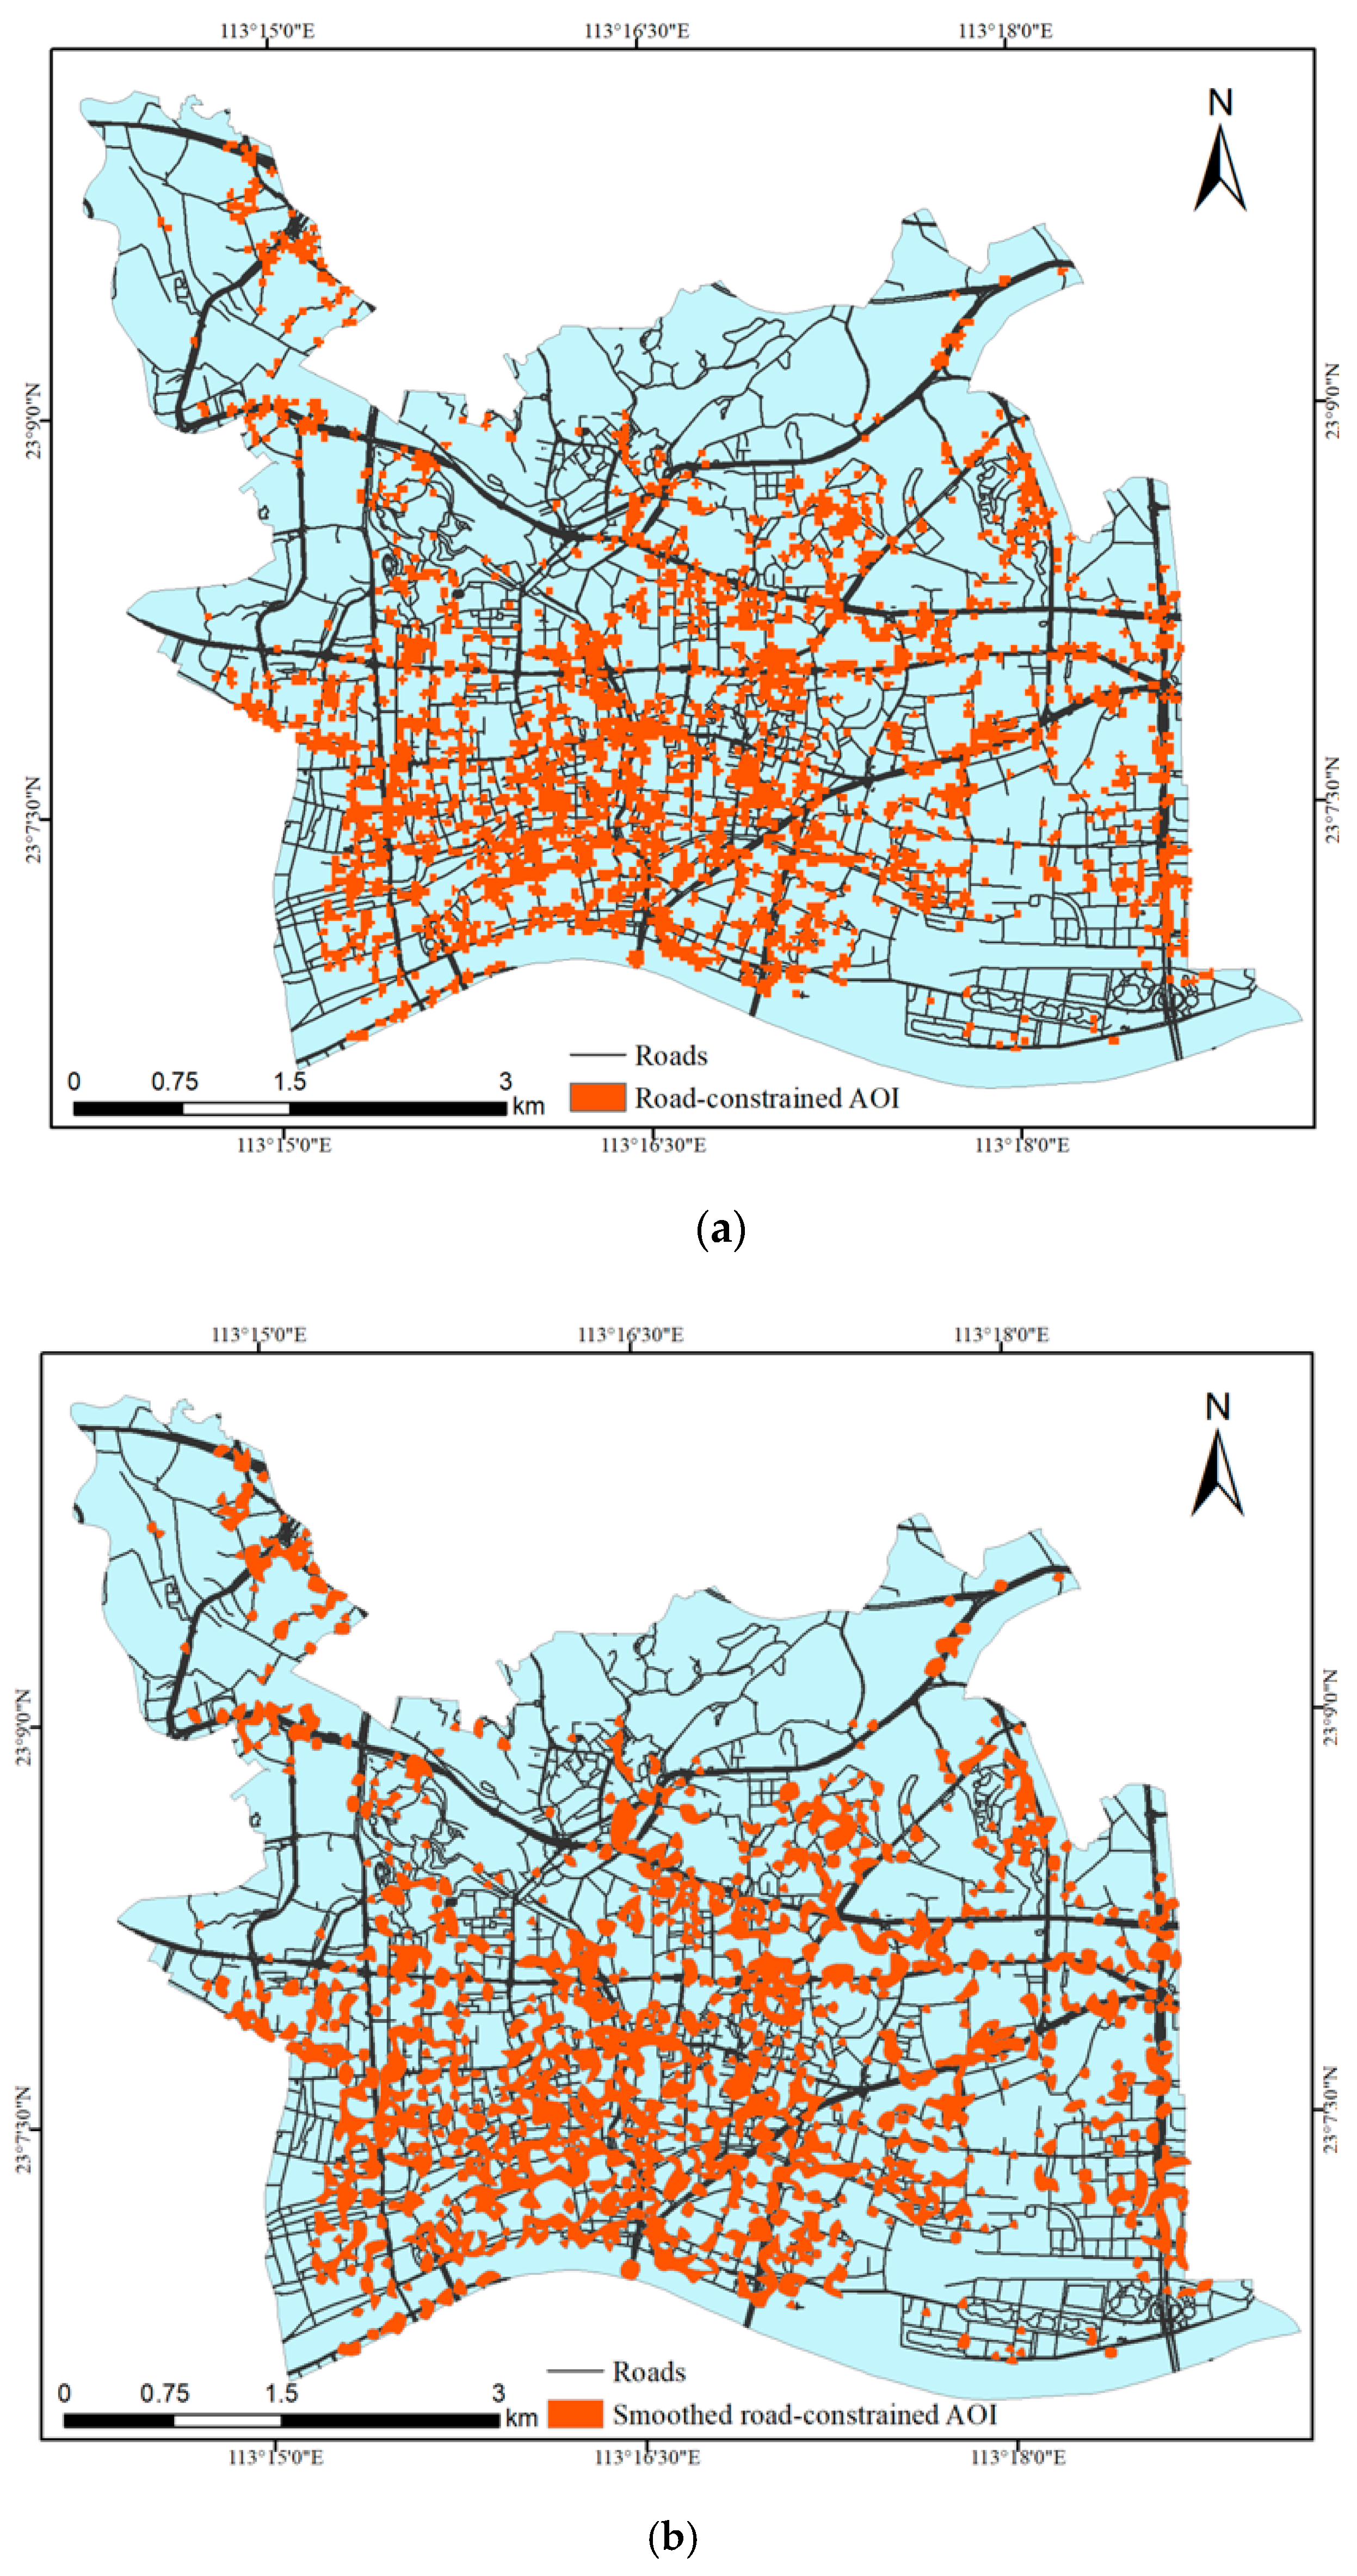
4.1. Spatial Distribution of Road-Constrained AOI

We delineate road-constrained AOIs through utilizing Epanechnikov-based KDE. In particular, we selected kernel density values larger than 0 to constitute the AOI distribution, while 0 values were ignored. The road-constrained AOIs formed by kernel density values are displayed in Figure 4a. The grid size is set as 30 m. On this basis, the grid-shaped AOIs are generated with smoothed boundaries, as shown in Figure 4b. From a visual inspection, road-constrained AOIs are usually clustered compactly along the main roads, while they are sparsely distributed in other roads. From the perspective of road-delineated parcels, those AOIs are distributed unevenly on the edges of parcels. This corresponds to the statement that the spatial units including both urban parcels and streets are heterogeneous with regard to urban functions [34,35].

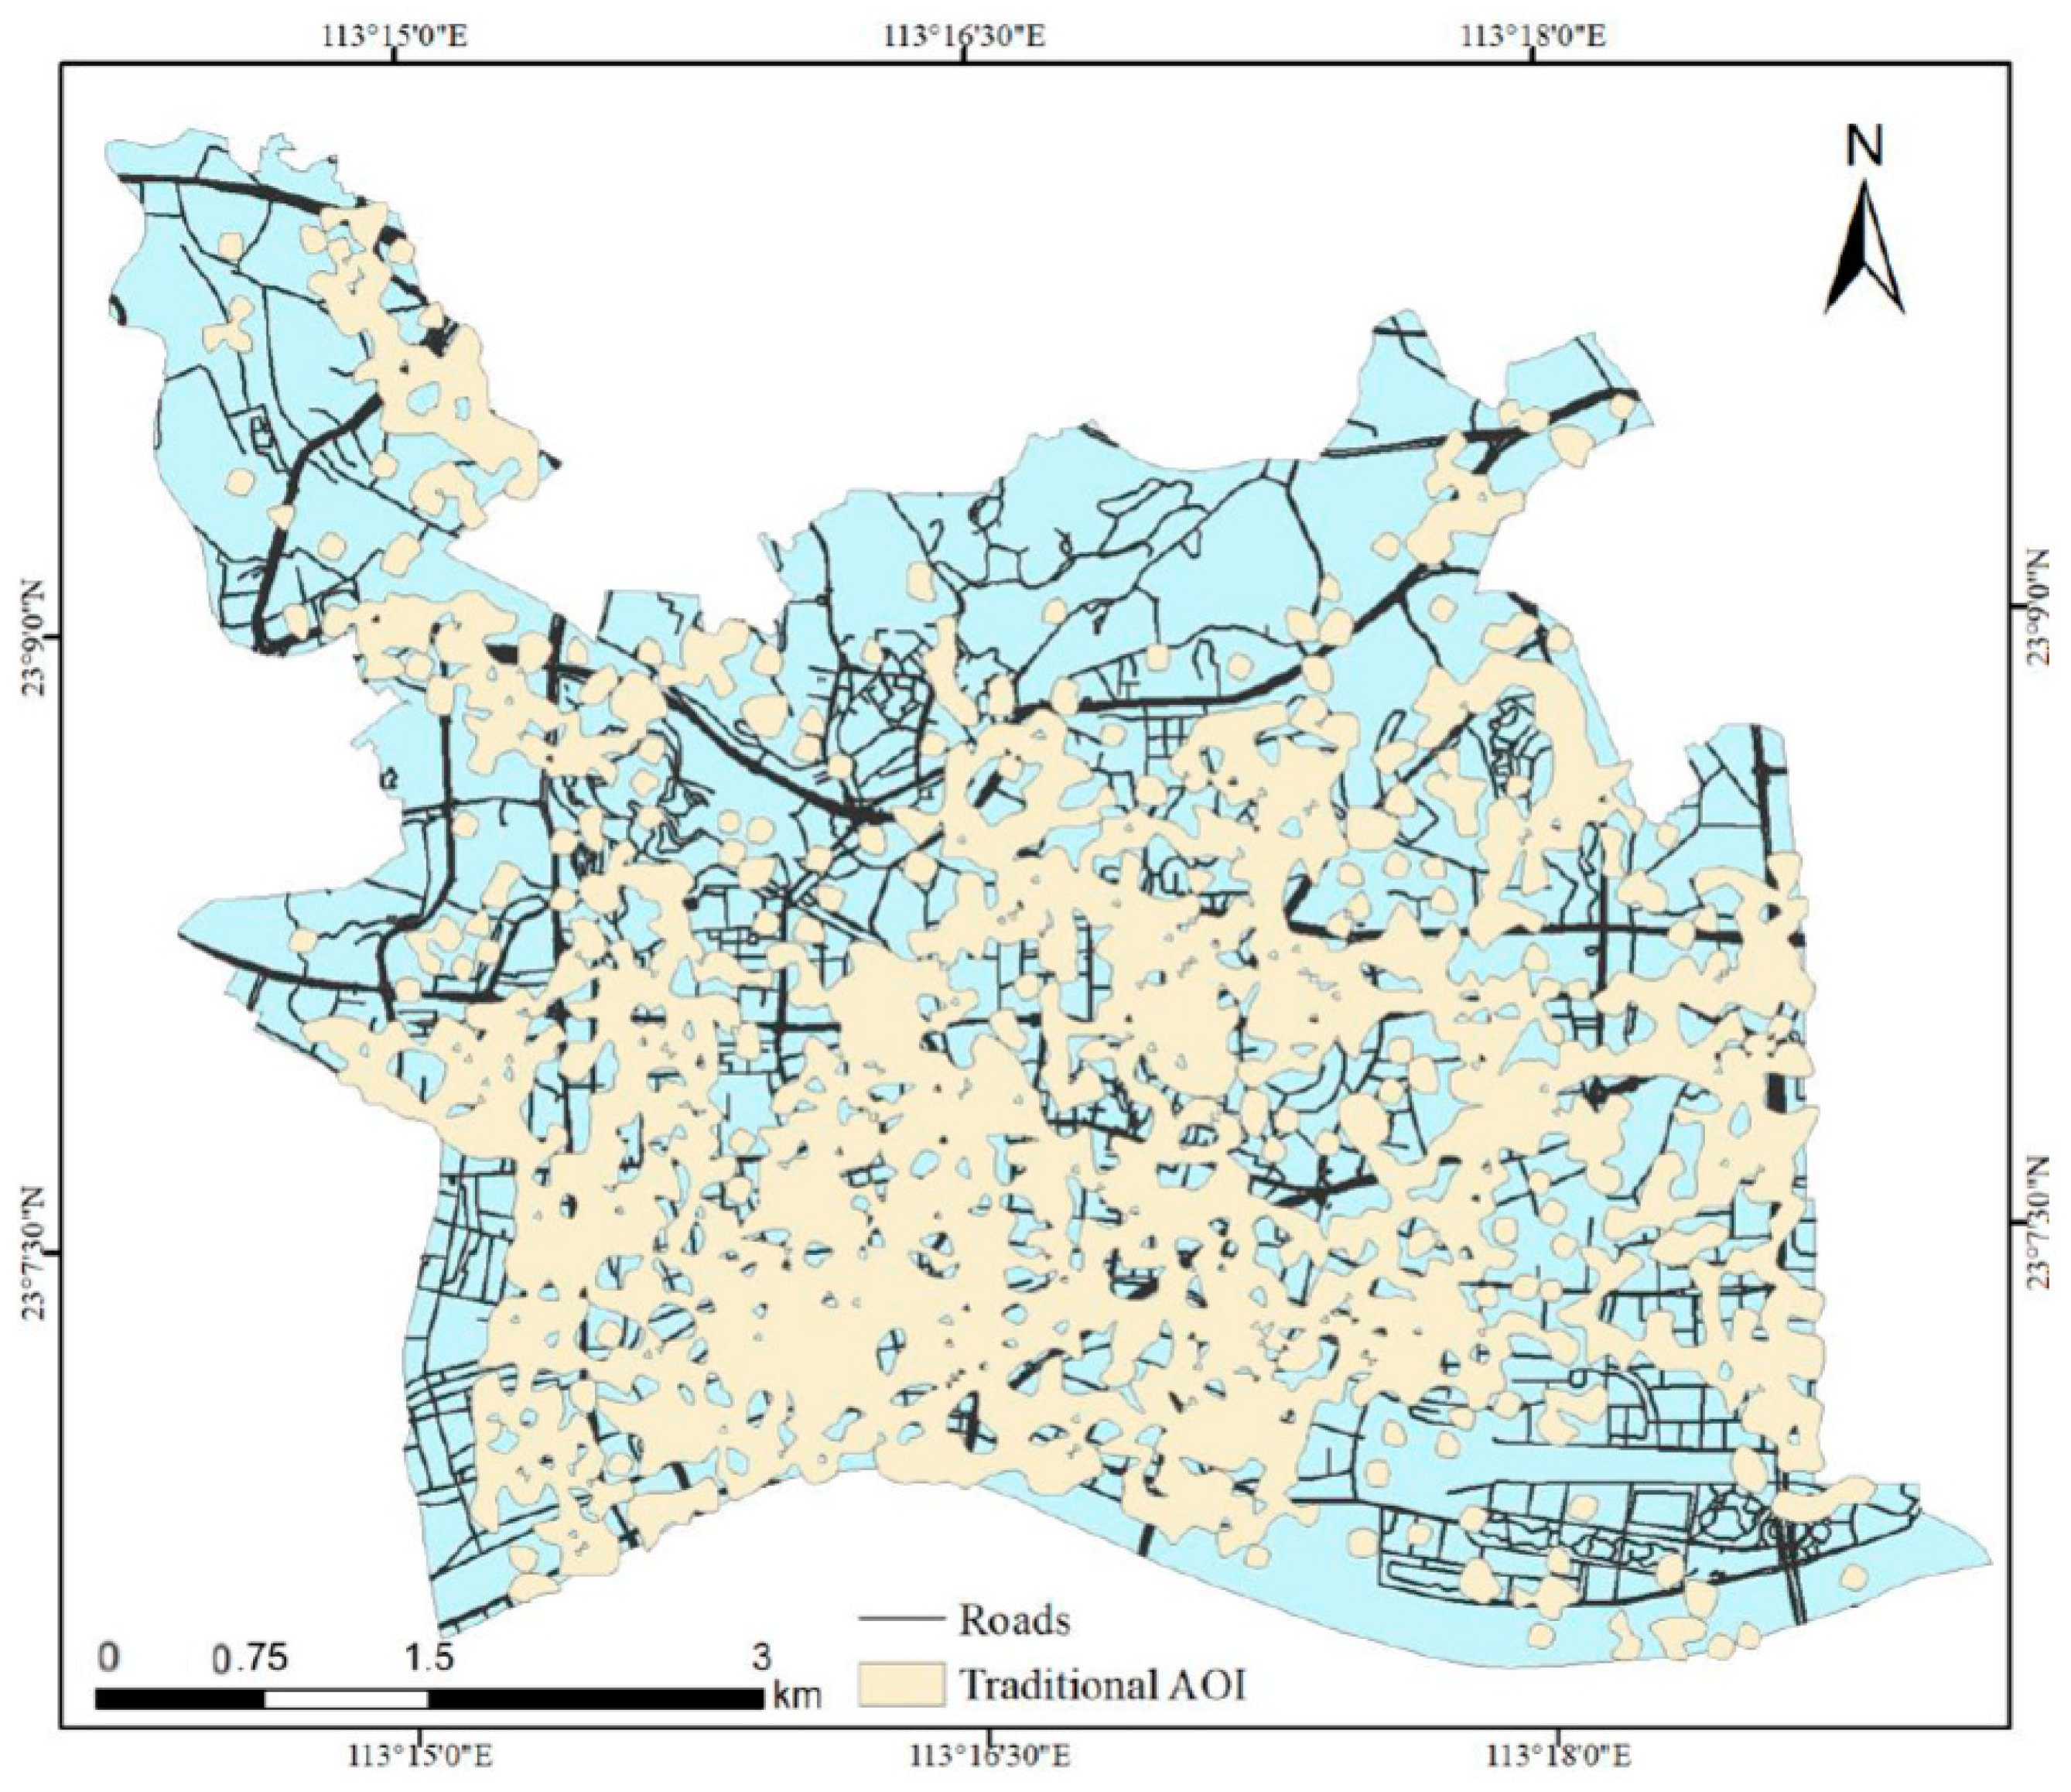
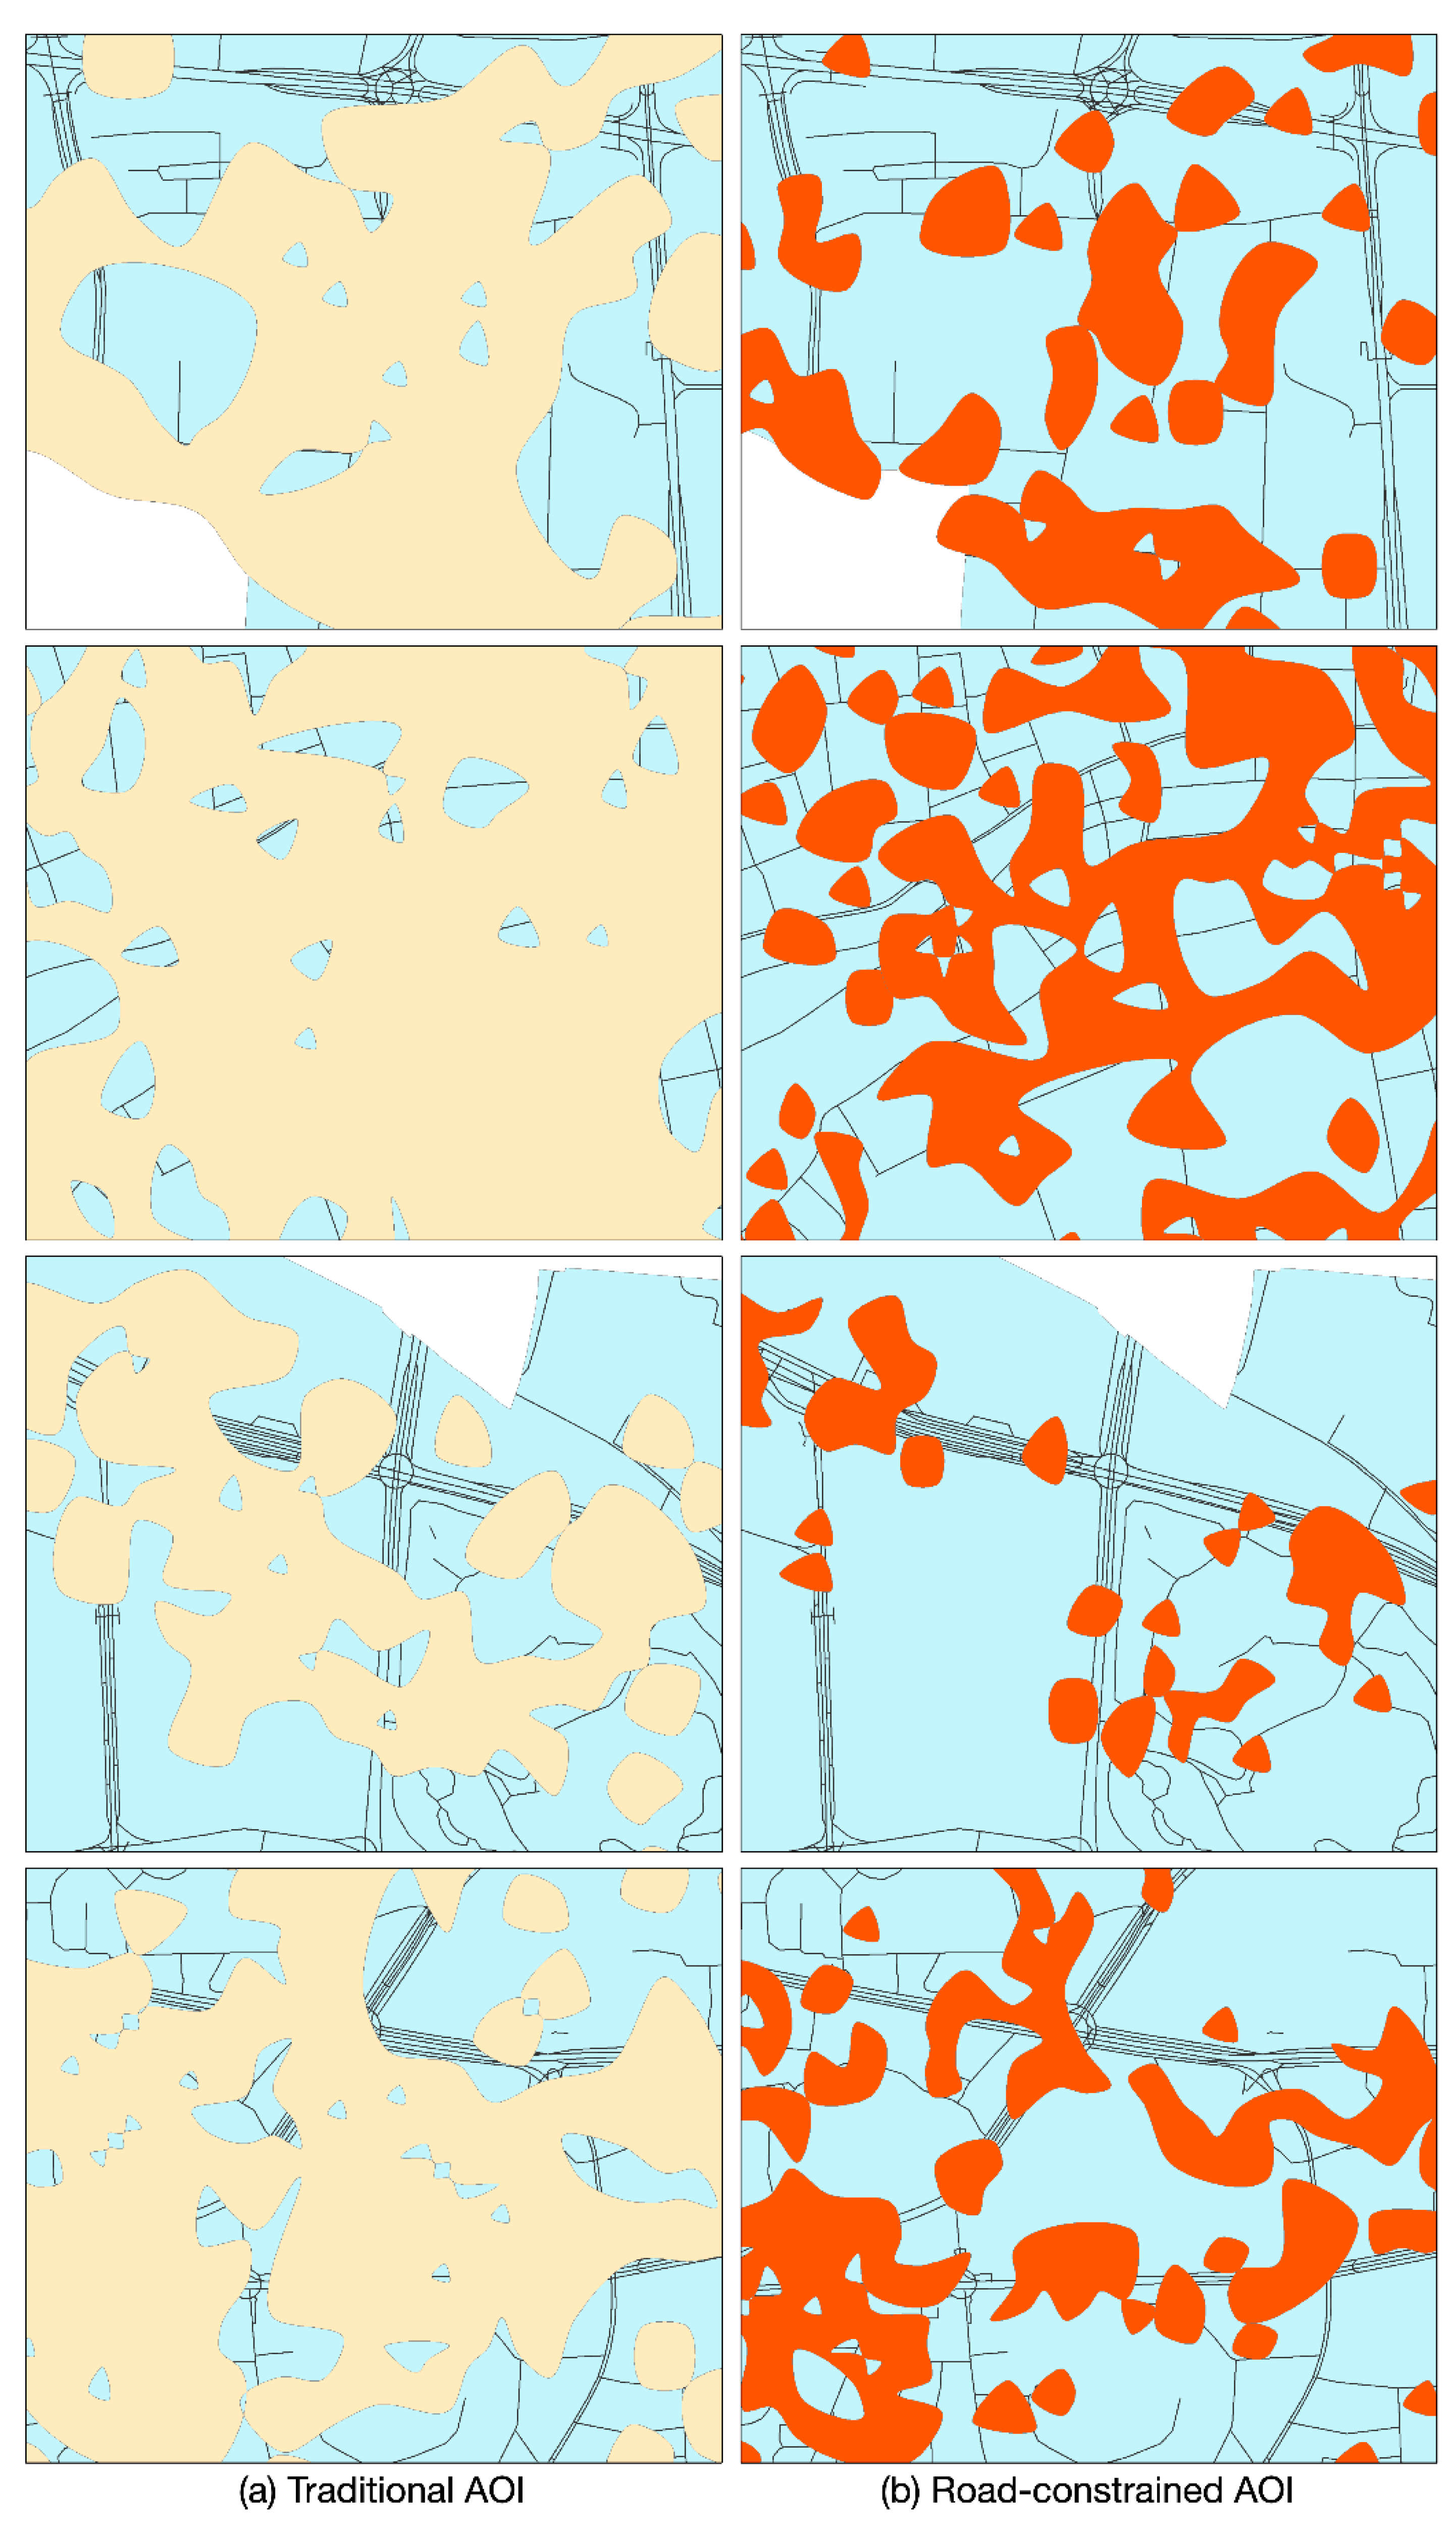
4.2. Comparison of Traditional and Road-Constrained AOIs

To validate the effectiveness of the generated road-constrained AOIs, we generate the traditional AOIs according to KDE. According to the research proposed by Meng et al. [36], we set the bandwidth at 30 meters. Figure 5 displays the spatial distribution of traditional AOIs. The AOIs are basically generated based on the density and distribution of review data, and the urban structures reflected by road networks. To further compare the spatial differences among traditional AOIs and road-constrained AOIs, Figure 6 displays partial areas. From a visual inspection, one can see that traditional AOIs cover the whole regions across different urban parcels that are delineated by roads. Instead, when considering the spatial distribution of road networks, the road-constrained AOIs exhibit a finer scale and more accurate areas from which to potentially gather human activities. In addition, conceptualizing road-constrained AOIs highlights the efficiency of utilizing every part of each road, and further reveals the hot spots that citizens visit. Accordingly, delineating the accurate spatial distribution of road-constrained AOIs can potentially support urban planning.

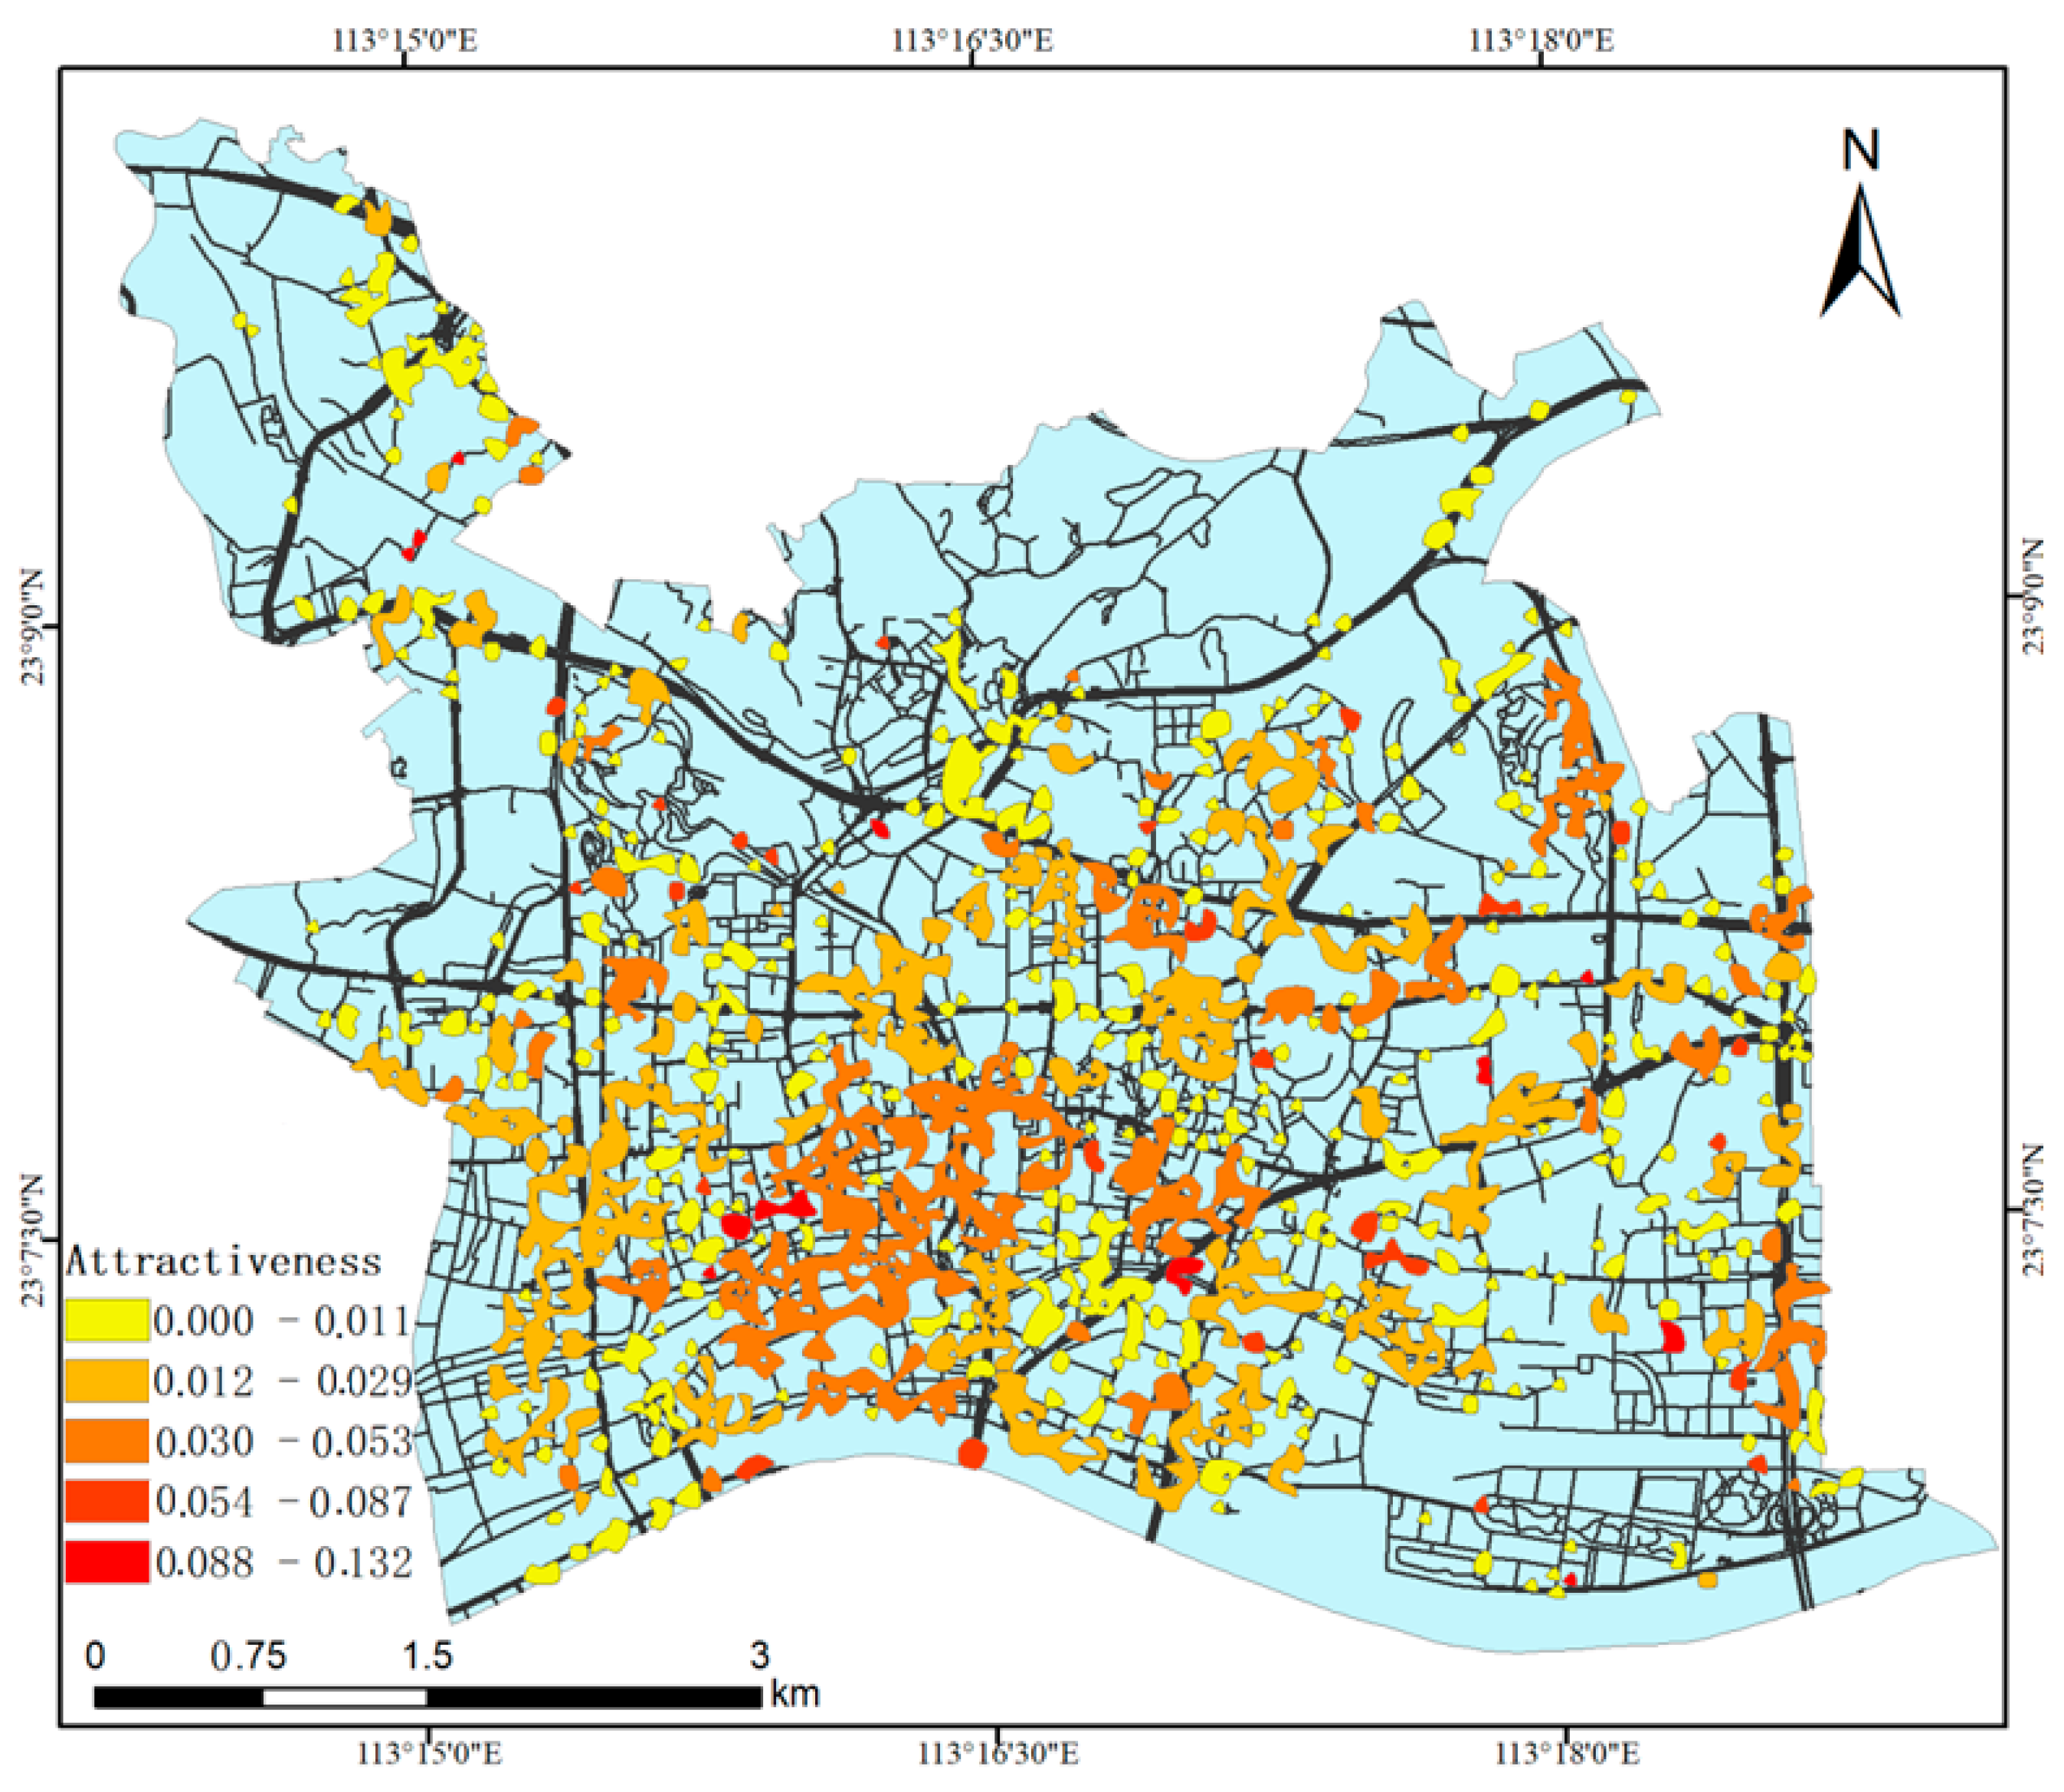
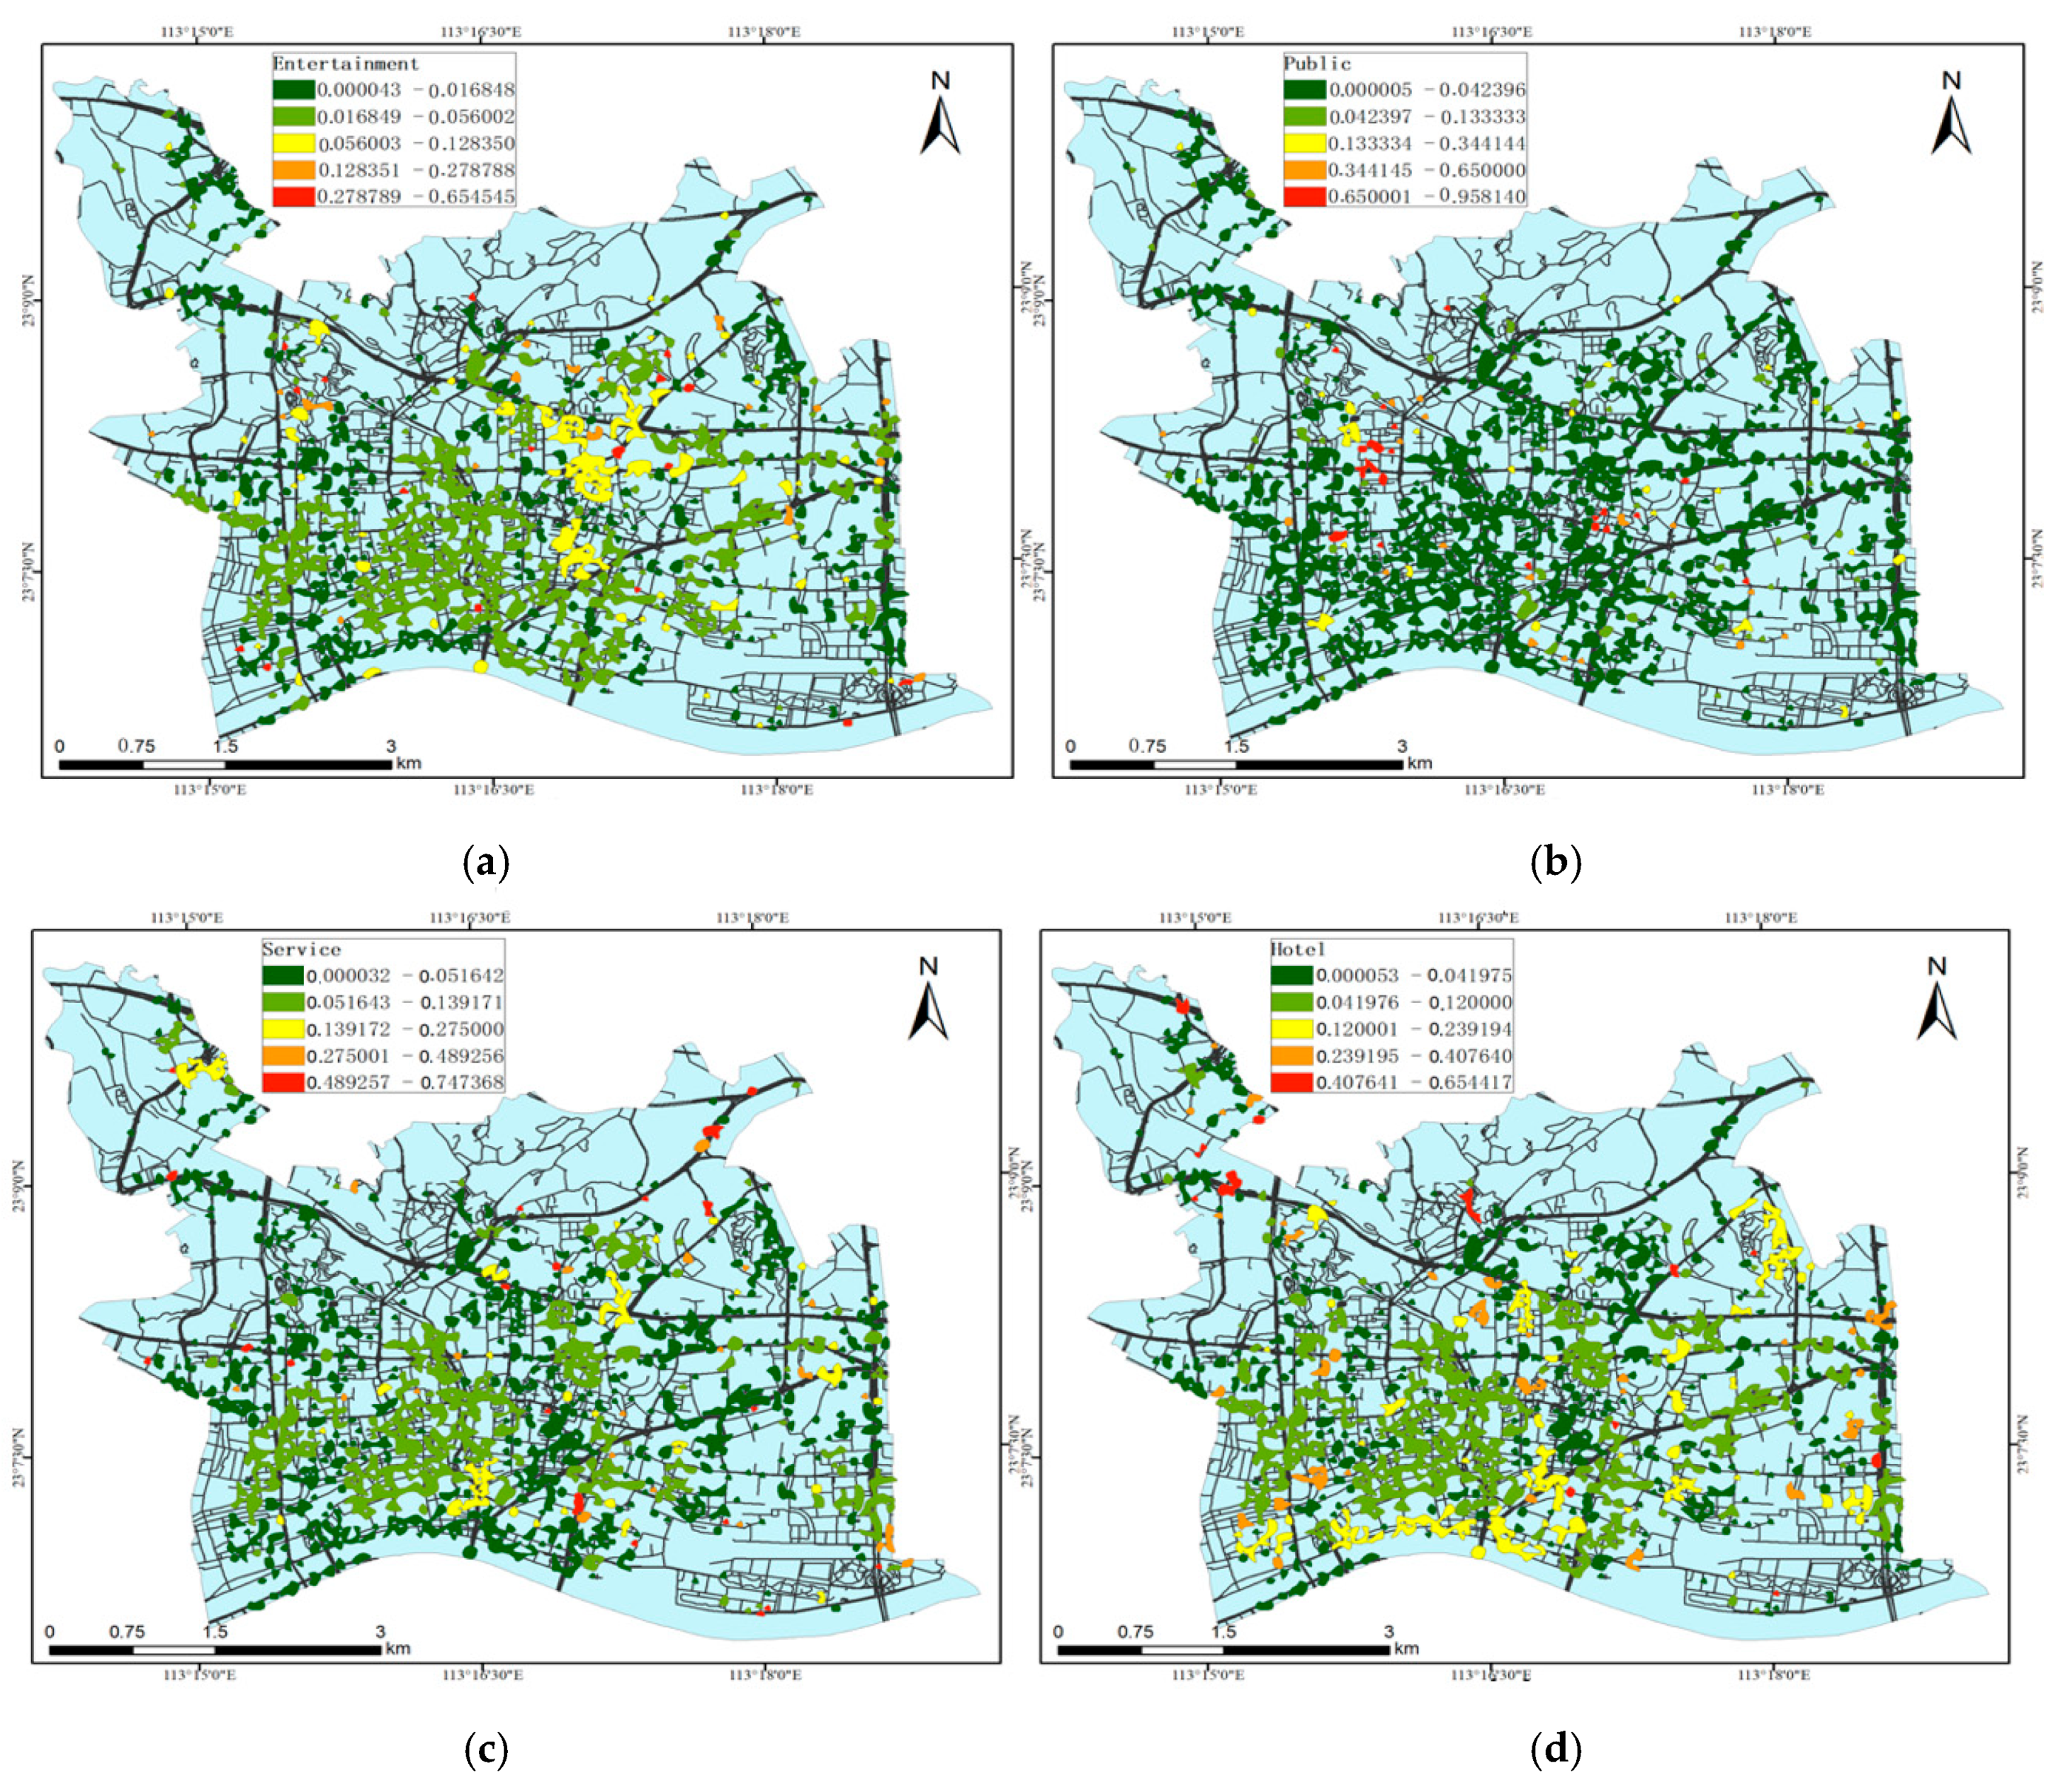
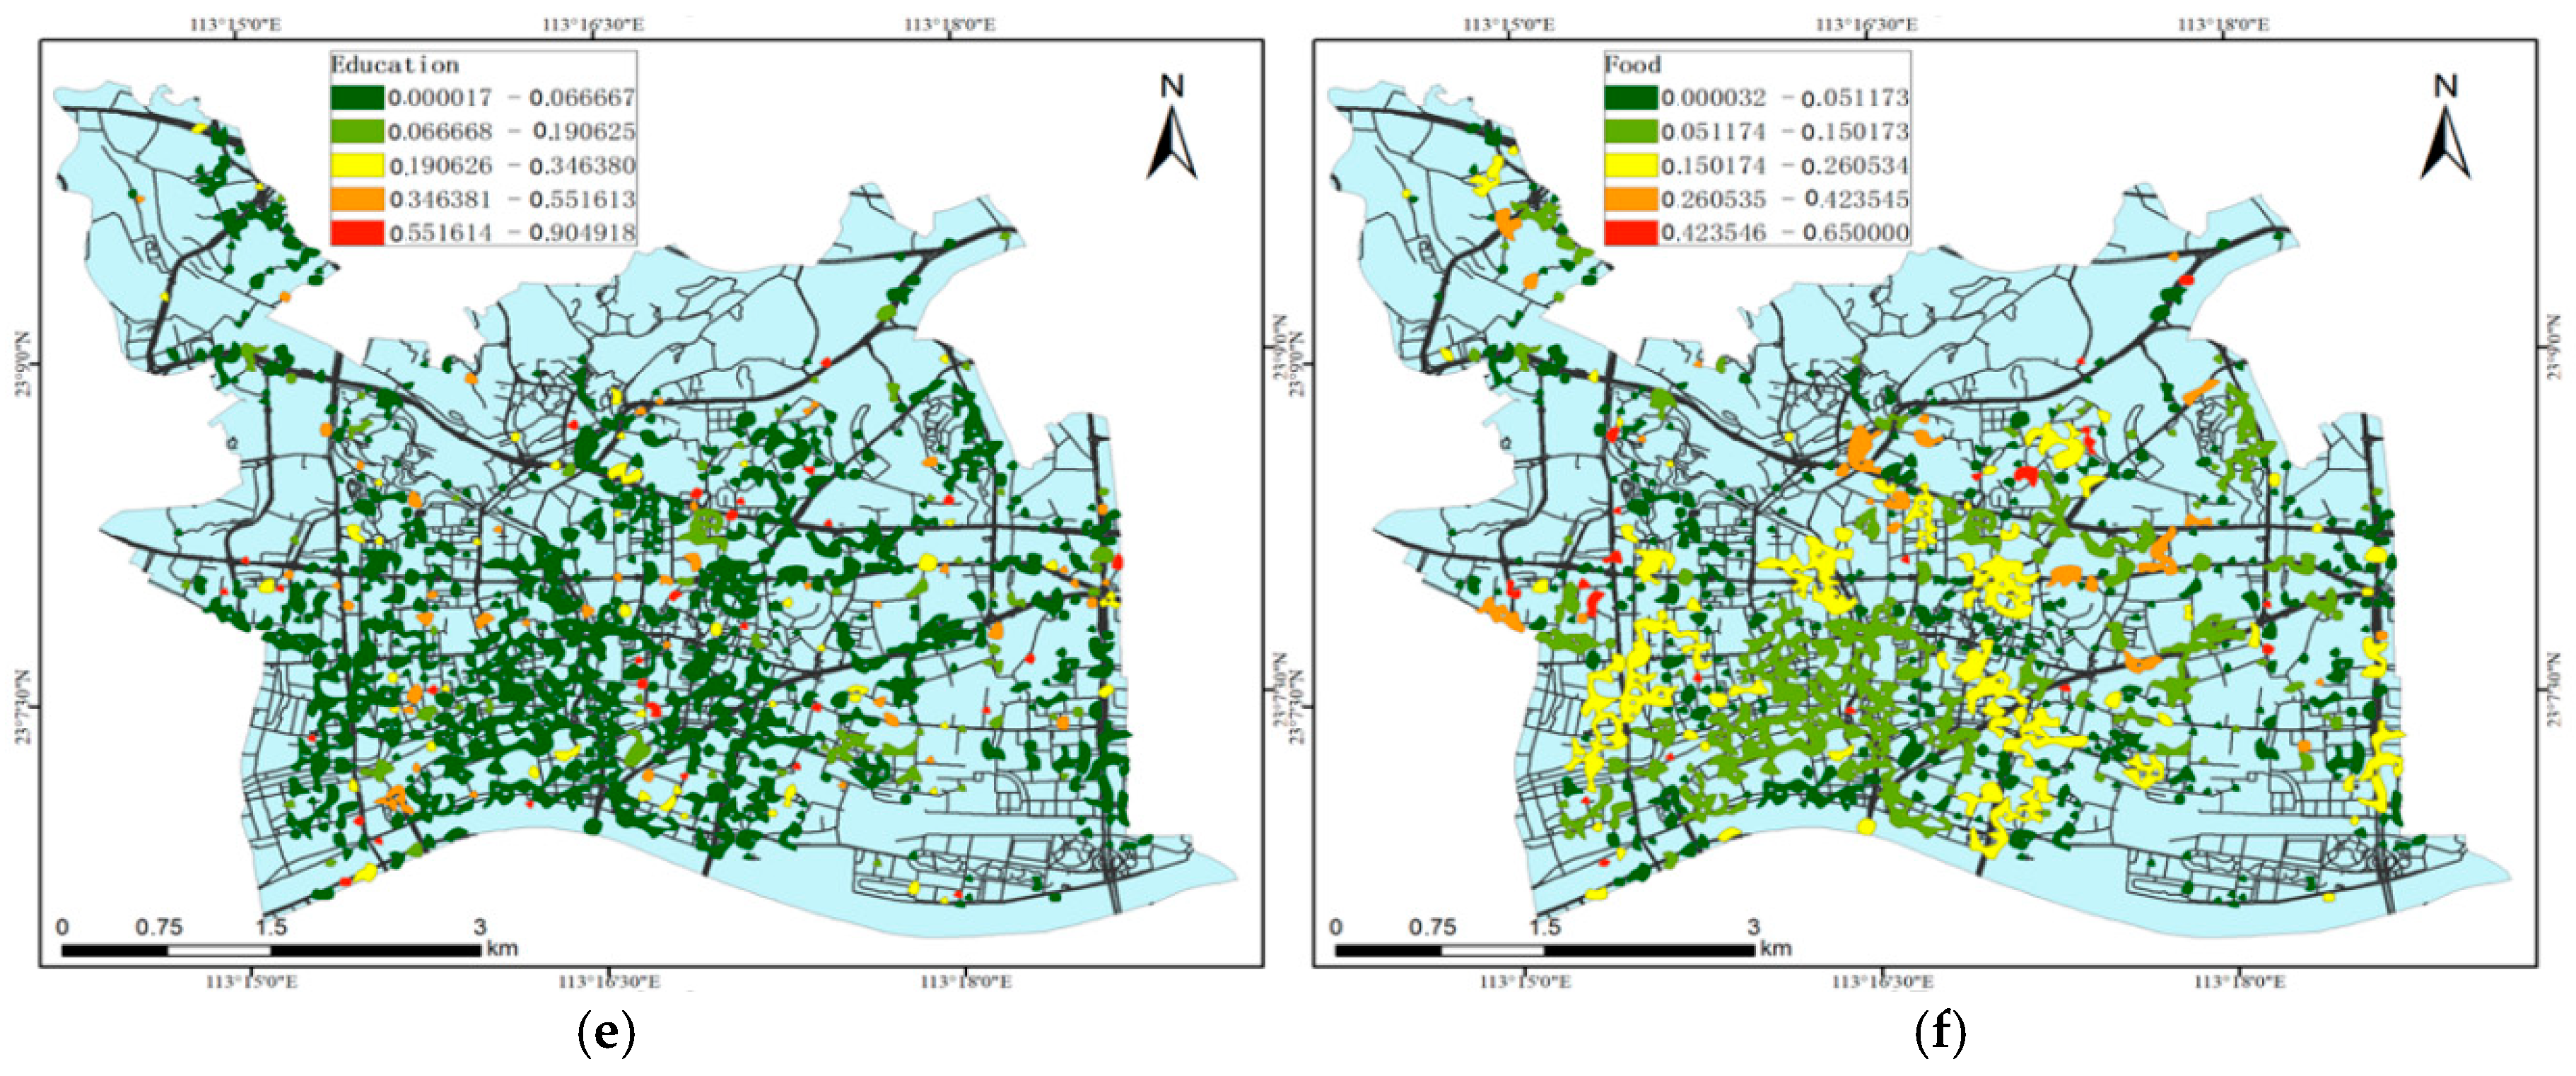
4.3. Semantic Attractiveness of Road-Constrained AOIs

AOIs are generated by human activities; thus, they display attractiveness to citizens and can reflect various urban functions. The number of review data is considered as the key indicator to measure AOI attractiveness, which is displayed in Figure 7. The AOIs filled in red represent high values of attractiveness, while the AOI indicated in yellow contain lower attractiveness values. In particular, more attractive AOIs are located in the central part of Yuexiu District.
Apart from the attractiveness of AOIs, we also investigated the semantic information related to urban functions. By building the LDA model, we constructed semantic topics for indicating certain urban functions. In particular, the number of topics K is determined with human judgement [37], with K ranging from 10 topics to 100 topics. As each topic is supposed to indicate a certain urban function, the number of topics K is determined based on the following rules: (1) Words with higher probability values in each topic should represent independent urban functions; (2) Topics should not share the same words with higher probability values; (3) Different topics are not considered to indicate the same urban function; and (4) Not all topics are representative of certain urban functions.
On this basis, the topic number K = 10 is chosen for extracting semantic topics from the review data. Generally, the topic selection is based on the semantic information provided by the words with high probabilities. On this basis, we selected those topics containing words with high probabilities that present similar urban functions. On the other hand, we removed other topics containing high-probability words that represent different urban functions from this study. Accordingly, we selected six topics are selected to correspond to different urban functions. As shown in Table 1, we selected words with higher probability values to constitute each topic. As a result, topics 1–6 are related to entertainment, public, service, hotel, education, and food functions.
As all six topics are involved in each road-constrained AOI with certain probabilities, Figure 8 displays the probability distribution of AOIs for indicating different functions. In particular, Figure 8a–f refer to entertainment, public, service, hotel, education, and food functions, respectively. The entertainment function shows greater probability of cluster distribution in the central Yuexiu District, and is indicated in red and yellow colors. The public function is only sparsely located in the western area. Service and hotel functions both display lower probabilities in the western area, while higher probabilities of a hotel function are indicated in the southern and eastern areas. Moreover, only several road-constrained AOIs that are distributed across the area reflect the education function. On the contrary, most of the road-constrained AOIs have a food function. It is consistent with the urban planning that the commercial areas contain not only restaurants, but also AOIs that have residential, entertainment, and other functions.

5. Emerging Issues

This study investigates AOIs in cities from the physical and socioeconomic perspectives. Current studies’ analysis of physical features concentrates on the urban structures, landscapes, and environments of cities [38,39], while the socioeconomic characteristics of the cities usually consist of urban functions, income, consumption, etc. [25,40]. To meet this goal, this research explores both the physical and socioeconomic characteristics of AOIs. In particular, it investigates the influences of road networks—reflecting urban structures—on the shaping of AOIs. Moreover, urban functions that attract citizens are identified from the semantic information.
Road-constrained AOIs focus on the spatial distribution of road networks and the corresponding urban structures. Under the assumption that traffic conditions on the roads are one of the key points that represent human activities and their accessibilities [41], road-constrained AOIs integrate both urban structures and human activities, and further reveal the influences of the urban morphology and individual behaviors that shape the attractive places.
Urban functions that represent socioeconomic properties are considered to distinguish various uses of road-constrained AOIs. In this study, functions are identified using semantic information generated by citizens. Thus, the semantic distribution in Figure 8 sheds light on the impact of urban functions that serve citizens on road-constrained AOI, and further guides future urban land-use policy proposals.
The proposed road-constrained AOIs and their semantic attractiveness can be applied in various fields. First, this study can be applied in measurements of AOI-centered urbanization. Our research exemplifies an AOI-centered perspective, characterizing the physical and social consequences of rapid urbanization. These road-constrained AOIs capture the potential human activities along the road networks, which help provide effective suggestions for organizing urban land use and monitoring traffic flows. Second, the results of this study could inform urban designing and planning with the intention of organizing urban functions in a highly efficient manner. By analyzing the semantic attractiveness of each road-constrained AOI, each semantic topic can correspond to a certain urban function. On this basis, the attractiveness of different urban functions such as food, hotel, and entertainment to citizens can be analyzed. It provides effective guidance to predict individual preferences toward urban functions and further allocate public resources sufficiently.

6. Conclusions and Future Work

AOIs are not only constituted by human activities; they are also potentially influenced by road network-driven urban structures. In this study, we propose a systematic framework to investigate road-constrained AOIs and quantify the semantic attractiveness using review data. For extracting road-constrained AOI, an Epanechnikov-based KDE is utilized based on a bandwidth selection strategy. For measuring the semantic attractiveness within each AOI, this paper considered the textual information and the number of review data to establish both an attractive index and a semantic index. We applied this framework to the study area of Yuexiu, Guangzhou. Using the review data from Dianping, we delineated the spatial distribution of road-constrained AOIs, and further compared it with traditional AOIs. On this basis, we quantified the attractiveness of each road-constrained AOI, and identified six urban functions, including entertainment, public, service, hotel, education, and food functions.
This research can also be extended in future work. First, as most of the review data were generated from young people, solely applying review data in AOI detection may lead to biases. Thus, based on the proposed framework, multi-sourced big geo-data can be integrated to better understand AOI with semantic attractiveness in future works. For example, cell phone data and bus records representing various ages of people have the potential to be utilized. Specifically, those data can be integrated with review data through extracting functions-related spatiotemporal characteristics. Second, apart from the semantic attractiveness that is proposed in this study, there are other factors that influence AOI attractiveness significantly, such as the quality of the services. By proposing spatial analysis using GIS tools, road-constrained AOIs and their attractiveness can be extended deeply in future studies. Third, road networks contain several classes, including the main road, secondary road, etc. Investigating the effects of different road classes on forming AOIs is crucial in future studies. In addition, urban structures are not only constituted by road networks, but also influenced by the distribution of buildings and other facilities. Therefore, the proposed approach can be improved by involving other urban structures to analyze AOIs from different perspectives.

Author Contributions

H.M. implemented the method, performed the major part of the experiments, and drafted the manuscript. Y.M. made substantial contributions to the conceptual design and methodological development. H.X. and C.L. developed the framework and wrote the manuscript.

Funding

This research was funded by the Major Program of the National Social Science Foundation of China, grant number 16ZDA041, 15ZDB122 and the National Natural Science Foundation of China, grant number 41971406, 41501420.

Acknowledgments

We acknowledge the help provided by Youde Wu.

Conflicts of Interest

The authors declare no conflict of interest.

References

  1. Hu, Y.; Gao, S.; Janowicz, K.; Yu, B.; Li, W.; Prasad, S. Extracting and understanding urban areas of interest using geotagged photos. Comput. Environ. Urban Syst. 2015, 54, 240–254. [Google Scholar] [CrossRef]
  2. Gao, S.; Janowicz, K.; Couclelis, H. Extracting urban functional regions from points of interest and human activities on location-based social networks. Trans. Gis 2017, 21, 446–467. [Google Scholar] [CrossRef]
  3. Gong, Y.; Lin, Y.; Duan, Z. Exploring the spatiotemporal structure of dynamic urban space using metro smart card records. Comput. Environ. Urban Syst. 2017, 64, 169–183. [Google Scholar] [CrossRef]
  4. Liu, X.; He, J.; Yao, Y.; Zhang, J.; Liang, H.; Wang, H.; Hong, Y. Classifying urban land use by integrating remote sensing and social media data. Int. J. Geogr. Inf. Sci. 2017, 31, 1–22. [Google Scholar] [CrossRef]
  5. Guo, Q.; Karimi, H.A. A novel methodology for prediction of spatial-temporal activities using latent features. Comput. Environ. Urban Syst. 2017, 62, 74–85. [Google Scholar] [CrossRef]
  6. Zhang, X.; Du, S.; Wang, Q. Hierarchical semantic cognition for urban functional zones with VHR satellite images and POI data. Isprs J. Photogramm. Remote Sens. 2017, 132, 170–184. [Google Scholar] [CrossRef]
  7. Xing, H.; Meng, Y. Integrating landscape metrics and socioeconomic features for urban functional region classification. Comput. Environ. Urban Syst. 2018, 72, 134–145. [Google Scholar] [CrossRef]
  8. Liu, Y.; Liu, X.; Gao, S.; Gong, L.; Kang, C.; Zhi, Y.; Chi, G.; Shi, L. Social sensing: A new approach to understanding our socioeconomic environments. Ann. Assoc. Am. Geogr. 2015, 105, 512–530. [Google Scholar] [CrossRef]
  9. Zhu, D.; Wang, N.; Wu, L.; Liu, Y. Street as a big geo-data assembly and analysis unit in urban studies: A case study using Beijing taxi data. Appl. Geogr. 2017, 86, 152–164. [Google Scholar] [CrossRef]
  10. Xing, H.; Meng, Y.; Shi, Y. A dynamic human activity-driven model for mixed land use evaluation using social media data. Trans. Gis 2018, 22, 1130–1151. [Google Scholar] [CrossRef]
  11. Lloyd, A.; Cheshire, J. Deriving retail centre locations and catchments from geo-tagged Twitter data. Comput. Environ. Urban Syst. 2017, 61, 108–118. [Google Scholar] [CrossRef] [Green Version]
  12. Samany, N.N. Automatic landmark extraction from geo-tagged social media photos using deep neural network. Cities 2019, 93, 1–12. [Google Scholar] [CrossRef]
  13. Zhang, F.; Wu, L.; Zhu, D.; Liu, Y. Social sensing from street-level imagery: A case study in learning spatio-temporal urban mobility patterns. Isprs J. Photogramm. Remote Sens. 2019, 153, 48–58. [Google Scholar] [CrossRef]
  14. Spyrou, E.; Korakakis, M.; Charalampidis, V.; Psallas, A.; Mylonas, P. A Geo-Clustering Approach for the Detection of Areas-of-Interest and Their Underlying Semantics. Algorithms 2017, 10, 35. [Google Scholar] [CrossRef]
  15. Vanderhaegen, S.; Canters, F. Mapping urban form and function at city block level using spatial metrics. Landsc. Urban Plan. 2017, 167, 399–409. [Google Scholar] [CrossRef]
  16. Lynch, K. Good City Form; MIT Press: Cambridge, MA, USA, 1984. [Google Scholar]
  17. Long, Y.; Liu, L. How green are the streets? An analysis for central areas of Chinese cities using Tencent Street View. PLoS ONE 2017, 12, e0171110. [Google Scholar] [CrossRef]
  18. Shen, Y.; Karimi, K. Urban function connectivity: Characterisation of functional urban streets with social media check-in data. Cities 2016, 55, 9–21. [Google Scholar] [CrossRef] [Green Version]
  19. Yu, W.; Ai, T.; Shao, S. The analysis and delimitation of Central Business District using network kernel density estimation. J. Transp. Geogr. 2015, 45, 32–47. [Google Scholar] [CrossRef]
  20. Wang, T.; Wang, Y.; Zhao, X.; Fu, X. Spatial distribution pattern of the customer count and satisfaction of commercial facilities based on social network review data in Beijing, China. Comput. Environ. Urban Syst. 2018, 71, 88–97. [Google Scholar] [CrossRef]
  21. Popa, I.S.; Zeitouni, K.; Oria, V.; Kharrat, A. Spatio-temporal compression of trajectories in road networks. GeoInformatica 2015, 19, 117–145. [Google Scholar] [CrossRef]
  22. Brinkhoff, T. A framework for generating network-based moving objects. GeoInformatica 2002, 6, 153–180. [Google Scholar] [CrossRef]
  23. Tu, W.; Cao, J.; Yue, Y.; Shaw, S.-L.; Zhou, M.; Wang, Z.; Chang, X.; Xu, Y.; Li, Q. Coupling mobile phone and social media data: a new approach to understanding urban functions and diurnal patterns. Int. J. Geogr. Inf. Sci. 2017, 31, 1–28. [Google Scholar] [CrossRef]
  24. Wu, C.; Ye, X.; Ren, F.; Du, Q. Check-in behaviour and spatio-temporal vibrancy: An exploratory analysis in Shenzhen, China. Cities 2018, 77, 104–116. [Google Scholar] [CrossRef]
  25. Yuan, J.; Zheng, Y.; Xie, X. Discovering Regions of Different Functions in a City Using Human Mobility and POIs. In KDD ‘12, Proceedings of the 18th ACM SIGKDD International Conference on Knowledge Discovery and Data Mining, Beijing, China, 12–16 August 2012; ACM: New York, NY, USA, 2012; pp. 186–194. [Google Scholar]
  26. Lansley, G.; Longley, P.A. The geography of Twitter topics in London. Comput. Environ. Urban Syst. 2016, 58, 85–96. [Google Scholar] [CrossRef] [Green Version]
  27. Rosenblatt, M. Remarks on some nonparametric estimates of a density function. Ann. Math. Stat. 1956, 27, 832–837. [Google Scholar] [CrossRef]
  28. Schnebele, E. Improving remote sensing flood assessment using volunteered geographical data. Nat. Hazards Earth Syst. Sci. 2013, 13, 669. [Google Scholar] [CrossRef]
  29. Hart, T.; Zandbergen, P. Kernel density estimation and hotspot mapping: examining the influence of interpolation method, grid cell size, and bandwidth on crime forecasting. Polic. Int. J. Police Strateg. Manag. 2014, 37, 305–323. [Google Scholar] [CrossRef]
  30. Peng, J.; Zhao, S.; Liu, Y.; Tian, L. Identifying the urban-rural fringe using wavelet transform and kernel density estimation: A case study in Beijing City, China. Environ. Model. Softw. 2016, 83, 286–302. [Google Scholar] [CrossRef]
  31. Chu, C.-Y.; Henderson, D.J.; Parmeter, C.F. On discrete Epanechnikov kernel functions. Comput. Stat. Data Anal. 2017, 116, 79–105. [Google Scholar] [CrossRef]
  32. Blei, D.M.; Ng, A.Y.; Jordan, M.I. Latent dirichlet allocation. J. Mach. Learn. Res. 2003, 3, 993–1022. [Google Scholar]
  33. Griffiths, T.L.; Steyvers, M. Finding scientific topics. Proc. Natl. Acad. Sci. USA 2004, 101, 5228–5235. [Google Scholar] [CrossRef] [Green Version]
  34. Openshaw, S.; Taylor, P.J. A Million or So Correlated Coefficients: Three experiments on the Modifiable Areal Unit Problem. In Statistical Applications in the Spatial Sciences; Wrigley, N., Ed.; Pion: London, UK, 1979; pp. 127–144. [Google Scholar]
  35. Openshaw, S. The Modifiable Areal Unit Problem. Concepts and Techniques in Modern Geography No. 38; Geo Books: Norwich, UK, 1984. [Google Scholar]
  36. Meng, Y.; Hou, D.; Xing, H. Rapid Detection of Land Cover Changes Using Crowdsourced Geographic Information: A Case Study of Beijing, China. Sustainability 2017, 9, 1547. [Google Scholar] [CrossRef]
  37. Ríos, S.A.; Muñoz, R. Land Use detection with cell phone data using topic models: Case Santiago, Chile. Comput. Environ. Urban Syst. 2017, 61, 39–48. [Google Scholar] [CrossRef]
  38. Jia, Y.; Tang, L.; Xu, M.; Yang, X. Landscape pattern indices for evaluating urban spatial morphology–A case study of Chinese cities. Ecol. Indic. 2019, 99, 27–37. [Google Scholar] [CrossRef]
  39. Meng, Y.; Xing, H. Exploring the relationship between landscape characteristics and urban vibrancy: A case study using morphology and review data. Cities 2019, 95, 102389. [Google Scholar] [CrossRef]
  40. Noble, M.; Barnes, H.; Wright, G.; Roberts, B. Small area indices of multiple deprivation in South Africa. Soc. Indic. Res. 2010, 95, 281. [Google Scholar] [CrossRef]
  41. Huang, W.; Xu, S.; Yan, Y.; Zipf, A. An exploration of the interaction between urban human activities and daily traffic conditions: A case study of Toronto, Canada. Cities 2019, 84, 8–22. [Google Scholar] [CrossRef]
Figure 1. The overall framework.
Sustainability 11 04624 g001
Figure 2. An illustration of extracting road-constrained areas of interest (AOIs). (a) Traditional AOI; (b) Road-constrained AOIs.
Sustainability 11 04624 g002
Figure 3. Study area and data sources.
Sustainability 11 04624 g003
Figure 4. The spatial distribution of road-constrained AOIs. (a) The original road-constrained AOIs; (b) Smoothed road-constrained AOIs.
Sustainability 11 04624 g004
Figure 5. The spatial distribution of traditional AOIs.
Sustainability 11 04624 g005
Figure 6. Comparison of traditional and road-constrained AOIs. (a) Traditional AOIs; (b) Road-constrained AOIs.
Sustainability 11 04624 g006
Figure 7. Attractiveness distribution of road-constrained AOIs.
Sustainability 11 04624 g007
Figure 8. Semantic distribution of road-constrained AOIs. (a) Entertainment function; (b) Public function; (c) Service function; (d) Hotel function; (e) Education function; and (f) Food function.
Sustainability 11 04624 g008aSustainability 11 04624 g008b
Table 1. Semantic topics for indicating urban functions from review data. Words that constitute each topic are translated from Chinese characters.
Topic 1Topic 2Topic 3Topic 4Topic 5Topic 6
SingParkServiceRoomSchoolTaste
KTV(Karaoke)HistoryTechnicalLiveTeacherFood
PartyTicketSatisfiedConditionStudentsDelicious
DecorationLanternEnvironmentHotelNearbyPrice
ReviewSculptureExperienceReceptionistSubwayWaiter
BeverageVisitCar washingHot waterHigh schoolFresh
SoundMuseumPatientRestroomLearningMenu
………………………………
EntertainmentPublicServiceHotelEducationFood

