1. Introduction
Cities are responsible for 70% of global CO
2 emissions [
1] and building structures for consumption of 35% of total energy world-wide and 40% of CO
2 polluting emissions [
2]. The scientific international community, in recent decades, has become aware of the serious consequences generated by the excessive consumption of environmental resources and the effects produced by this exploitation. International governments, to counter this phenomenon, have encouraged policies based mainly on environmental sustainability, especially in the construction sector [
3].
These policies try to direct the building sector towards the use of both new environmentally friendly materials with high energy efficiency, construction techniques and systems such as to passively reduce the energy needs of the building structure, maintaining indoor comfort for the occupants. Some rating systems have been created to assess and to improve the sustainability level of building structures [
4].
Important research topics have led to the development of methods and tools for assessing the building sustainability levels such as: BREEAM, LEED, CASBEE, SBTools from which further specifically designed methods have been defined to meet local needs [
5,
6,
7].
These methods should embrace all the main aspects of sustainability but they often consider only the assessment of environmental aspects [
8].
The rating methods developed in the past were mainly focused on residential structures, and only in the last decade they have been defined (
Table 1) for schools [
9], retail and industrial buildings [
10,
11] but not for food processing buildings yet.
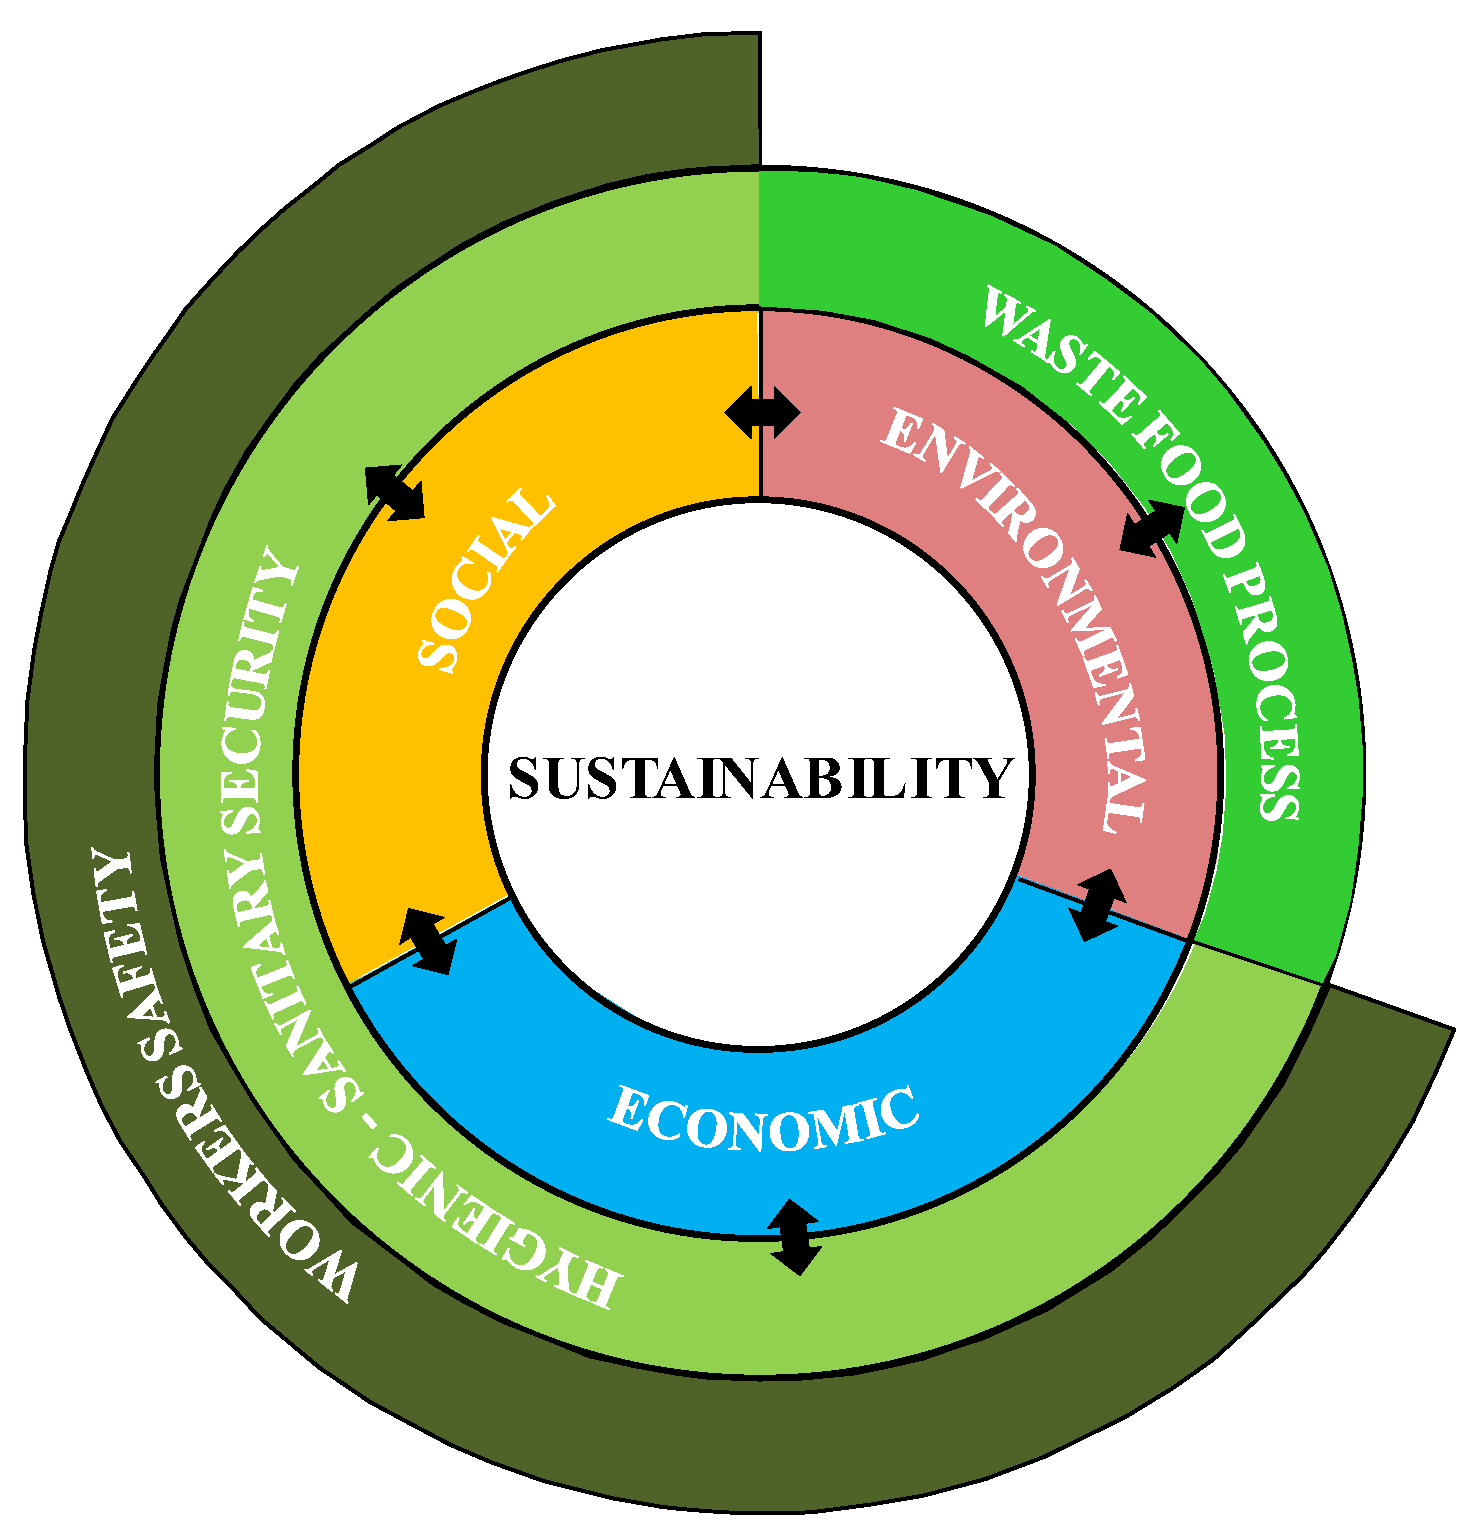
For these building types, in addition to the environment, it is essential to safeguard human health. Therefore, in addition to the environmental and economic components of sustainability, it is very important to consider those related to health, safety and hygiene of the workers and of the consumer without neglect the waste of food process (
Figure 1).
In food processing buildings, not only is comfort and safety of the workers and employees essential, but maintaining indoor conditions of hygienic-sanitary safety in order to avoid the proliferation of pathogenic micro-organisms in the indoor environment is also important [
12,
13]. Nevertheless, food building construction techniques, which are widely spread, do not consider the principles of sustainability, which should be the basis of a healthy environmental, economic and social development [
14,
15]. Sustainability in food processing must not only meet environmental requirements but also hygienic ones as the foods come into contact with substances that are often only removable with difficulty, even when applying strict sanitation protocols [
16,
17].
Therefore, it is worthwhile to define a method for assessing building sustainability in the food industry, because in this sector, the processing of the product assumes a fundamental role that often clashes with the needs of workers [
18,
19]. In particular, when the processing of the food production has to respect a quality protocol to guarantee a genuine taste, this process must also be healthy and hygienically safe.
This study aims to develop a version of the ITACA protocol, an Italian framework for rating the sustainable performance of buildings and projects, for assessing food building sustainability.
2. Materials
The ITACA protocol, based on the international SBTool certification procedure, is a multi-criteria method adopted by the Italian regions to assess the level of environmental sustainability and energy performance of buildings. These assessments are aimed to encourage the use of building and plant engineering techniques to improve environmental performance according to building standards established by law, not only in new buildings but also in those subject to refurbishment [
20,
21].
This protocol presents a tree structure divided into three hierarchical levels: Evaluation areas (EAs), categories (CA) and criteria (CR). The EAs indicate the main objectives and strategies such as: Site quality, resource consumption, environmental loads and quality of service. There are a total of 19 CAs, but their number varies according to the type of structure (residential, schools, offices, shopping centers, stores, shops, etc.). There are 36 CRs which are used to evaluate the performance of the building through the use of qualitative and quantitative indicators [
22], each of which is evaluated according to a score relative to a performance scale between −1 and 5 where 0 is the benchmark conventional practice. Score 5 is for the use of good practices or the use of innovative sustainable materials and procedures and score −1 is assigned when the evaluation level is lower than the benchmark value.
The score for CA i is given by the sum of the weighted scores of each CR belonging to the CA i, in fact each CR is given a weight that represents the impact on the environment.
The score of the CAs is also weighed to determine the score of the (EAs) that are in turn weighed to determine the final value of the entire building structure.
The method proposed in this paper, which is based on the ITACA protocol for residential buildings adopted by the Calabria Region, uses a new set of CRs useful for assessing the level of building sustainability for the food processing industry. This method has very different characteristics from those of residential sectors as regards to energy sustainability and well-being of the workers. Even the food quality must be carefully considered, which often requires specific production protocols. Furthermore, the maintenance of health conditions is much more restrictive than those for residential buildings and it is necessary to reduce the risk of proliferation of pathogenic microorganisms that can generate zoonoses. The table below shows the hierarchical levels in which the proposed method and the new CRs are divided.
3. Methods
The method proposed in this paper, is a specific version of the ITACA protocol; currently it is adopted in Italy only for residential, commercial and government buildings. The method was developed to assess the sustainability level of food buildings that present specific characteristics different than those of the other buildings.
In the proposed method, and in addition to the 36 CRs (
Table 2) of the ITACA protocol, another 14 specific CRs have been added to make it more flexible to the different production needs.
The additional CRS were selected by a group of 10 experts in the agri-food sector including university researchers, economic operators and environmental experts.
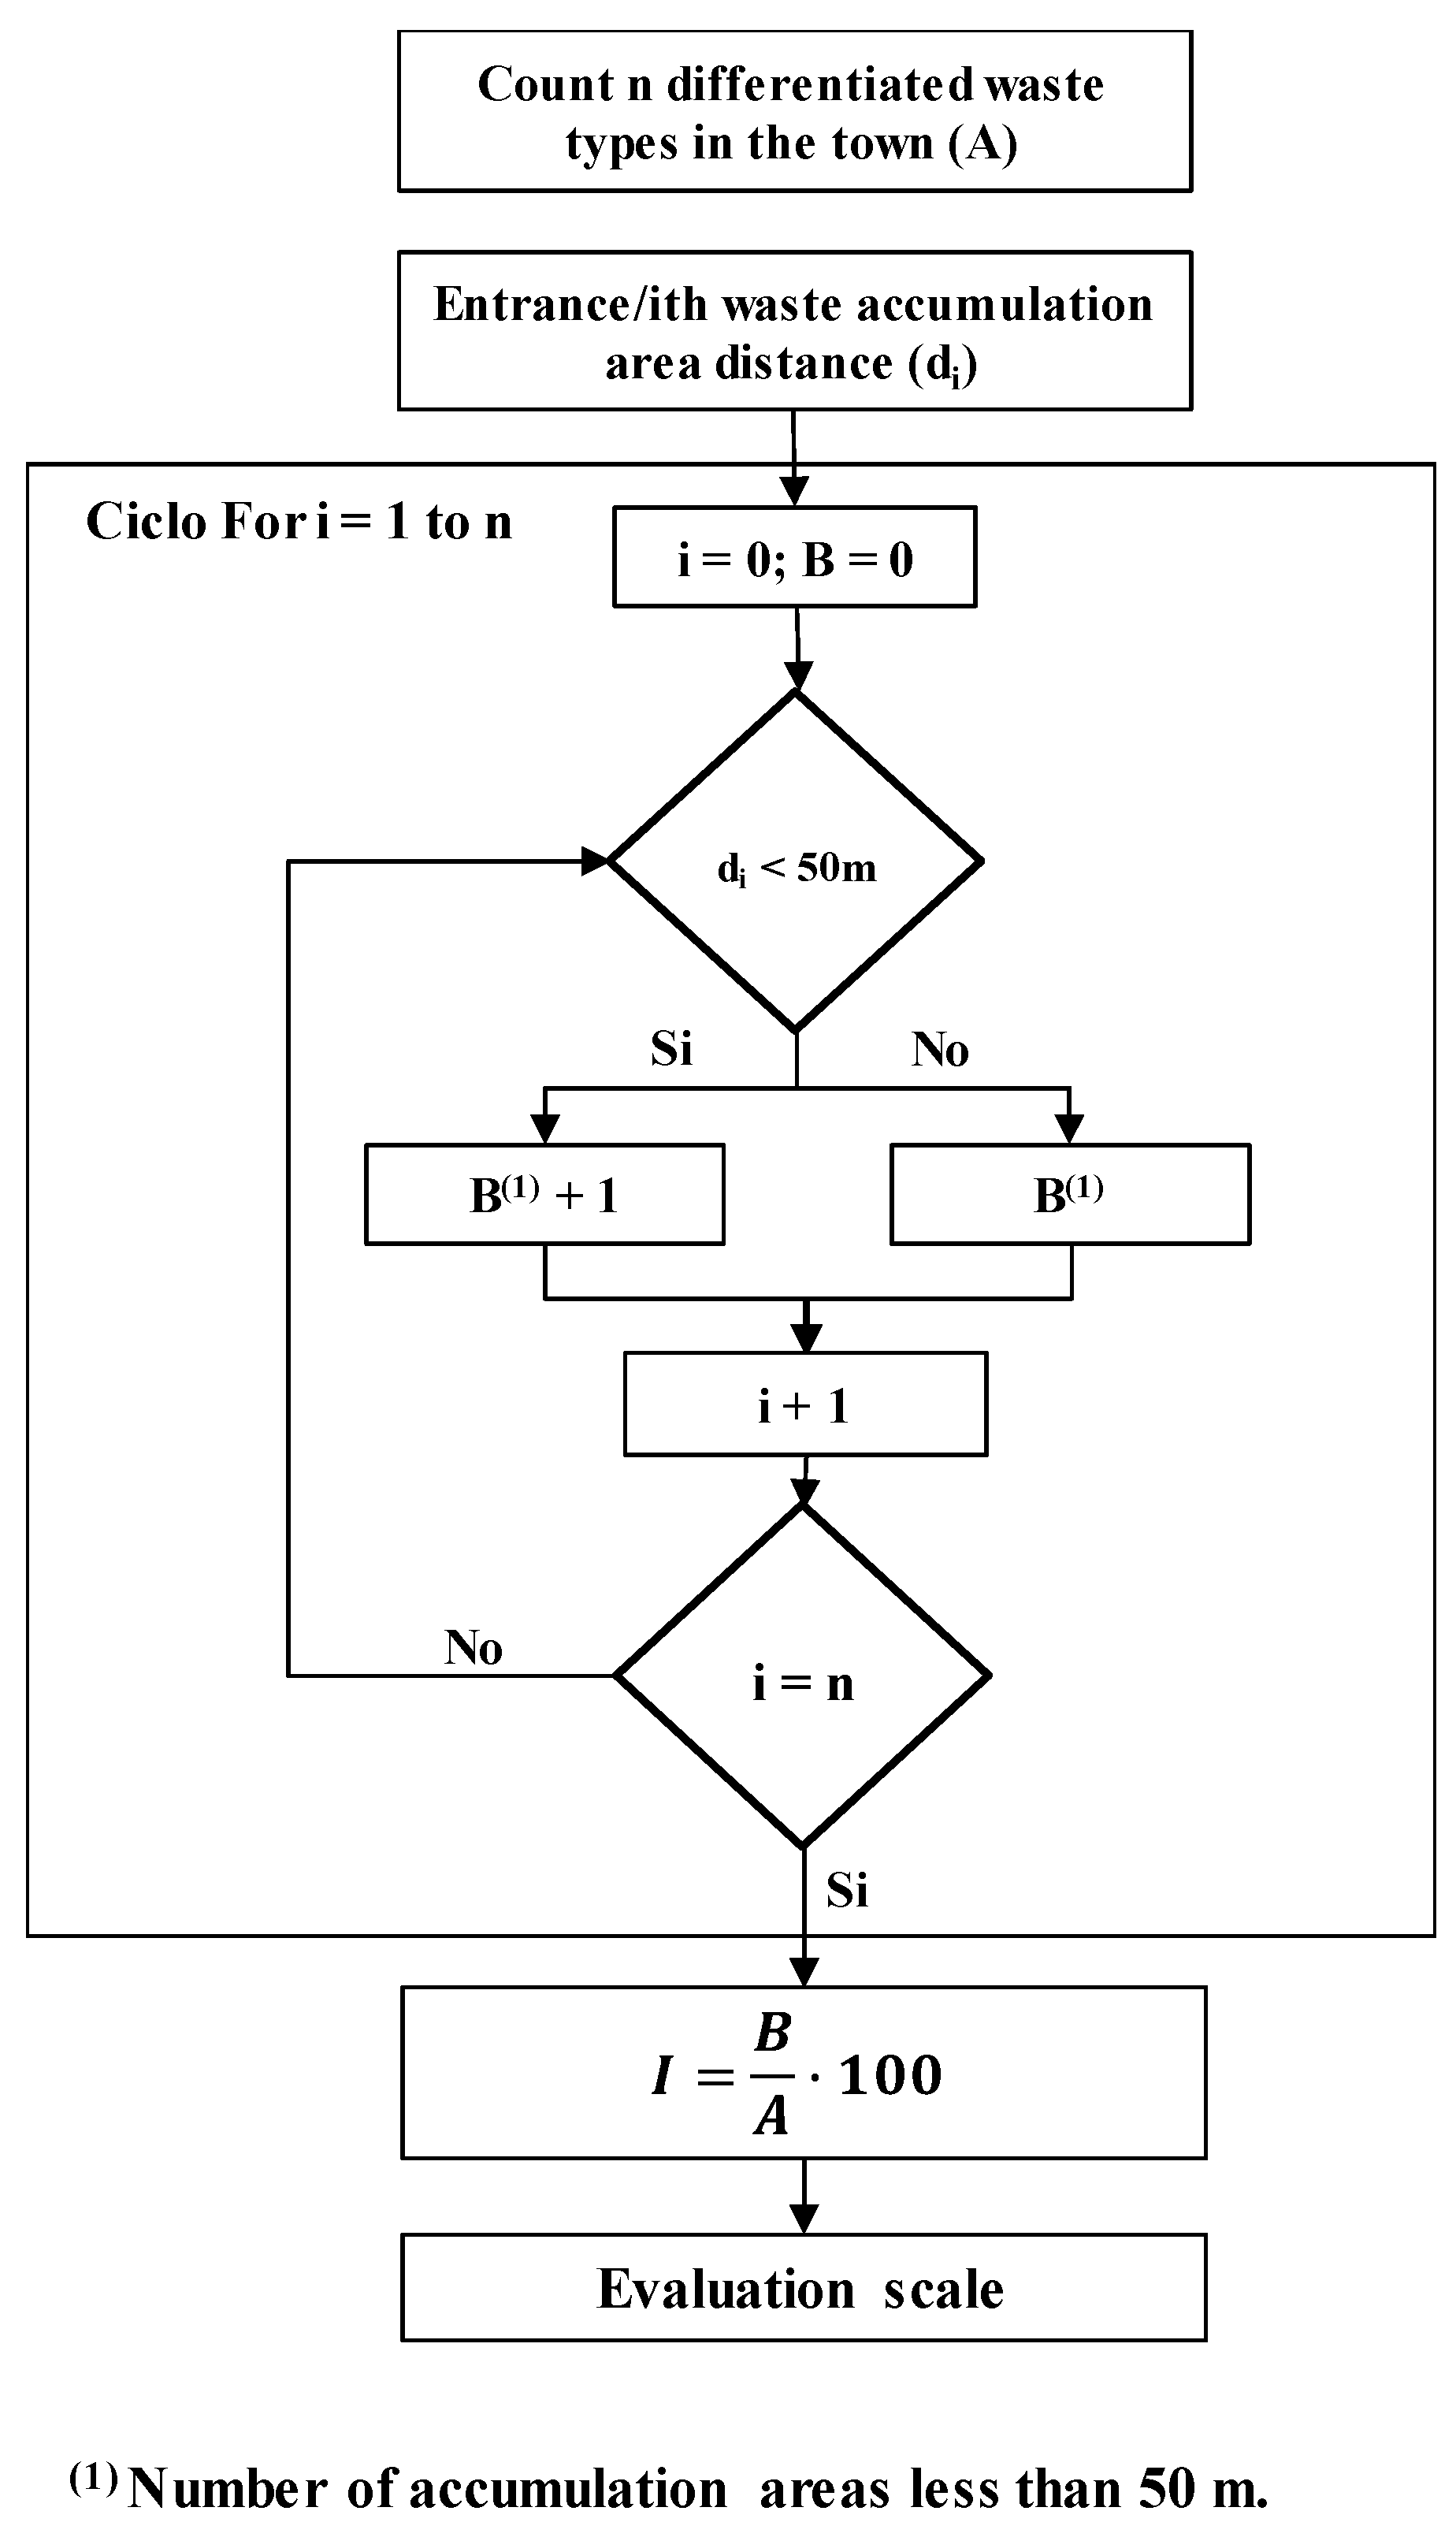
Three CRs have been added in the “Site selection” CA: “Distance from production sites “contaminants”, “Proximity to major roads” and “Dispersion of the settlement”. With regards to solid (
Figure 2) and liquid wastes produced during the production process, other two CRs have been included: “Reuse of water production” for potable uses, “Reused/recycled production waste”. The CR “Microbiological air quality” was added not only for the fact that any airborne bacterial contamination may be harmful on workers, but also to measure the risk of food product contamination. For the safety and comfort of workers the following CRs have been added: “Indoor air quality (IAQ)”, “COV”, “Visual comfort”, “Noise comfort”, “Industrial frequency magnetic fields (50 Hz) (measurements)” and “Spaces functionality”. Some of the CRs, which were already considered in the original protocol, have been adapted to specific characteristics of the food industry sector in respect to specific protocol productions.
The proposed method is articulated on four levels starting from the CR, which constitute the initial evaluation element and then move on to the CAs, EAs, arriving at the final evaluation index to be attributed to the entire productive building structure. For the evaluation of each CR, the same performance scale is used as for the ITACA protocol, consisting of 4 levels of judgment (negative, sufficient, good, excellent) (
Table 3) with a score ranging from −1 to 5, each of which is associated with a value belonging to the characteristic range of the evaluation element.
The score of each CR, is weighed (p) according to the impact that this generates on sustainability within the CA of belonging and dependent on local policies that often suffer from different needs depending on the territorial area in which the protocol is adopted.
The CRs weight were determined considering the impact that these generate, each for the specific area of influence, not only on the environment, as established in the original ITACA protocol, but also on the occupants of the building structure. The reference values are three: Duration; extension, and intensity.
The duration (D) is the measure of the time during which the CR produces its effect. If this effect is produced on the environment, the evaluation scale is articulated on three judgment levels, with values from 1 to 3, variable in a range from 0 to 50 years, if the effect is produced exclusively on the occupants, the three levels of judgment will vary depending on whether the effect is produced in the short, medium or long term.
The extension (E) is the measure of the territorial area in which the specific CR has effect and the evaluation scale is articulated in three levels of judgment varying according to which the generated effect is limited to the building structure only up to the regional and global scale. The intensity (I) measures the magnitude of the effect generated by the CR and this is also evaluated on three levels of judgment varying in a range from weak to high intensity.
The impact of the
k-th CR of the
j-th CA of the
i-th EA is obtained as a product of the three values attributed according to the relationship (1)
The
k-th CR weight of the
j-th CA of the
i-th EA (
) is obtained from the ratio (2) between the impact (
) of the
k-th CR of the
j-th CA of the
i-th EA and the sum of all impacts of the
n CRs weights of the CA analyzed.
The
j-th CA weight of the
i-th EA (
) depends on the priority level attributed on a scale from 1 (unimportant) to 5 (extremely important), in fact it is given by the ratio (3) between the priority level (
) attributed to the
j-th CA of the
i-th EA and the sum of all the priority levels assigned to the
m CAs belonging to the
i-th EA.
The weights of the EAs (wEA), on the other hand, are defined by the body that will adopt the evaluation method according to the purpose of use. In this case the weights established by the Calabria Region have been considered, which has recently adopted the ITACA protocol for the granting of subsidies and incentives to promote sustainable construction.
The CRs weights and the CAs priority levels were calculated by averaging the values obtained from the consultation of 10 experts in the agri-food sector including university researchers, economic operators and environmental experts.
The
k-th CRs weighted score
of the
j-th CA of the
i-th EA is given by the product (4) of the
k-th CR indicator score
and
k-th CR weight (
).
The score associated with the
j-th CA is obtained by aggregating (5) the products among the weights and the scores relative to all the
i-th CRs belonging to the same
j-th CA of the
i-th EA.
is the evaluation score of the j-th CA of the i-th EA;
qij is the number of CRs present in the j-th CA;
The sum of the weights of the CRs within the j-th CA is equal to 100.
Consequently, the score to be attributed to the
i-th EA is obtained by aggregating (6) the products between the priority levels and the scores relative to the CAs belonging to the same
i-th EA.
In addition, the CAs and the EAs are weighed with respect to a value that depends on the importance that these elements cover within their own level of evaluation. The final evaluation index (FEI) is given (7) by the following report.
is the evaluation score of the k-th CR of the j-th CA of the i-th EA;
is the evaluation score of the i-th EA;
mi is the number of CAs present in the i-th EA;
n is the EAs number;
is the weight in percent to be assigned to the j-th CA of the i-th EA;
is the weight in percent to be assigned to the k-th EA.
4. Results and Discussion
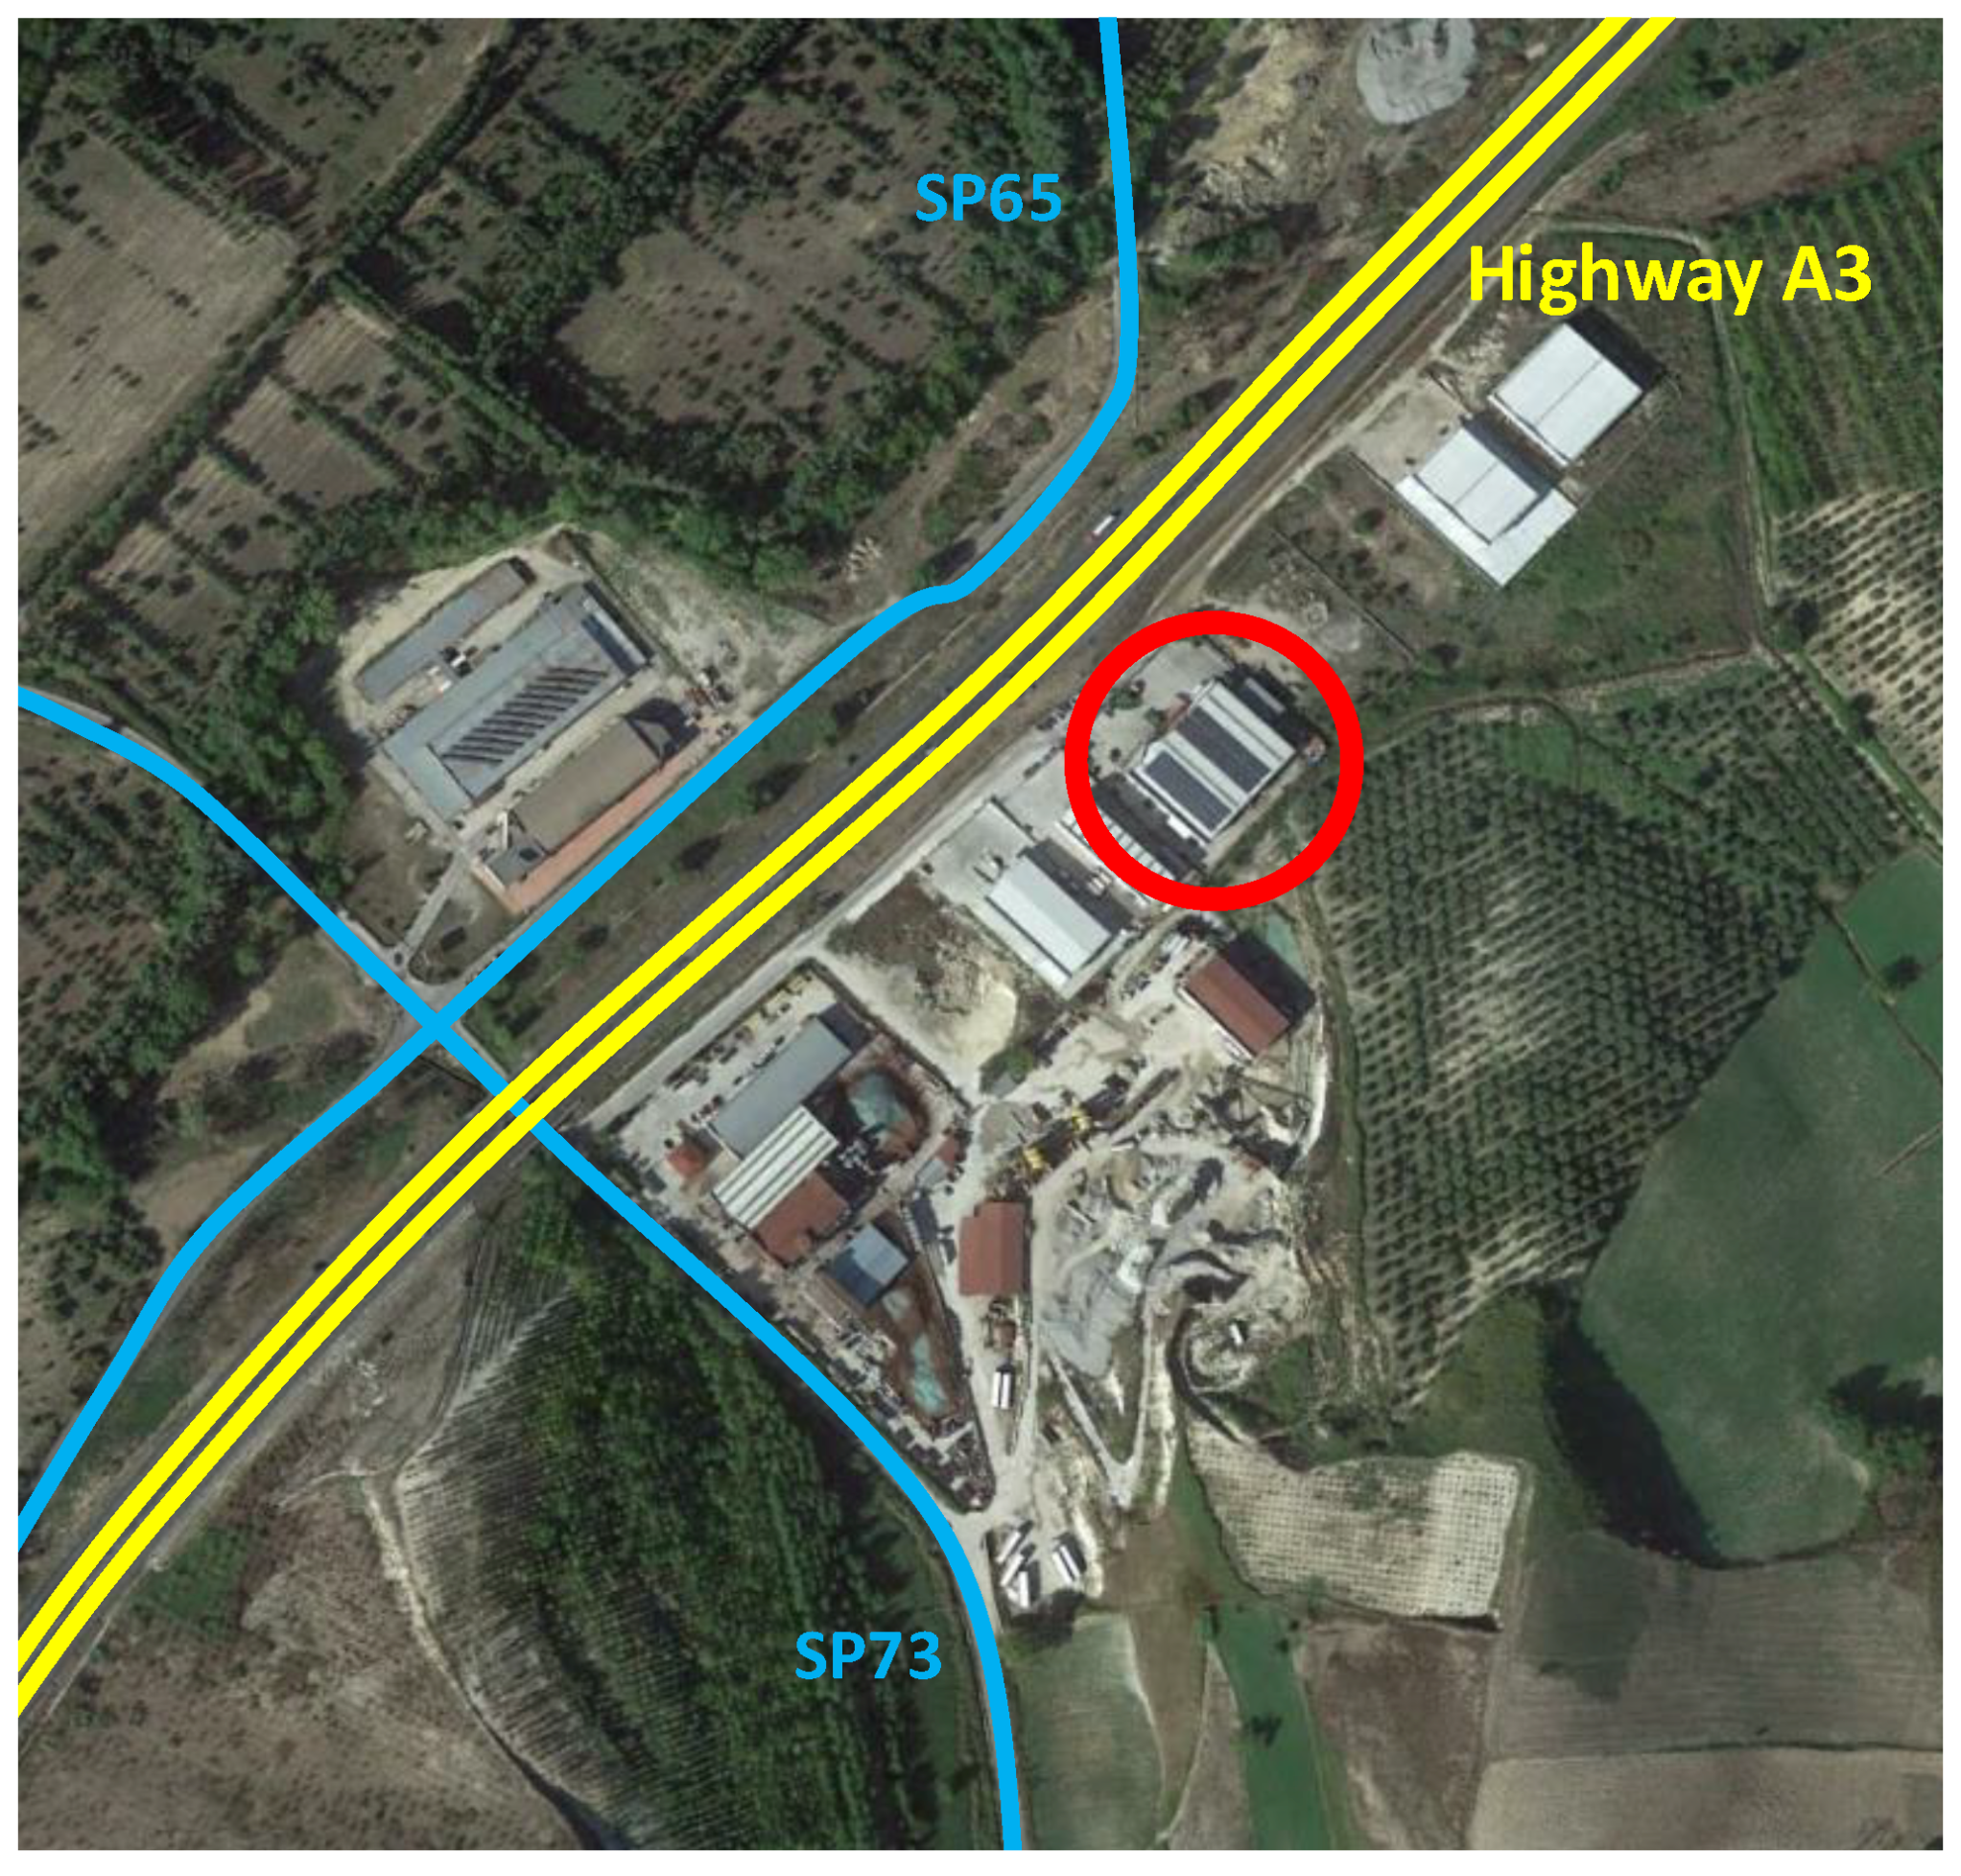
The proposed method was applied in the Dolciaria Monardo (Italy) a food factory in southern Italy (
Figure 3) (Latitude 38°37′58″ N–longitude 16°10′17″ E). The prefabricated building structure was built in 2006 within a 6000 square meter area located in a climate zone type C [
23] with 1312 degrees days. The area is characterized by a number of 90 rainy days within the year and a rainfall index equal to 0.83 m/year. The company is specialized in confectionery products, mainly made of chocolate, for this reason it needs to control the indoor environment, especially that in the packaging unit where it is necessary to control the temperatures to avoid the melting of the product.
The food factory building has two floors, the first (
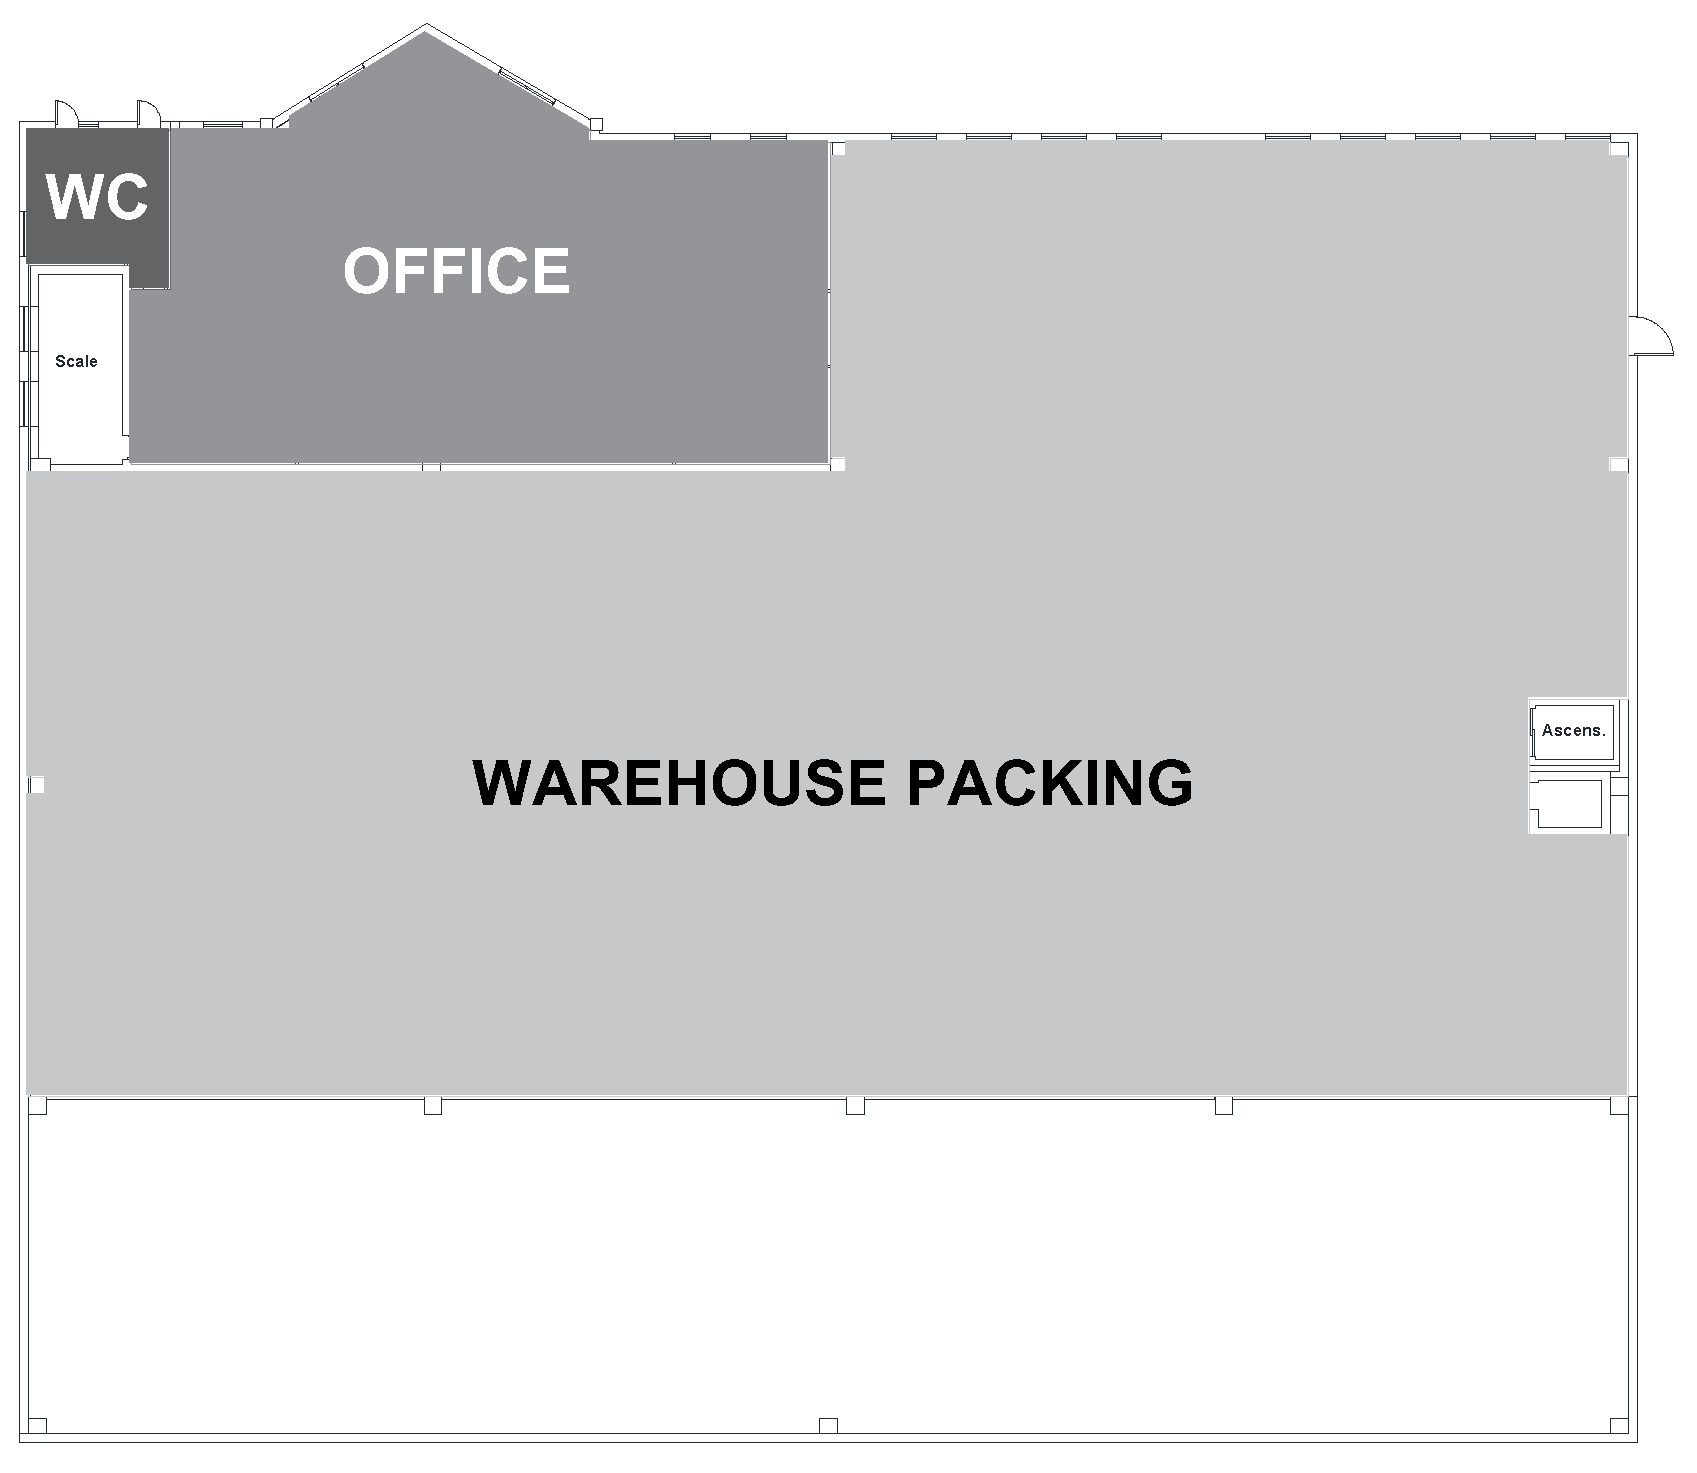
Figure 4) (ground floor), covers an area of about 2500 square meters and inside it there are the unit areas of: Pre-processing (300 square meters), processing (540 square meters), packaging (372 square meters), loading/unloading and storage of raw materials, storage and shipment of finished products (280 square meters). There are also four cold rooms (440 square meters), two of which have a large surface area, one for the storage of finished products and the other for raw material, both connected to the unloading/loading area. The structure also includes a sales area (60 square meters), a company canteen (30 square meters) and changing rooms for workers (20 square meters).
On the first floor (
Figure 5) there are the offices and there is also a large unit area (1400 square meters) for the storage of packaging, which is connected to the ground floor by a lift.
The external walls, thick 12 cm, are made of concrete insulated panels, the indoor partition walls are made of plasterboard, while the refrigerating room walls are made of insulated aluminum sandwich panels [
24].
On the roof of the building, a 1000 square meters of photovoltaic panels have been installed to produce electricity.
The proposed method was thus applied to the case study by first evaluating the level of sustainability of the CR, after that determining the scores of the CAs, the scores of the EAs and finally defining the global index.
4.1. Area A: Site Quality
Area 1: Site quality area has 10 CRs, an excellent judgment was given for the criteria: A.1.2 Public transport accessibility, A.1.3 Adjacent to infrastructure networks, because the site is located near an important public transport interchange and also the building is located in an area far from the inhabited center but it is also close to the main water, electricity and sewage distribution networks.
A negative score was attributed to the following CRs: A.1.4 distance from production sites “contaminants”, A.1.6 dispersion of the settlement, A.1.7 functional mix area, A.2.1 external areas in common use equipped, A.2.3 use of local tree species. The structure is far from fundamental commercial, recreational and banking services and it is close to a cement plant. The external area is about 6000 square meters but it lacks of space for aggregation and recreation and there are no bicycle parking, although the presence of a large paved surface allows the parking of means of transportation.
The proximity to the motorway junction A.1.5 Proximity to major roads simplifies distribution and procurement of goods not only locally but also regionally and nationally, generating positive effects on the environmental, social and economic levels.
4.2. Area B: Resource Consumption
The CRs: B.1.1 Non-renewable primary energy and B.2.1 ACS renewable energy are relating to the amount of energy required by the building, they were negatively evaluated because in the company there are no ACS solar thermal systems. The CR: B.2.2 renewable energy produced on the site for electrical purposes was evaluated with a score of 1.76, because there is a photovoltaic panel system with an extension of 980 square meters on the roof. The area also takes into account the consumption of resources related to the use of building materials from recovery activities, recycling from renewable sources, and precisely due to the non-use of these materials, to the CRs B.3.1 re-use of existing structures; B.3.2 recycled/recovered materials; B.3.3 materials from renewable sources; B.3.4 local materials assembled on site; B.3.5 recyclable or demountable materials a score of 0 was assigned. To the following CRs, a score of 1.35 and 1.22 respectively was given: B.4.1 drinking water for irrigation, B.4.2 drinking water for indoor use. Were assigned positive scores to the CRs also for the CAs related to the performance of the envelope: B.5.1 average thermal transmittance of the building envelope and B.5.3 control of solar radiation. Due to the lack of green surfaces on existing building covers, the score of CR B.5.2 green surfaces is −1. All the CAs have reached a score close to sufficiency except B.1 primary energy required during the life cycle which has reached a level of evaluation slightly lower than the sufficiency (−0.25). By weighting the CAs scores, it was possible to determine that of the entire AV equal to 0.51.
4.3. Area C: Environmental Loads
The four CAs of the Area C, were evaluated through 7 CRs of which C.2.1 solid waste produced during operation, C.3.2 gray water sent to the sewer, and C.3.3 soil permeability was assigned scores of 5 corresponding to a judgment equal to excellent. In this CA there are two specific CRs for the food industries: C.2.2 reused/recycled production waste, and C.3.1 reuse of water production. The first was evaluated with a score of 5 since all the production waste is reused and recycled, the second one was not evaluated since the water for production is not reused.
The CR relating to CO2 equivalent emissions (C.1.1 CO2 equivalent emissions) reached a very high score of 3.13, while a score equal 0 to CR C.4.1 heat island effect (sufficient) was assigned.
Weighting the CRs, the score was obtained for the four Cas: C.1 CO2 equivalent emissions, C.2 solid waste, C.3 wastewater, C.4 surrounding environment impact with scores ranging from 0 to 1.56. For the entire area C; this achieved a score of 2.73 (
Table 2).
4.4. Area D: Indoor Environmental Quality
The level of indoor sustainability was assessed for the environmental parameters that concern the safety of the workers and the hygiene of the food products. The quality of the air was evaluated both for the gases present and for the airborne micro-organisms that can generate dangerous cross-contaminations of the food. Was assigned the score of 4.92 to D.1.1 indoor air quality (IAQ) and 1.49 to D.1.3 Microbiological air quality. The VOC emissions reached a sufficient score (0.01), while the CR D.1.4 Radon values were slightly lower than the sufficiency (−1.65).
Positive scores were attributed to D.2.1 indoor ventilation (2.00), D.4.2 visual comfort (2.25), D.5.1 building acoustic quality (3.00), D.5.2 acoustic comfort (5.00) and D.6.1 industrial frequency magnetic fields (50 Hz) (technical evaluation) (5.00). Sufficient scores have been assigned to D.1.2 COV (0.01), to the criterion D.3.2 operating temperature in the summer period (0.00), has been attributed the score 0 since the internal environment have a high volume and in the summer the difference between the operating temperature and the ideal temperature was slightly less than 4 °C.
By the measure of the indoor climate have been evaluated the D.3.1 thermal comfort (0.67) CR with the score of 0.35 and the D.4.1 natural lighting CR (−1.00) the windows are placed at about 4 m from the floor and have not a transparent surface just enough to illuminate the work environments that require high levels of lighting; for this reason, artificial lighting is necessary.
The final score for Area D was equal to 1.86.
4.5. Area E: Service Quality
In this area were considered all CRs useful for the evaluation of the building functionality. Only CR E.1.1 services equipment had a score equal to 0, while E.1.2 space functionality and E.1.3 quality of data transmission system had a score equal to 3. The building has a high building automation level (E.2.1 home automation system; E.2.2 integration of building automation systems); in fact it includes video surveillance, anti-intrusion, thermoregulation and HAVC systems. There are scheduled maintenance activities regular during the operational phases (E.3.1 maintenance of building envelope performance) facilitated also by the presence in the company of all project documents (E.3.2 availability of technical documentation buildings).
The final score of area E was equal to 1.69.
Overall, around 80% of the CRs were given a score lower or equal to 3, of which 16% had a negative rating (−1). Approximately 18% of the CRs were assigned a rating of excellent (5) and only 2% of the CRs were given a score between 3 and 5.
The final evaluation index, for the “Location quality”, was assigned a value of 0.11, slightly above the sufficiency, to the “Building quality” was assigned a score equal to 1.05.
A specific software was developed to apply the protocol. It simplifies the method application by means the automation of the analysis process, making the method more flexible according to the needs.
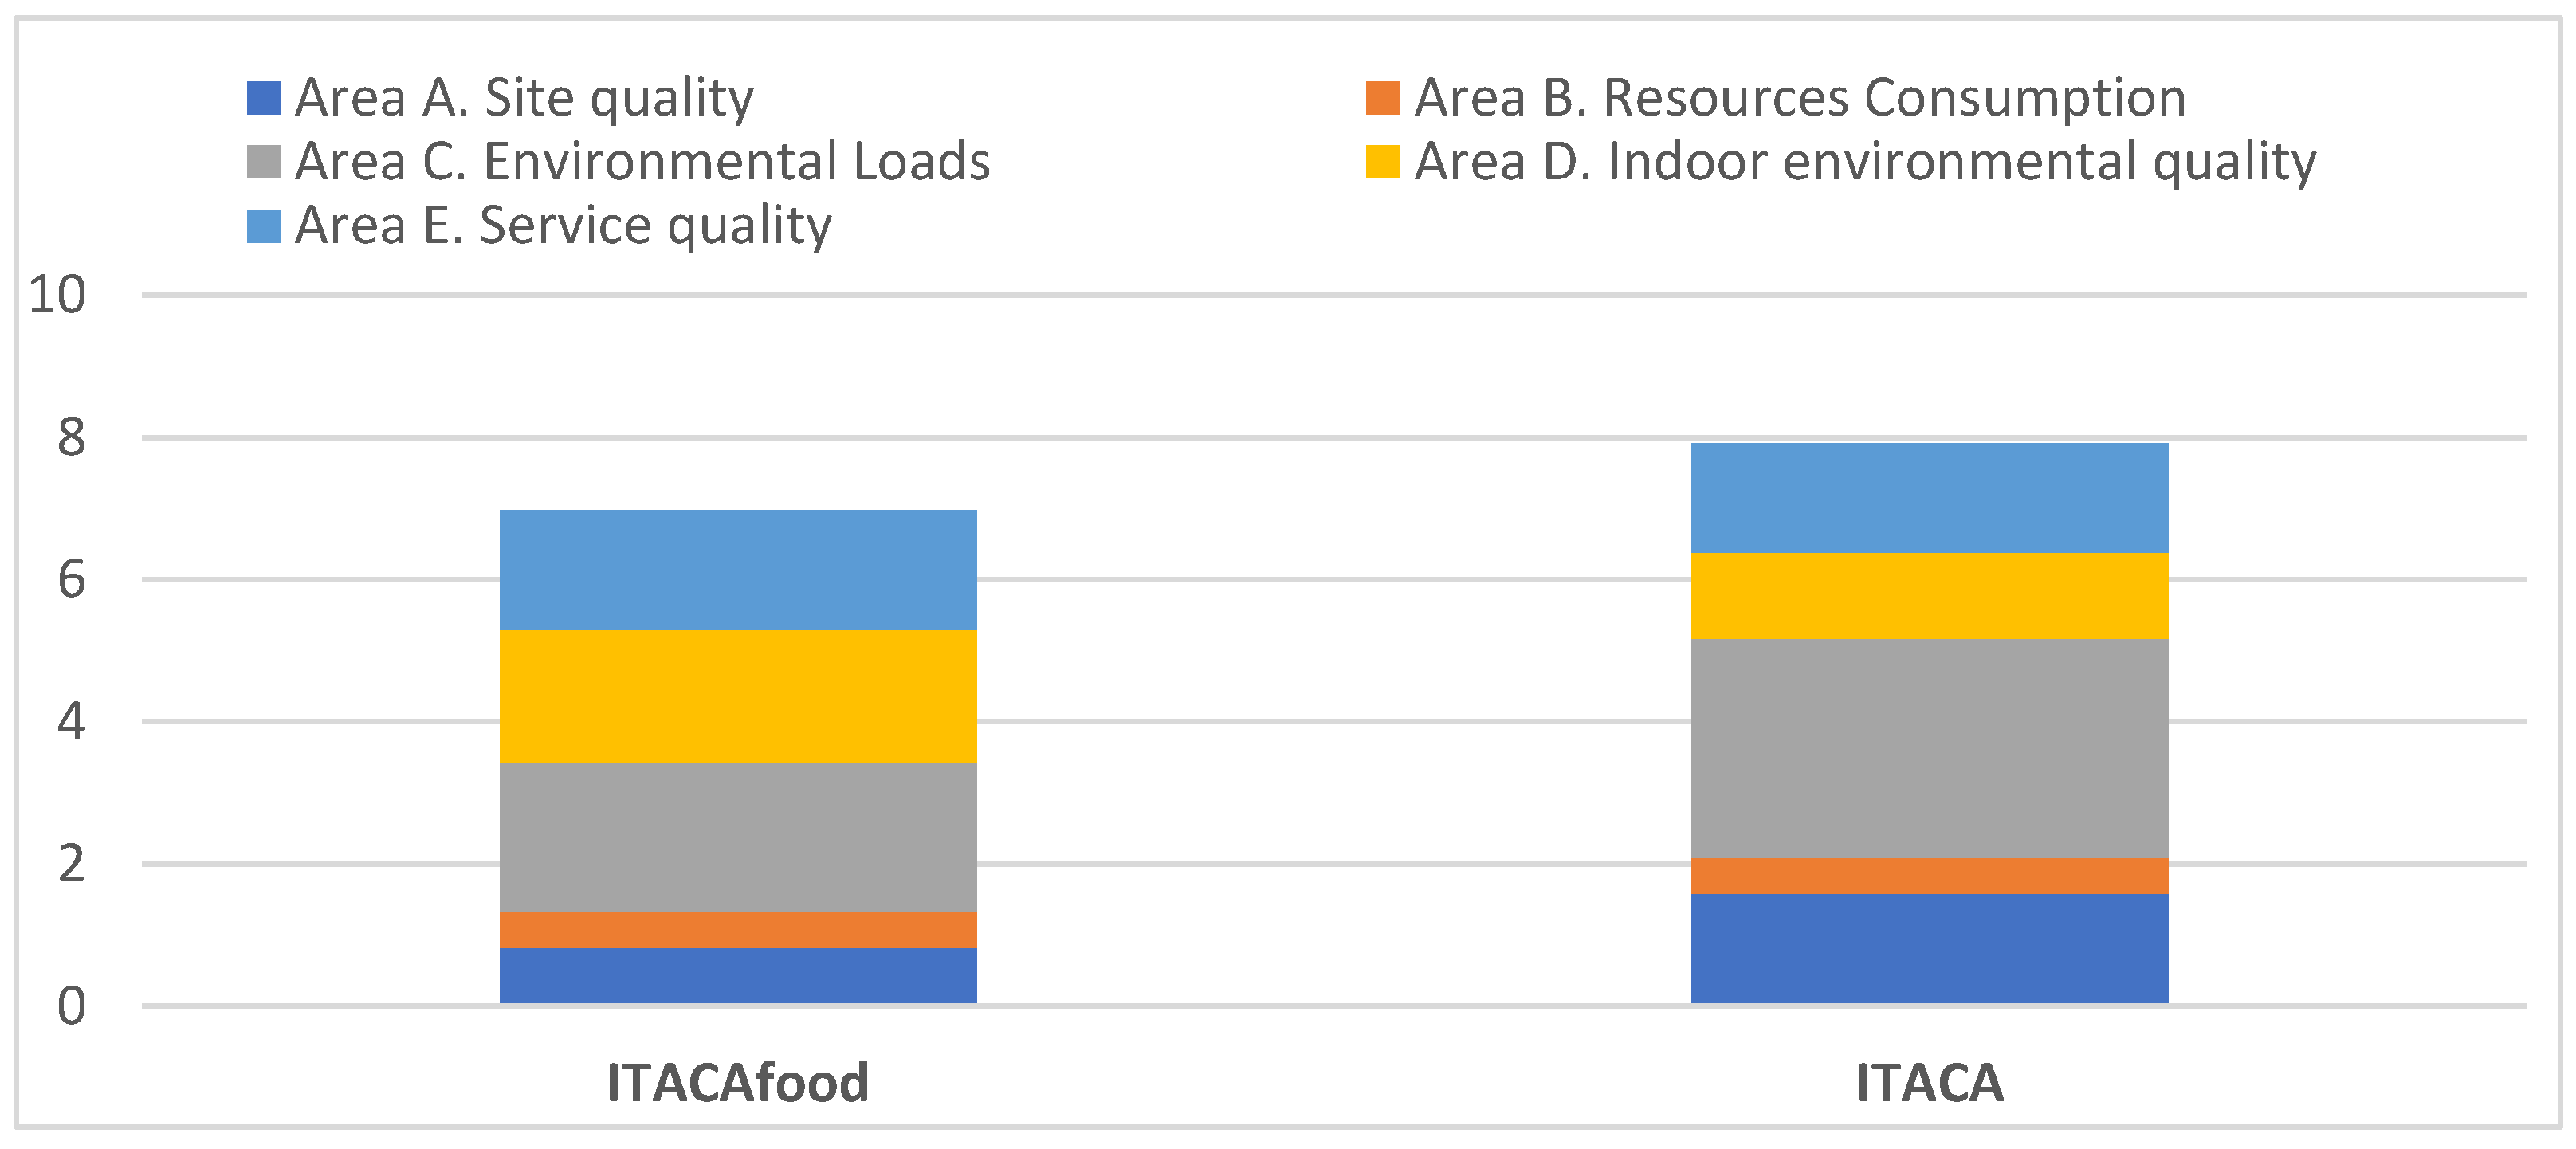
From the comparison between the scores of the proposed evaluation method and those of the ITACA protocol without the addition of the specific indicators of the food industry (
Figure 6), it emerged that in areas A and C a decrease in the scores, in contrast, in the areas of evaluation D and E an increase (
Table 4,
Figure 7).
The final scores evaluation showed a variation of 14% between the two compared methods. The final score of ITACAFood was equal to 1.23, while that relative to the application of the ITACA protocol adopted by Calabria Region was equal to 1.43.
From application to the case study, it emerged that the added CRs were easy and immediate to evaluate.
5. Conclusions
The proposed method is a specific protocol to assess the level of sustainability in the building structures of the food industry, since the CRs present in the original protocol, have been supplemented by other specific CRs for the production activity analyzed. From the results obtained, it emerged that it can be easily used to evaluate the level of sustainability during all the life phases of the building structure, starting from the design stage up to that of occupancy, as well as disposal. In fact, in food industry buildings transformation processes are carried out during which appropriate indoor environmental conditions must be maintained to safeguard the food, but, in many cases, it clashes with the operators well-being. These needs can generate environmental loads and energy consumption higher than those generated by residential building structures, and for this reason, is important to define evaluation method that measure the sustainability level of the productive building structures.
ITACAFood can be developed to be applied not only during the operational phases, but also in the design phase, and to propose sustainable solutions in terms of environmental and energy sustainability and hygienic-sanitary safety. The method is structured to evaluate and allow improvements during all phases of the process and to be applied to all types of food production.
A tool software has been developed to facilitate the application of the method. This tool makes the method more flexible according to the needs of public administrations, as they can use it as a form of control, but also by the companies themselves to verify the functional level of the building structure in relation to the activity, and as a forecasting element.
This evaluation method will be a good opportunity not only for the building market but also for the food market that demands green certified processes. In fact, the demand of food consumers is oriented to environmentally sustainable production, and the stage of processing is very important in regards to obtaining green products. This study allows the application of an original and specific method to evaluate the sustainability of buildings for food processing.


