Article

Evaluating Citizen Satisfaction and Prioritizing Their Needs Based on Citizens’ Complaint Data

by
Mostafa Ghodousi
1,
Ali Asghar Alesheikh
1,
Bahram Saeidian
1,
Biswajeet Pradhan
2,3,* and
Chang-Wook Lee
4,*
1
GIS Division, Faculty of Geodesy and Geomatics, K. N. Toosi University of Technology, Tehran 19967-15433, Iran
2
Centre for Advanced Modelling and Geospatial Information Systems (CAMGIS), Faculty of Engineering and IT, University of Technology Sydney, Sydney, NSW 2007, Australia
3
Department of Energy and Mineral Resources Engineering, Sejong University, Choongmu-gwan, 209 Neungdong-ro, Gwangjin-gu, Seoul 05006, Korea
4
Division of Science Education, Kangwon National University, 1 Kangwondaehak-gil, Chuncheon-si 24341, Korea
*
Authors to whom correspondence should be addressed.
Sustainability 2019, 11(17), 4595; https://doi.org/10.3390/su11174595
Submission received: 21 July 2019 / Revised: 19 August 2019 / Accepted: 19 August 2019 / Published: 23 August 2019

Abstract

:
Citizen Relationship Management (CiRM) is one of the important matters in citizen-centric e-government. In fact, the most important purpose of e-government is to satisfy citizens. The ‘137 system’ is one of the most important ones based on the citizen-centric that is a municipality phone based request/response system. The aim of this research is a data-mining of a ‘137 system’ (citizens’ complaint system) of the first district of Bojnourd municipality in Iran, to prioritize the urban needs and to estimate citizens’ satisfaction. To reach this, the K-means and Bees Algorithms (BA) were used. Each of these two algorithms was executed using two different methods. In the first method, prioritization and estimation of satisfaction were done separately, whereas in the second method, prioritization and estimation of satisfaction were done simultaneously. To compare the clustering results in the two methods, an index was presented quantitatively. The results showed the superiority of the second method. The index of the second method for the first needs in K-means was 0.299 more than the first method and it was the same in two methods in BA. Also, the results of the BA clustering were better at it because of the S (silhouette) and CH (Calinski-Harabasz) indexes. Considering the final prioritization done by the two algorithms in two methods, the primary needs included asphalt, so specific schemes should be considered.

1. Introduction

E-government is developing in today’s societies. Iran’s society is also not an exception, so it is necessary to carefully consider the concepts behind e-government [1]. The critical purpose of e-government is to manage governments more efficiently [2]. One of the important criteria of e-government is Citizen Relationship Management (CiRM) offering citizen-centric services [3]. Citizens are, in fact, the true owner of the governments. Therefore, it is logical that governments should be citizen-centric [4]. CiRM provides the information to specific people in a special time and with special methods. Through CiRM, organizations have an opportunity to manipulate and access up-to-date data collected by governments [5].
Some research has approved the usefulness of CiRM [6,7,8]. King mentioned CiRM as a basic element offering more citizen-centric public services to citizens [7]. The author suggested the use of CiRM in predicting the needs. Dasilva and Batista identified CiRM as a tool to increase the response time of governmental organizations [6]. Schellong and Langenberg used CiRM to predict natural hazards and emergencies like Wilma Hurricane [8].
There are two essential points about CiRM. First, how to have citizen-centric management. Some studies concentrated on how to implement Citizen Relationship in society. Sasaki et al. studied the required environmental changes to make a Centre of the CiRM [2]. In another study by Keramati et al. the success factors in the strategy of the CiRM were investigated, and some suggestions were presented to improve its implementation. They suggested that governments should present citizens’ science through a confirmed communication channel possible by the CiRM [5].
The second essential point about CiRM is to observe that the communication channels and governmental services are not the only tools to CiRM. Making channels for communication and mutual interaction between citizens and government is, however, necessary. Many governments improve their services in several ways, but different services and communication channels do not equally satisfy the citizen’s needs. The true realization of citizens’ needs and demands and offering the appropriate services related to the demands are significant and need to be discussed. In fact, CiRM is a mixture of managerial and technological topics, both influencing citizens’ needs. Using information technology, the needs of citizens could be appreciated better [1].
Using techniques and data-mining tools could be very useful. Data-mining helps related organizations like municipalities know the citizens better, to appreciate the differences among their needs; through this, they can more efficiently manage their resources and better coordinated concerning citizens. Data-mining could play a role in CiRM through improvement by offering urban services to citizens and enhancing their satisfaction [9].
Researchers are increasingly using large-scale administrative data such as 137 data gathered by municipalities to better comprehend urban issues and their patterns over time and space [10]. As citizens use various channels to increase their voice more frequently, it becomes difficult for citizens to comprehend the city’s urgent problems manually. ICT-enabled co-production aims to convert the architecture, system, and style of government management into a more citizen-centered and participatory strategy. Highly intelligent assessment of citizens’ demands and complaints can contribute to enhanced rates of service coordination and can assist officials in the decision-making mechanism. By extracting helpful patterns from big data, data analytics can provide information depictions. By extracting a couple of valuable pieces of information from big amounts of data, people can handle a relatively small amount of the information obtained to make inferences. Big data analysis is a helpful tool to comprehend realities by decreasing huge data to a small amount of valuable information. It can also help planners by using some widely known algorithms for descriptive purposes. For examples, clustering algorithms are used to organize the citizen’s service needs to groups. A couple of patterns recognized by these techniques provide perspectives that would not be evident using traditional approaches like manual scanning [11].
In Iran the municipality, as one of the most important organizations related to citizens, has a major role in offering urban services. Using information technology and telecommunication systems, this organization has made a ‘137 phone system’. This system is a centre for controlling, establishing and investing urban problems. It also acts as a bridge between the municipality and citizens. In the database of this system, useful data are saved concerning the services presented to the citizens. It can be investigated as an important and appropriate resource for the management of analytical relations with citizens [9].
Some studies analyzing ‘137 databases’ were performed. In a study done by Ahmadvand et al., 137 databases of Tehran municipality were used. In their study, the problems were firstly grouped by a K-means algorithm, and then the information related to citizens’ satisfaction with the services were analyzed by using association rules and an a priori algorithm. In addition, the relation between the parameters of citizens’ satisfaction with quality and speed of services was considered and also effective factors and conditions affecting the satisfaction and dissatisfaction of the citizens were determined [12]. Minaei-Bidgoli and Akhondzadeh did similar research to the previous one on ‘137 databases’ of Tehran municipality. In the mentioned study, association rules and an a priori algorithm were used. In the first section of their study, the relation between the type of problem, time and geographical zone was investigated. In the next section, the relations between the type of complaints and demographic features, the cultural features and the type of problem were investigated [13]. In another study performed by Akhondzade-Noughabi et al. on the ‘137 system’ of Tehran municipality, citizens’ complaints were categorized using a K-means algorithm. They also examined citizen satisfaction in their study [14]. The mentioned studies have some drawbacks. First, they only used one clustering algorithm, and thus way it is not possible to guarantee an optimum algorithm. The way the satisfaction analysis was quantified and the fact that the method and parameters were non-generalizable were some other drawbacks.
In previous studies, clustering was done based on frequency and recency, and in the next stage, satisfaction was analyzed based on obtaining clusters. They have ignored this point in CiRM; we are looking for needs, which have more frequency and recency and satisfaction to a less degree. In practice, this is our objective function in CiRM. In other words, the first method cannot provide a guarantee for achieving CiRM objectives. In this regard, when prioritization and satisfaction analysis is done simultaneously, the third factor is considered in prioritizing needs. Also, we want to know how much its effect on CiRM objective function and can help us to better satisfy that and has a deeper insight into citizens’ needs. These issues increase the importance of our study.
To categorize the needs, various algorithms can be used. During recent decades, some new algorithms were developed for solving different problems. Among these methods are meta-heuristic algorithms. Meta-heuristic algorithms have been used in different engineering and management issues [15]. Also, studies in CRM showed that meta-heuristic algorithms increase clustering quality. This makes sure that needs in the same cluster have a similar occurrence pattern [16].
A comparison of genetic, bees and K-mean algorithms for clustering was done in a study by Pham et al. From their results, the priority of the bees algorithm (BA) is on the dataset in clustering [17]. In another study, carried out by AbdelHamid et al. a comparison between BA, genetic algorithm and K-means in document clustering was done. Results showed the priority of BA [18].
Hubert et al. developed methods for clustering and visually exploring citizens’ complaints. They used the Density-Based Spatial Clustering of Applications with Noise (DBSCAN) method for clustering. They used heat maps to depict the intensity of requests at geographical regions [19]. Wang et al. developed a method for classifying urban locations based on the categorical and temporal structure of 311 Service Requests. They provided an urban classifier to predict the socioeconomic and demographic features of a neighborhood and estimate the economic performance and prosperity of defined spatial units [20]. Xu et al. used a locally adaptive space-time kernel approach to model 311 requests. They provided an analytical model to predict 311 demands in space and time [21].
White and Trump examined applications of 311 data for the purpose of studying citizens’ political participation and engagement [22]. Hagen et al. discussed the potential advantages and constraints of 311 data and analytics outcomes. They took a clustering approach to group together tracts that share similar 311 request patterns by implementing K-means clustering. They investigated to what extent 311 request patterns can reveal socio-demographic structures. As a result, they found that 311 service request patterns indicate underlying socio-demographic factors within the area [11]. Liu et al., used a factor analysis method for identifying different requests. They also mapped the spatial distribution of each request type. They used Exploratory Factor Analysis (EFA) and Confirmatory Factor Analysis (CFA) for factor analysis and used Kernel Density Estimate (KDE) for spatial analysis. They examined the change of spatial distributions of each type of request. In other words, they analyzed the spatial and temporal patterns of complaint [10].
In CRM, due to customer’s diverse interests and backgrounds, mass marketing cannot satisfy the needs. Therefore, market segmentation has been considered in realizing prosperous modern marketing patterns [16]. We can also develop this concept in governmental agencies. In this research, there were three factors to consider: request frequency (F), request recency (R), and satisfaction (executive function). We used the RFM model to identify and prioritize the requirements. Regarding citizen relationship management, the issues related to finance are not important; we can use satisfaction and executive function for revenue [14].
In this research, the ‘137 databases’ of Bojnourd city, which is located in north-east of Iran, is analyzed. We utilized data-mining and CiRM approach for identification and prioritization of the citizen requirements, as well as how much their satisfaction is. This research used two methods. In the first, such as the study done by Ghodousi et al. [
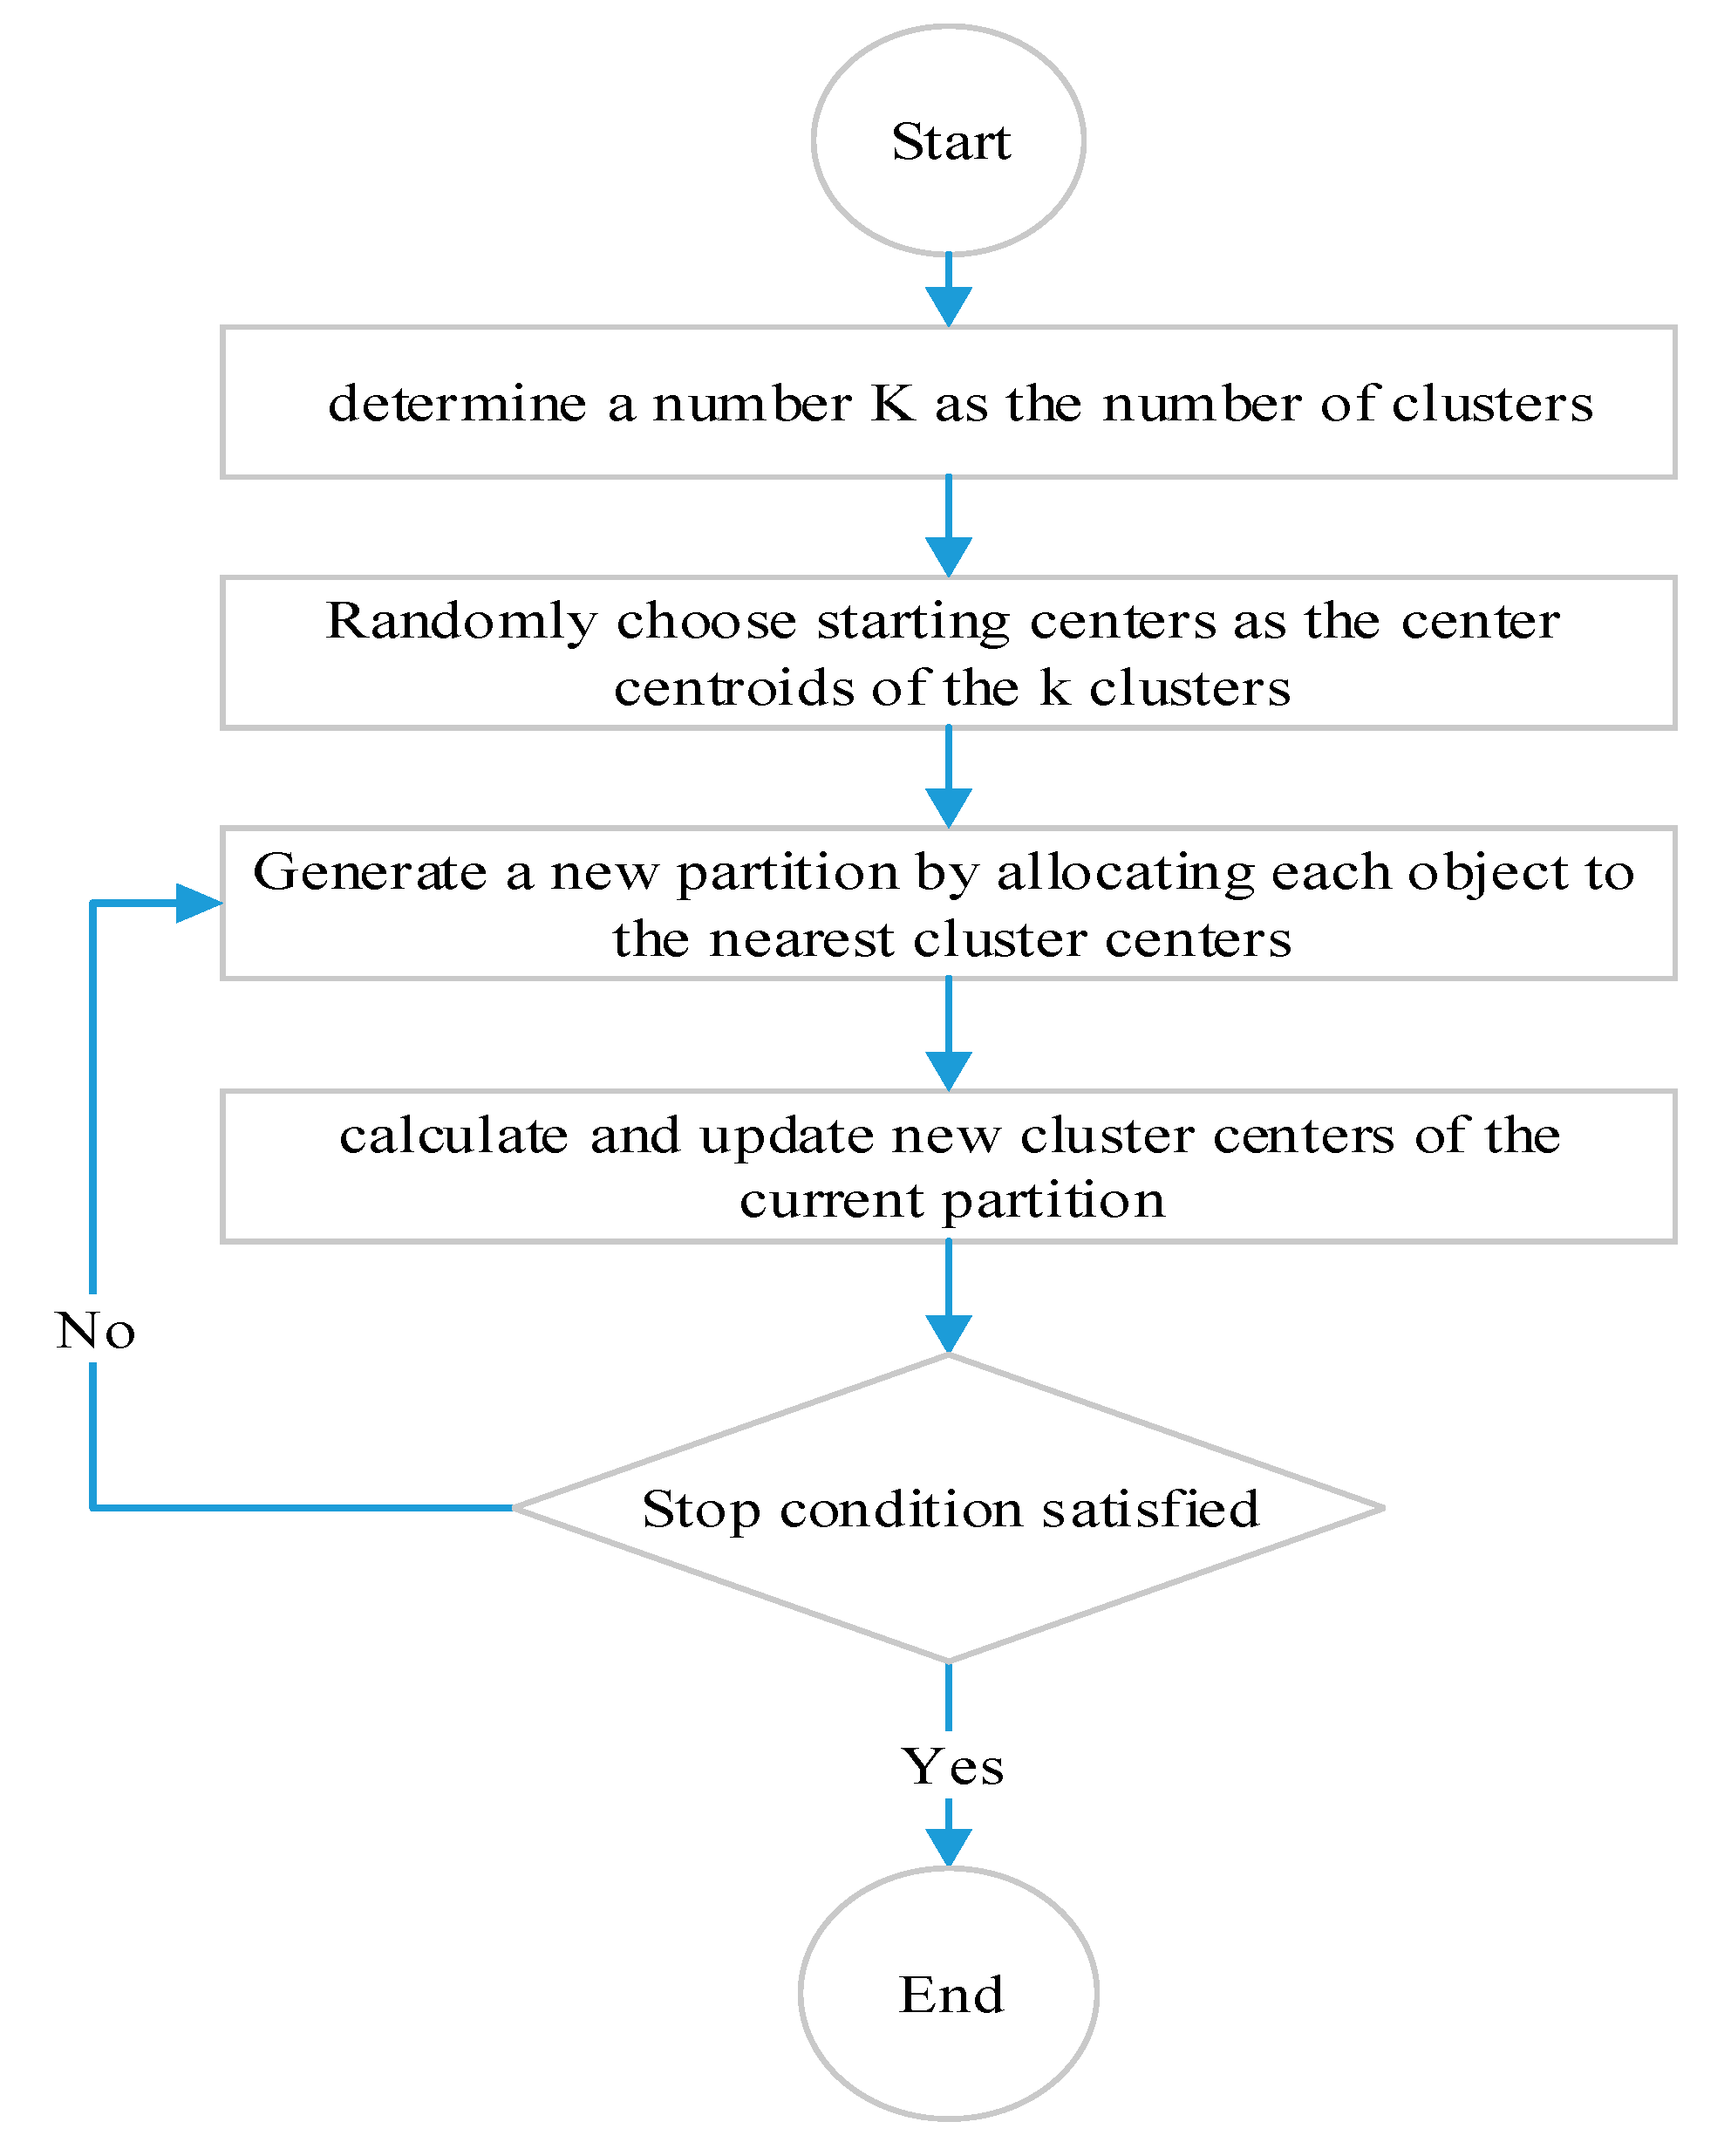
23], prioritizing and estimating the satisfaction was done separately, but in the second method, through a new approach, optimizing and estimating the satisfaction was done simultaneously and the result was compared based on CiRM objectives. In this research, BA was used to optimize the clustering. In addition, the result of K-means as a popular clustering algorithm [14], and BA was compared.

2. Basics of the Used Algorithms

The objective of the clustering is to perform a partition where, despite the fact that maximum homogeneity exists among the members of the group, the maximum difference has been seen among various groups [24]. In this research, K-means and BA were applied for clustering the citizen needs (complaints). The following sections depict the necessary concepts of these algorithms.

2.1. K-Means Algorithms

K-means algorithm has attracted so much attention in partitioning clustering algorithms and its simplicity has attracted many studies to be conducted upon. The starting centres and the number of clusters have led to the accuracy of this algorithm [18]. Figure 1 depicts the procedure of this method.

2.2. Bees Algorithm

Optimization algorithms, like genetic algorithm, bees algorithm and so on, were used to solve optimality problems. In this research, the bees algorithm was used. In this algorithm, the food exploring behavior of a honey bee colony was imitated [26]. This algorithm is a population-based search one, and the inspiration comes from the honey bee behavior when they try to collect food resources around their hive in the best way possible [27]. This algorithm stands on a type of neighborhood search, integrated with a random search [28].
At the start of the algorithm, scout bees were placed randomly in the search space. On the onset the finesses of the sites which were visited by the scout bees were evaluated using the fitness function [20]. Next, bees that possess the highest fitness values were chosen as “selected bees” and sites seen by them were preferred for neighborhood search. The algorithm kept searching around the selected sites, allocating more bees to search around optimal sites (elite sites). Searches around the neighborhood of elite sites were made more concise by recruitment more bees to search around them than other selected bees. The algorithm assigned rest of the bees randomly to the search space scouting for new solutions. These phases were repeated until stopping criteria were satisfied [29]. The process of this algorithm is shown in Figure 2.

3. Materials and Methods

In many studies [31,32,33], citizen satisfaction data has been gathered through qualitative measurement by survey questionnaires. The survey has a weakness which uses a limited amount of sample data and one cannot verify whether the survey represents the people’s true thoughts. On the other hand, one can overcome the survey’s drawbacks by using social network data that contains people’s opinions [34]. However, in many places, people are self-conscious about their privacy and are often unwilling to share their location for deeper analysis. On the other hand, one can solve the survey’s disadvantages by the analysis of ‘137 databases’ which consists of a citizen’s frank opinions.
In this study, the database of ‘137 centres’ in Bojnourd municipality was utilized. The raw data were provided in Excel format by the IT department of the Bojnourd municipality. The data is not shared publicly. The data belong to District 1 of Bojnourd city for the month of July 2014. The Bojnourd 137 system has a relatively medium quantity of requests, averaging over 50 requests per day, for over 1500 requests in this period. The fields of ‘137 databases were the Tracking Code, Subject, Region, Date, Time and Executive response. 
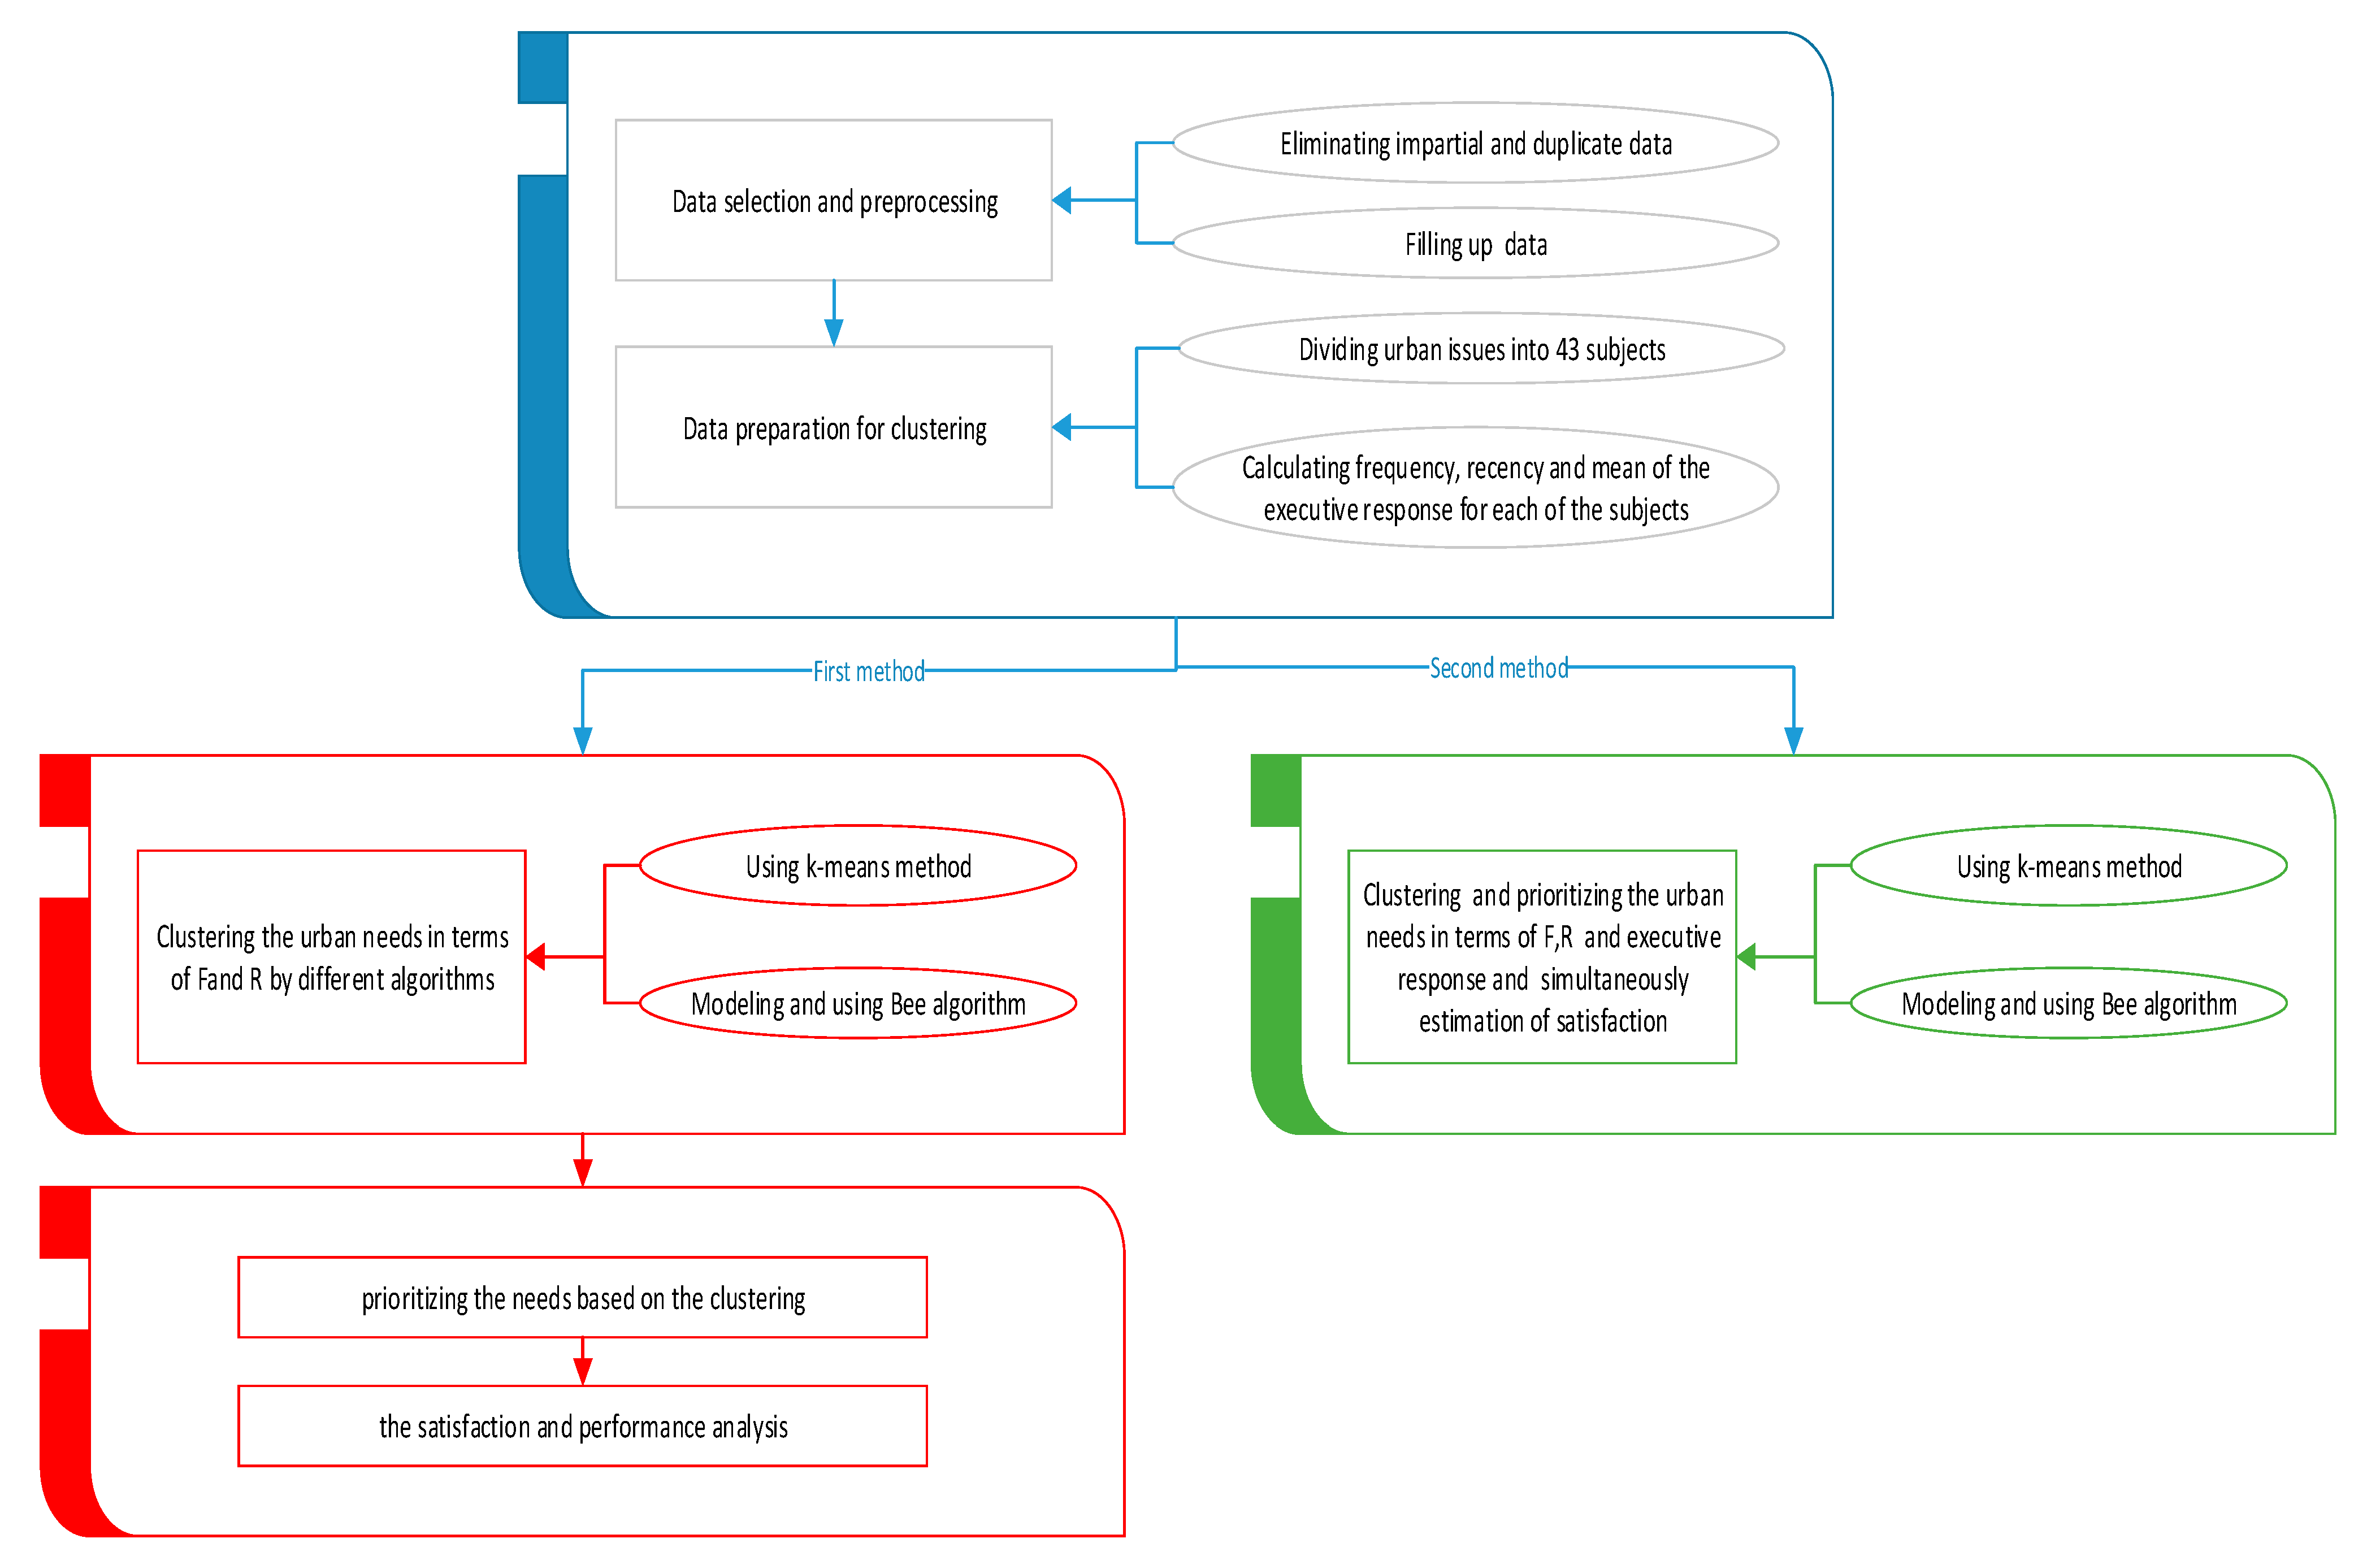
Figure 3 shows the overall methodology applied in this research.
In the proposed method, the data was gathered and preprocessed, then it was transformed into a suitable format for clustering. After applying various algorithms with different methods, needs prioritization was defined next. In preparing the data, the impartial and repetitive data were deleted from the database, and those capable of filling up based on other fields were rebuilt. The data was primarily in the Persian language. Each country uses a different complaint/request coding convention, thus there is little consistency in the classification of particular complaint types. The research of Akhondzadeh-Noughabi et al. was used to translate the categories into English. The problem regarding urban were classified into 43 subjects; then, the number of contacts and recency and the mean of the relevant number to the executive response were made out for every subject. Ten subjects were without occurrence, while there were some requests for 33 issues. The reasons for having 10 subjects without reports were the temporal and spatial conflict with a time period and location of the study area. The temporal and spatial conflicting with a time period and location of the study explained why the 10 subjects were without reports. Actually, these issues did not take place in the study area for issues related to culture. According to the suggestion by Akhondzadeh et al. the best number of grouping for urban needs was 5, so this number was selected for this research [14].
According to Figure 3, two methods were executed. In the first method, similar to previous studies [12,17], concerning the prioritization of urban needs and estimation of satisfaction, needs were prioritized. First, this it was carried out according to the two factors of frequency and recency, and then the estimation of satisfaction was performed. In the second method, the need prioritization and clustering were done based on three factors (frequency, recency and executive response mean) and the satisfaction estimation was also done simultaneously. Then, the results of the two methods of prioritization in reaching CiRM objectives were compared.
In this study, three factors were utilized, which are known as the three RFM parameters: the first one is time interval or “recency” (R): the time interval between the first request of a subject and the last one within a month. The second one is frequency (F): the count of citizens’ contacts in case of an issue in a month. Finally, executive response means (M): the general function of the executive (for instance jobs done, impossible to carry out, needs more time to do, no response and so on). This factor was the result of the mean of all the responses provided by the executives for an issue within a month; which is quantified for better analysis.
Regarding the needs, prioritizing was performed within a month; the second-criteria range is 0 to 30. Subsequently examining different modes for answering to an issue, the classification of the third factor into four class was conducted according to the quality of executive response (Table 1).
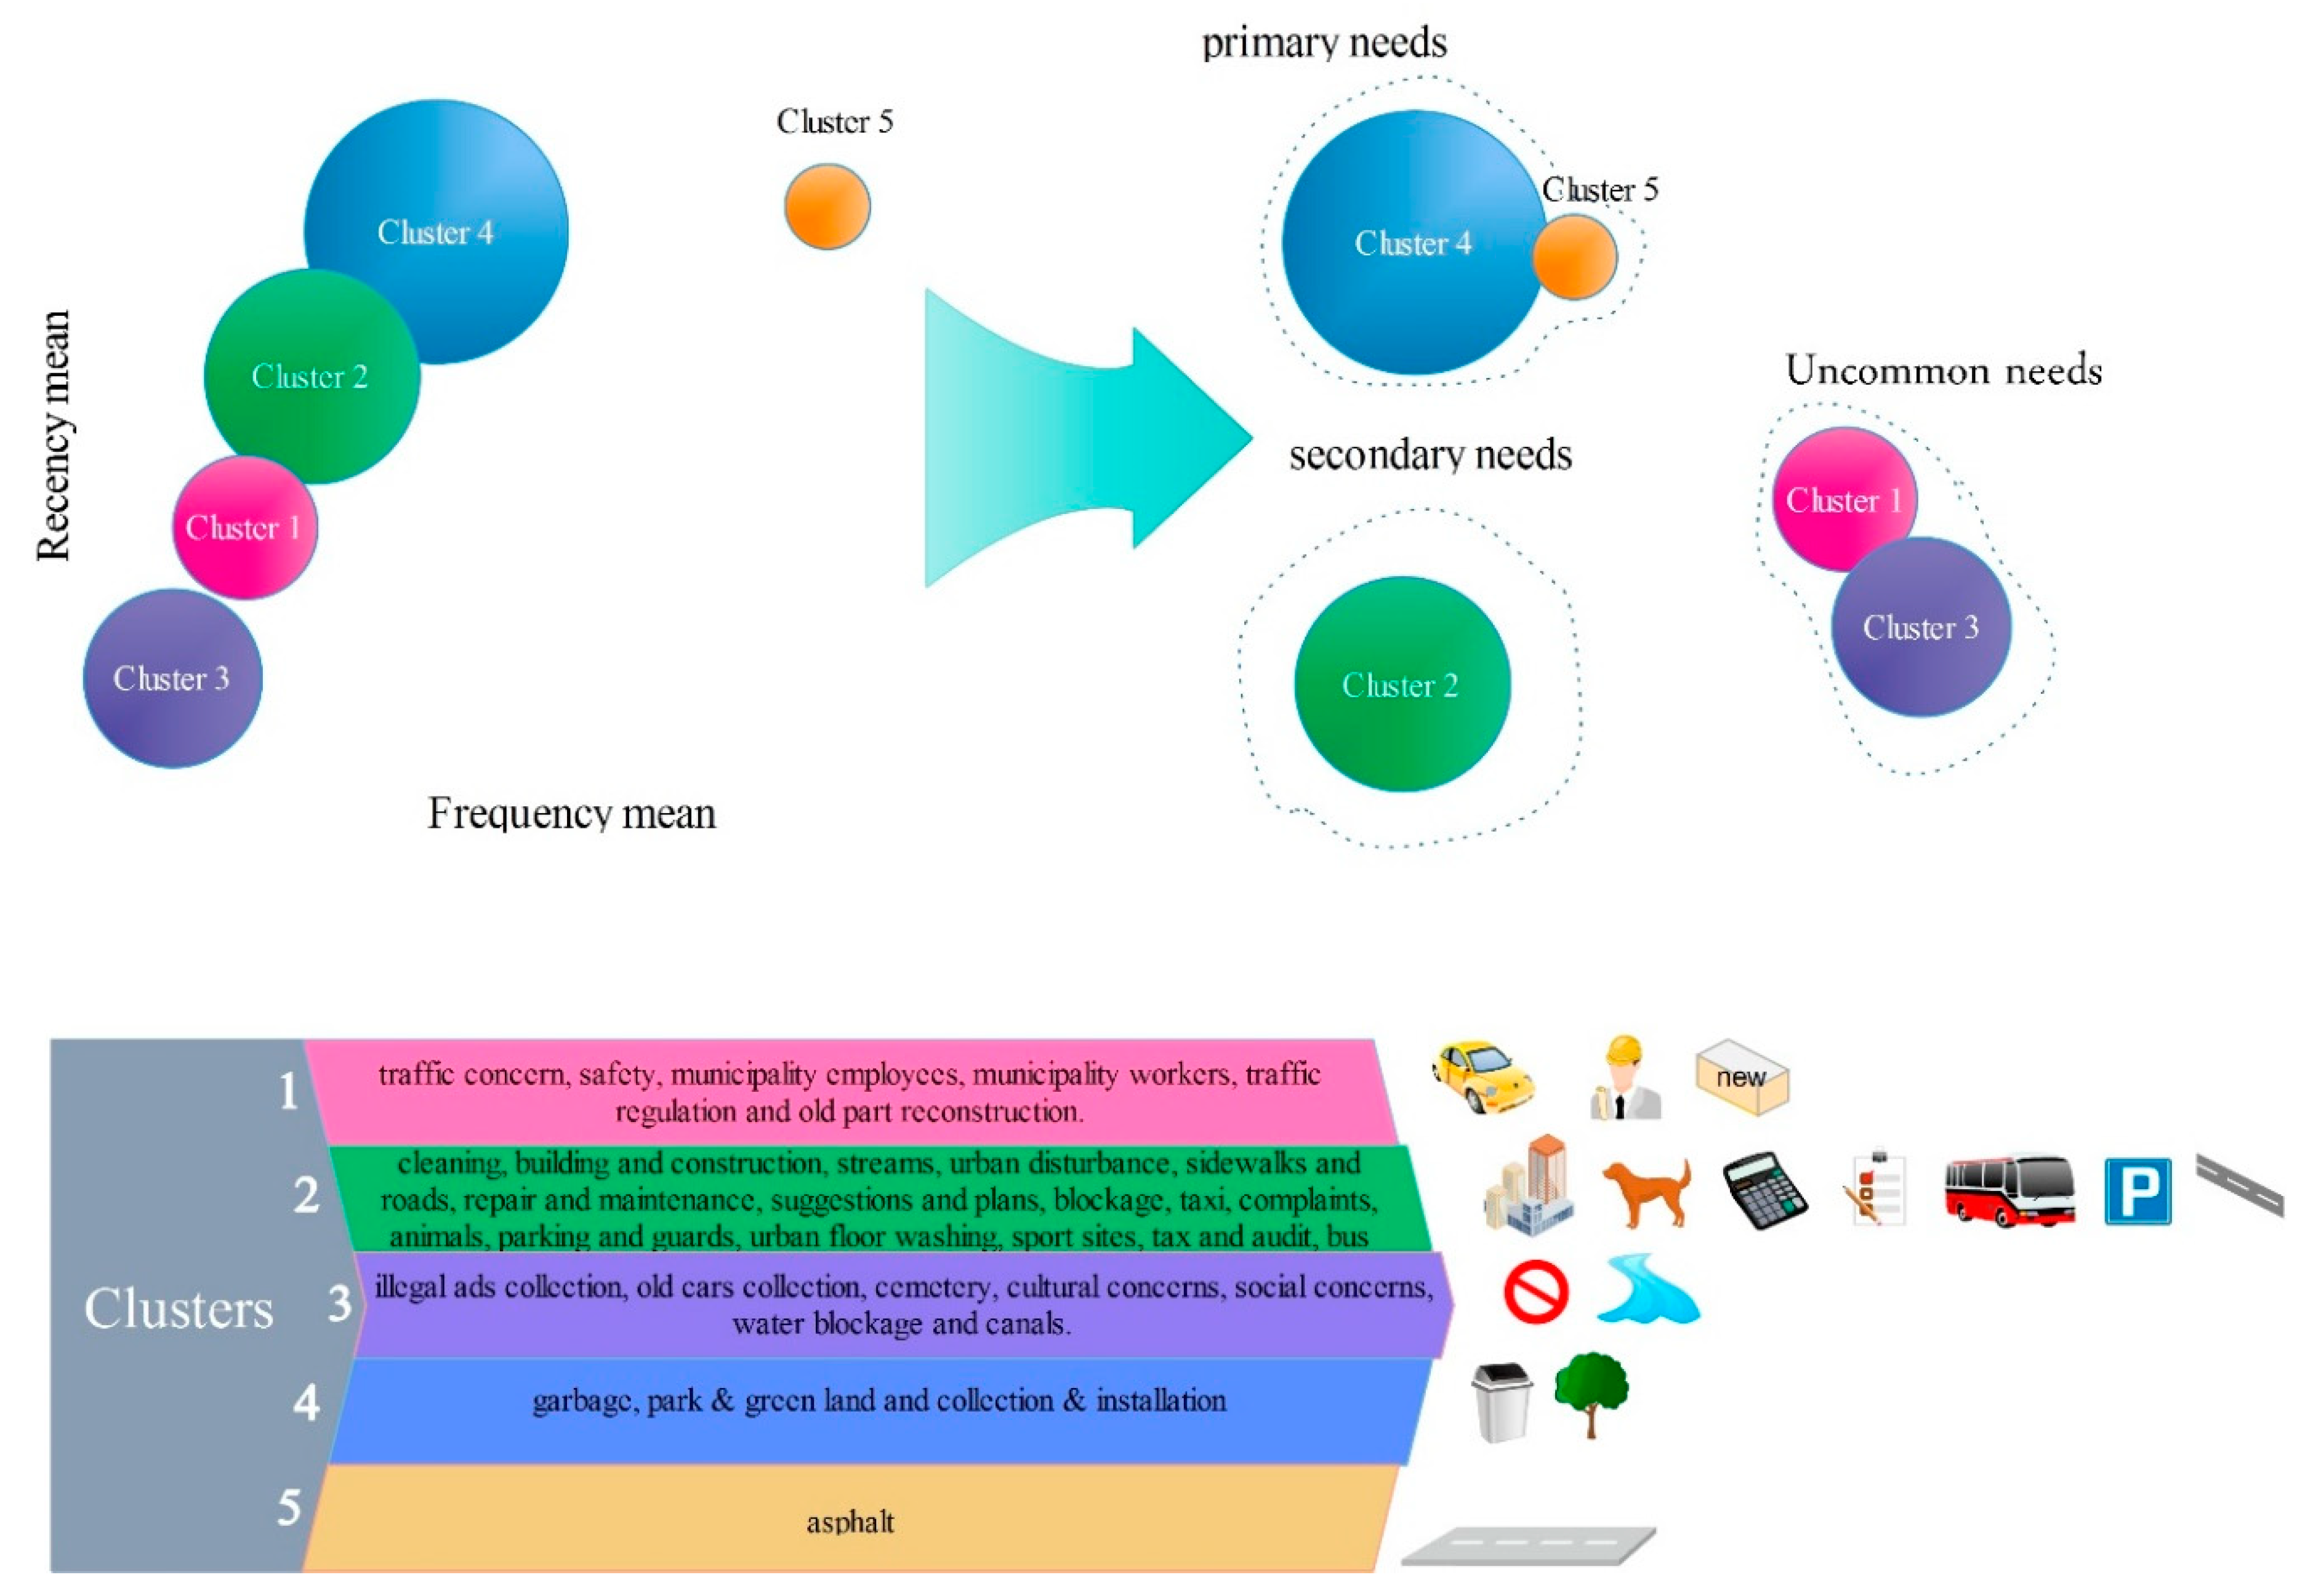
The subjects of further priorities (primary needs) have more frequency and recency and also less executive response (the definition for the objective of CiRM should be provided, based on these rules). Therefore, it should be specific measurements for these subjects. In other words, one should prioritize based on the type of subjects, the time of occurrence patterns and the performance of the executive. The RFM priority analysis highlighted more citizen-centric and assists decision-makers to revise their strategies [14].

Modeling of BA

In this section, the clustering of subjects and urban problems are formulated in the context of the BA optimization algorithm:
Defining the problem and optimality (fitness) function: The aim is to divide subjects and urban problems into clusters. In addition, the centres and a number of subjects related to each cluster are unknown. The fitness function is defined as all the elements of a subject’s distance to the nearest centre according to the second norm (Equation (1)) [23]:
m i n i n minj | | x i w j | | }
In this relationship, xi were the subjects consisting of a frequency, recency, and the value of executive response and wj are unknowns (i.e., the centres of the clusters). To measure the distance to the nearest centre, at first the distance to all of the centres was calculated, then the lowest value was selected).
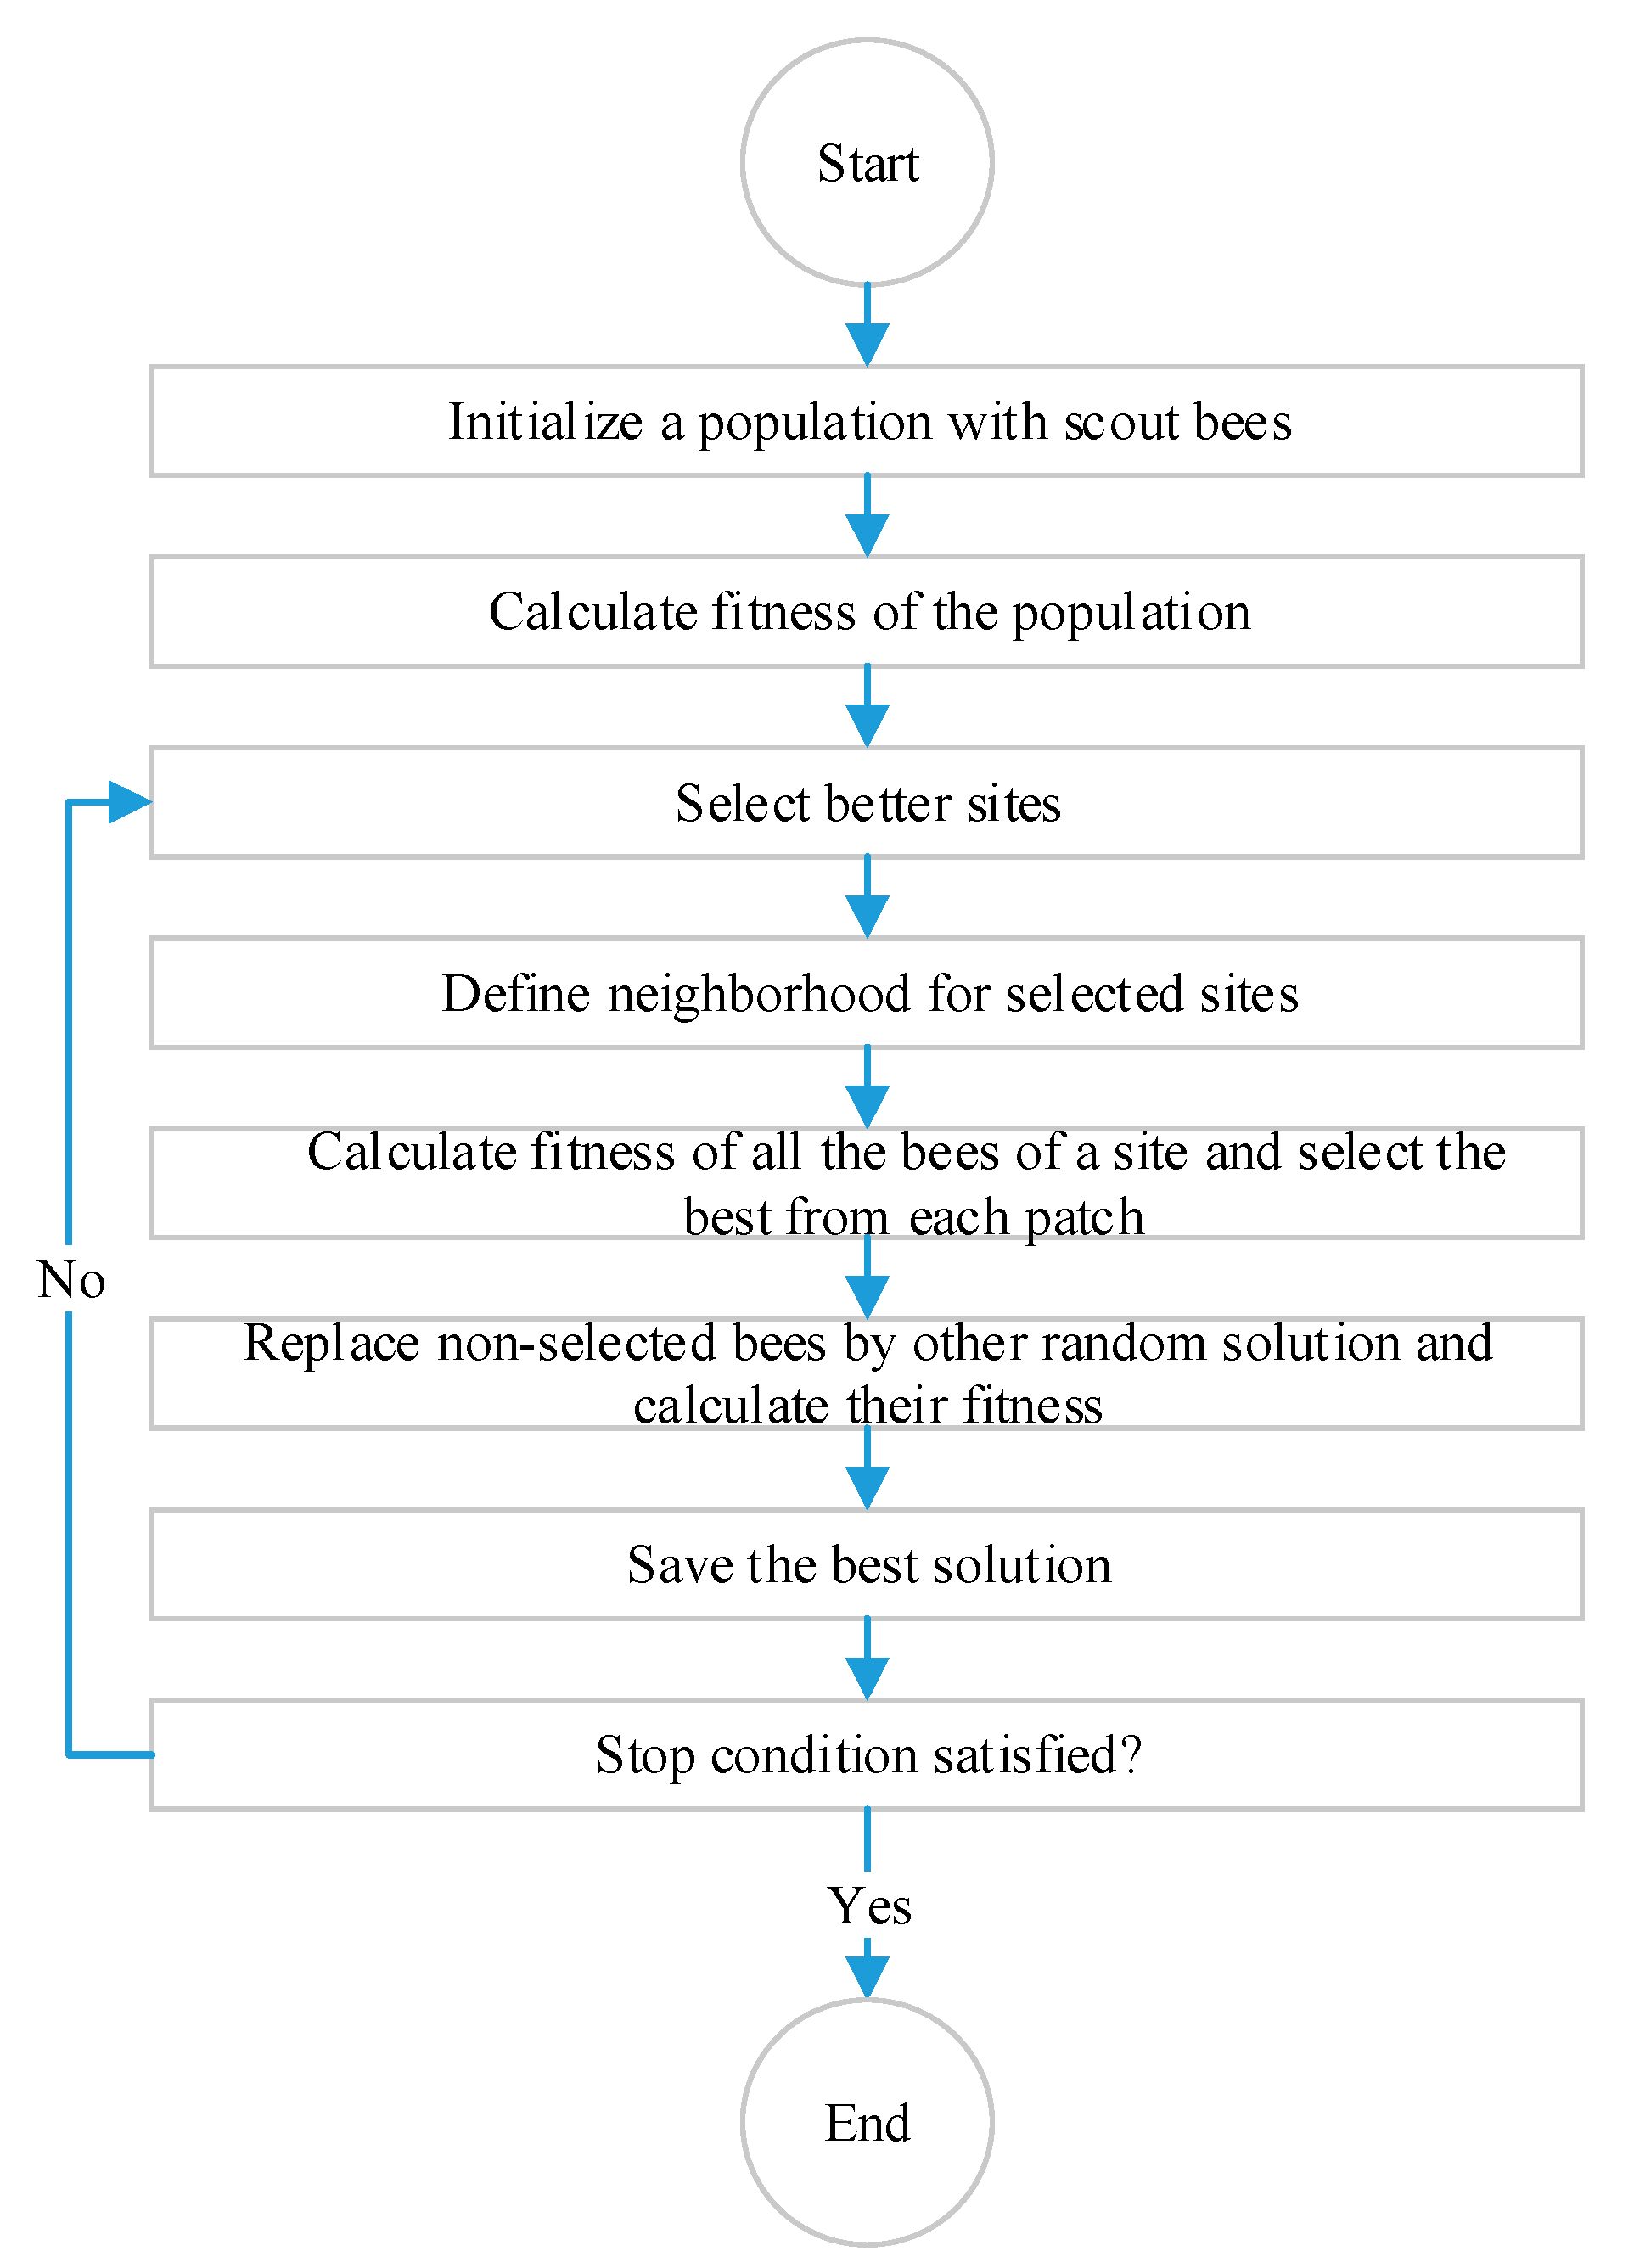
Create the initial population: firstly, n (for example, 30) scout bees were considered for the first population. For defining each bee, n centres were considered randomly in the space. Each centre defines a cluster. Then, the subjects were distributed in these clusters (centres) based on the least distance. The fitness of bee was the reciprocal of the sum of these distances [35].
Selecting better responses and sending the worker bees to them: half of the solutions, i.e., 15 bees were considered as the better responses and six of them were chosen as an elite response. To each of the elite responses, 30 bees were assigned, and the best was chosen. Nine bees were given to those designated as not elite, among which the best was selected.
Defining the neighborhood: for each of the sites (responses) having some worker bees regarding being elite or being selected; a centre was chosen randomly and the width of the space of 0.1 was transferred. As it went forward, this amount was multiplied by 0.99 to close the optimal response with a small step, so the speed of performance increased [35].
Comparing all the bees of a site and selecting the best: for each site, all the bees and the neighboring bees, which have been created, were compared and the best was selected.
Replacing the non-selected sites: those bees not selected were deleted, and replaced by random solutions.
Investigating stop condition (the number of a specific iteration): in case of reaching a specific number of iterations.

4. Results and Discussion

4.1. Results of K-Means

In this part, the results of the first method and the second method based on the K-means algorithm is shown.

4.1.1. First Method

In this section, clustering, prioritizing the citizens’ complaints (needs) and satisfaction analysis are provided according to the K-means algorithm.

Clustering

The findings of clustering are illustrated in Table 2 based on two factors (frequency and recency), which use K-means algorithm in the first method.
In Table 3, more details of clustering were offered using K-means algorithm in the first method. Two parameters which include the mean of requests during a day and the mean of the time interval between two requests were added. These two factors were computed through Equations (2) and (3) [23]:
m e a n   r e q u e s t   f o r   e a c h   d a y =   n u m b e r   o f   d a y s   i n   a m o n t h F r e q u e n c y
  m e a n   t i m e   i n t e r v a l   b e t w e e n   t w o   r e q u e s t =   1 m e a n   r e q u e s t   f o r   e a c h   d a y  

Prioritizing the Subjects Based on the Clustering

Due to limited resources and time, satisfying all citizens’ needs cannot be done simultaneously. Therefore, necessary and important needs should be identified and prioritized for actions [31]. It is notable that understanding citizens’ critical needs is very significant in CiRM, as this assists the municipality authorities to adopt better solutions.
After clustering based on the frequency and recency factors, priorities should be assigned to the needs:
Primary needs: Clusters of 4 and 5 include a high frequency and recency so that they happen every four hours. They were substituted in the same group and categorized as the first needs. Cluster 5 has nearly 25 percent of the requests, and there are between 12 to 21 requests-hour of cluster 4 subjects.
Secondary needs: the second cluster is regarded as less important than the fourth and fifth clusters because of its less frequency and recency, but, it is more important than the first and the third clusters, so the issues related to this cluster belong to the second needs, and there is a request every 1 to 5 days.
Uncommon needs: Issues of the first and third clusters have a very low frequency and recency and refer to the minor needs. That is why these two clusters were considered as uncommon needs. The problems of this group happened less because of the smallness of the city and the data collection time period (early summer) and most of them occurred just once in a month.
The findings of clustering and prioritization using K-means algorithm in the first method are shown in Figure 4.
In the bottom of Figure 4 clusters and subjects that are included, using the K-means algorithm in the first method are presented. Also, in the top left of Figure 4, clusters with their frequency mean, recency mean and the executive response means are presented. The horizontal axis represents the frequency, the vertical axis represents recency, and the radius of clusters relates to the executive response mean. For example, for cluster 5, Figure 4 indicates that frequency mean is recency mean, but the executive response mean is low. In addition, in the top right of Figure 4, the findings of prioritization using the K-means algorithm in the first method are presented.

The Satisfaction and Performance Analysis

Each successful organization wants to offer services that provide citizen satisfaction [31]. In this section, the satisfaction was analyzed.
After sending their requests to ‘137 centres’, the requests went to an employee. After fulfilling the job, a response was sent to ‘137 operators’ and the report was revised.
For each of primary, secondary and uncommon needs the executive response was measured out and is presented in Table 4. For calculating the mean of executive response, the weighted response was utilized (Equation (4)) [23]:
t = i m i × n i × p i i m i × n i
where, i is the number of clusters in each needed priority, t is the mean of the executive response for each of the needed group, m is the frequency mean of each cluster in a priority, n is the count of cluster cases and p is the response of cluster executive.
Investigating the executive performance and analyzing the satisfaction for the three groups, it was seen that the mean of executive response for each of the three groups yields a low number. The reasons might be related to the system error (as a result of it could not store responses from executives) or the executive’s error or even unacceptable performance of executives. However, primary needs reveal a low amount; although many problems exist, the municipality did not have good performance. Considering the high number of the mean of executive response to secondary needs, the municipality can heed the primary needs.

4.1.2. Second Method

In this section with a suggested method, the satisfaction analysis and needs clustering was done simultaneously. In this section, three factors were used for clustering. After the clustering, the mean of frequency, the mean of the recency, and the mean of executive function for each cluster and the number of its members were calculated. In Table 5, the clustering of the K-means algorithm of the second method is presented.
In Table 6, the more details of clustering are provided while the K-means algorithm was used in the second method. As Table 3 shows, the mean of requests in a day and the mean of recency between two requests were added. This table can also be useful for prioritizing needs.
Prioritization was done according to clustering that was carried out based on three factors and satisfaction rate and performance are evaluated simultaneously. The results of the prioritization are as follows:
Primary needs: The frequency and recency of cluster 5 are very high and the executive response is very low and it includes almost 25 percent of the requests. Therefore, cluster 5 is certainly one of the first needs. The centers of 4 and 5 have the least distance with each other. The frequency and recency of cluster 4 are high and the executive response is average. Considering the executive response that is associated with citizens’ satisfaction, it is discovered that the mean of executive response to these groups is 0.273, which is a low number. The municipality, due to the high frequency and recency and low executive response rate in this group, should adopt special measures.
Secondary needs: Cluster 2 has a high frequency and recency, and executive response to them is high. As it was mentioned, since there are higher levels of frequency and recency and the level of executive response was lower, it demands to have top priority. However, the second cluster has a high frequency and recency, but due to the high degree of executive responses, it was placed in the secondary needs. It can be considered as the cluster where the executives have better performance; therefore, citizens were more satisfied. The municipality should pay attention to this matter. The average executive response for this group is 0.589, which is higher than any other group.
Uncommon needs: Cluster 1 consists of a very low frequency and a very low mean of recency. The subjects of cluster 3 produced an average frequency and recency, and their executive response was low, so it was assigned as uncommon needs.
The findings of clustering and prioritization using the K-means algorithm in the second method are shown in Figure 5.

4.2. Results of BA

In this part, the results of the first and second method based on BA are presented.

4.2.1. The First Method

In this part, the clustering, prioritizing the needs, and satisfaction analysis based on BA are presented.

Clustering

The finding of clustering is shown based on two factors (frequency and recency) using BA in the first method in Table 7.
In Table 8, the more details of clustering were presented using BA in the first method. In this Table, the mean of requests in a day and the mean of recency between two requests are indicated.

Prioritizing Needs

After the clustering according to frequency and recency is obtained, the two should be prioritized:
Primary needs: The two clusters of 4 and 3 have a high frequency and recency; there is an occurrence every four hours and they include more than 50 percent of the requests, while this group only includes about 10% of subjects. The subjects occurred from the beginning to the end of the month.
Secondary needs: Clusters 1 and 2 have a rather average mean of frequency and recency. The centers of these two clusters have the least distance with each other. The repeatability of a subject related to this group is on average between 12 h to 15 days, which indicates the importance of this group.
Uncommon needs: The fifth cluster has a relatively low frequency and recency so they are assigned to the uncommon needs. This group includes 4 percent of the total reports. These topics occur every 7 to 30 days.
The results of clustering and prioritization using BA in the first method are shown in Figure 6.
For each of the primary, secondary and the uncommon needs, the mean of the executive responses is calculated and is presented in Table 9.

Satisfaction and Performance Analysis

Examining the executive performance and analyzing satisfaction for the three groups, it is seen that the mean of the amount of executive response for three groups is a low number. The reasons might be the system fault, the executive’s error, or even unacceptable performance of executives. However, the first need requires the least value of the mean of executive response, which indicates while there are many problems; the municipality did not have an acceptable performance toward them.

4.2.2. The Second Method

The results of the proposed method, the clustering analysis and satisfaction of needs at one stage are shown in Table 10. In Table 11 the more details of clustering are presented using BA in the second method.
Prioritization was done according to clustering based on three factors simultaneously. The satisfaction rate and performance were then evaluated. The prioritization results are as follows:
Primary needs: The fourth cluster has a high frequency and recency and a very low executive response so that every six hours there is a report in this cluster. Therefore, it is of very necessary and categorized as primary needs. Cluster 1 has a high frequency and recency in a way that the occurrence of the subject reported in this cluster is one case a day at least. Clusters 1 and 4 have three subjects of the total subjects (33), but contain 36 percent of all the requests. They are considered as primary needs. The mean of executive response for this is 0.524 which is almost a low value, and the municipality should do what it takes to solve the problem.
Secondary needs: The third cluster has an average frequency and recency and low executive response. This cluster could be the most significant after clusters 1 and 4, so it is categorized as secondary needs. This group possesses most of the subjects in a number of cases in which it includes 60 percent of the reported subjects. There are between 2 to 41 requests of these subjects during the month. The mean of executive response was 0.244 for this group.
Uncommon needs: The second cluster has a low frequency and recency and a high executive response. Seldom did a request that belonged to this cluster occur during the month; however, it was examined by the executive. Therefore, it is categorized as uncommon needs. Cluster 5 has a very low frequency, recency and executive response and it includes about 3 percent of the total requests, so it is placed in the uncommon needs’ rank. The mean of executive response for this group is 0.495.
The results of clustering and prioritization using the bees algorithm in the second method is shown in Figure 7.
In Figure 8, the output of every algorithm in the two methods is shown.
Considering the outputs in Figure 8, in the first method the result of K-means clustering is different from BA. In the second method the subjects being the same in frequency and recency are not in the same clustering and the mean of executive performance has been effective in the performed clustering.

4.3. Comparing the First and Second Methods

The aim of this part is to compare the first and second methods of every algorithm. Considering the results of K-means in the first method (Table 3), which was based on two clustering factors, it could be observed the domain of change of frequency and recency for clustering is less than the method according to three factors (Table 6), but the range of changes in the executive response degree is more in a way the domain of changes of executive function reaches to 1.280 in the first method, but in the second method, it is still less than one. Like the K-means algorithm, in BA, in the first method which was based on two factors of clustering, the domain of frequency changes and recency for clusters are less than the method to be clustered based on three factors, but the domain of changes in executive function degree is more.
Now if the difference, in terms of the priority and performance analysis, between the two methods is investigated, it can be seen in the first method of K-means and BA, the difference of executive function between different prioritization are so low. However, in the second method of these two algorithms, the variances between the values of executive response in prioritization has more difference. As it was mentioned, needs with more frequency and recency and less executive response will have more priority. This subject in the second method in prioritization is more significant. For example, in the first method of K-means park and green space, is the primary needs for a high frequency, but in the second method it is considered as the secondary needs because of the highness of executive response degree. On the contrary, in the second method, subjects like cleaning, urban disturbances, and sports sites have less citizen satisfaction due to a weak executive performance and are of the first priorities. For example, in BA, in the first method, collecting and installing and cleaning as having a high frequency categorized as first needs, but it is categorized secondary needs in the second method.
The basis of the prioritization is that any need having a high frequency, recency, and a low executive function belongs to the first needs. So comparing the two methods, the prioritization is investigated, and the done prioritization in each method is estimated according to the mentioned conditions.
In this study, to quantify the prioritization by each method, each of the three factors was given the same value. The difference is that the value of the frequency factor and recency is (+1/3), but the value of the executive response is (−1/3). In Table 12, the mean of frequency, recency, and executive response for each of the priorities are presented for each method for the two algorithms.
The results in Table 12 should be normalized so that each parameter has a similar effect on the calculation of the final priority. After normalizing, the mean of frequency and recency are multiplied by (+1/3) and the mean of the executive response is multiplied by (−1/3) then they add up to each other in which 0.666 is the most amount for every priority. The method is better at priority when its primary priorities are close to this number and its uncommon needs are close to zero. The results are listed in Table 13.
Considering the results of Table 13, the minor needs in the two methods for each algorithm are zero, but the primary needs in the second method have a higher number than the first method. It shows the second method’s superiority. Also, the secondary needs in the second method have a higher number than the first method. The result is better when the index of secondary needs is far from the primary and uncommon needs. Accordingly, in each of the two algorithms, the second method of prioritization has the best acts.

4.4. Comparing K-Means and BA

In order to compare the algorithms from the cost function, the results of prioritization and clustering validation were used.

4.4.1. Result of Prioritization

In this section, two algorithms which were done for prioritization are investigated. Considering the results of Table 13, the index of the primary needs of K-means algorithms in two methods is better than BA. The K-means had a better performance. It can be observed that BA algorithms in prioritization and then in clustering in the second method could not repeat the success of the first method.

4.4.2. Clustering Validation

The most important aim of this part was to discover the different capacity of algorithms for clustering to divide different urban needs.
Cluster validation is a term related to the process of evaluating clustering results. There are numerous different indexes for allocating to a different algorithm performance for clustering the data. They can be used to compare how well various data clustering algorithms behave on a set of data [36]. In this study, Calinski-Harabasz index and Silhouette index were utilized for comparing clustering quality.
Calinski-Harabasz (CH) is an index based on the concept of analysis of variance between groups (ANOVA). It is a ratio type index where the cohesion is calculated according to the distances from the points in clusters to their centroids [36,37]. There is no particular limit for CH. It means that the more CH is, the better the clustering is [37].
The Silhouette width is a ratio-type index, which rests on comparing the within-cluster cohesion, based on the distance to all entities in the same cluster, to the cluster separation [38]. The silhouette value for each point is a measure of how similar that point is to the ones in its own cluster when compared to points in other clusters [39].
The silhouette value ranges from −1 to +1. The closer it is to 1, the better the clustering is done. In this research, the average Silhouette value of all points is used as a measure of overall clustering quality.
In Table 14, CH index and S is provided for each algorithm in two methods. It should be mentioned that the result of clustering is so relevant to the first position. So the finding presented in this table for two indexes is the performance mean of 5-times on algorithms run.
The higher the amount of CH and S, the better the clustering, so the BA had a better performance. Also, in the first method, these two indexes for BA are considerably better than the K-means algorithm, but in the second method, there are almost the same.

5. Conclusions

Cities can be seen as a complex systems comprising multiple levels of operation and relationships across different urban domains, so it is rather hard to discover a parsimonious depiction of civic function. However, city managers, policymakers and other kinds of social participants, including companies and shareholders, could profit from an intuitive proxy of neighborhood circumstances across the city. Simultaneously, such simple indices could provide useful data to help municipal decision-making. As the quantity and heterogeneity of urban data have increased, data mining has become a feasible tool to enhance our understanding of civic space to guide urban management and strategy. These data are commonly referred to as 137 requests in Iran, and represent a broad variety of issues posed by urban inhabitants, providing a distinctive measure of local civic features, situations, and service levels. While possibly influenced by the self-reported nature of demands and criticisms, these data provide a comparable metric of perceived local quality of life across space and time. These data, therefore, serve as a helpful tool for knowing the provision of critical urban services and circumstances in the neighborhood [20].
Citizen Relationship Management (CiRM) is one of the key issues in citizen-centered e-government. E-governance can be extremely helpful in enhancing government operating effectiveness and enhancing the provision and quality of public service. Citizen-centered strategies such as Citizen Relationship Management (CiRM) will allow organizations to attain vital effectiveness profits, improve rates of service delivery, increase citizens’ use of public facilities, and improve the standard of living [40].
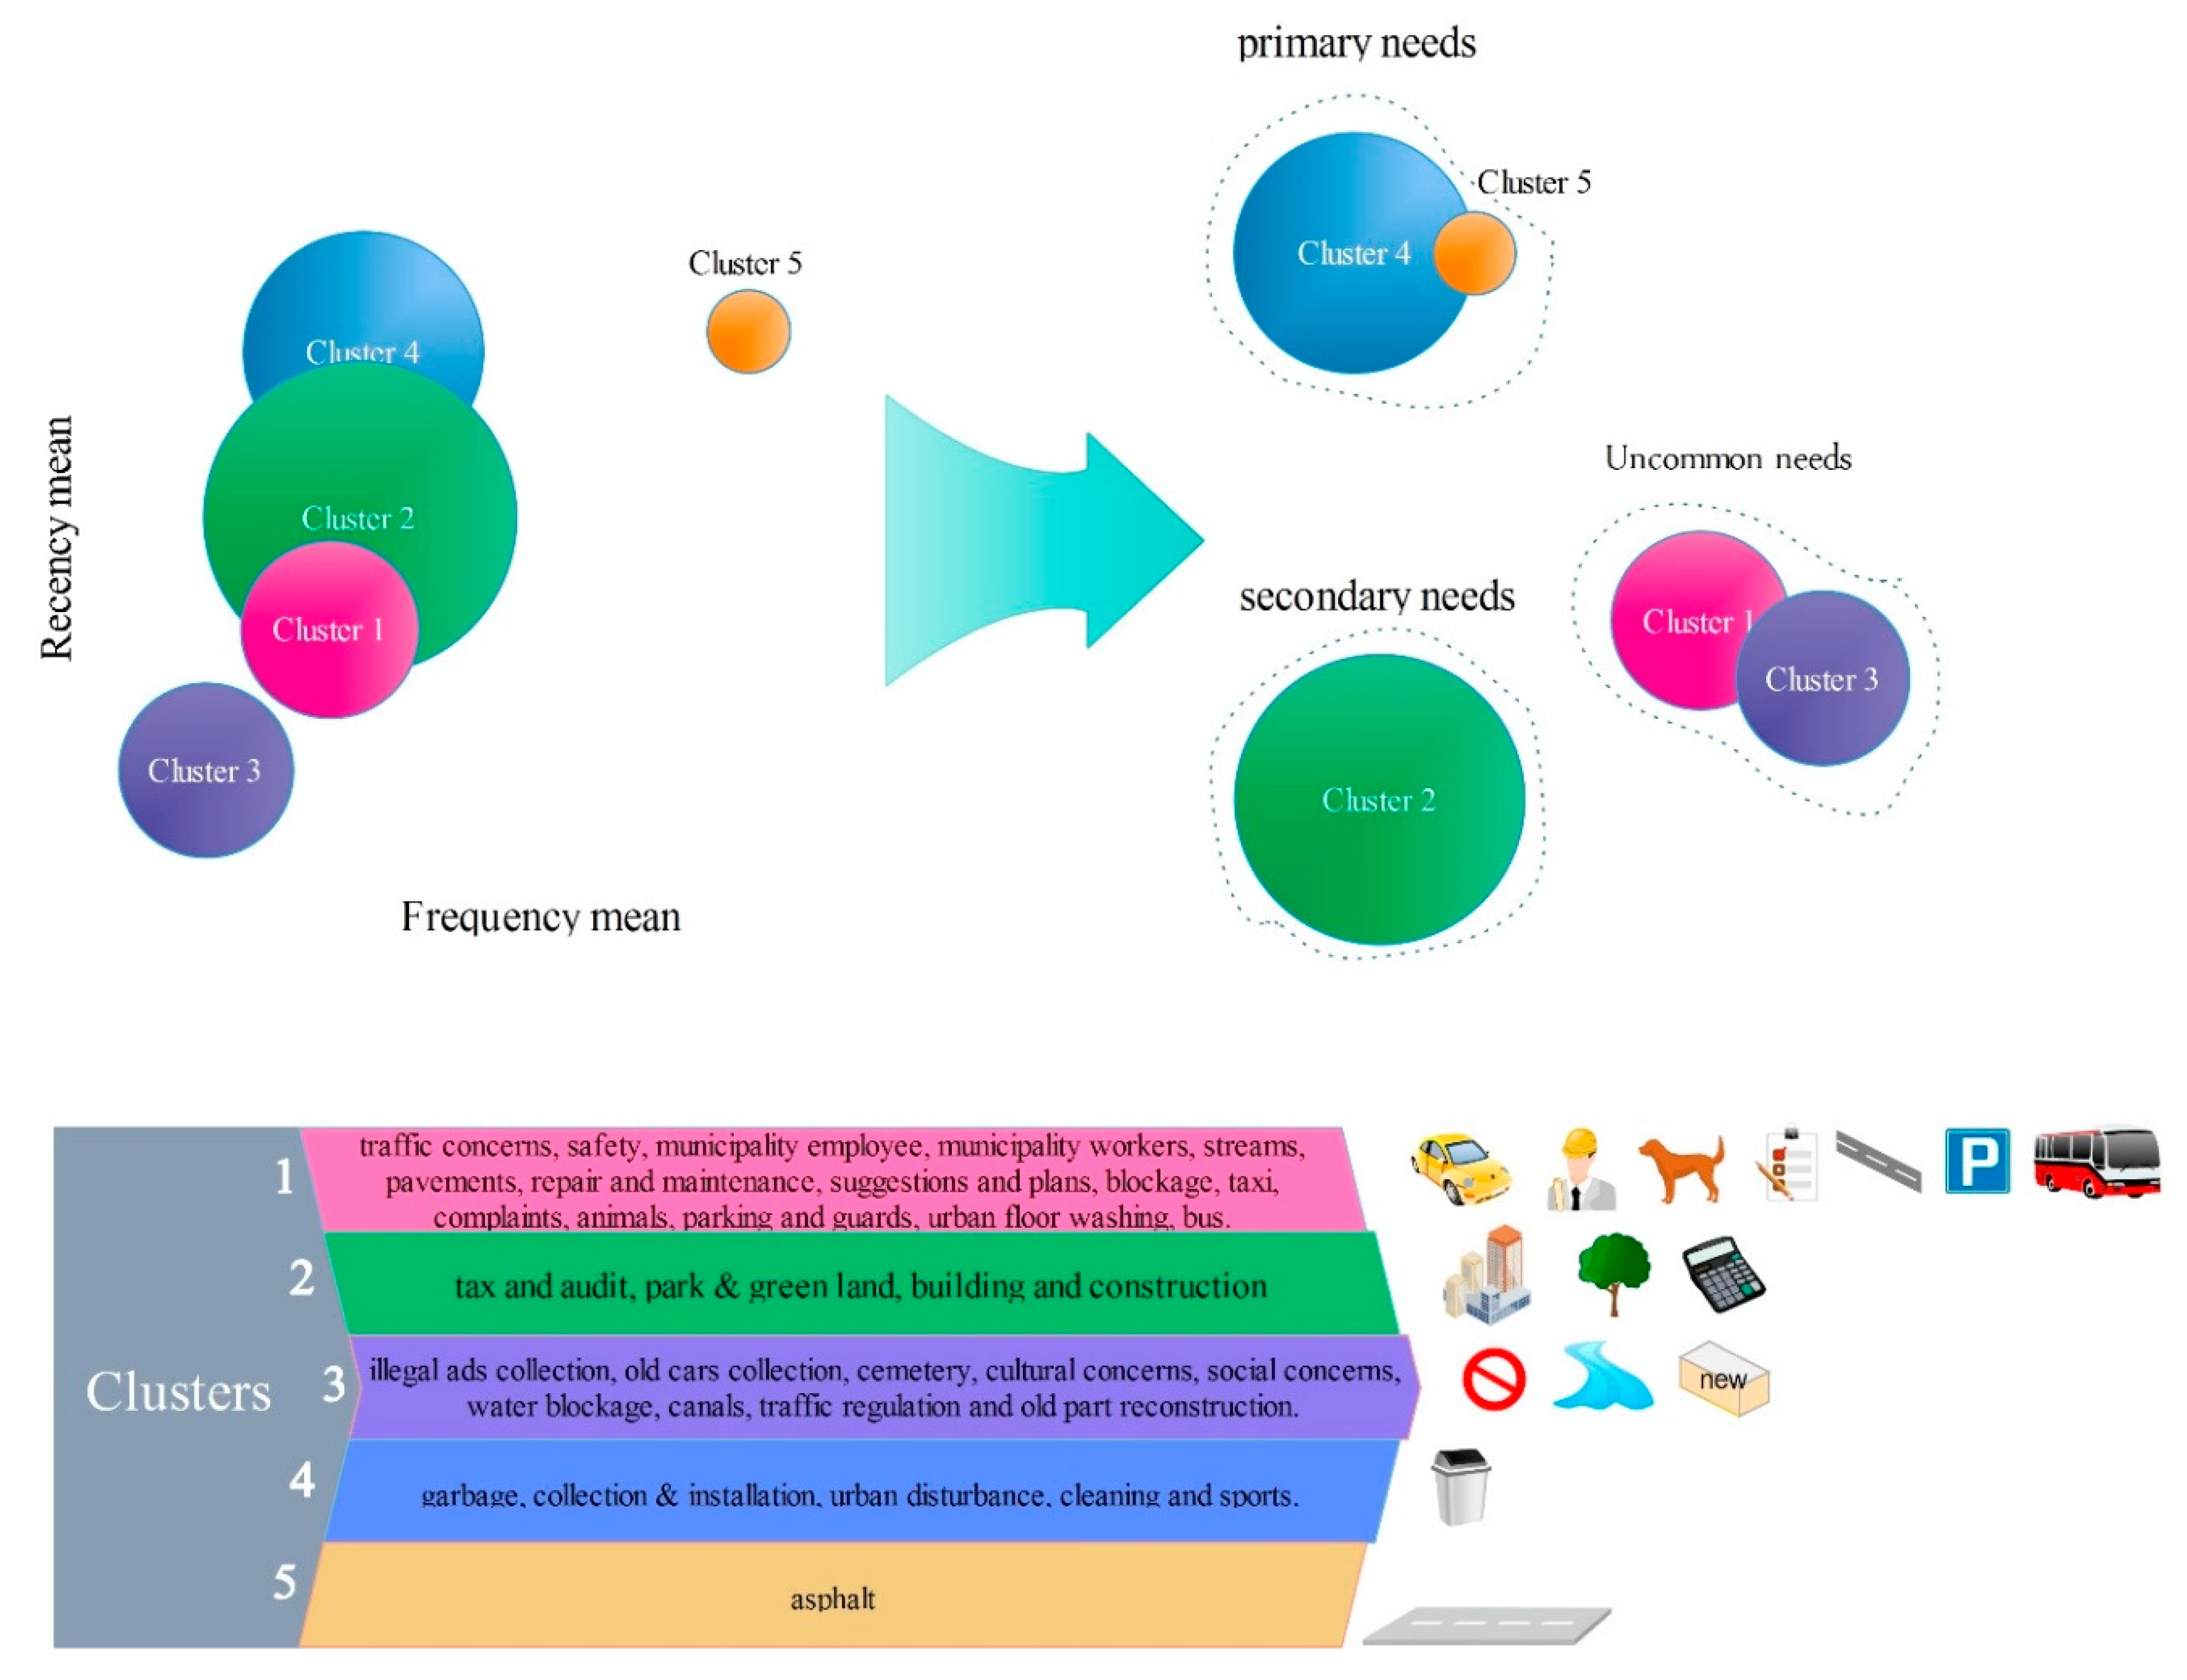
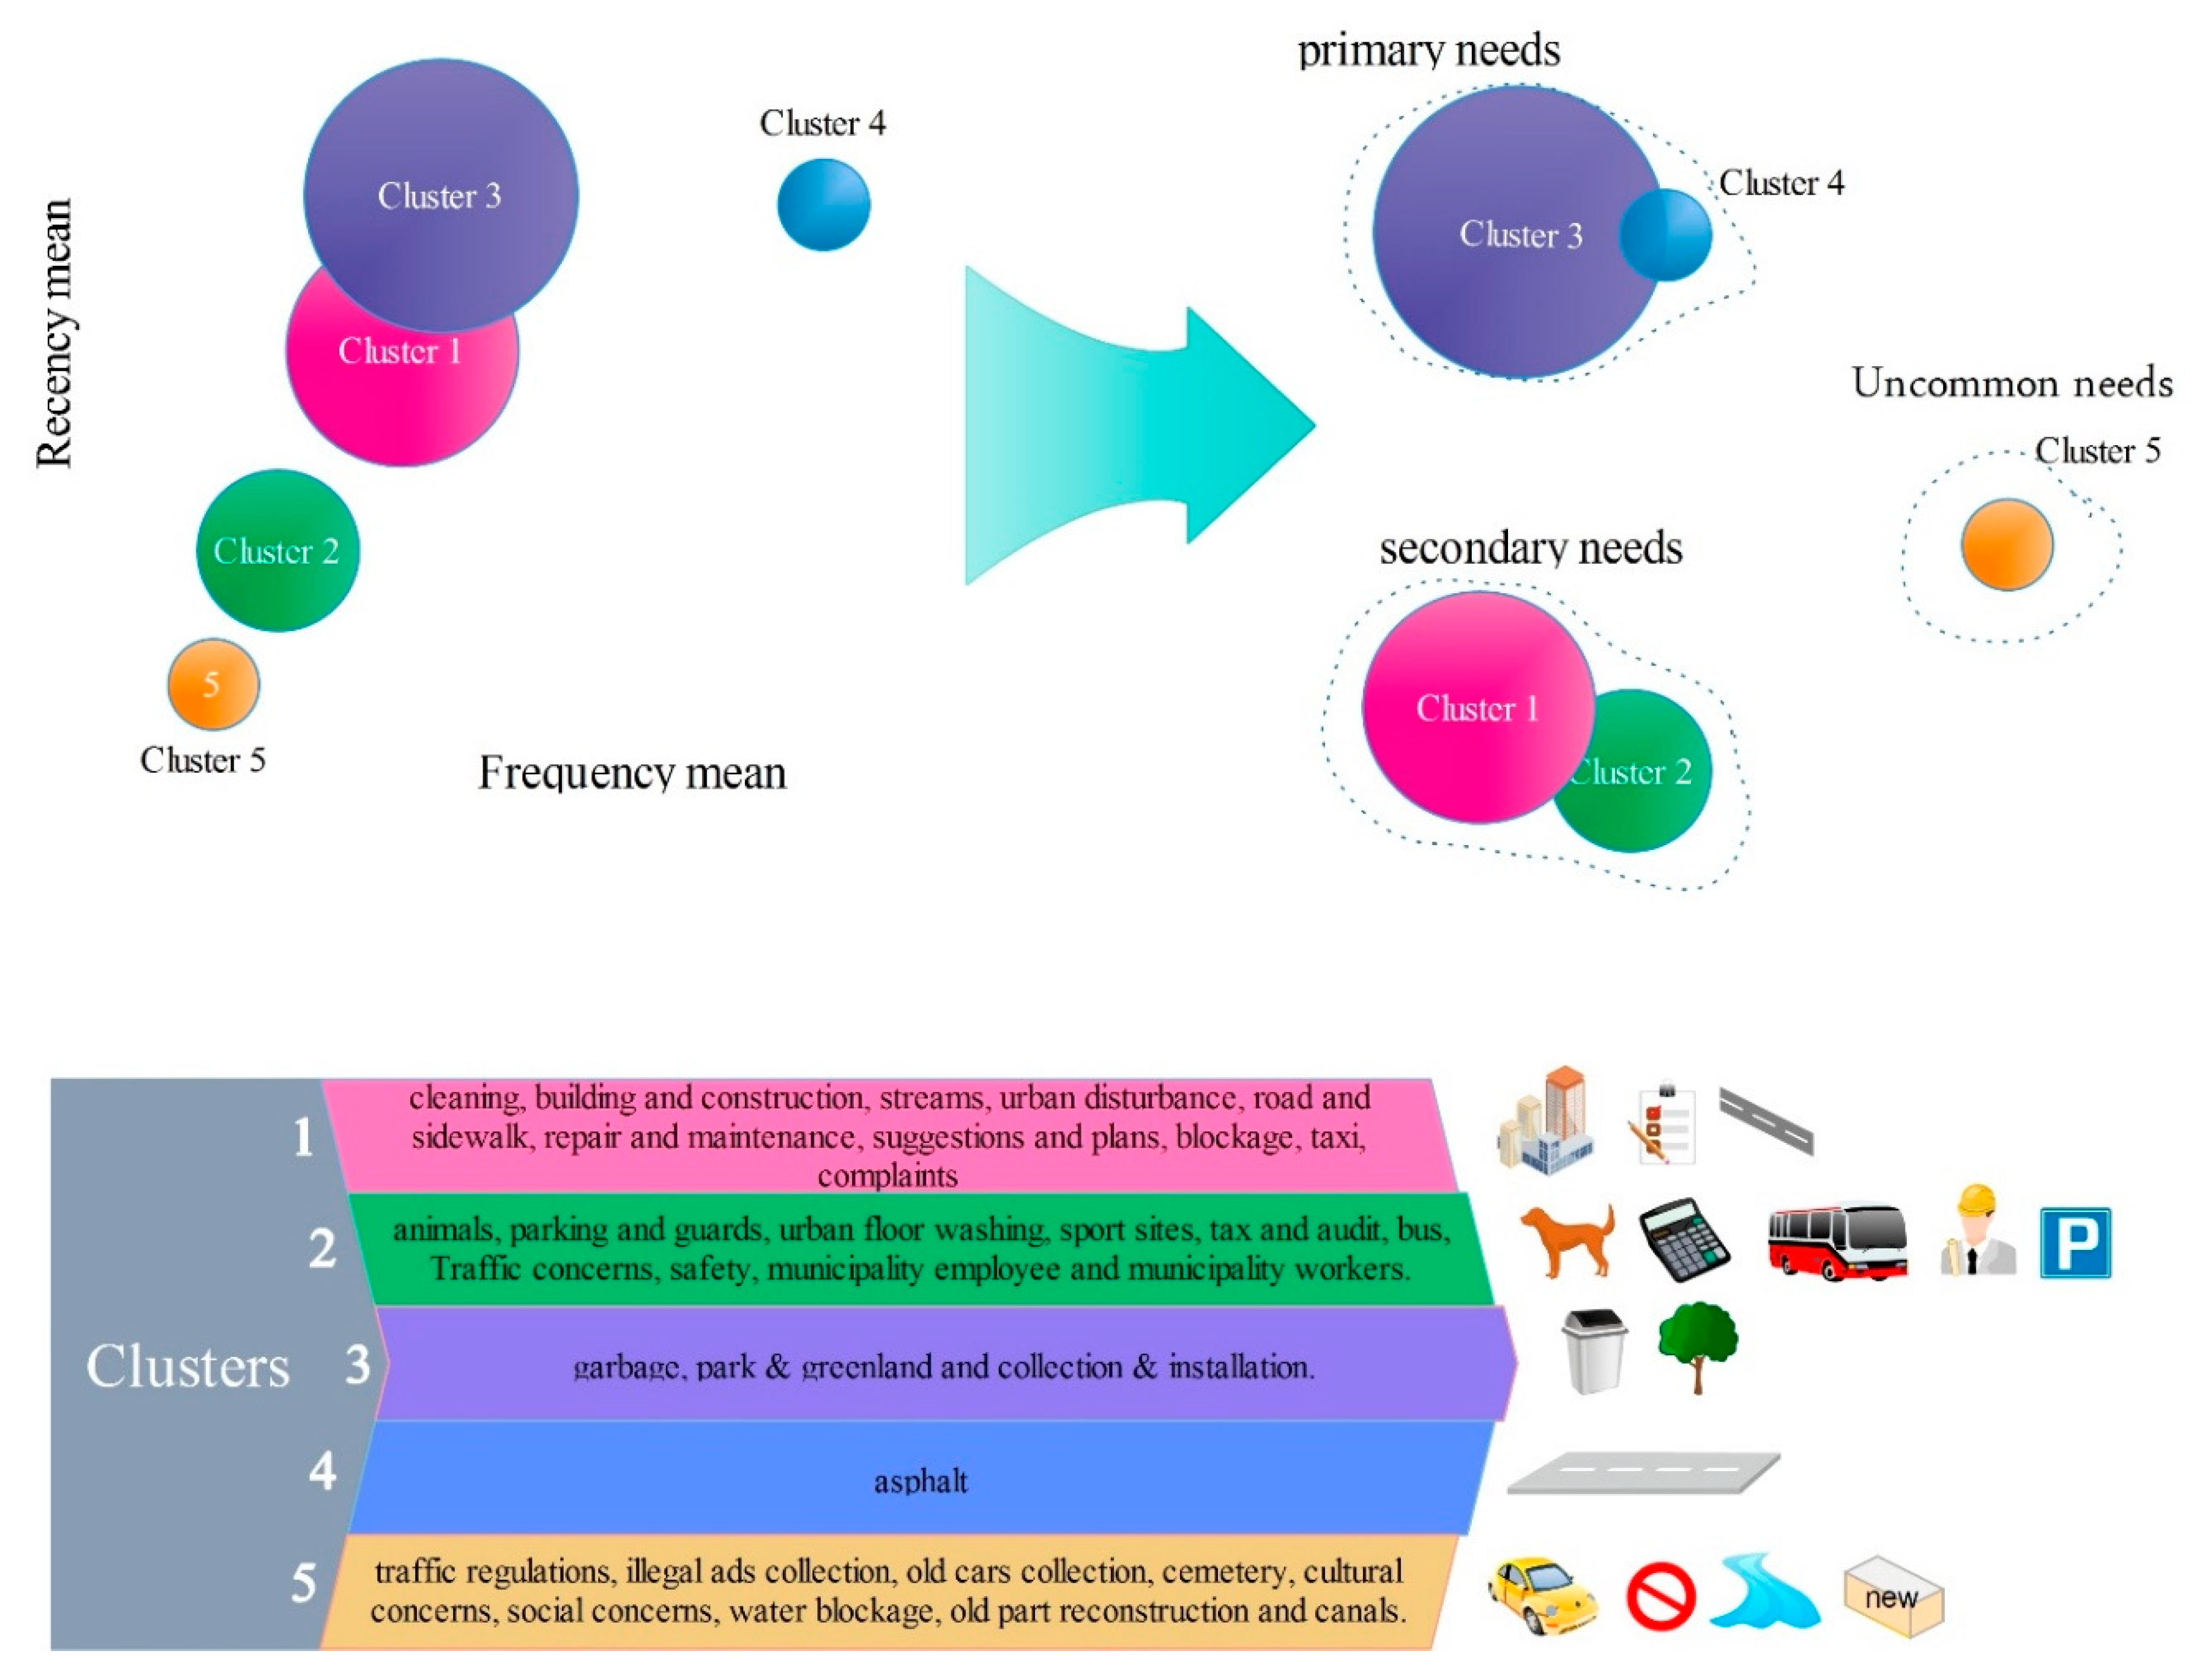
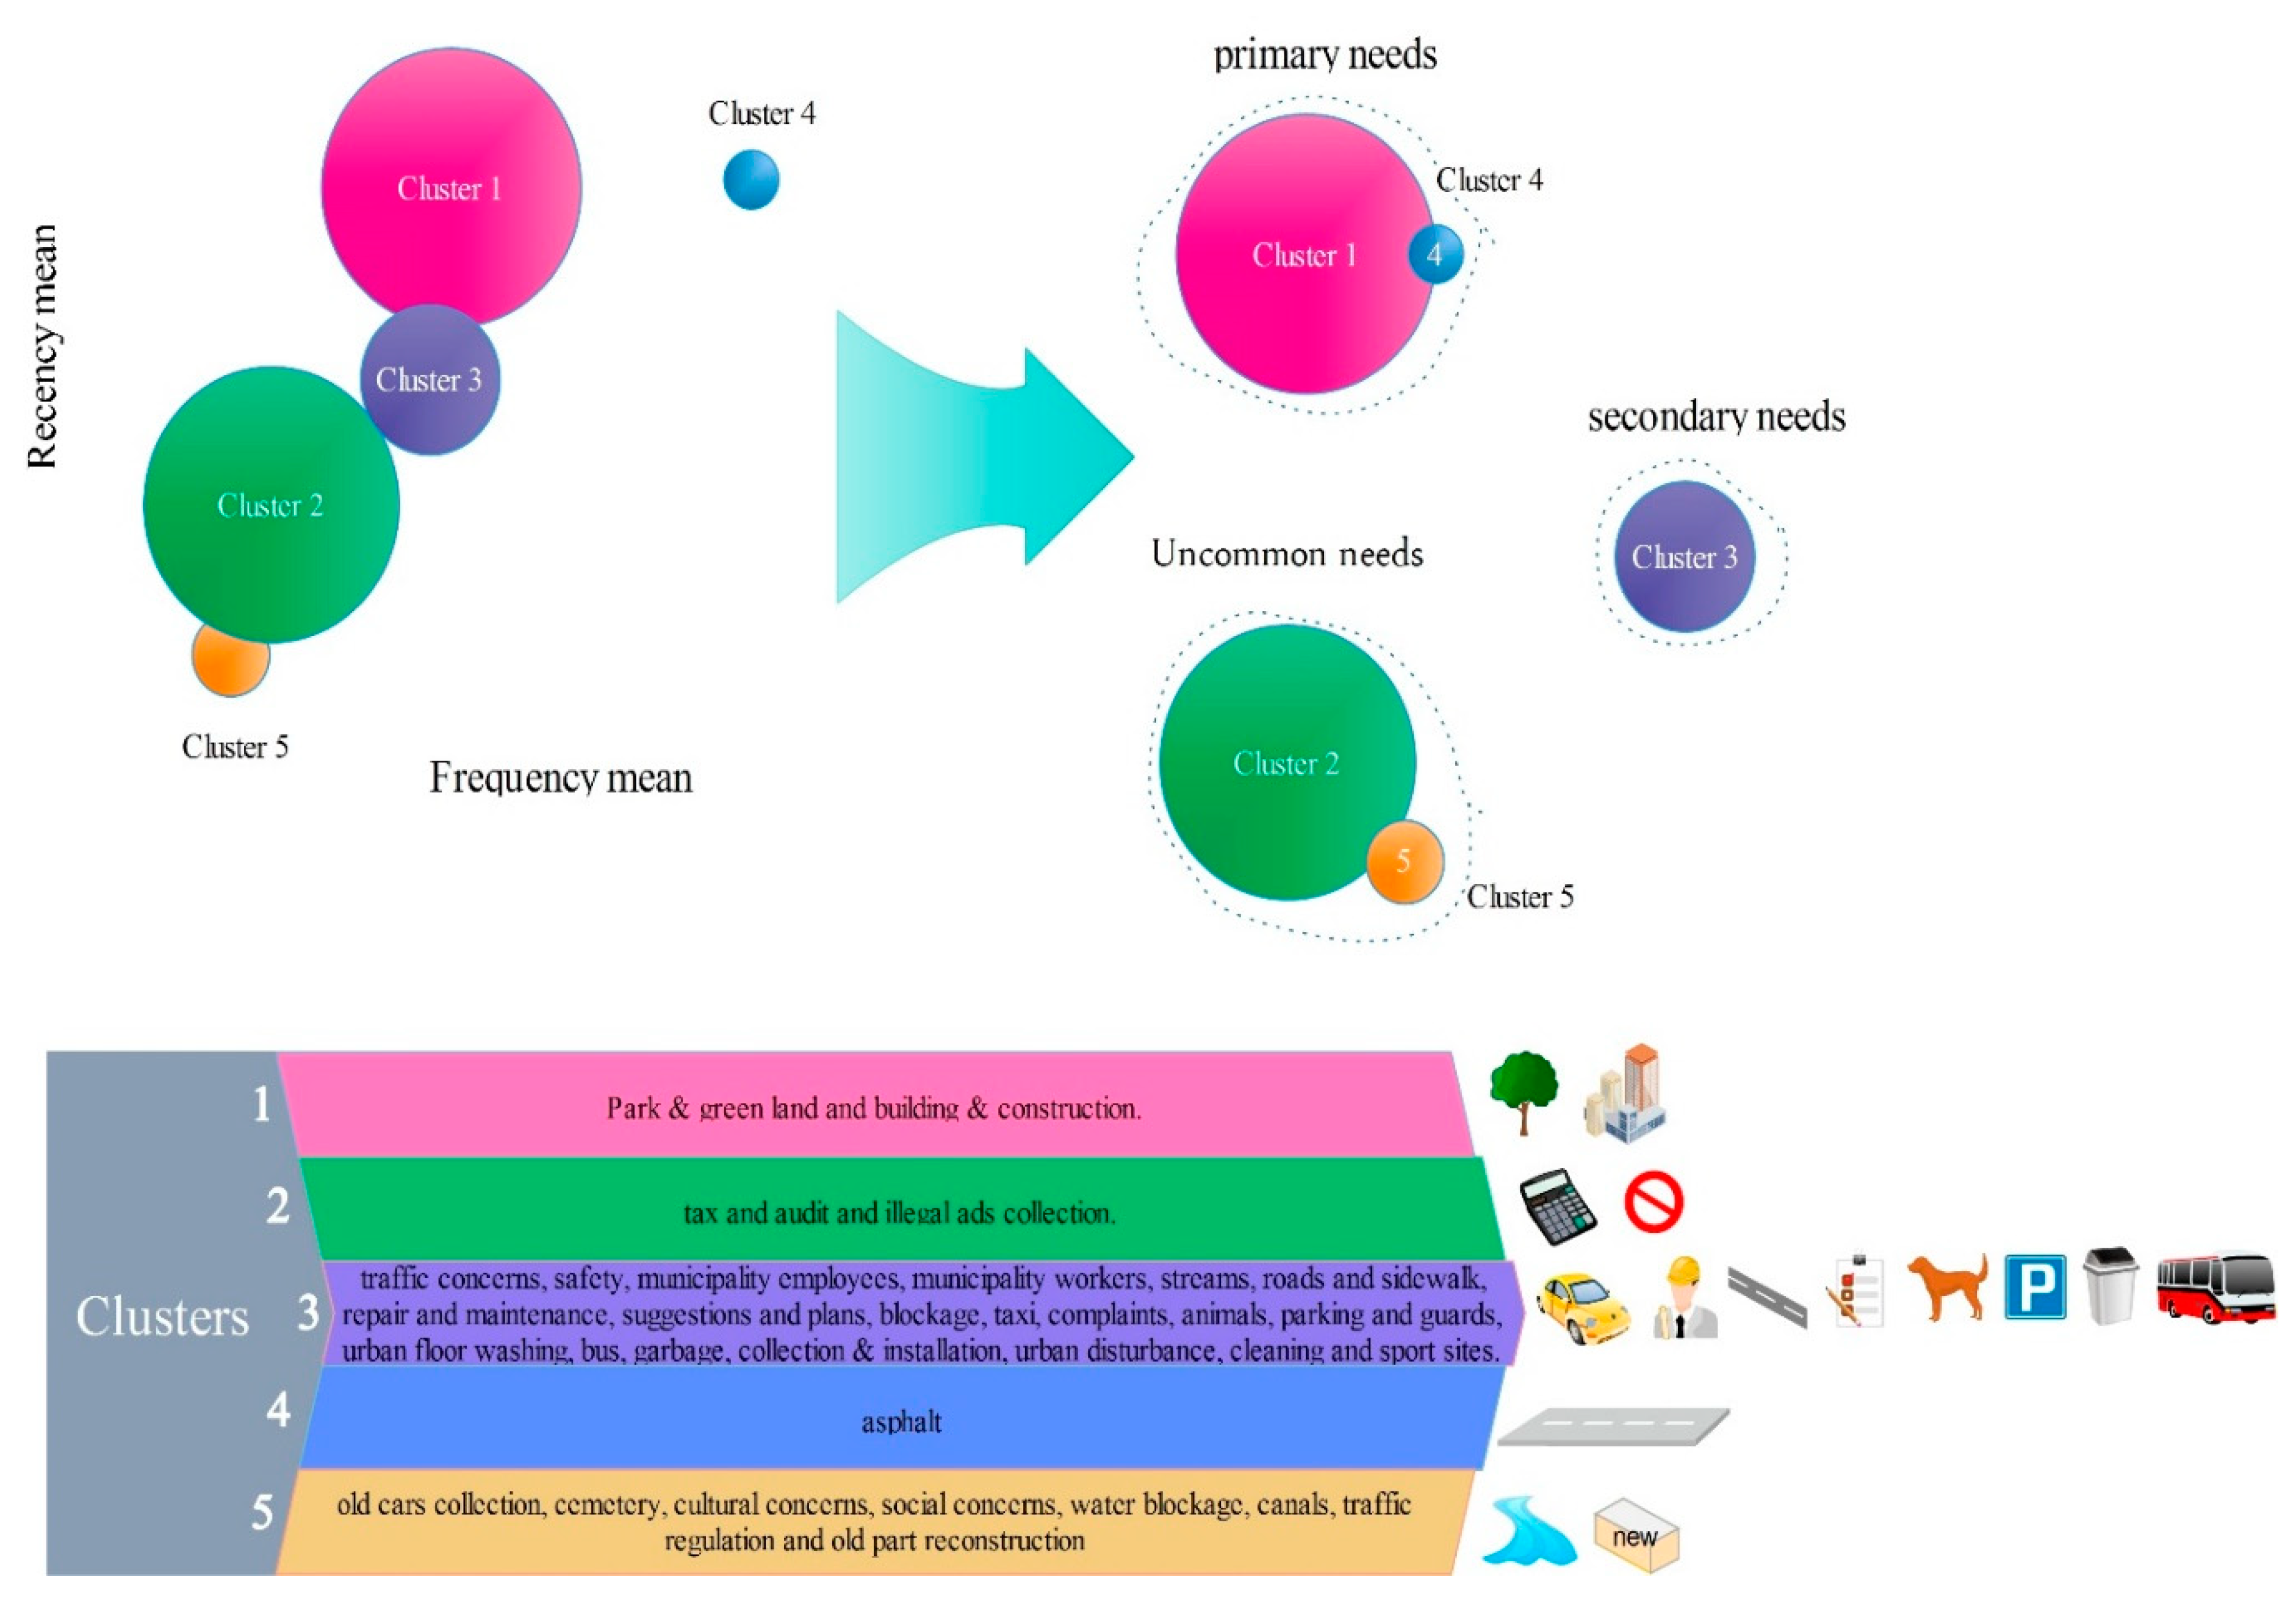
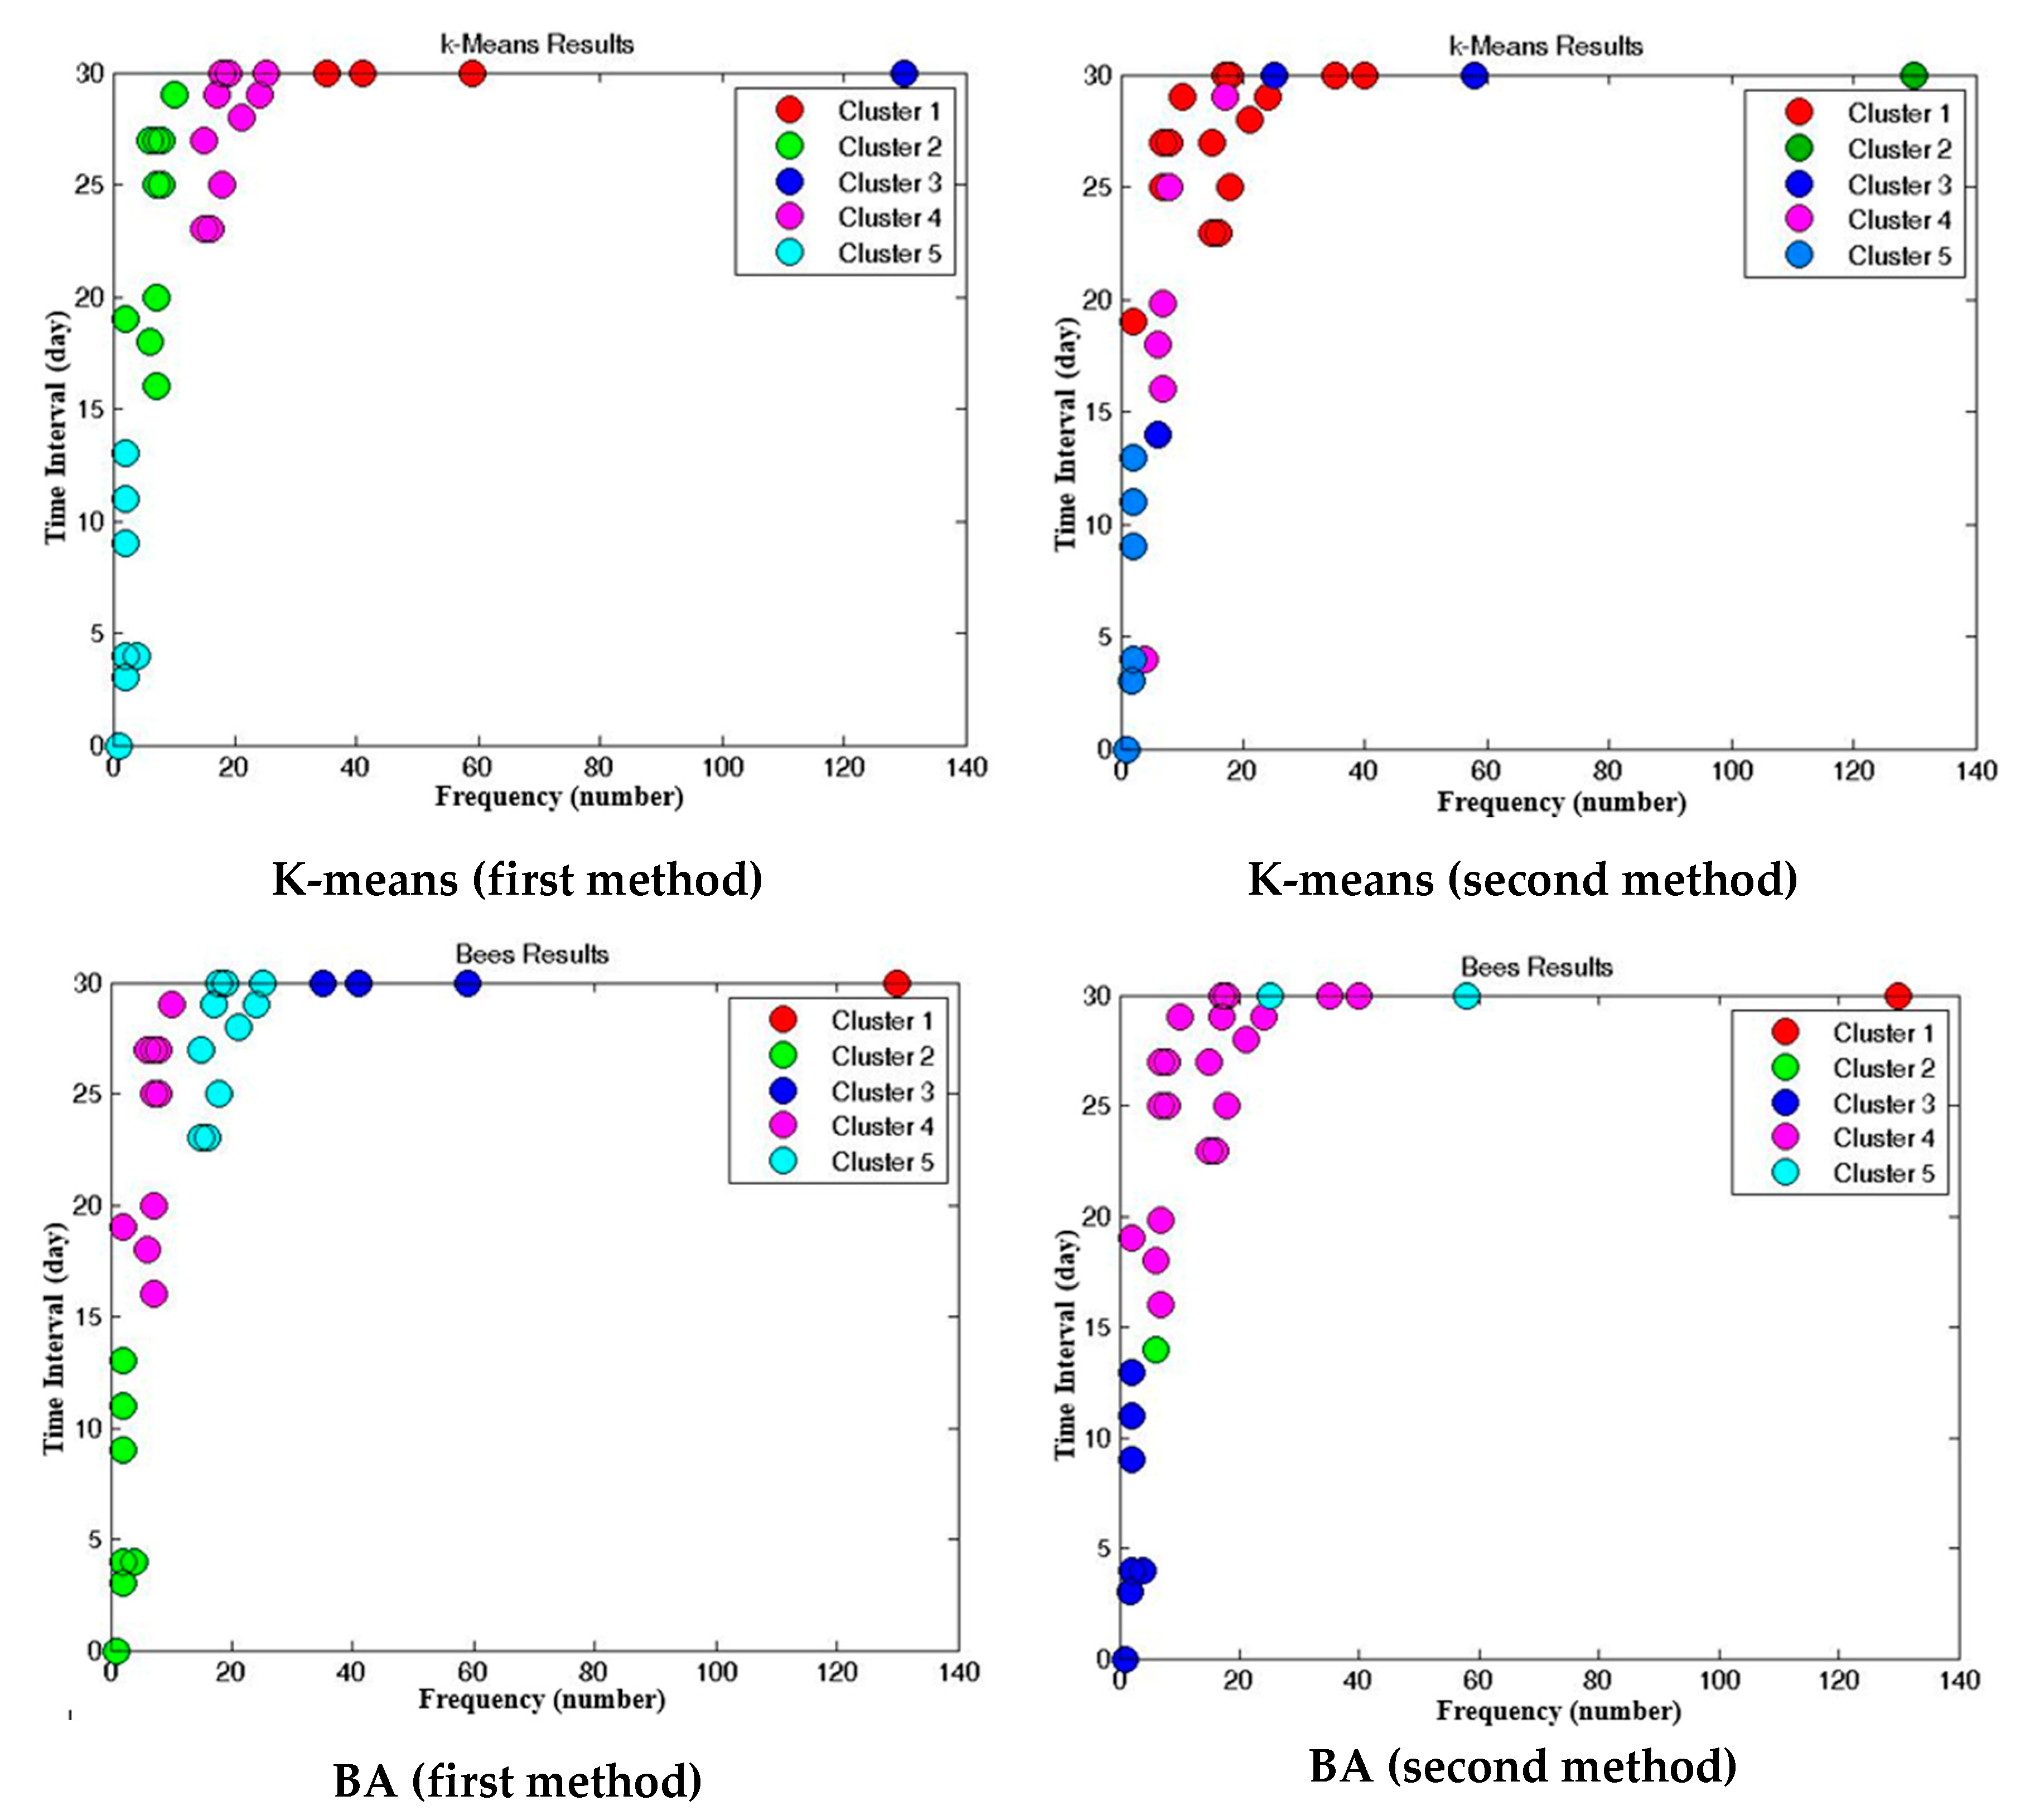
The main aim of this research was data-mining of a citizens’ complaint system, to prioritize the urban needs and to estimate citizens’ satisfaction. In this study, two methods for clustering, prioritizing the needs and estimating the satisfaction were implemented. In the first method, the needs, firstly, were prioritized according to two factors of frequency and recency and then the estimation of satisfaction was done. In the second method, through a new approach, the need prioritization and clustering was done according to three factors, and the estimation of satisfaction was done simultaneously. In the first method, if we want to estimate the primary needs, it is possible that the third condition (lowness of the executive response) is not satisfied; however, the increase in the frequency change domain and recency is one of the faults in the second method. In this study, to compare the clustering in the two methods, a quantitative index was presented. The result of the comparison of parameters showed the second method’s superiority. The index of the second method for the primary needs in K-means method was 0.299 more than the first method and in BA was the same in both methods.
The second proposed method could be used as a new method to prioritize. The municipality can use this method to identify citizens’ needs and estimate their satisfaction. In this research, two algorithms, K-means and BA, were used for clustering. To compare the results of these two CH and S indexes were used. BA had a higher CH and S index. Therefore, it was better in clustering. According to the final prioritization done by the two algorithms in two methods, the primary needs included asphalt, so specific schemes should be considered. Subjects like streams, sidewalks and roads, repair and maintenance, suggestions and plans, blockages, taxis, complaints, animals, parking and guards, traffic concerns, safety, municipality employee, urban street cleaning, municipality workers, tax and audits and buses are among secondary needs and uncommon needs were related to subjects like traffic regulation, illegal ads collection, old cars collection, cemeteries, cultural concerns, social concerns, water blockages, old part reconstruction and canals. Subjects like cleaning, building and construction, sport sites, urban disturbance, garbage, park and green land and collection and installation were among those needs that in both methods and algorithms have not shown a unitary priority and have varied between primary and secondary needs.
With the aid of the results, planners can analyze citizen service data to get a clearer knowledge of citizen satisfaction with municipal services performance. Also, they can identify citizens’ service needs and provide important information to government administrators. Furthermore, the results of algorithms can increase the effectiveness of city plans by informing short- and long-term resource allocation policies. The outcomes help to recognize what issues need immediate action. The results of prioritization can also be used as quantitative indicators of the perception of citizens on different urban-related issues. The findings can also be used to find the most affected regions. They can be used to design strategies for timely and proactively enhancing the service infrastructure in a community. This also leads to better use of government funds through smarter actions and stronger investments with measurable quantitative effects. This can inform the local government to be prepared for emergencies by knowing possible high demands on specific requests in particular areas. Our results demonstrate the importance of descriptive results in offering new perspectives into the needs of citizens.

6. Recommendations

Some issues and aspects were not considered in this study. The development of the method to incorporate these aspects can be the subject of future work.
In this research, in the presented index, the factors’ weight is considered the same. Regarding the municipality policies, the importance of this is changeable, so it is better to develop the model by considering a weight for factors.
The policies and plans which are adopted by the municipality are used throughout the city, while in this research the first district of Bojnourd city is under study. The results of this study can be helpful in deciding to plan for the first district municipality. However, these results cannot be used to decide and plan throughout the Bojnourd city, so it is better to data-mine throughout the city.
Other data analytics can be used to describe data by extracting useful patterns from 137 data. Association rule mining can be used to find pairs of request types that are frequently occurred together. Topic modeling can extract naturally emerging topics from large volumes of 137 text data. Also, 137 data can be used to assist policy decisions by making a prediction of an unknown future. 137 data can be used to investigate subjective perceptions of neighborhoods disorders.
Future research can also classify and analyze the spatial and temporal patterning of complaints across the city. In other words, they can predict the spatial and temporal variations of demand to optimally allocate resources and staff, reduce response time, and allow long-term dynamic planning. Another future research subject would be to examine the relationship between the concentration of complaints in a specific area and the socioeconomic characteristics and environmental features of those regions. Also for future research, 137 data can be combined with additional sources of data such as citizen opinions reflected in social media and prioritize citizens’ needs more comprehensively.

Author Contributions

M.G. and B.S. conceived, designed and performed the experiments; they analyzed the data and wrote the paper with contribution from A.A.A. and B.P. and C.-W.L.; the manuscript was discussed and reviewed by all of authors as they enhanced the context with sufficient references.

Funding

This research is supported by the Centre for Advanced Modelling and Geospatial Information Systems CAMGIS) in the University of Technology Sydney, Australia: 323930, 321740.2232335 and 321740.2232357.

Conflicts of Interest

The authors declare no conflict of interest.

References

  1. Pan, S.L.; Tan, C.W.; Lim, E.T. Customer relationship management (CRM) in e-government: A relational perspective. Decis. Support Syst. 2006, 42, 237–250. [Google Scholar] [CrossRef]
  2. Sasaki, T.; Watanabe, Y.A.; Minamino, K.I. An Empirical Study on Citizen Relationship Management in Japan. In Proceedings of the PICMET ‘07—2007 Portland International Conference on Management of Engineering & Technology, Portland, OR, USA, 5–9 August 2007. [Google Scholar]
  3. Kannabiran, G.; Xavier, M.J.; Anantharaaj, A. Enabling e-governance through citizen relationship management: Concept, model and applications. J. Serv. Res. 2004, 4, 223–240. [Google Scholar]
  4. Larsen, B.; Milakovich, M. Citizen relationship management and e-government. In Electronic Government; Springer: Berlin/Heidelberg, Germany, 2005; pp. 57–68. [Google Scholar]
  5. Keramati, A.; Saremi, M.S.; Hadjiha, B. A Proposal Framework to Investigate Citizen Relationship Management Success. In Proceedings of the 3th International Marketing Management Conference, Tehran, Iran, 21–22 January 2009. [Google Scholar]
  6. Da Silva, R.; Batista, L. Boosting government reputation through CRM. Int. J. Public Sect. Manag. 2007, 20, 588–607. [Google Scholar] [CrossRef]
  7. King, S.F. Citizens as customers: Exploring the future of CRM in UK local government. Gov. Inf. Q. 2007, 24, 47–63. [Google Scholar] [CrossRef]
  8. Schellong, A.; Langenberg, T. Managing Citizen Relationships in Disasters: Hurricane Wilma, 311 and Miami-Dade County. In Proceedings of the 2007 40th Annual Hawaii International Conference on InSystem Sciences HICSS 2007, Waikoloa, HI, USA, 3–6 January 2007; p. 96. [Google Scholar]
  9. Minaei-Bidgoli, B.; Akhondzadeh-Noughabi, E.; Mousavi, M.H.; Ahmadvand, A. Using datamining in citizen relationship management: A case study of 137 urban systems in Tehran municipality. In Proceedings of the Second Conference on Electronic City, Tehran, Iran, 24–25 May 2009. (In Persian). [Google Scholar]
  10. Liu, Y.; Cheshire, L.; Wang, S.; Fu, X. A socio-spatial analysis of neighbour complaints using large-scale administrative data: The case in Brisbane, Australia. Cities 2019, 90, 168–180. [Google Scholar] [CrossRef]
  11. Hagen, L.; Seon Yi, H.; Pietri, S.; Keller, T.E. Processes, Potential Benefits, and Limitations of Big Data Analytics: A Case Analysis of 311 Data from City of Miami. In Proceedings of the 20th Annual International Conference on Digital Government Research, Dubai, United Arab Emirates, 18–20 June 2019; ACM: New York, NY, USA, 2019; pp. 1–10. [Google Scholar]
  12. Ahmadvand, A.M.; Bidgoli, B.M.; Akhondzadeh, E. A hybrid data mining model for effective citizen relationship management: A case study on Tehran municipality. In Proceedings of the IEEE International Conference on e-Education, e-Business, e-Management, and e-Learning IC4E’10, Washington, DC, USA, 22–24 January 2010; pp. 277–281. [Google Scholar]
  13. Minaei-Bidgoli, B.; Akhondzadeh, E. A New Approach of Using Association Rule Mining in Customer Complaint Management. IJCSI 2010, 7, 141–147. [Google Scholar]
  14. Akhondzadeh-Noughabi, E.; Alizadeh, S.; Ahmadvand, A.M.; Minaei-Bidgoli, B. FTiS: A new model for effective urban management: A case study of urban systems in Iran. Cities 2013, 31, 394–403. [Google Scholar] [CrossRef]
  15. Saeidian, B.; Mesgari, M.S.; Ghodousi, M. Optimum allocation of water to the cultivation farms using Genetic Algorithm. Int. Arch. Photogramm. Remote Sens. Spat. Inf. Sci. 2015, 40, 631–638. [Google Scholar] [CrossRef]
  16. Tsai, C.Y.; Chiu, C.C. A purchase-based market segmentation methodology. Expert Syst. Appl. 2004, 27, 265–276. [Google Scholar] [CrossRef]
  17. Pham, D.T.; Otri, S.; Afify, A.; Mahmuddin, M.; Al-Jabbouli, H. Data clustering using the bees algorithm. In Proceedings of the 40th CIRP International Manufacturing systems seminar, Liverpool, UK, 30 May–1 June 2007. [Google Scholar]
  18. AbdelHamid, N.M.; Halim, M.A.; Fakhr, M.W. BEES Algorithm-Based Document Clustering. In Proceedings of the ICIT 2013 the 6th International Conference on Information Technology, Amman, Jordan, 8–10 May 2013. [Google Scholar]
  19. Hubert, R.B.; Maguitman, A.G.; Chesñevar, C.I.; Malamud, M.A. CitymisVis: A Tool for the Visual Analysis and Exploration of Citizen Requests and Complaints. In Proceedings of the 10th International Conference on Theory and Practice of Electronic Governance, New Delhi AA, India, 7–9 March 2017; ACM: New York, NY, USA, 2017; pp. 22–25. [Google Scholar]
  20. Wang, L.; Qian, C.; Kats, P.; Kontokosta, C.; Sobolevsky, S. Structure of 311 service requests as a signature of urban location. PLoS ONE 2017, 12, e0186314. [Google Scholar] [CrossRef]
  21. Xu, L.; Kwan, M.P.; McLafferty, S.; Wang, S. Predicting demand for 311 non-emergency municipal services: An adaptive space-time kernel approach. Appl. Geogr. 2017, 89, 133–141. [Google Scholar] [CrossRef]
  22. White, A.; Trump, K.S. The promises and pitfalls of 311 data. Urban Aff. Rev. 2018, 54, 794–823. [Google Scholar] [CrossRef]
  23. Ghodousi, M.; Alesheikh, A.A.; Saeidian, B. Analyzing public participant data to evaluate citizen satisfaction and to prioritize their needs via K-means, FCM and ICA. Cities 2016, 55, 70–81. [Google Scholar] [CrossRef]
  24. Niknam, T.; Amiri, B. An efficient hybrid approach based on PSO, ACO and K-means for cluster analysis. Appl. Soft Comput. 2010, 10, 183–197. [Google Scholar] [CrossRef]
  25. Davidson, I. Understanding K-means Non-hierarchical Clustering; SUNY Albany Technical Report 02–2; State University of New York: New York, NY, USA, 2002. [Google Scholar]
  26. Ercin, O.; Coban, R. Comparison of the artificial bee colony and the bees algorithm for pid controller tuning. In Proceedings of the IEEE 2011 International Symposium on Innovations in Intelligent Systems and Applications (INISTA), Istanbul, Turkey, 15–18 June 2011; pp. 595–598. [Google Scholar]
  27. Li, H.; Liu, K.; Li, X. A comparative study of artificial bee colony, bees algorithms and differential evolution on numerical benchmark problems. In International Symposium on Intelligence Computation and Applications; Springer: Berlin/Heidelberg, Germany, 2010; pp. 198–207. [Google Scholar]
  28. Tsai, H.C. Integrating artificial bee colony and bees algorithm for solving numerical function optimization. Neural Comput. Appl. 2014, 25, 635–665. [Google Scholar] [CrossRef]
  29. Aghazadeh, F.; Meybodi, M.R. Learning bees algorithm for optimization. In International Conference on Information and Intelligent Computing; IACSIT Press: Singapore, 2011; Volume 18, pp. 115–122. [Google Scholar]
  30. Pham, D.T.; Ghanbarzadeh, A.; Koc, E.; Otri, S.; Rahim, S.; Zaidi, M. The bees algorithm-A novel tool for complex optimisation. In Proceedings of Intelligent Production Machines and Systems-2nd I* PROMS Virtual International Conference; Elsevier: Amsterdam, The Netherlands, 2011. [Google Scholar]
  31. Llinares, C.; Page, A.; Llinares, J. An approach to defining strategies for improving city perception. Case study of Valencia, Spain. Cities 2013, 35, 78–88. [Google Scholar] [CrossRef]
  32. Oshio, T.; Urakawa, K. Neighbourhood satisfaction, self-rated health, and psychological attributes: A multilevel analysis in Japan. J. Environ. Psychol. 2012, 32, 410–417. [Google Scholar] [CrossRef]
  33. Rioux, L.; Werner, C. Residential satisfaction among aging people living in place. J. Environ. Psychol. 2011, 31, 158–169. [Google Scholar] [CrossRef]
  34. Kang, Y.; Park, J.; Kang, A. An analysis on the spatial characteristics of satisfaction on the residential environment using tweets. Int. J. Geospat. Environ. Res. 2015, 1, 1–16. [Google Scholar]
  35. Kalami, M. Learing Bees Algorithm-Theoretical and Practical [DVD]; Faradars: Tehran, Iran, 2012. [Google Scholar]
  36. Hasanzadeh, K. SoftGIS Data Mining and Analysis: A Case Study of Urban Impression in Helsinki. Master’s Thesis, University of Aalto Finland, Helsinki, Finland, 2014. [Google Scholar]
  37. Maulik, U.; Bandyopadhyay, S. Performance evaluation of some clusteringalgorithms and validity indices. IEEE Trans. Pattern Anal. Mach. Intell. 2002, 24, 1650–1654. [Google Scholar] [CrossRef]
  38. De Amorim, R.C.; Hennig, C. Recovering the number of clusters in data sets with noise features using feature rescaling factors. Inf. Sci. 2015, 324, 126–145. [Google Scholar] [CrossRef] [Green Version]
  39. Rousseeuw, P.J. Silhouettes: A graphical aid to the interpretation and validation of cluster analysis. J. Comput. Appl. Math. 1987, 20, 53–65. [Google Scholar] [CrossRef] [Green Version]
  40. Gupta, D.N. Citizen-centric Approach for e-Governance. Available online: www.csi-sigegov.org/1/5_392.pdf (accessed on 30 December 2013).
Figure 1. Flowchart of K-means algorithm [25].
Sustainability 11 04595 g001
Figure 2. Diagram flowchart of BA [30].
Sustainability 11 04595 g002
Figure 3. Overall methodology of the study.
Sustainability 11 04595 g003
Figure 4. Findings of clustering and prioritization using K-means algorithm in the first method.
Sustainability 11 04595 g004
Figure 5. Findings of clustering and prioritization using K-means algorithm in the second method.
Sustainability 11 04595 g005
Figure 6. Results of clustering and prioritization using BA algorithm in the first method.
Sustainability 11 04595 g006
Figure 7. Results of clustering and prioritization using BA algorithm in the second method.
Sustainability 11 04595 g007
Figure 8. Result of clustering for every algorithm in two methods.
Sustainability 11 04595 g008
Table 1. Categories of executive response mean.
ClassDescription
0No response was utilized by the executive. The user’s request is not examined
1The request is investigated, but it cannot be measure out because of some factors such as budget constraints, or contravention of the act, etc.
2The examined problem can be reached by the executive, but it needs time
3The request was examined and a solution was found by the executive
Table 2. The findings of clustering using K-means algorithm in the first method.
ClusterFrequency MeanRecency MeanExecutive Response MeanNumber of Subjects
Cluster14.33316.1670.1996
Cluster214.62527.1250.39116
Cluster31.8572.8570.2147
Cluster445.00030.0000.5813
Cluster5130.00030.0000.0151
Table 3. More details of clustering using K-means algorithm in the first method.
ClusterFrequency (F)Recency (R)Executive Response Mean (M)Mean Request for Each Day (MF)Mean Time Interval between Two Request (MT)
Cluster12 < F < 711 < R <200.000 < M < 0.4370.066 < MF < 0.2334.291 < MT < 15.150
Cluster26 < F < 2523 < R <300.000 < M < 1.280.200 < MF < 0.8331.200 < MT < 5.000
Cluster31 < F <40 < R < 90.000 < M < 1.0000.033 < MF < 0.1337.510 < MT < 30.000
Cluster435 < F <59R = 300.170 < M < 1.3721.160 < MF < 1.9660.501 < MT < 0.860
Cluster5F = 130R = 30M = 0.015MF = 4.333MT = 0.230
Table 4. The mean of executive response to various need groups using K-means algorithm in the first method.
NeedsMean of Executive Response
Primary needs0.303
Secondary needs0.391
Uncommon needs0.204
Table 5. Findings of clustering using K-means algorithm in the second method.
ClusterFrequency MeanRecency MeanExecutive Response MeanNumber of Subjects
Cluster111.65823.9760.15914
Cluster229.65524.6511.4373
Cluster31.8444.9080.1679
Cluster422.47528.9950.4456
Cluster5130.00030.0000.0151
Table 6. The more precise details of clustering using K-means algorithm in the second method.
ClusterFrequency (F)Recency (R)Executive Response Mean (M)Mean Request for Each Day (MF)Mean Time Interval between Two Request (MT)
Cluster11 < F < 40 < R < 130.000 < M < 1.0000.033 < MF < 0.1337.518 < MT < 30.000
Cluster235 < F < 59R = 300.170 < M < 1.3721.166 < MF < 1.9660.508 < MT < 0.857
Cluster32 < F < 1016 < R < 290.000 < M < 1.6600.066 < MF < 0.3303.000 < MT < 30.000
Cluster415 < F < 2523 < R < 300.000 < M < 1.2000.500 < MF < 0.8331.200 < MT < 2.000
Cluster5F = 130R = 30M = 0.015MF = 4.333MT = 0.230
Table 7. The findings of clustering using BA in the first method.
ClusterFrequency MeanRecency MeanExecutive Response MeanNumber of Subjects
Cluster118.64827.9940.33010
Cluster27.00025.0000.26810
Cluster341.00030.0000.5803
Cluster4130.00030.0000.0151
Cluster51.9623.9560.0169
Table 8. The more details of clustering using BA in the first method.
ClusterFrequency (F)Recency (R)Executive Response Mean (M)Mean Request for Each Day (MF)Mean Time Interval between Two Request (MT)
Cluster110 < F < 4223 < R < 300.000 < M < 1.2800.333 < MF < 1.4000.714 < MT < 3.000
Cluster22 < F < 818 < R < 270.000 < M < 1.6600.066 < MF < 0.2663.760 < MT < 15.000
Cluster335 < F < 59R = 300.170 < M < 1.3721.166 < MF < 1.9660.508 < MT < 0.857
Cluster4F = 130R = 30M = 0.015MF = 4.333MT = 0.230
Cluster51 < F < 40 < R < 130.000 < M < 1.0000.033 < MF < 0.1337.518 < MT < 30.000
Table 9. Mean of executive response for different needs using BA in the first method.
NeedsMean of Executive Response
Primary needs0.290
Secondary needs0.313
Uncommon needs0.016
Table 10. Results of clustering using BA in the second method.
ClusterFrequency MeanRecency MeanExecutive Response MeanNumber of Subjects
Cluster141.51430.0001.3262
Cluster23.5256.9661.3302
Cluster314.84926.4750.24420
Cluster4130.00030.0000.0151
Cluster51.9355.4910.0638
Table 11. The more details of clustering using BA in the second method.
ClusterFrequency (F)Recency (R)Executive Response Mean (M)Mean Request for Each Day (MF)Mean Time Interval between Two Request (MT)
Cluster125 < F < 59R = 301.280 < M < 1.3720.833 < MF < 1.9660.064 < MT < 1.201
Cluster21 < F < 60 < R < 271.000 < M < 1.6600.033 < MF < 0.2005.000 < MT < 30.000
Cluster32 < F < 4116 < R < 300.000 < M < 0.7640.066 < MF < 1.3660.732 < MT < 15.000
Cluster4F = 130R = 30M = 0.015MF = 4.333MT = 0.230
Cluster51 < F < 40 < R < 130.000 < M < 0.5000.033 < MF < 0.1337.519 < MT < 30.000
Table 12. The mean of frequency, recency and executive response for each of the priorities, each for two algorithms.
K-MeansBA
MethodPriorityFrequency MeanRecency MeanExecutive Response MeanFrequency MeanRecency MeanExecutive Response Mean
First methodPrimary66.25030.0000.30363.25030.0000.290
Secondary14.62527.1250.39112.73826.4970.313
Uncommon2.9999.0000.2041.9613.9530.016
Second methodPrimary37.83629.1390.23371.00030.0000.524
Secondary14.65824.0890.58914.84926.4750.244
Uncommon1.8444.9080.1672.2535.7860.459
Table 13. The result of proposed index.
MethodPriorityResult of Index in K-MeansResult of Index in BA
First methodfirst0.4900.359
second0.0160.014
minor0.0000.000
Second methodfirst0.6290.359
second0.0490.013
minor0.0000.000
Table 14. Different parameters for each algorithm in two methods.
First MethodSecond Method
ParameterCHSCHS
Algorithm
K-means24,1630.683159.8900.624
BA25,2340.736161.3260.638

