Article

A Three-Stage Hierarchical Model for An Earthquake Shelter Location-Allocation Problem: Case Study of Chaoyang District, Beijing, China

1
Department of Engineering Physics, Tsinghua University, Beijing 100084, China
2
Institute of Public Safety Research, Tsinghua University, Beijing 100084, China
3
Academy of Disaster Reduction and Emergency Management, Ministry of Civil Affairs & Ministry of Education, Beijing Normal University, Beijing 100875, China
4
Faculty of Geographical Science, Beijing Normal University, Beijing 100875, China
5
Faculty of Finance, City University of Macau, Macau 999078, China
6
Research Center for Macau Social and Economic Development, City University of Macau, Macau 999078, China
*
Author to whom correspondence should be addressed.
Sustainability 2019, 11(17), 4561; https://doi.org/10.3390/su11174561
Submission received: 17 July 2019 / Revised: 13 August 2019 / Accepted: 15 August 2019 / Published: 22 August 2019

Abstract

:
Earthquakes are one type of natural disaster that causes serious economic loss, deaths, and homelessness, and providing shelters is vital to evacuees who have been affected by an earthquake. Constructing shelters with reasonable capacity in the right locations and allocating evacuees to them in a reasonable time period is one disaster management method. This study proposes a multi-objective hierarchical model with three stages, i.e., an immediate shelter (IS) stage, a short-term shelter (STS) stage, and a long-term shelter (LTS) stage. According to the requirements of evacuees of IS, STS, and LTS, the objective of both the IS and STS stages is to minimize total evacuation time and the objectives of the LTS are to minimize total evacuation time and to minimize total shelter area. A modified particle swarm optimization (MPSO) algorithm is used to solve the IS and STS stages and an interleaved modified particle swarm optimization algorithm and genetic algorithm (MPSO-GA) is applied to solve the LTS stage. Taking Chaoyang District, Beijing, China as a case study, the results generated using the model present the government with a set of options. Thus, according to the preferences of the government, the determination can be made regarding where to construct ISs, STSs, and LTSs, and how to allocate the evacuees to them.

1. Introduction

Earthquakes are natural disasters that have caused serious economic losses and casualties. To reduce the damage caused by an earthquake, many engineering methods have been implemented to protect buildings and infrastructures [1,2]. However, in some cases, these engineering methods can no longer protect people due to the severity of the earthquake. Therefore, constructing emergency shelters with reasonable locations is important to provide safe places with sufficient assets and supplies for people during different phases of an earthquake disaster.
In order to help decision-makers, many studies have been carried out to determine shelter location and population allocation. Site selection models have been modified to solve disaster shelter location-allocation problems, and these include the P-median model [3], the P-center model [4], and the coving model [5]. Based on these, multi-objective models and hierarchical models have been proposed [6,7,8,9,10]. For example, Sherali et al. [6], Gama et al. [11], and Bayram et al. [12] have used the P-median model to solve the issues of hurricane/flood, flood, and earthquake shelter selection and evacuee allocation, respectively. In relation to the covering model, Dalal et al. [13] solved the typhoon shelter site selection problem by adding capacity and distance constraints to the covering model. In addition, Gama et al. [7] developed a dynamic maximal covering model that considered the road situation and flood depth when selecting shelter location. Moreover, based on these studies, hierarchical models [9,14,15,16,17] and multi-objective models [18,19,20,21,22] have been used widely to establish the location of disaster shelters and population allocation to them. By using single-objective models, other factors will be neglected. For example, evacuees only need to stay in the shelters for a short time during a typhoon disaster. Thus, evacuation time is the most important consideration other than construction investment. Similarly, after an earthquake, evacuees should go to their shelters for safety as soon as possible, and so reducing evacuation time is important. Therefore, single-objective models such as P-median, P-center, and covering models can help decision-makers to obtain shelter location-allocation planning which is targeted. However, other factors are always also worth considering, such as construction investment in some situations. Also, similarly to other facilities, like hospitals, there are also different types of shelter to provide different resources. Thus, by using hierarchical models and multi-objective models, the decision-makers can obtain a set of solutions, from which the government can make decisions according to their resource limit and other considerations. Although there have been many studies about the shelter location-allocation problem, studies related to types of shelter are still in the development phase. It is always difficult to predict an earthquake precisely. Thus, it is important to prepare well. Also, unlike other disasters, such as floods or typhoons, after an earthquake people may need to stay in their shelters for a short or long time according to the severity of the disaster. To meet the requirements of evacuees in the different phases after an earthquake, work on the type of shelter has been done. According to the “Emergency shelter for earthquake disaster—sites and its facilities” enacted by the China Earthquake Administration [23], there are three types of earthquake shelters, based on the amount of time that they are in service for evacuees. Type I provides service to evacuees for more than thirty days after an earthquake. Type II accommodates evacuees from ten to thirty days after an earthquake. Type III provides a safe place for evacuees for more than one month. Furthermore, Zhao et al. [24] divided earthquake shelters into two types, whereas Chen et al. [10] and Li et al. [25] proposed that earthquake shelters should be divided into three types, namely immediate shelter (houses evacuees for the first day), short-term shelter (houses evacuees for up to ten days) and long-term shelter (house evacuees from ten days to a month). Thus, it is obvious that taking shelter types into account is important. Therefore, in this paper, three types of earthquake shelter are considered, i.e., immediate shelter (IS), short-term shelter (STS), and long-term shelter (LTS). ISs will house evacuees for the first day after an earthquake. STSs can accommodate people for up to ten days, whereas LTSs can be equipped to be used for a month or longer. Although a few studies have taken shelter type into account, there is room for improvement. For example, in the studies of Chen et al. [10] and Li et al. [25], evacuees were allocated to shelters of different types based only on a single objective, which is to minimize the total distance travelled by evacuees. However, it is necessary to consider other objectives, such as minimizing total shelter investment according to the types of shelters. Zhao et al. [24] developed a new hierarchical mathematical model considering two objectives and two types of earthquake shelter. However, according to the experience of the current works, setting three types of earthquake shelters is better. For example, Chen et al. [10] and Li et al. [25] set three types for earthquake shelters. Additionally, the earthquake shelter is divided into three types in Japan and America. After a “3.11” earthquake occurred in Japan, shelters of these three types provided important functions to housing people in different periods [26]. Besides, short-term shelter planning was neglected in the study of Zhao et al. [24], in which the long-term shelter is set to serve evacuees from the second day to one month or longer. To accommodate evacuees for such a long time, the investment is very high. However, according to the studies of [25,26,27], most evacuees would not stay in shelters longer than ten days after an earthquake. Thus, setting short-term shelters is important. Therefore, three types of earthquake shelters are considered in this paper. Moreover, Zhao et al. [24] set the same objectives, i.e., to minimize the total weighted evacuation time and to minimize total shelter area for the two stages of their model. However, the requirements of evacuees are different in relation to different types of shelters. In the immediate aftermath of an earthquake, evacuees want to go to shelters as soon as possible. As time goes on, more facilities are required by evacuees for living. Thus, in this paper, different objectives are considered for the three shelter types. In the IS stage, the objective is to minimize the total evacuation time because the evacuation time is the most important factor. After the first day after an earthquake, the evacuees should go to STSs for better facilities. The evacuation time is still the important factor to ensure the safety of the evacuees. Then, after ten days, if the earthquake’s effects are large, many evacuees may need to stay in the shelters for a longer time. Thus, advanced facilities are necessary for the evacuees’ living. Investment is also an important factor besides evacuation time. Therefore, the objectives to minimize total evacuation time and to minimize total shelter area are considered for the model’s LTS stage.
Because of the complexity of the models, many optimization algorithms were modified pre application, such as the particle swarm optimization (PSO) algorithm [28], the genetic algorithm (GA) [29], and the simulated annealing (SA) algorithm [30]. For instance, Kongsomsaksakul et al. [31] applied a GA to solve a hierarchical model to obtain the solution of flood shelter location selection. Hu et al. [32] solved a multi-objective model related to earthquake shelter selection by applying the Non-Dominated Sorting GA II. In addition, the PSO algorithm and its modification formats have also been used widely to solve the location-allocation problem relating to the shelter location and evacuee allocation [33,34,35].
With the recognition of the existing shelter location and allocation model, in this paper, a new hierarchical model related to three stages is developed to determine locations of ISs, STSs, and LTSs, as well as the allocation of the affected population to these. These shelters are selected from a set of candidate shelters chosen from spare spaces that are far away from earthquake faults. The population of a community is assumed to be allocated to the same shelter in each of these three stages. Then, the model is applied to the Chaoyang District, Beijing, China.
As the model’s stages have varying levels of complexity, a modified PSO (MPSO) proposed by Zhao et al. [36] is used to solve the model’s IS and STS stages. Then, for the model’s LTS stage, an optimization approach, named the interleaved MPSO-GA, is used [24]. The algorithm interleaves the execution of a GA and a MPSO algorithm proposed by Zhao et al. [24] by incorporating the SA to obtain better solutions. In relation to the case study of Chaoyang District in Beijing, China, results of the model are presented. The results with a set of solutions can give different options to local government to make a selection based on their other considerations regarding the earthquake shelter location-allocation problem.

2. Method

There are three types of earthquake shelters according to their service time after an earthquake. Thus, a hierarchical model with three stages, namely, the IS stage, STS stage, and LTS stage, is constructed and used. In this model, there are three assumptions:
(1)
The residents of a community will be allocated to the same shelters;
(2)
The residents will evacuate with a queue and the occupation of an evacuee is 1 square meter in a queue;
(3)
The residents will go to their assigned shelters along the shortest route from their locations.

2.1. IS Stage of the Model

min f 1 = j = 1 M k = 1 N ( d k j + P j w P × W k j v j × B k j )
d k j × B k j D j 0
j = 1 M ( P j × B k j C k × X k ) 0   k = 1 , 2 , , N
k = 1 N ( B k j × X k ) = 1   j = 1 , 2 , , M
Equation (1) aims to minimize total evacuation time (TET) of all communities to their ISs where dkj is the shortest distance from community j to shelter k that can be obtained using the Dijkstra algorithm. The parameter Pj is the number of evacuees in community j. The parameter wp indicates the average path width that an evacuation occupies and Wkj is the average width of the shortest route from community j to shelter k. The parameter vj is the average evacuation velocity of community j considering the velocity of proportions of the community’s children, adults, and elderly people, which are calculated as in the work of Zhao et al. [24]. Decision variable Bkj indicates whether the community j will be allocated to shelter k (allocated = 1, not allocated = 0). In Equation (1), the evacuation time of a community is the time that all evacuees of the community arrive at their shelter. Here, the distance for the final evacuee of a community is adjusted by the number of evacuees of this community, the occupation width of an evacuee, and the width of the evacuation route as shown in Figure 1.
In Equation (2), Dj indicates the farthest evacuation distance that community j can travel. This means that the candidate shelters cannot be selected by a community if the distance between them is more than Dj. Equation (3) indicates the capacity constraint, meaning that the number of evacuees allocated to a shelter cannot exceed the capacity of the shelter. Here, the capacity of a shelter is calculated by dividing the area of the shelter by the average area occupied by a single person, which is set as 1 m2. The parameter Xk is a decision variable that indicates whether the candidate shelter k will be selected (selected = 1, not selected = 0). Equation (4) ensures that a community can only be allocated to one shelter.

2.2. STS Stage of the Model

After the first day of being housed in the ISs, the evacuees will be reallocated to STSs for longer evacuation and living needs. The STS stage of the model is shown in Equations (5)–(8).
min f 2 = j = 1 n I S i = 1 n c I S , j k = 1 K ( d k i j + P i j w P × W k i j v i j × B k i j )
d k i j × B k i j D i j 0
j = 1 n I S i = 1 n c , j ( P i j × B k i j C k × X k ) 0   k = 1 , 2 , , N
k = 1 N ( B k i j × X k ) = 1   j = 1 , 2 , , M
Equation (5) aims to minimize the TET from the IS to the STS, where nIS is the number of ISs obtained by solving the model’s stage and n c , j I S is the number of communities allocated to the IS j in the IS stage. The parameter N is the total number of candidate shelters that can be selected as STS. Here, it should be noted that the shelters selected as IS can also be candidate STSs if they meet the requirements of being an STS. Equation (6) indicates distance constraint and Equation (7) is capacity constraint, meaning that the evacuees evacuated into an STS cannot exceed the capacity of the STS, where the capacity of each evacuee in the STS is 2 m2.

2.3. LTS Stage of the Model

Similarly to with an STS, after ten days, the evacuees will be reallocated to an LTS, as the STS can no longer meet the requirements of the evacuees. The LTS should provide comprehensive services to ensure the longer-term living of the evacuees. Thus, besides evacuation time from the STS to the LTS, construction investment should be another important consideration. Thus, there are two objectives for STS, and the model’s STS stage is shown in Equations (9)–(13).
min f 3 = j = 1 n S T S i = 1 n c S T S , j k = 1 X ( d k i j + P i j w P × W k i j v i j × B k i j )
min f 4 = k = 1 N ( X k × S k )
d k i j × B k i j D i j 0
j = 1 n S T S i = 1 n c , j S T S ( P i j × B k i j C k × X k ) 0   k = 1 , 2 , , N
k = 1 N ( B k i j × X k ) = 1   j = 1 , 2 , , M
Equation (9) aims to minimize the TET from the STS to the LTS, where nSTS is the number of STSs obtained by solving the model’s STS stage and n c , j S T S indicates the number of communities allocated to STS j in the STS stage. Equation (10) aims to minimize the total shelter area (TSA) that expresses minimizing total shelter construction investment. Here, it should be noted that the shelters selected as IS and STS can also be candidate LTSs if they meet the requirements of being an LTS. The parameter N is the total number of candidate shelters that can be selected as LTSs. The parameter Sk is the area of candidate shelter k and the capacity of a person in the LTS is set as 3 m2. Equation (11) indicates distance constraint and Equation (12) is the capacity constraint, meaning that evacuees evacuated to an LTS cannot exceed its capacity. Equation (13) ensures that a community in an STS can only be reallocated to one LTS.

3. Case Study

Chaoyang District is one of the central districts of Beijing, China in which the density and mobility of the population are high. The government has put much effort into ensuring the security of this district, including constructing shelters. However, the capacity of these shelters still cannot meet the district’s needs. In Chaoyang District, there are eight earthquake shelters with a 900,000 people capacity, compared to the total population of 3.5 million. Thus, constructing earthquake shelters in Chaoyang District is very important. The location of Beijing and Chaoyang District, Beijing is indicated in Figure 2a,b, respectively.
Figure 3 presents a map of candidate shelters, communities, and the evacuation path network within Chaoyang District. Figure 3a shows the location of candidate shelters that were selected based on being at least 500 m away from earthquake faults and being covered by basic facilities such as hospitals [32,33]. Also, the ID number of each candidate shelter is presented in Figure 3a. Figure 3b shows the population distribution of Chaoyang District. There are a total of 463 communities in Chaoyang District according to knowledge obtained from the Beijing Bureau of Civil Affairs.

4. Results and Discussion

In the context of the case study area of Chaoyang District, this section gives the results of the model solved using the MPSO algorithm [36] for the IS and STS stages and interleaved MPSO-GA [24] for the LTS stage. To differentiate these two MPSO algorithms, we named the MPSO proposed in reference [36] MPSO-S and the MPSO proposed in reference [24] MPSO-M. The MPSO-S algorithm is a modified form of a PSO algorithm, which was achieved by adding an SA algorithm to a PSO algorithm to avoid premature convergence. Also, to generate better solutions, it uses both Von Neumann and global structures. The interleaved MPSO-GA algorithm combines the MPSO-M algorithm [24] and a GA to solve more complex problems. By using this algorithm, the non-dominated solution is updated by comparing the solution of each iteration with the solution of the previous iteration. The MPSO-M algorithm is executed first and then passed to the GA when the Pareto set generated by the MPSO-M algorithm stays the same for fifty iterations. Similarly, the execution passes from the GA to the MPSO-M algorithm when there is no difference between the Pareto sets for fifty successive iterations. This interleaved execution process continues until the convergence is met simultaneously by both algorithms.

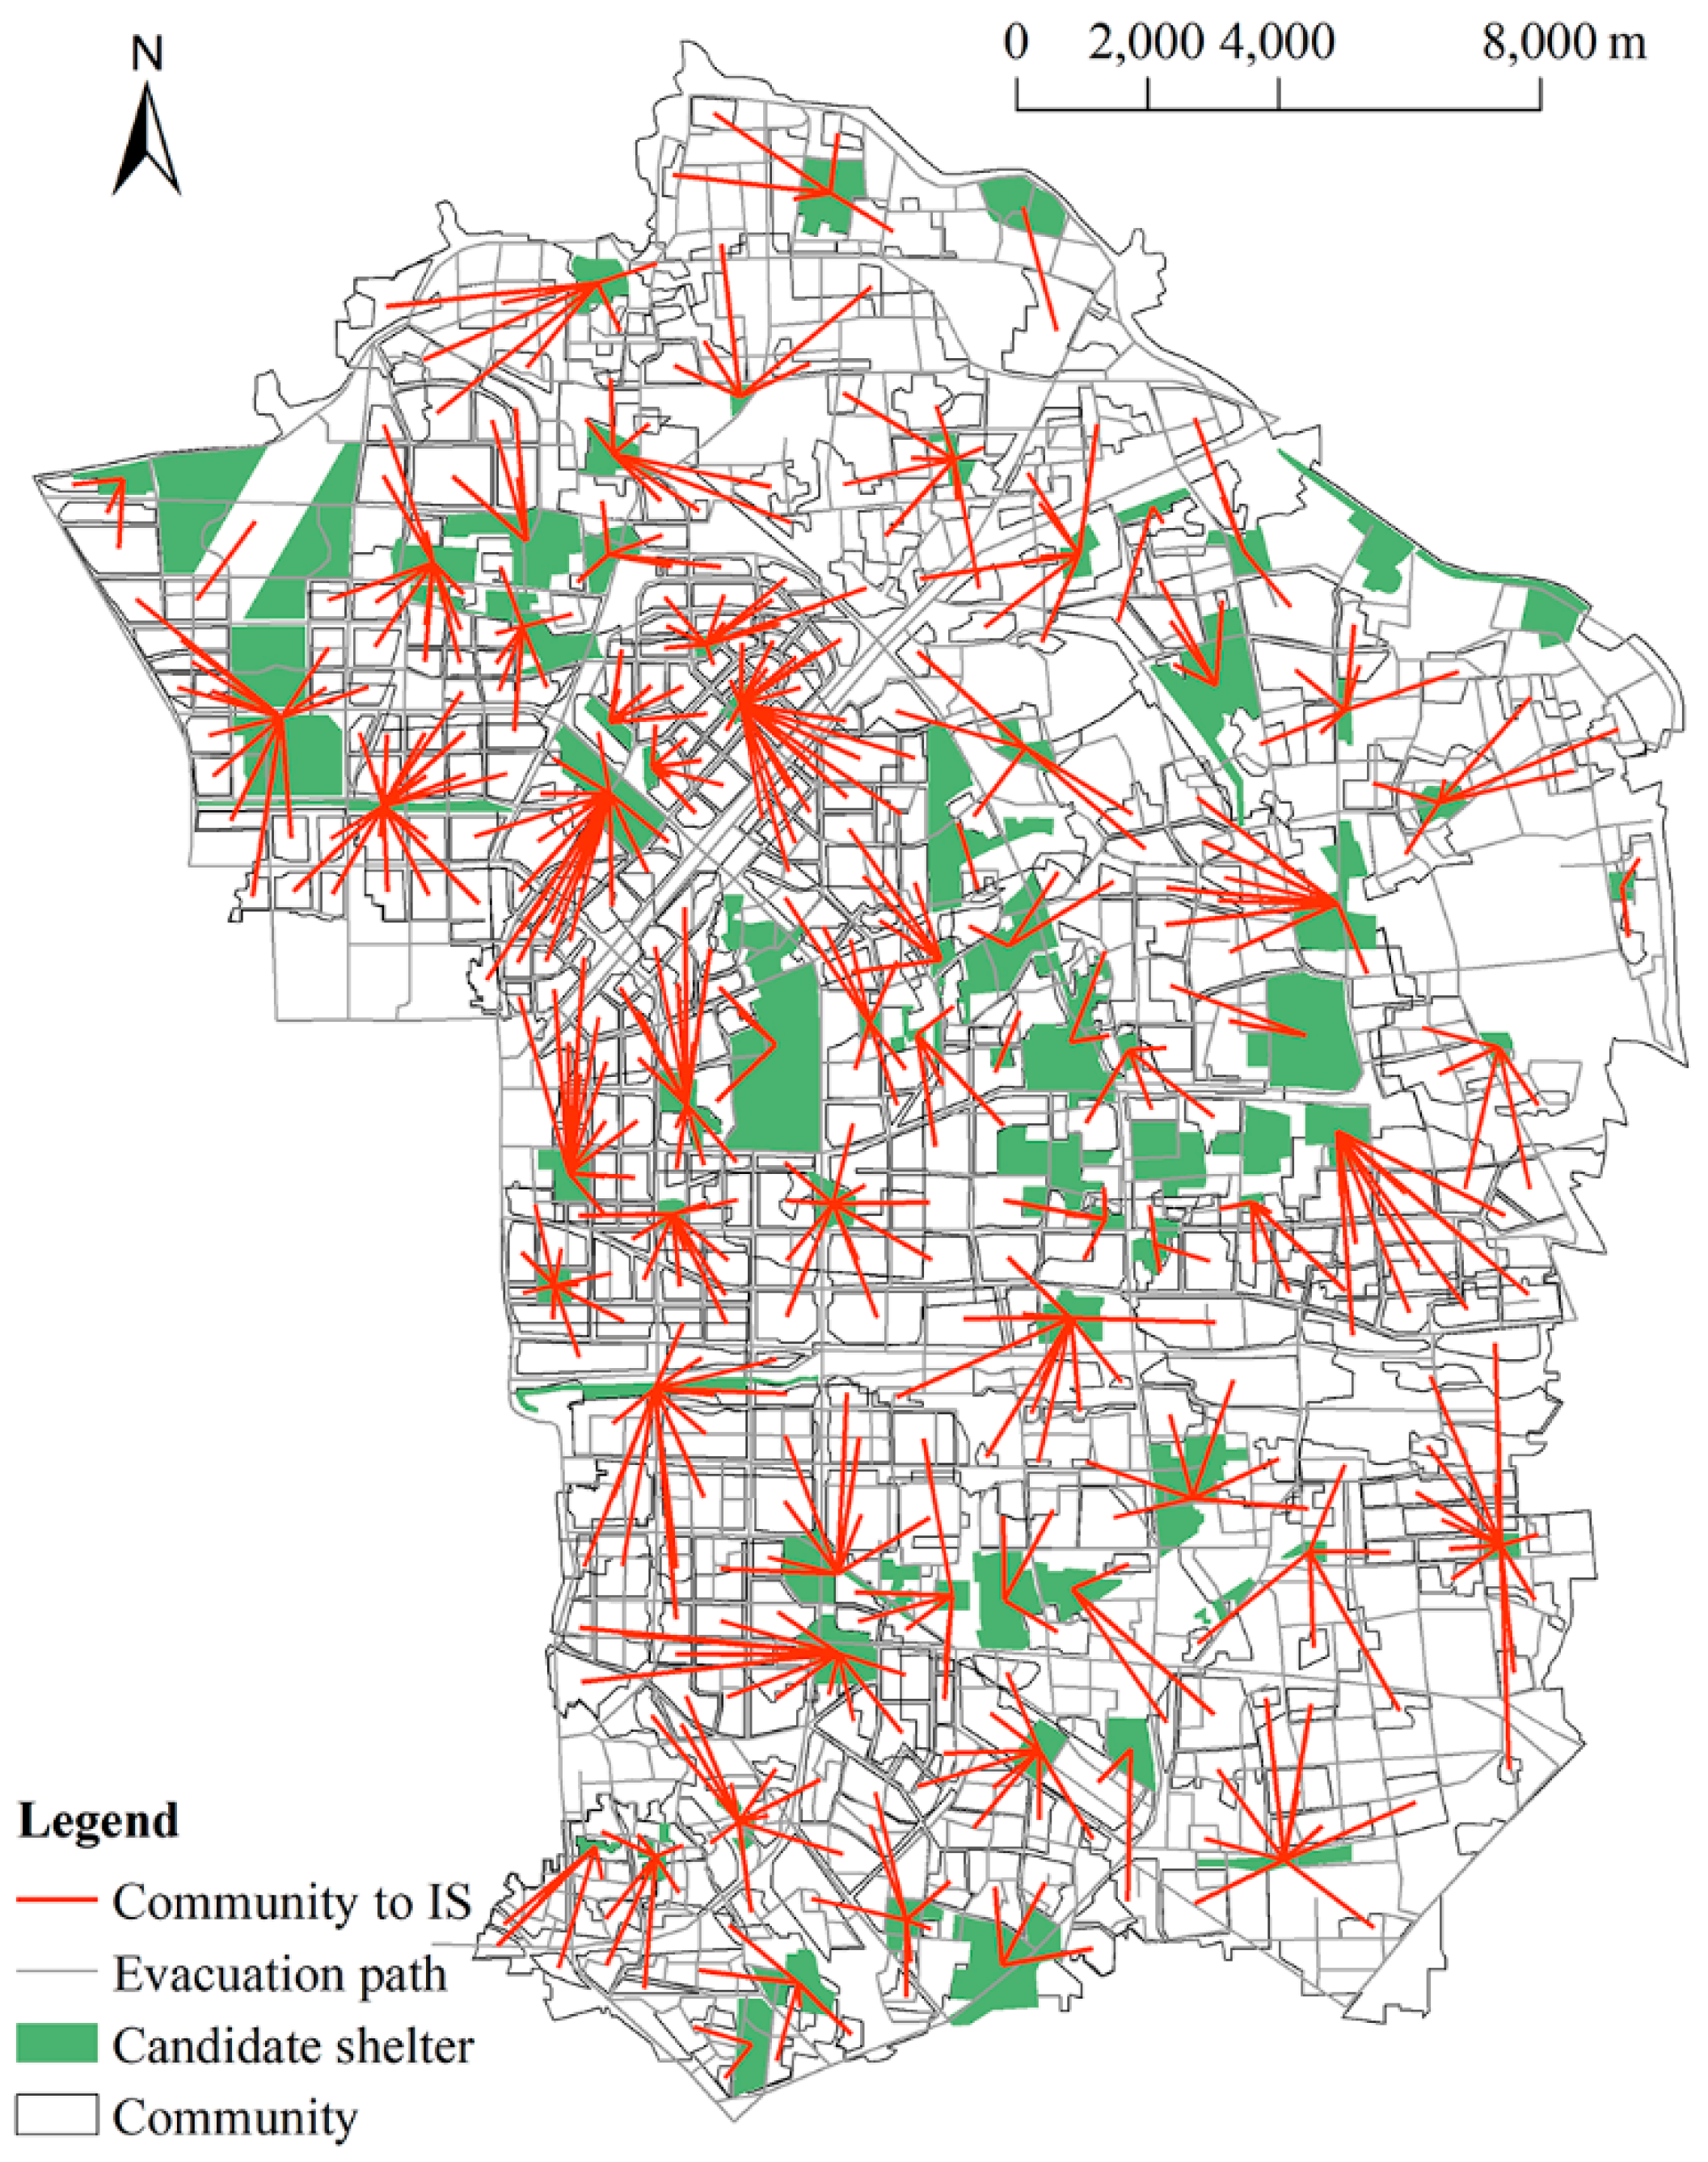
4.1. Results of the Model’s IS Stage

By using the MPSO algorithm on a laptop with 16 GB memory and a 2.2 Hz Intel Core i7, the result of the model’s IS stage was obtained. The execution time of the MPSO to solve the model’s IS stage was around five minutes. The value of objective f1 was 547,060 s, and the evacuation time of each community is shown in Figure 4. It can be seen that most of the evacuation times for these communities were lower than 2500 s and that only evacuees of five communities will take more than 2500 s to reach their ISs. Moreover, 57 communities could arrive at their ISs within 500 s. This indicates that under the location and allocation scheme obtained using the model’s IS stage, evacuees of each community can obtain safe protection quickly after an earthquake.
In Figure 5, the location of ISs selected from candidate shelters in the model’s IS stage and how the communities are allocated to these ISs are shown. A total of 68 candidate shelters were selected to serve evacuees as ISs. Evacuees of each community can arrive at their nearest shelters.

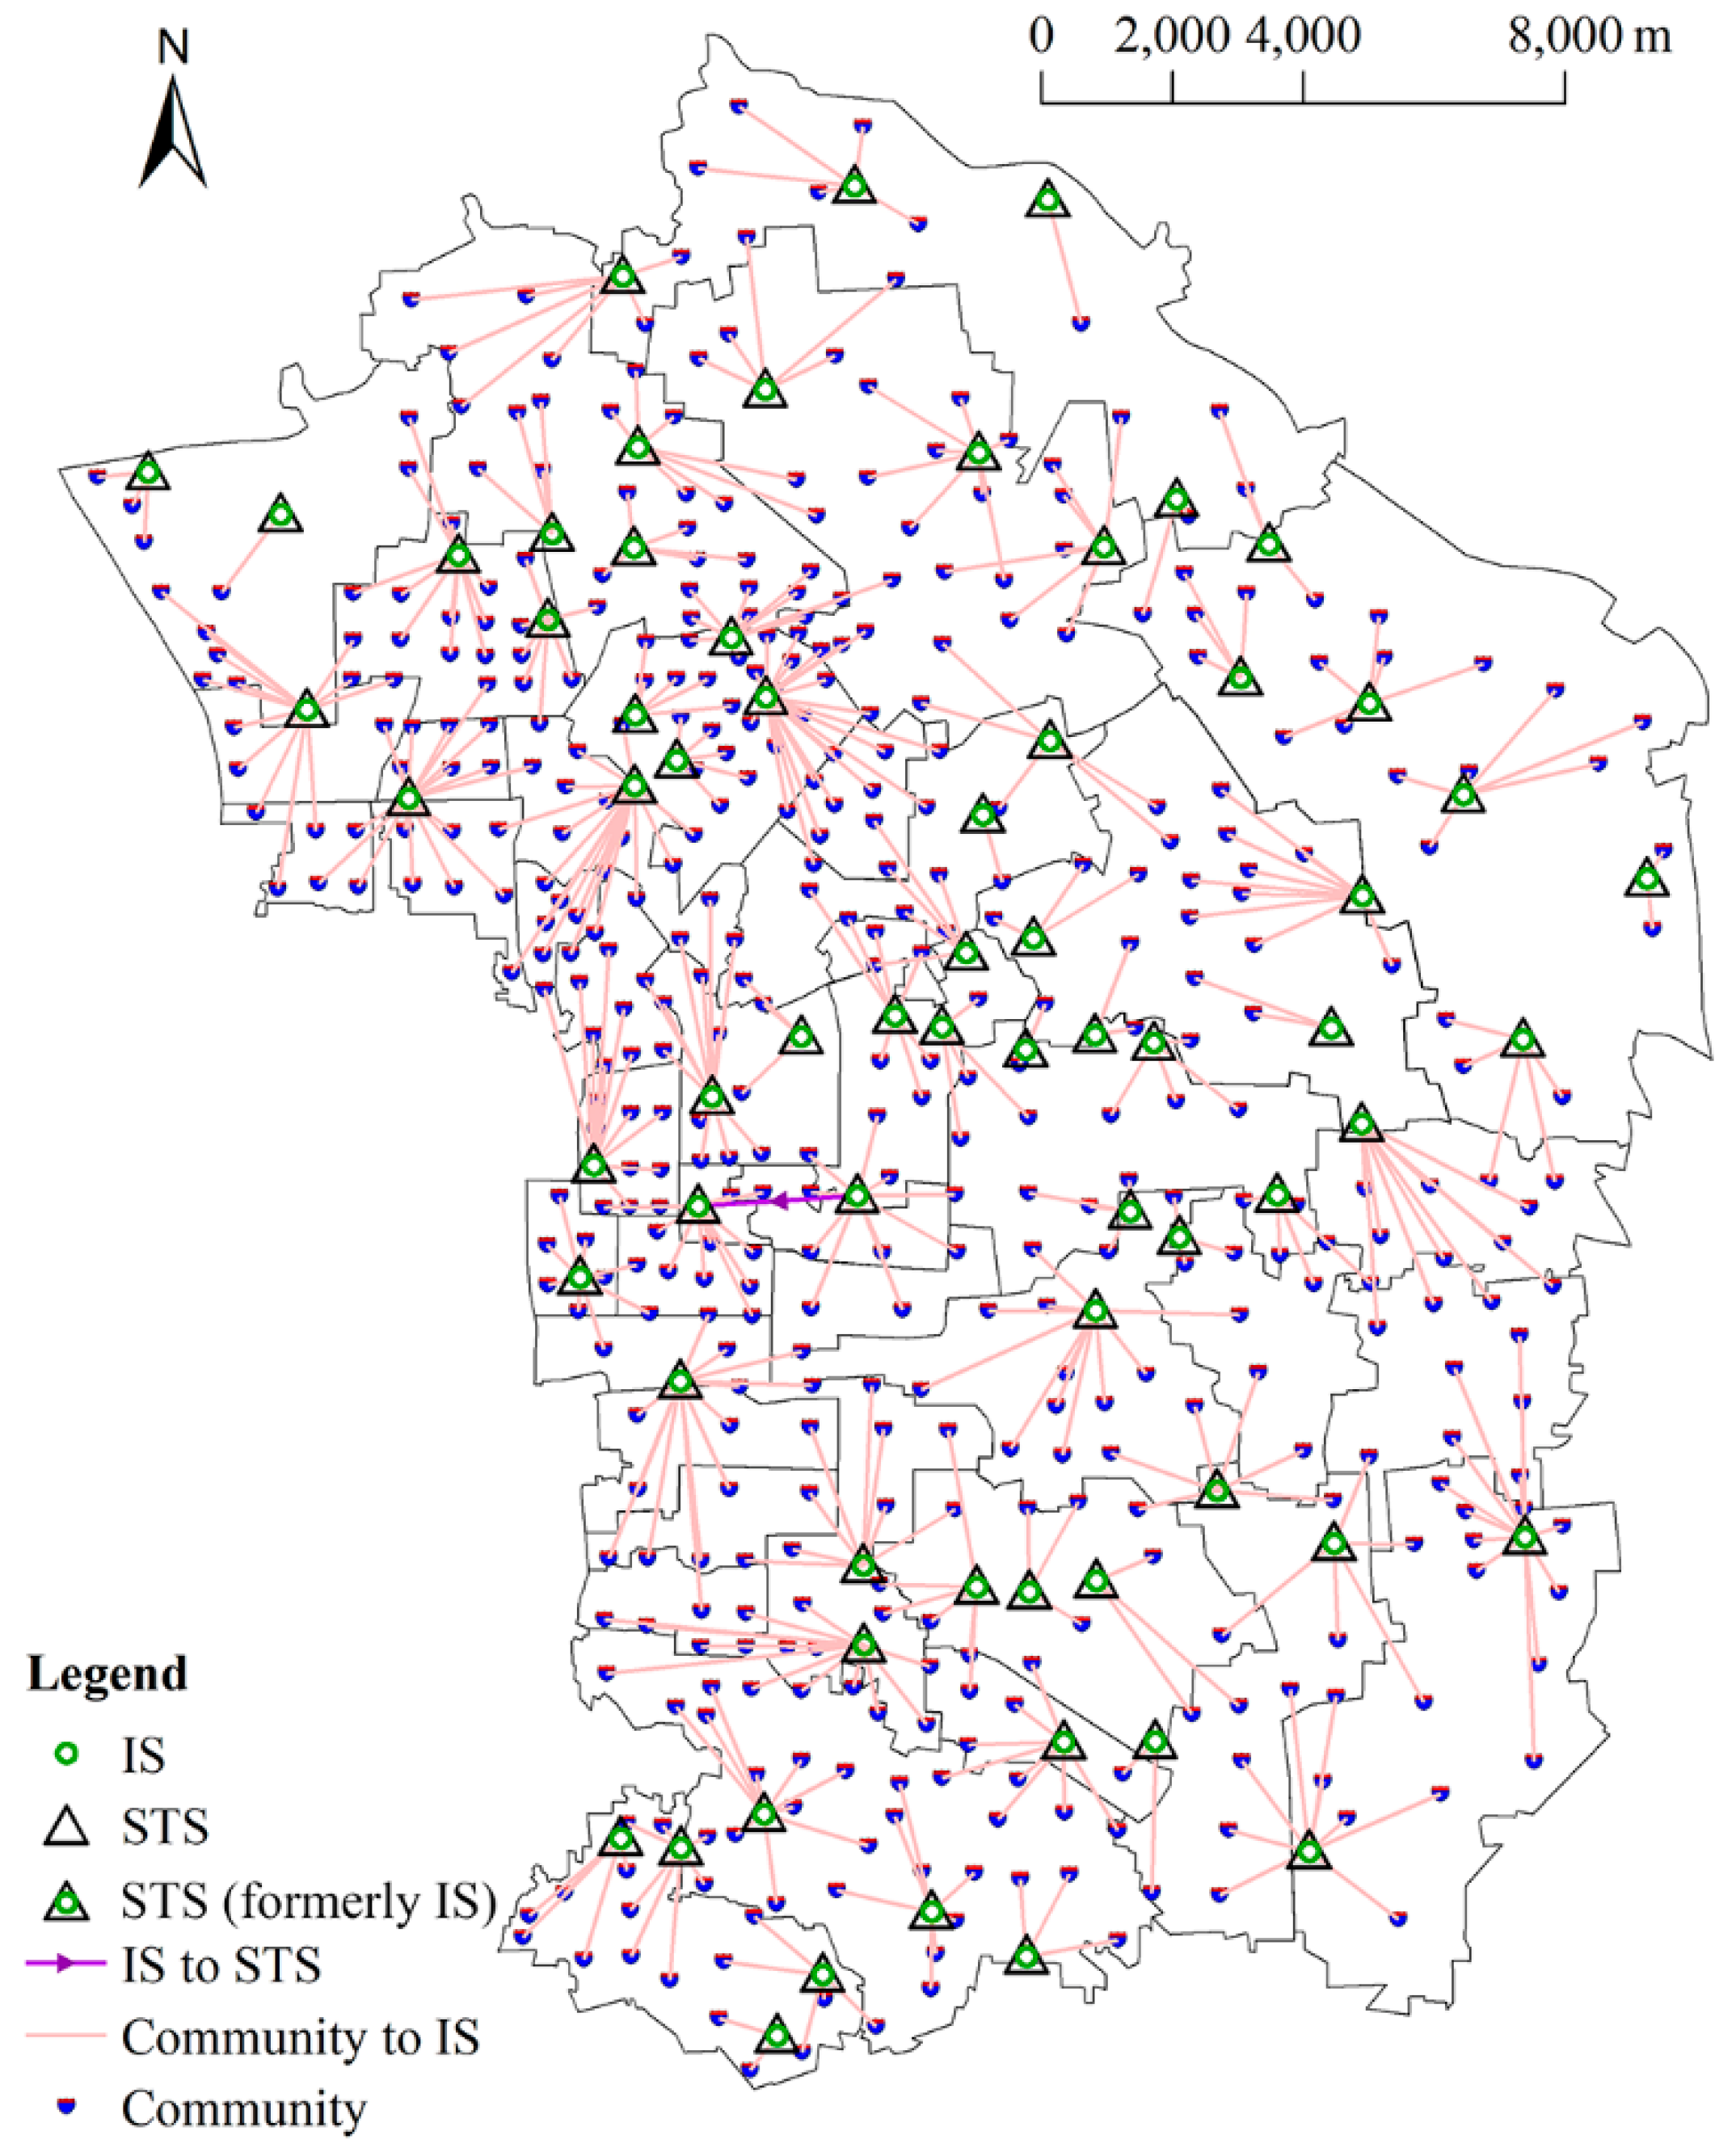
4.2. Results of the Model’s STS Stage

In the STS stage of the model, all of the 463 candidate shelters could potentially be selected as STSs, including those which were selected as ISs in the model’s IS stage. More precisely, among these 463 candidate shelters, 68 shelters were determined to be ISs according to the results of the model’s IS stage. The 68 ISs selected in the IS stage may be selected as STSs in the STS stage. With the MPSO algorithm applying, the result of the STS stage was obtained, as shown in Figure 6. The MPSO algorithm was executed on a laptop with 16 GB memory and a 2.2 Hz Intel Core i7, and its execution time was around five minutes.
Figure 6 indicates that all ISs were also selected to be STSs in the model’s STS stage. However, 29,457 evacuees in shelter 53 should go to shelter 52 in the STS stage as shelter 53 did not have enough capacity to house all of the evacuees allocated to it in the IS stage. The evacuation time of each of these evacuees was around 2002 s.

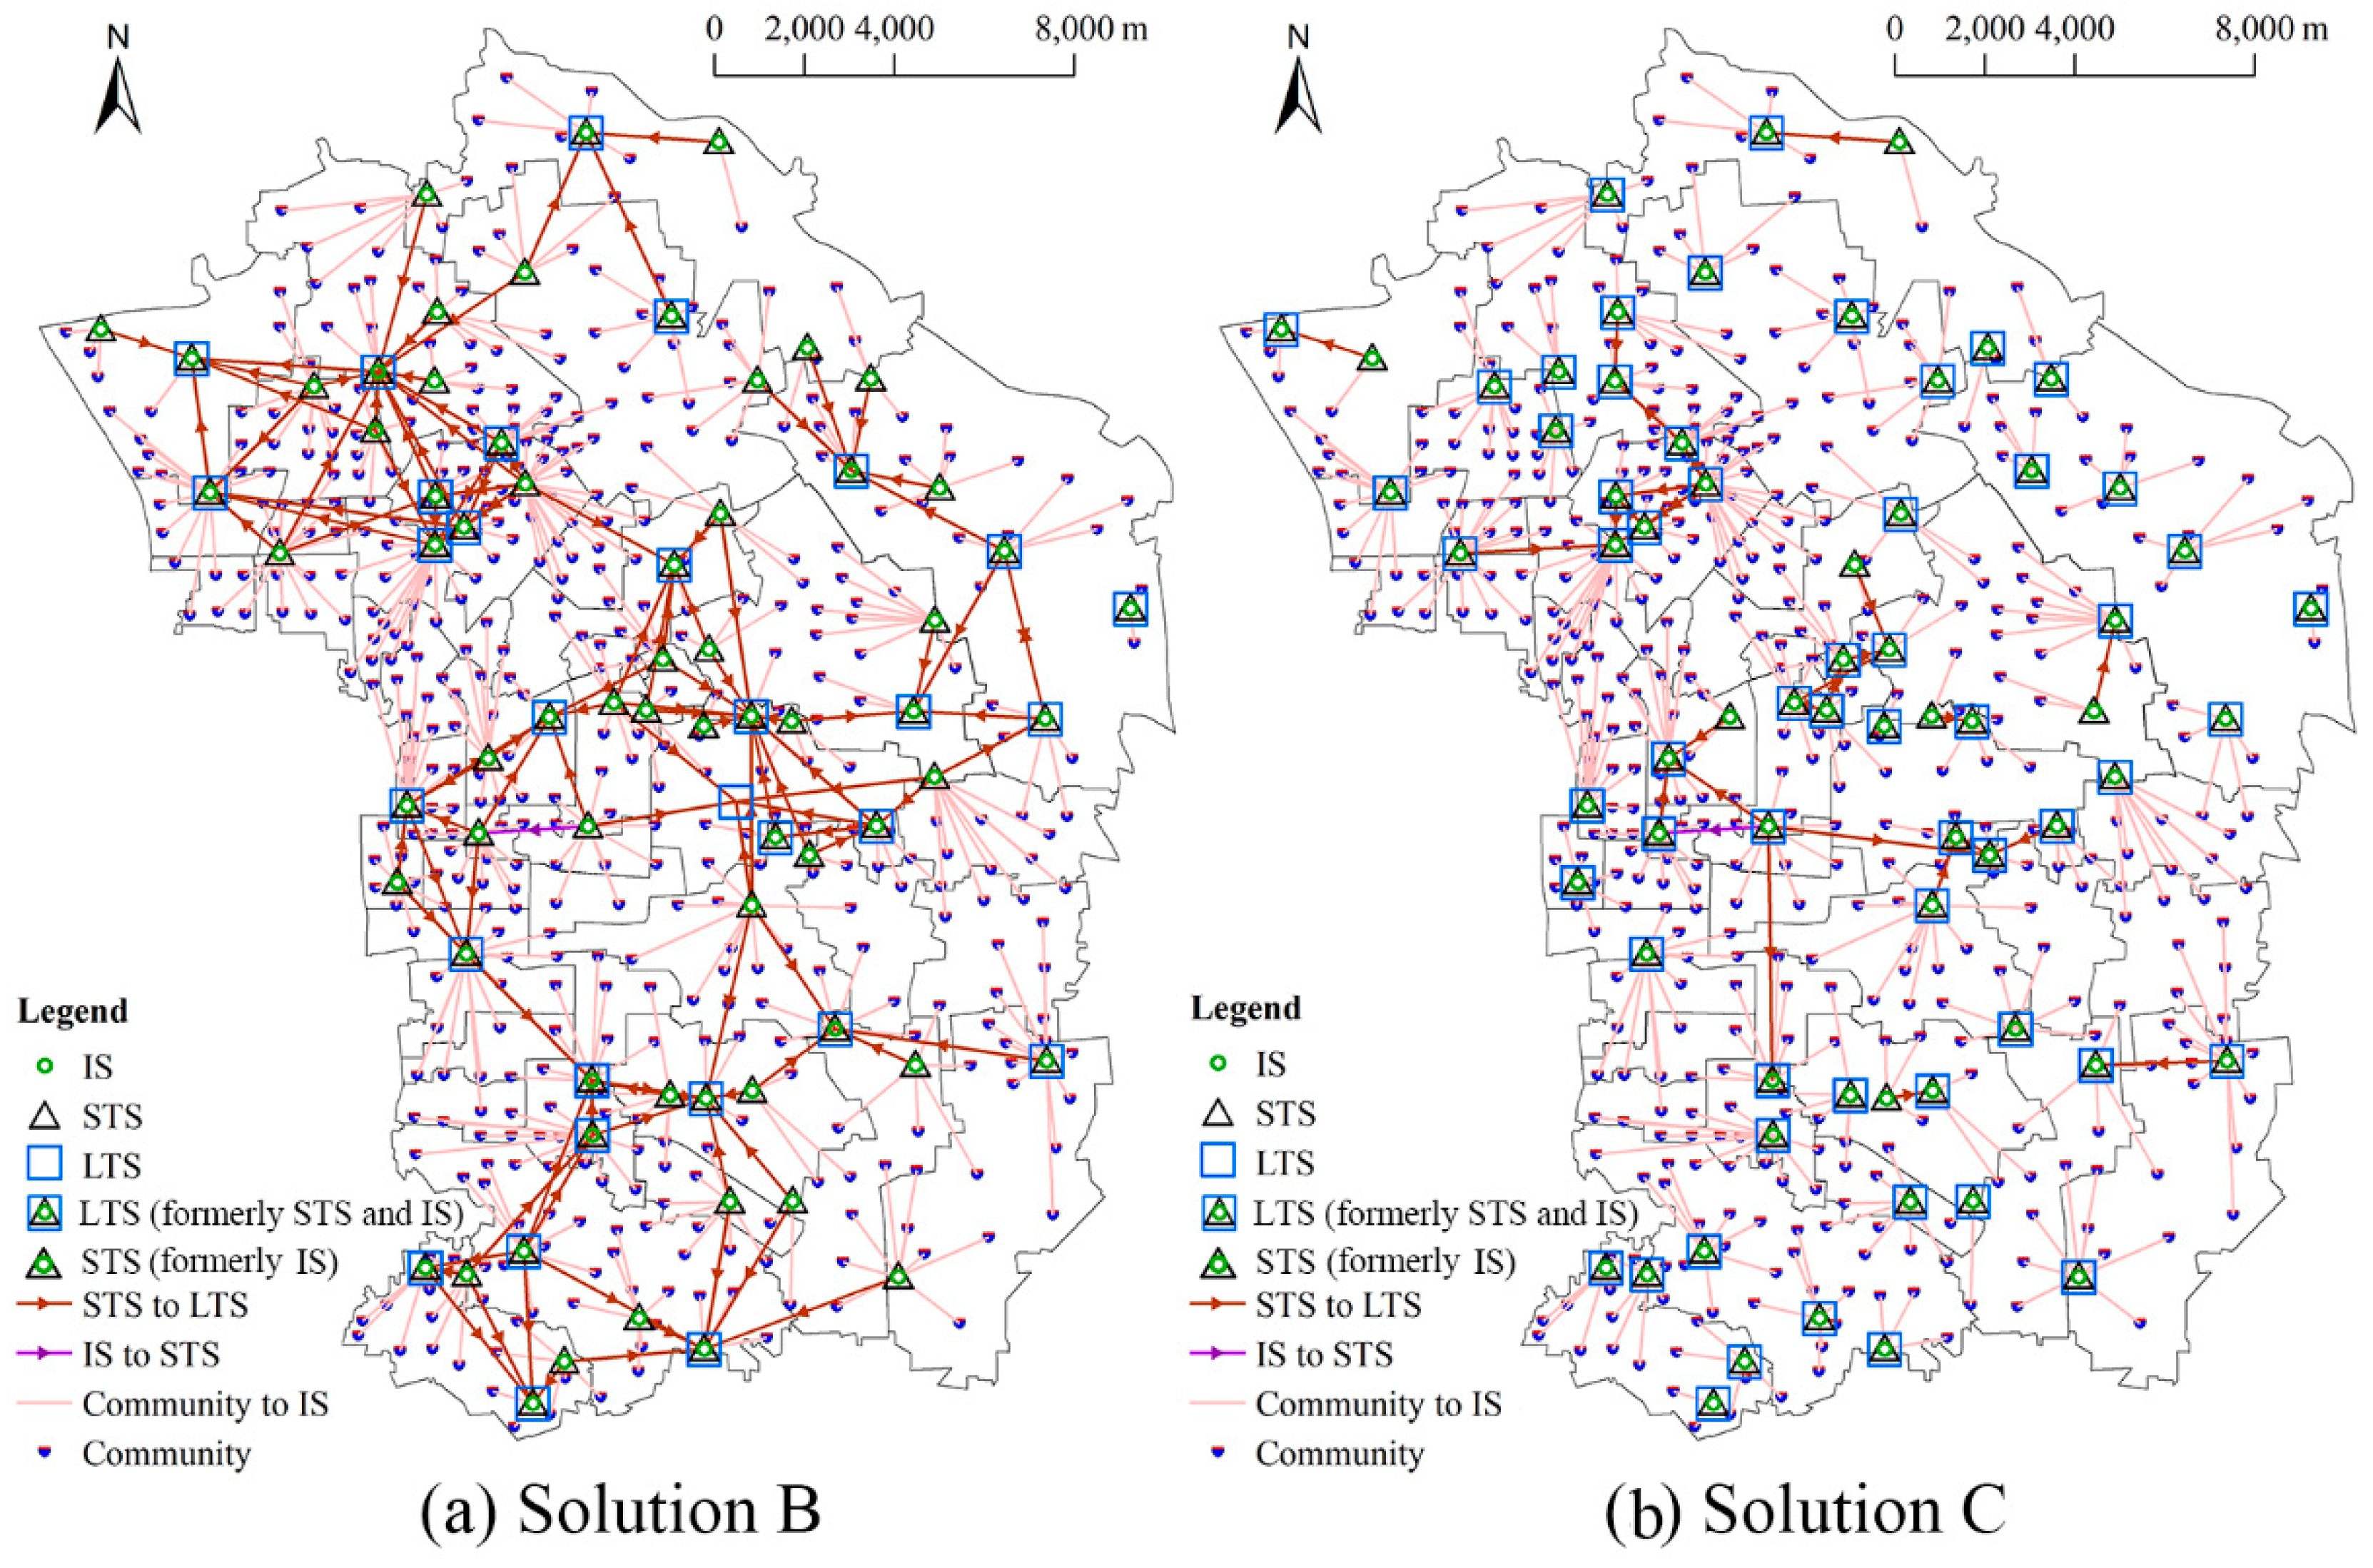
4.3. Results of the Model’s LTS Stage

Similarly to the STS stage, in the LTS stage, all of the 463 shelters could be potentially be selected as LTSs. This means that the candidate shelters selected as ISs in the IS stage and selected as STSs in the STS stage could be selected as LTSs.
As there are two objectives and two constraints in the model’s LTS stage, the problem is a little complex and involves a large number of decision variables. There are two main methods for solving the model with multiple objectives. One is converting the multi-objective problem to a single-objective problem by summing the weighted value of these objectives. The other one is using the Pareto-based method to obtain a Pareto solution set. In this paper, as the weights of the two objectives of the model’s LTS stage are not specific, the Pareto-based method was employed. With the application of an interleaved MPSO-GA algorithm on a laptop with 16 GB memory and a 2.2 Hz Intel Core i7, the model’s LTS stage was solved, and the Pareto solutions obtained are shown in Figure 7. Nine replicates were performed with the algorithm to ensure more accurate results. According to the execution process, the Pareto set stays the same after seven executions. The average execution time is around forty minutes. There were a total of 50 solutions in the Pareto set, as shown in Figure 7. With the increase in TSA, the value of TET decreased. Furthermore, there was a sudden decrease in TET from solution “B” to solution “C”. The solutions labeled “A” and “D” signify those at either end of the Pareto front. For solution “A”, TSA is the least compared with that of other solutions. However, the evacuees needed to take more time to reach their shelters. When the investment budget is not enough, this solution may be an option for the decision-makers. For solution “D”, TSA is highest, ensuring that evacuees can arrive at their shelters in less time. Comparing solution “A” and “B”, it can be seen that the TET decreased from approximately 1,200,000 s to 800,000 s, whereas the TSA increased from approximately 30,000,000 m2 to 35,000,000 m2. However, from solution “B” to “C”, TET decreased sharply from approximately 800,000 s to 100,000 s, whereas the TSA was approximately 35,000,000 m2 for both. In contrast, the TET of solutions “C” and “D” were similar, whereas the TSA increased from 35,000,000 m2 to approximately 52,500,000 m2. In Section 4.4, solutions “A”, “B”, “C”, and “D” in Figure 7 are analyzed.

4.4. Shelter Location and Evacuee Allocation of Chaoyang District

With the solution of the IS, STS, and LTS stages of the model, the shelter location and evacuee allocation of Chaoyang District were obtained. There is only one solution for the model’s IS and STS stages but fifty solutions for the model’s LTS stage. Thus, there are fifty solutions for the selection of ISs, STSs, and LTSs, and the allocation of the evacuees to these. Taking solutions “A” and “D” as examples, the location of ISs, STSs, and LTSs and how evacuees are allocated to them in different stages are presented in Figure 8a,b, respectively.
In Figure 8, it can be seen that with these two different solutions, all shelters that serve evacuees as ISs in the IS stage will be able to serve these evacuees as STSs in the STS stage. However, only a few of them can go on to be selected as LTSs in the LTS stage. In addition, other candidate shelters are selected in this stage to meet the requirements of all evacuees in the LTS stage. For Solution “A” and “D”, the LTS’ locations and evacuees’ allocation to them are different. As shown in Figure 8a, a total of 69 shelters were selected as ISs, STSs, and LTSs, in which 20 shelters were selected as LTSs and 19 of these 20 shelters had been selected as STSs in the STS stage. Thus, for this solution, 49 shelters were selected as STSs that could serve evacuees in the IS and STS stages, whereas 19 shelters were LTSs that could serve evacuees in all three stages. By contrast, one shelter (shelter 3) was selected as an LTS but only served evacuees in the LTS stage. In the LTS stage, the communities in 59 shelters should be reallocated to new shelters from their STSs selected in the STS stage. This is because some shelters can only be STSs and cannot serve evacuees for more than ten days, so the evacuees must go to LTSs for more resources. Some shelters are LTSs that can serve evacuees as ISs, STSs, and LTSs. However, these shelters do not have enough capacity to house all evacuees allocated to them during the STS stage. Thus, these evacuees need to go to other LTSs in the LTS stage. In Table 1, the indices of these 59 shelters, the indices of the LTS their evacuees are reallocated to and the number of evacuees for each LTS are presented. There are essentially two columns to show these three contexts. The column titled “Shelter ID of STS Stage” shows the shelters selected as STSs in the STS stage to which the communities should be reallocated in the LTS stage. The column titled “Shelter ID of LTS Stage (Number of Evacuees)” presents the shelters to which the communities will be reallocated and the number of evacuees that will be reallocated to the corresponding LTSs from the STSs. It can be found that a total of 3,168,144 evacuees need to be reallocated to other shelters in the LTS stage for solution “A”. The number of reallocated evacuees in shelter 53 is the most, whereas the number in shelter 11 is the least.
In Figure 8b, Solution “D” has more LTSs than Solution “A”, whereas fewer evacuees should go to other LTSs in the LTS stage. A total of 70 shelters were selected, including ISs, STSs, and LTSs. Among them, 67 LTSs were selected as ISs and STSs, whereas two LTSs (shelter 3 and shelter 14) would be opened in the LTS stage and one shelter (shelter 7) was only used in the IS and STS stages. Some evacuees of the 13 STSs were reallocated to other LTSs as there was not enough capacity to accommodate all of the evacuees allocated to them in the STS stage. The indices of these 13 shelters, the indices of the LTS to which their evacuees were reallocated, and the number of the evacuees to each LTS are presented in Table 2. In Table 2, it can be seen that the number of evacuees of shelter 43 was the most that should be reallocated to other LTSs. In contrast, only 3202 evacuees of shelter 68 were reallocated to another LTS, which is the least.
As shown in Figure 7, the TSA of both solutions “B” and “C” was close to 350,000,000 m2 but the TET decreased suddenly from more than 800,000 s (solution “B”) to less than 200,000 s (solution “C”). Figure 9a,b show the candidate shelters to be selected as LTSs and how the evacuees in STSs were allocated to them, as indicated by the dark-red lines. A total of 31 and 61 shelters were used as LTSs for solution “B” and “C”, respectively. For solution “B”, only one LTS (shelter 3) was not used in the IS and STS stages, whereas all of the LTSs used for solution “C” were also used in the IS and STS stages.
Similarly to Table 1; Table 2 and Table 3 shows details for solution “B” of the number of evacuees that needed to be reallocated in the LTS stage. Also, the indices of shelters in which the evacuees needed to be reallocated and the indices of the LTSs to which these evacuees needed to be reallocated are presented in Table 3. A total of 2,665,361 evacuees needed to be reallocated to other LTSs. It can be seen that the number of evacuees in shelter 43 that needed to be reallocated was the highest. These evacuees were reallocated to six LTSs, namely, shelters 7, 39, 42, 44, 45, and 46. The number of evacuees in shelter 53 was 225,893, which was the most among all evacuees that needed to be reallocated. Similarly, Table 4 presents the indices of shelters in the STS and LTS stages of solution “C”, for which the evacuees were reallocated in the LTS stage. Also, the number of evacuees of each shelter that needed to be reallocated is shown. There were a total of 520,143 evacuees in 22 shelters who needed to be reallocated to other LTSs for solution “C”. In most of these shelters, the evacuees in the same shelter were reallocated to the same LTS, whereas the evacuees in shelter 43, 53, and 67 were reallocated to different LTSs.
The number of shelters of different types for solution “A”, “B”, “C”, and “D” are presented in Table 5. This table shows that the total number of ISs, STSs, and LTSs are similar, and that the total number for solution “D” is the highest whereas that for solution “C” is the lowest. There are no ISs for any of these four solutions. The evacuees can go to STSs or LTSs that can be used as ISs during the IS stage after an earthquake. For solution “D”, nearly all of the shelters are LTSs, which means that the government needs to invest more in them. The number of LTSs for solution “A” is the least, which means that shelter investment is lower but the evacuation time for evacuees is greater.
The utilized proportion ranges of LTS area for solutions “A”, “B”, “C”, and “D” are shown in Figure 10. It is obvious that the range of solutions “A” and “B” is wider than the range of the other two solutions. The minimum utilized proportion of these four solutions is similar, although that of solution “C” is a little higher. The maximum utilized proportion of solution “A” is higher than that of the other three solutions, which is around one. The utilized proportion of solution “B” and “C” is concentrated around 0.45–0.85, which means that the utilized situations of all LTSs under these two solutions are similar.

5. Conclusions

In this paper, a new hierarchical, multi-objective mathematical model for earthquake shelter location-allocation has been presented. Importantly, different objectives were set for the model’s IS, STS, and LTS stages according to the different requirements of ISs, STSs, and LTSs. Furthermore, an MPSO algorithm and an interleaved MPSO-GA were used in the IS, STS, and LTS stages according to their characteristics. The model was applied to a particular case study to obtain the results of the locations of ISs, STSs, and LTSs, along with how evacuees of each community needed to be allocated to them at different stages.
Chaoyang District of Beijing in China was selected as a case study for using the model and algorithms. The model’s IS and STS stages were solved using MPSO and the results were obtained. A total of 68 shelters were selected as ISs in the model’s IS stage. Then, the result was input into the model’s STS stage and the solution was obtained. It showed that most of the evacuees in ISs could stay in their shelters, as all of these ISs were selected as STSs. Following this, the result of the STS stage was taken into the model’s LTS stage as an input. It was solved using interleaved MPSO-GA, yielding a set of fifty Pareto solutions in terms of TET and TSA objectives. With the presentation of the range of these Pareto solutions, the government can consider the options of where to construct earthquake ISs, STSs, and LTSs with consideration of the construction budget. Furthermore, the government can help evacuees to go to shelters of appropriate types and locations after an earthquake.
In the future, earthquake damage, such as path network damage, could be considered in the model. Then, in terms of the specifications of earthquake shelters, the damage risk of the shelters should also be taken into account. Moreover, the evacuees of a community could be divided into groups with a reasonable scale. Also, the changes in the number of evacuees with time passing could be considered. Furthermore, combining the record of historical earthquakes, earthquakes’ risks may be analyzed and the number of evacuees can be estimated in terms of time passing after an earthquake. Thus, the government can obtain more detailed shelter construction suggestions for these three types.

Author Contributions

Conceptualization, X.Z. and J.C.; methodology, X.Z., J.C., and W.X.; software, X.Z. and W.X.; validation, X.Z., J.C., S.L., and P.D.; formal analysis, X.Z. and W.X.; investigation, X.Z. and S.L.; resources, X.Z.; data curation, X.Z.; writing—original draft preparation, X.Z.; writing—review and editing, X.Z. and K.P.I.; supervision, H.Y. and J.C.; project administration, J.C. and H.Y.; funding acquisition, J.C.

Funding

This research was funded by the National Natural Science Foundation of China and Macau Science and Technology Development Joint Fund (NSFC-FDCT), grant number 71861167002, the National Science Foundation of China, grant number 71790613, and the Tsinghua-Foshan Innovation Special Fund (TFISF), grant number 2018THFS0301.

Conflicts of Interest

The authors declare no conflicts of interest.

References

  1. Datta, T.K. Seismic Analysis of Structures; John Wiley & Sons: Hoboken, NJ, USA, 2010; ISBN 9780470824610. [Google Scholar]
  2. Lin, S.; Sun, Y.; Zhu, Z.; Liu, Z. Investigation on seismic and shock absorption experiments of UHV arrester. In Proceedings of the 2016 Joint International Information Technology, Mechanical and Electronic Engineering, Xi’an, China, 4–5 October 2016; pp. 604–610. [Google Scholar]
  3. Hakimi, S.L. Optimum locations of switching centers and the absolute centers and medians of a graph. Oper. Res. 1964, 12, 450–459. [Google Scholar] [CrossRef]
  4. Hakimi, S.L. Optimum Distribution of Switching Centers in a Communication Network and Some Related Graph Theoretic Problems. Oper. Res. 1965, 13, 462–475. [Google Scholar] [CrossRef]
  5. Toregas, C.; Swain, R.; ReVelle, C.; Bergman, L. The Location of Emergency Service Facilities. Oper. Res. 1970, 19, 1363–1373. [Google Scholar] [CrossRef]
  6. Sherali, H.D.; Carter, T.B.; Hobeika, A.G. A location-allocation model and algorithm for evacuation planning under hurricane/flood conditions. Transp. Res. Part B 1991, 25, 439–452. [Google Scholar] [CrossRef]
  7. Gama, M.; Scaparra, M.P.; Santos, B. Optimal location of shelters for mitigating urban floods. In Proceedings of the EURO Working Group on Transportation, Porto, Portugal, 4–6 September 2013. [Google Scholar]
  8. Kilci, F.; Kara, B.Y.; Bozkaya, B. Locating temporary shelter areas after an earthquake: A case for Turkey. Eur. J. Oper. Res. 2015, 243, 323–332. [Google Scholar] [CrossRef]
  9. Widener, M.J.; Horner, M.W. A hierarchical approach to modeling hurricane disaster relief goods distribution. J. Transp. Geogr. 2011, 19, 821–828. [Google Scholar] [CrossRef]
  10. Chen, Z.; Chen, X.; Li, Q.; Chen, J. The temporal hierarchy of shelters: A hierarchical location model for earthquake-shelter planning. Int. J. Geogr. Inf. Sci. 2013, 27, 1612–1630. [Google Scholar] [CrossRef]
  11. Gama, M.; Santos, B.F.; Scaparra, M.P. A multi-period shelter location-allocation model with evacuation orders for flood disasters. EURO J. Comput. Optim. 2015, 4, 299–323. [Google Scholar] [CrossRef]
  12. Bayram, V.; Tansel, B.T.; Yaman, H. Compromising system and user interests in shelter location and evacuation planning. Transp. Res. Part B Methodol. 2015, 72, 146–163. [Google Scholar] [CrossRef]
  13. Dalal, J.; Mohapatra, P.K.J.; Mitra, G.C. Locating cyclone shelters: A case. Disaster Prev. Manag. 2007, 16, 235–244. [Google Scholar] [CrossRef]
  14. Chang, M.S.; Tseng, Y.L.; Chen, J.W. A scenario planning approach for the flood emergency logistics preparation problem under uncertainty. Transp. Res. Part E Logist. Transp. Rev. 2007, 43, 737–754. [Google Scholar] [CrossRef]
  15. Ting, C.; Chen, C. A multiple ant colony optimization algorithm for the capacitated location routing problem. Int. J. Prod. Econ. 2013, 141, 34–44. [Google Scholar] [CrossRef]
  16. Xu, W.; Ma, Y.; Zhao, X.; Li, Y.; Qin, L.; Du, J. A comparison of scenario-based hybrid bilevel and multi-objective location-allocation models for earthquake emergency shelters: A case study in the central area of Beijing, China. Int. J. Geogr. Sci. 2017, 32. [Google Scholar] [CrossRef]
  17. Ng, M.W.; Park, J.; Waller, S.T. A Hybrid Bilevel Model for the Optimal Shelter Assignment in Emergency Evacuations. Comput. Civ. Infrastruct. Eng. 2010, 25, 547–556. [Google Scholar] [CrossRef]
  18. Doerner, K.F.; Gutjahr, W.J.; Nolz, P.C. Multi-criteria location planning for public facilities in tsunami-prone coastal areas. OR Spectr. 2009, 31, 651–678. [Google Scholar] [CrossRef]
  19. Saadatseresht, M.; Mansourian, A.; Taleai, M. Evacuation planning using multiobjective evolutionary optimization approach. Eur. J. Oper. Res. 2009, 198, 305–314. [Google Scholar] [CrossRef]
  20. Barzinpour, F.; Esmaeili, V. A multi-objective relief chain location distribution model for urban disaster management. Int. J. Adv. Manuf. Technol. 2014, 70, 1291–1302. [Google Scholar] [CrossRef]
  21. Rodríguez-Espíndola, O.; Gaytán, J. Scenario-based preparedness plan for floods. Nat. Hazards 2015, 76, 1241–1262. [Google Scholar] [CrossRef]
  22. Xu, W.; Zhao, X.; Ma, Y.; Li, Y.; Qin, L.; Wang, Y.; Du, J. A multi-objective optimization based method for evaluating earthquake shelter location-allocation. Geomat. Nat. Hazards Risk 2018, 9, 662–677. [Google Scholar] [CrossRef]
  23. China Earthquake Administration. GB 21734-2008 Emergency Shelter and Its Facilities for Earthquake Disasters. Available online: http://www.gb688.cn/bzgk/gb/newGbInfo?hcno=8B2E0D7D4505370BA2CAD64253A354F3 (accessed on 1 July 2019).
  24. Zhao, X.; Coates, G.; Xu, W. A hierarchical mathematical model of the earthquake shelter location-allocation problem solved using an interleaved MPSO-GA. Geomat. Nat. Hazards Risk 2019, 10, 1712–1737. [Google Scholar] [CrossRef]
  25. Li, H.; Zhao, L.; Huang, R.; Hu, Q. Hierarchical earthquake shelter planning in urban areas: A case for Shanghai in China. Int. J. Disaster Risk Reduct. 2017, 22, 431–446. [Google Scholar] [CrossRef]
  26. Zhao, L.; Wang, K.; Wang, J. The Theory and Methods for City Emergency Shelter Planning and Building; Science Press: Beijing, China, 2014. [Google Scholar]
  27. Zhao, L.; Li, H.; Sun, Y.; Huang, R.; Hu, Q.; Wang, J.; Gao, F. Planning emergency shelters for urban disaster resilience: An integrated location-allocation modeling approach. Sustainability 2017, 9, 2098. [Google Scholar] [CrossRef]
  28. Kennedy, J.; Eberhart, R. Particle Swarm Optimization. In Proceedings of the IEEE International Conference on Neural Networks, Perth, Australia, 27 November–1 December 1995; Volume 5, pp. 1942–1948. [Google Scholar]
  29. Goldberg, D.E. Genetic Algorithms in Search, Optimization, and Machine Learning; Addison-Wesley: Boston, MA, USA, 1989. [Google Scholar]
  30. Kirkpatrick, S.; Gelatt, C.D.; Vecchi, M.P. Optimization by Simulated Annealing. Science 1983, 220, 671–680. [Google Scholar] [CrossRef] [PubMed]
  31. Kongsomsaksakul, S.; Yang, C.; Chen, A. Shelter location-allocation model for flood evacuation planning. J. East. Asia Soc. Transp. Stud. 2005, 6, 4237–4252. [Google Scholar]
  32. Hu, F.; Yang, S.; Xu, W. A non-dominated sorting genetic algorithm for the location and districting planning of earthquake shelters. Int. J. Geogr. Inf. Sci. 2014, 28, 1482–1501. [Google Scholar] [CrossRef]
  33. Hu, F.; Xu, W.; Li, X. A modified particle swarm optimization algorithm for optimal allocation of earthquake emergency shelters. Int. J. Geogr. Inf. Sci. 2012, 26, 1643–1666. [Google Scholar] [CrossRef]
  34. Qin, L.; Xu, W.; Zhao, X.; Ma, Y. Typhoon track change-based emergency shelter location-allocation model: A case study of Wenchang in Hainan province, China. Inj. Prev. 2019, 1–8. [Google Scholar] [CrossRef] [PubMed]
  35. Zhao, X.; Coates, G.; Xu, W. Solving the earthquake disaster shelter location-allocation problem using optimization heuristics. In Proceedings of the 14th International Conference on Information Systems for Crisis Response and Management (ISCRAM 2017), Albi, France, 21–24 May 2017. [Google Scholar]
  36. Zhao, X.; Chen, J.; Du, P.; Xu, W.; Liu, R.; Yuan, H. Location-allocation model for earthquake shelter solved using MPSO algorithm. In Proceedings of the ISCRAM 2019, Valencia, Spain, 19–22 May 2019; pp. 105–115. [Google Scholar]
Figure 1. Evacuation distance adjustment.
Sustainability 11 04561 g001
Figure 2. Location of (a) Beijing in China and (b) Chaoyang District in Beijing.
Sustainability 11 04561 g002
Figure 3. (a) Candidate shelter and evacuation paths, and (b) community population distribution and candidate shelter location.
Sustainability 11 04561 g003
Figure 4. Evacuation time of each community.
Sustainability 11 04561 g004
Figure 5. Location and allocation in the immediate shelter (IS) stage.
Sustainability 11 04561 g005
Figure 6. IS and short-term shelter (STS) location and evacuees’ allocation.
Sustainability 11 04561 g006
Figure 7. Pareto solution of model’s long-term shelter (LTS) stage.
Sustainability 11 04561 g007
Figure 8. Shelter location and evacuee allocation for (a) solution “A” and (b) solution “D”.
Sustainability 11 04561 g008
Figure 9. Shelter location and evacuee allocation of solution “B” and solution “C”.
Sustainability 11 04561 g009
Figure 10. Occupied rate of LTSs for solutions “A”, “B”, “C”, and “D”.
Sustainability 11 04561 g010
Table 1. Number of evacuees from STS to LTS in the LTS stage for Solution “A”.
Shelter ID of STS StageShelter ID of LTS Stage (Number of Evacuees)
21 (86,394)
469 (45,510)
613 (26,147)
769 (3202)
89 (9794); 69 (12,798)
109 (10,375)
119 (3099)
153 (63,905); 16 (7691)
1669 (48,716)
1713 (29,563)
1869 (113,688)
1920 (98,204); 21 (48,046)
2021 (70,103)
2126 (13,784); 65 (11,001)
2265 (21,581)
2326 (37,214)
2426 (55,865)
2526 (53,653)
2726 (16,489)
2826 (5426)
2926 (37,513)
3022 (35,333); 65 (35,586)
3113 (43,349)
3213 (17,081)
3334 (4685)
3539 (46,109)
3639 (23,582)
3739 (18,179)
3839 (14,497)
3962 (14,415)
4062 (100,961)
4162 (56,118)
4239 (35,268)
437 (117,749)
4439 (37,154)
4539 (12,024); 61 (32,820)
4639 (125,945); 61 (31,903)
4739 (27,076); 61 (177,726)
4834 (39,155)
499 (16,039)
501 (60,908)
511 (80,668)
521 (120,275)
531 (225,893)
5520 (210,987)
5626 (49,811)
5719 (31,317)
5913 (23,896)
6162 (122,307)
6362 (33,473)
6421 (1764); 65 (9916)
6669 (14,491)
671 (66,585)
6813 (8449)
7013 (13,757)
7121 (4308); 26 (25,916)
721 (46,425)
Table 2. Number of evacuees from STS to LTS in the LTS stage for solution “D”.
Shelter ID of STS StageShelter ID of LTS Stage (Number of Evacuees)
268 (30,230); 72 (22,330)
768 (3202)
1614 (23,307)
3022 (4607)
4238 (3835)
4342 (7462); 44 (11,583); 45 (29,997); 46 (8416);
4446 (10,718)
4544 (29,486)
4746 (28,819)
5250 (57,188)
533 (91,056)
6768 (29,181)
696 (8564)
Table 3. Number of evacuees from STS to LTS in the LTS stage for solution “B”.
Shelter ID of STS StageShelter ID of LTS Stage (Number of Evacuees)
21 (37,560); 3 (7792); 7 (22,330); 69 (18,712)
469 (45,510)
613 (7147); 69 (19,000)
87 (9794); 69 (12,798)
109 (10,375)
119 (3099)
153 (55,078); 16 (4759); 59 (11,759)
163 (2281); 4 (10,748); 69 (35,687)
1716 (22,890); 69 (6673)
183 (23,082); 21 (23,909); 65 (57,957); 69 (8740)
1920 (104,144); 21 (10,237)
2021 (65,524)
2265 (21,581)
2321 (6188); 26 (31,026)
2421 (19,666); 26 (36,199)
2526 (52,653)
2726 (2011); 28 (14,478)
2926 (37,513)
3065 (1860)
3113 (43,349)
329 (2388); 13 (5095); 59 (1646)
3334 (4685)
3539 (46,109)
3639 (23,582)
3734 (4340); 39 (13,839)
3839 (14,497)
3962 (6380)
4039 (31,565); 61 (27,205); 62 (42,191)
4139 (26,442); 46 (9194); 62 (20,482)
4239 (17,527); 45 (4423); 46 (7385)
437 (25,924); 39 (24,903); 42 (2276); 44 (4056); 45 (2154); 46 (58,436)
4439 (3364); 46 (25,172)
4539 (12,024); 46 (18,218); 61 (4016)
4645 (16,490); 61 (16,079)
4739 (7759); 44 (9761); 61 (187,282)
4834 (18,232)
499 (16,039)
501 (55,273); 51 (5635)
511 (32,597); 55 (1762)
521 (18,579); 51 (34,363); 55 (67, 315)
531 (209,948); 3 (15,945)
5451 (13,074); 55 (69,356)
5520 (134,257)
5619 (1944); 20 (10,492); 26 (17,654); 28 (4723); 58 (4112)
5719 (2387): 28 (25,750); 58 (3180)
5828 (10,859)
5913 (12,067); 32 (6074)
6162 (15,712)
6362 (33,473)
6421 (8809); 65 (2871)
6669 (14,491)
671 (52,817); 7 (2640); 69 (11,128)
687 (5037); 69 (3412)
709 (14,689)
7120 (14,081); 21 (16,143)
727 (14,536); 69 (31,889)
Table 4. Number of evacuees from STS to LTS in the LTS stage for solution “D”.
Shelter ID of STS StageShelter ID of LTS Stage (Number of Evacuees)
150 (16,351)
268 (30,230); 72 (22,330)
417 (11,422)
768 (3202)
1331 (9847)
1617 (23,307)
184 (4892)
2164 (33,108)
3022 (4607)
3334 (4685)
3638 (983)
4238 (3835)
4342 (7462); 44 (11,583); 45 (29,997); 46 (8416)
4446 (10,718)
4544 (29,486)
4746 (28,819)
5250 (57,188)
5317 (15,945); 20 (43,167); 50 (31,944)
6263 (13,193)
6768 (29,181); 72 (8672)
696 (13,757)
7267 (11,816)
Table 5. Number of different types of earthquake shelters for solutions “A”, “B”, “C”, and “D”.
SolutionTotal Number of ISs, STSs, and LTSsNumber of ISsNumber of STSs That Also Serve Evacuees in IS StageNumber of STSs That Only Serve Evacuees in STS StageNumber of LTSs That Also Serve Evacuees in IS and STS StagesNumber of LTSs That Only Serve Evacuees in LTS Stage
A690490191
B690380301
C68070610
D70010672

