Article

The Influences of Government Subsidies on Performance of New Energy Firms: A Firm Heterogeneity Perspective

Management School, China University of Mining and Technology, Xuzhou 221116, China
*
Authors to whom correspondence should be addressed.
Sustainability 2019, 11(17), 4518; https://doi.org/10.3390/su11174518
Submission received: 21 June 2019 / Revised: 9 August 2019 / Accepted: 14 August 2019 / Published: 21 August 2019

Abstract

:
Based on the empirical analysis of panel data on new energy listed companies in China, the relationships among government subsidies, enterprise research and development input (R&D input), and firm performance are explored to measure the impact of government subsidies on firm performance and the mediation mechanism of R&D input. In addition, the effects of the moderation variables of regional characteristics and state ownership are measured from the enterprise heterogeneity perspective. The results show that government subsidies have a positive promoting effect on R&D input; R&D input has a two-year lag positive effect on firm performance; government subsidies have a two-year lag positive effect on firm performance through the mediation role of R&D input. Regional characteristics and enterprise properties moderate the effect of government subsidies on firm performance. Government subsidies have a greater positive effect on firm performance in the eastern coastal areas than they do in mid-west coastal areas, and there is a crowding-out effect on the mid-west coastal areas. Government subsidies have a greater positive effect on the performance of non-state-owned enterprises than they do on state-owned enterprises. Suggestions are provided for the government to adjust subsidy policy and improve the performance of new energy enterprises.

1. Introduction

All countries worldwide pay great attention to the development of the new energy industry and the promotion of low-carbon economics [1]. A considerable amount of capital should be invested in product R&D, technology upgrading, and the production and sales of new energy companies. The Chinese government has actively adopted financial subsidies to support the development of new energy companies in recent years. However, some scholars have proved that government subsidies will cause slack in internal management and collusion between the government and enterprises, which will have a negative impact on firm performance [2,3]. Government subsidy policies and R&D input have become core issues in the development of new energy companies in China, and the relationships among government subsidies, R&D input, and firm performance is a difficult but hot topic in academic research.
In terms of the relationship between government subsidies and firm performance, many studies have analyzed the relationship between political connections and financial subsidy performance, and they have confirmed the existence of rent-seeking problems [4]. Document [5] showed that different enterprises can obtain subsidies of different levels, and that financial subsidies can have different impacts on firm performance. Li’s research showed that financial subsidies can significantly improve firm performance, but she used only a limited number of research samples and did not provide a detailed description of the impact of financial subsidies on enterprises of different state ownership, enterprises in different regions or enterprises in different industries [6]. For example, government financial support is beneficial for increasing the efficiency of large new energy vehicle firms [7]. When researching the relationship between government subsidies and R&D input, some scholars have claimed that government subsidies are conducive to reducing investment costs and the risks of enterprises, stimulating enterprises to invest in R&D, giving full play to positive external benefits of R&D input, which will ultimately enhance the R&D innovation ability of the entire industry. Therefore, government subsidies can promote the R&D input of enterprises [8]. However, some scholars believe that government subsidies will squeeze private funds out of original advances. Therefore, government funds will lose their effectiveness due to the reduction in private investment, which means that government subsidies will have an extrusion effect on corporate R&D input [9,10].
In recent years, an increasing number of research conclusions have shown that the impact of government subsidies on the R&D input of enterprises does not have a unilateral promotion effect or crowding-out effect [11]. Government subsidies have a significantly positive impact on R&D intensity [12]. Both effects exist at the same time, and they are exerted at different effects under different situations [13,14,15]. Government subsidies have a significantly positive impact on R&D intensity in assembly enterprises but are nonsignificant in supporting enterprises in the new energy vehicle industry [12]. As for green innovation, government R&D subsidies can increase the green innovation of energy-intensive firms, and the impact is stronger in state-owned enterprises and in small and medium enterprises [16]. When researching the relationship between R&D input and firm performance, most scholars have claimed that R&D input has a significant positive correlation with firm performance [17]. Subsidies do lead to increased patent output [11]. Some scholars have purported that R&D input is not related to firm performance [18]. Other scholars claimed that R&D input is negatively correlated with firm performance [19]. In conclusion, people still hold controversial opinions of research results on the relationships among government subsidies, R&D input, and firm performance, but there is still a lack of research on new energy companies. This paper uses panel data on new energy listed companies from 2012 to 2016 to establish a model to explore the relationships among government subsidies, R&D input, and firm performance and to reveal mediating mechanism of R&D input and the heterogeneity of enterprises. The novelty of this paper is that it focuses on exploring the boundary of the effect of government subsidies on the firm performance of new energy industry from the firm heterogeneity perspectives of corporate nature on state ownership and geographical characteristics explicated by institutional logic and efficiency logic. In addition, this study provides some practical and feasible suggestions for improving China’s new energy technology innovation activities and ultimately improving firm performance from the perspective of the government and corporations.

2. Literature Review and Research Framework

2.1. Government Subsidies and R&D Input

Document [20] claimed that the generation of externalities is caused by production or consumption behaviors which allow certain groups to produce for free or consume for free. Modern economic theories hold that the external economy will break the balance between supply and demand in the market, form insufficient supply, and reduce the efficiency of resource allocation in society. Therefore, government subsidies need to be internalized. Pigou pointed out the government’s intervention can reduce this externality, that government stimulates the market through government subsidies and seeks a new balance between supply and demand in the market [21]. Enterprise R&D activities require a large amount of money, which will make enterprises face significant uncertainty and risks. R&D results are similar to public goods, so an enterprise cannot enjoy all benefits alone, which will reduce enterprises’ enthusiasm to carry out R&D activities [22]. Under this circumstance, the government intervenes through financial subsidies, which can guide the rational allocation of resources and correct market failures, thus improving the enthusiasm of enterprises for R&D and innovation. Therefore, this paper presents hypothesis 1 based on the externality theory of R&D activities [23,24,25].
Hypothesis 1 (H1).
Government subsidies of a new energy firm have a positive impact on its R&D input.
New energy companies are also heterogeneous. State-owned enterprises, foreign-funded enterprises, and private enterprises have certain gaps in scientific research and innovation behaviors due to their different property rights [24]. Pan and Liu’s research on the technological innovation of Chinese industrial enterprises shows that an increase in the proportion of non-state-owned enterprises has a significant effect on promoting technological innovation in industrial enterprises [25]. When the government subsidizes the R&D and innovation activities of state-owned enterprises, its role in R&D innovation should be exerted through internal activities, and innovation activities will also be affected by problems caused by enterprise ownership. Wang’s research found that government investment can significantly promote innovation activities in high-technology industries [23]. However, government investment has different impacts on technological innovations because of the different ownership structures of the industry. The impact of subsidies is more significant for non-state-owned enterprises than state-owned ones [26]. When a state-owned economy holds a higher proportion, government investment will have a smaller impact on technological innovation [27]. Government subsidies significantly decrease the likelihood of firm exit, and the effect decreases as the level of subsidies increases for private and foreign firms but displays a nonlinear relationship across subsidy levels for state-owned firms [28]. Therefore, this paper proposes hypothesis H1a:
Hypothesis 1a (H1a).
Government subsidies can more greatly promote R&D input by non-state-owned new energy companies than that by state-owned new energy companies.
When considering differences in regions where companies are located, it can be considered that enterprises in more economically developed regions are more competitive than those in other regions. The economy is more open and involves higher levels of marketization and higher management levels. Internal governance is more scientific and perfect, so it can use resources more efficiently to improve the innovation efficiency of enterprises [15,29]. Therefore, hypothesis H1b is proposed:
Hypothesis 1b (H1b).
Government subsidies have a stronger effect on R&D input by new energy companies in eastern coastal areas than those in mid-west coastal areas.

2.2. R&D Input and Firm Performance

According to technological innovation theory and production factors theory, science and technology have an increasingly apparent role in the economic development process. Scientific and technological innovation achievements can enhance the economic value, scarcity, and newness of resources and lead to certain exclusivity and monopoly, which improves the performance of enterprises. New growth theory emphasizes that human capital and R&D input are the most important factors driving technological innovation and efficiency improvement. When R&D input accounts for more than 4% of sales revenue, it can lead to high growth and improve firm performance [13].
However, continuous experiments and tests must be performed that consider the stage where capital is invested and the stage where technologies and products are formed. Only after those things are done can products be released to the market. This finding indicates that there is a certain lag in the impact of R&D input on firm performance [30]. This study finds that in private sectors, R&D input can significantly improve one-year hysteretic performance. Document [31] added the lag period variable in their study and found that if there is no lag period, government R&D subsidies will have no significant impact on corporate investment. When the lag period is added, government subsidies have a significant role in promoting R&D input. Many scholars have shown that increasing government subsidies can improve firm performance by promoting the technological innovation activities of enterprises [26,32,33,34]. However, R&D activities are high-risk creative activities. Enterprises need to go through a series of complicated processes from obtaining financial subsidies to investing in R&D activities before they finally have outputs and can improve firm performance. The R&D input in the 2 lagged phase is significantly and positively correlated with firm performance [35]. Some studies have shown that it takes one to two years for government subsidies to take effect [36]. Therefore, hypothesis H2 is proposed:
Hypothesis 2 (H2).
R&D input of new energy firm has a significant positive impact on its performance, but this impact has a certain lag effect.
Document [37] claimed that R&D input has a significant impact on firm performance, and the level of this impact varies in different industries. Zhou et al. purported that state-owned enterprises can obtain more R&D resources, but the internal system makes the utilization efficiency of state-owned enterprises low [38]. Although state-owned holdings have a positive impact on R&D input, they also weaken the impact of R&D input on innovation performance. Therefore, hypothesis H2a is proposed.
Hypothesis 2a (H2a).
R&D input of new energy firms can have stronger effects on the performance of non-state-owned new energy firms than that of state-owned new energy firms.

2.3. Government Subsidies and Firm Performance

According to stakeholder theory, governments and new energy companies are interrelated. The government’s support for the development of new energy enterprises will improve the economic level and promote the use of clean energy, control carbon emissions, and achieve environmental protection as well as develop the local economy. In addition, government support can also improve government performance and help the government solve many social problems such as employment and environmental protection. The government wants to promote its performance by giving new energy companies a certain amount of funding [39].
According to market failure theory, it is impossible to maximize resource allocation by totally relying on markets alone, and appropriate government intervention in the market can help maximize resource allocation. Government subsidies are an important means for the government to intervene in the market. The government allocates funds to new energy companies through providing subsidies, which will help guide the healthy development of these companies. The allocation of resources under China’s planned economic system is mainly guided by the government. Government subsidies are mainly used to guide the economy so it can develop in accordance with government directives [40]. Under the influence of the market system, the market plays a decisive role in resource allocation, and government subsidies have become an important means of regulating the market economy and guiding the development of enterprises. Financial subsidies have a positive effect on the operating efficiency of enterprises [41]. R&D activities are high-risk creative activities, and companies need to go through a series of complicated processes from obtaining financial subsidies to investing in R&D activities to form outputs and improve their firm performance. Some studies have shown that it takes one to two years for government subsidies to take effect [35]. Therefore, hypothesis H3 is proposed.
Hypothesis 3 (H3).
Government subsidies have a significant positive impact on the performance of new energy companies, but they have a certain lag.

2.4. Mediating Effect of R&D Input on the Impact of Government Subsidies on the Performance of New Energy Companies

Theory of fiscal policy transmission mechanisms focuses on how government revenue distribution affects total social supply and demand and achieves fiscal policy objectives. In the case of an imbalance between aggregate supply and aggregate demand, it is far from enough to rely solely on the “market regulation” role of fiscal policy. It is necessary for governments to adopt different fiscal policy measures according to different situations, which will affect the disposable income of enterprises and residents. Then, these policy measures will adjust total social demand [42]. Government subsidies can redistribute income, and the government intervenes externally through fiscal policy, which will mitigate cost risks caused through the “spillover effect” of R&D activities. Government subsidies can increase corporate cash flow and corporate surpluses, allowing companies to have more funds to support R&D input and continue to communicate downstream as R&D input. The more companies invest in R&D, the stronger their competitiveness and the bigger their market share, which in turn will increase corporate profits and improve financial performance [43]. This shows that government subsidies can positively mediate firm performance through R&D input. Based on the mediating effect, regardless of the current or first-order lag period, R&D input has a significant positive mediating effect on government subsidies and firm performance [33]. Lach’s research based on Israeli data shows that government subsidies can promote the growth of R&D in many ways and will ultimately have a significant positive impact on firm performance because financial subsidies help companies overcome short-term working capital tension and use surplus funds to supplement R&D, which will help companies improve R&D, improve production efficiency, and boost firm performance [34]. This paper argues that government subsidies have a positive impact on firm performance, but at the same time government subsidies drive the R&D input growth of new energy companies, which in turn has a lagged positive impact on firm performance. Therefore, hypothesis H4 is proposed.
Hypothesis 4 (H4).
The lagged positive relationship between government subsidies and firm performance is partially mediated by firm R&D input.
Based on the above research hypotheses, the research model of this paper is developed. This model is shown in Figure 1.
To control for the impact of other variables on R&D input and firm performance, the enterprise scale, the asset-liability ratio and cash flow are selected as control variables to explore their impact on the R&D input and firm performance of new energy companies.

3. Research Variables and Data Sources

3.1. Sample Selection and Data Sources

The research objects of this paper are new energy listed companies. This paper selects new energy companies listed on the Shanghai and Shenzhen stock markets from 2012 to 2016 as samples. To ensure that the data sources are scientific and accurate and to obtain more rigorous research results, the screening conditions are set as follows: (1) The selected samples are new energy industries, namely, photovoltaic, wind power, nuclear energy, and biomass energy industries that have developed rapidly in recent years and have formed a certain industrial scale. (2) The revenue of the new energy business of the selected enterprises accounts for more than 20% of the total business income, which can make data show more characteristics of new energy industries. (3) The selected enterprises are leading enterprises in the industry and are representative of the characteristics of new energy industries. (4) ST Class, *ST financial status or other abnormal listed companies are not included in this paper. (5) Listed companies with missing variables, such as government subsidies, R&D input, firm performance, and other related data, are not included in this paper. (6) B-shares and H-share new energy listed companies are not included, and A-share listed companies are used in this paper.
A total of 42 sample companies were obtained through screening. Data were obtained from the Flush website and the Wind database. The data required for research were manually compiled according to 2012–2016 annual report data released by each company. The data were organized using Stata 14.0 software and calculated and analyzed by using similar models.

3.2. Variable Design and Measurement

By combining the research hypotheses and theoretical models used in this paper, considering the data availability and referring to previous research results, the research variable design and indicators were selected as described in the following.

3.2.1. Dependent Variable: Firm Performance

The existing literature on the relationships among government subsidies, R&D input and firm performance has shown that single firm performance selection indexes should be selected. For example, sales income and net is used profit as performance indicators [44]. Document [45] chose product sales and service sales to measure firm performance. Enterprise value indicates firm performance [46]. Therefore, this study selects the commonly used return on equity (ROE) index as the firm performance measurement index.

3.2.2. Independent Variables: Government Subsidies

In February 2006, the Ministry of Finance of the People’s Republic of China issued the Accounting Standards for Business Enterprises—No. 16 Government Subsidies to define government subsidies according to No. 20 International Accounting Standards–Disclosure of Government Subsidy Accounting and Government Assistance. According to the regulations outlined in the Accounting Standards for Business Enterprises—No. 16 Government Subsidies, government subsidies include two categories: “government subsidies related to assets” and “government subsidies related to income”. “Government subsidies related to assets” is recognized as deferred income; these assets are recognized as a profit or loss for the current period according to the average distribution of useful lives of assets. “Government subsidies related to income” is included in current profits and losses in accordance with the period in which the related expenses or losses of the enterprise occurred. According to the above provisions and the information in the annual reports of the listed companies, government subsidies are measured by the amount of “government subsidies included in the current profits and losses”, which is information that is publicly disclosed by listed companies in the new energy industry [47]. This information is represented by the variable GS; due to the large amount of government subsidies, this paper takes the natural logarithm of the government subsidies amount to measure government subsidies (GS) variables.

3.2.3. Mediating Variables: Enterprise R&D Input

The focus of this paper is to explore whether government subsidies can achieve the goal of promoting the performance improvement of new energy companies through the mediating effect of R&D input (RD). For R&D input, we measured it as R&D expenses divided by a firm’s total sales [10,38].

3.2.4. Moderating Variables

State ownership (SO): This variable represents the state ownership of the listed firms. The firms are divided into state-owned enterprises (including state-owned firms, state-owned joint ventures, and state-owned and collective joint ventures) and non-state-owned enterprises [38,48,49].
Geographical characteristics (GC): This variable indicates the difference in the geographical location of listed firms, which is divided into two categories: The eastern coastal areas (Beijing, Shanghai, Tianjin, Liaoning, Shandong, Jiangsu, Zhejiang, Fujian, Guangdong) and the other coastal areas and mid-west areas [50].

3.2.5. Control Variables

When studying the relationship between government subsidies, R&D input, and firm performance, other factors should be controlled for that influence the relationship between the independent variables and dependent variables. The control variables selected in this study are enterprise scale (SIZE), asset-liability ratio (LEV), and cash flow (CF) [2,38,51,52]. The above variables are summarized and shown in Table 1 below.

4. The Analysis and Discussion of the Empirical Results

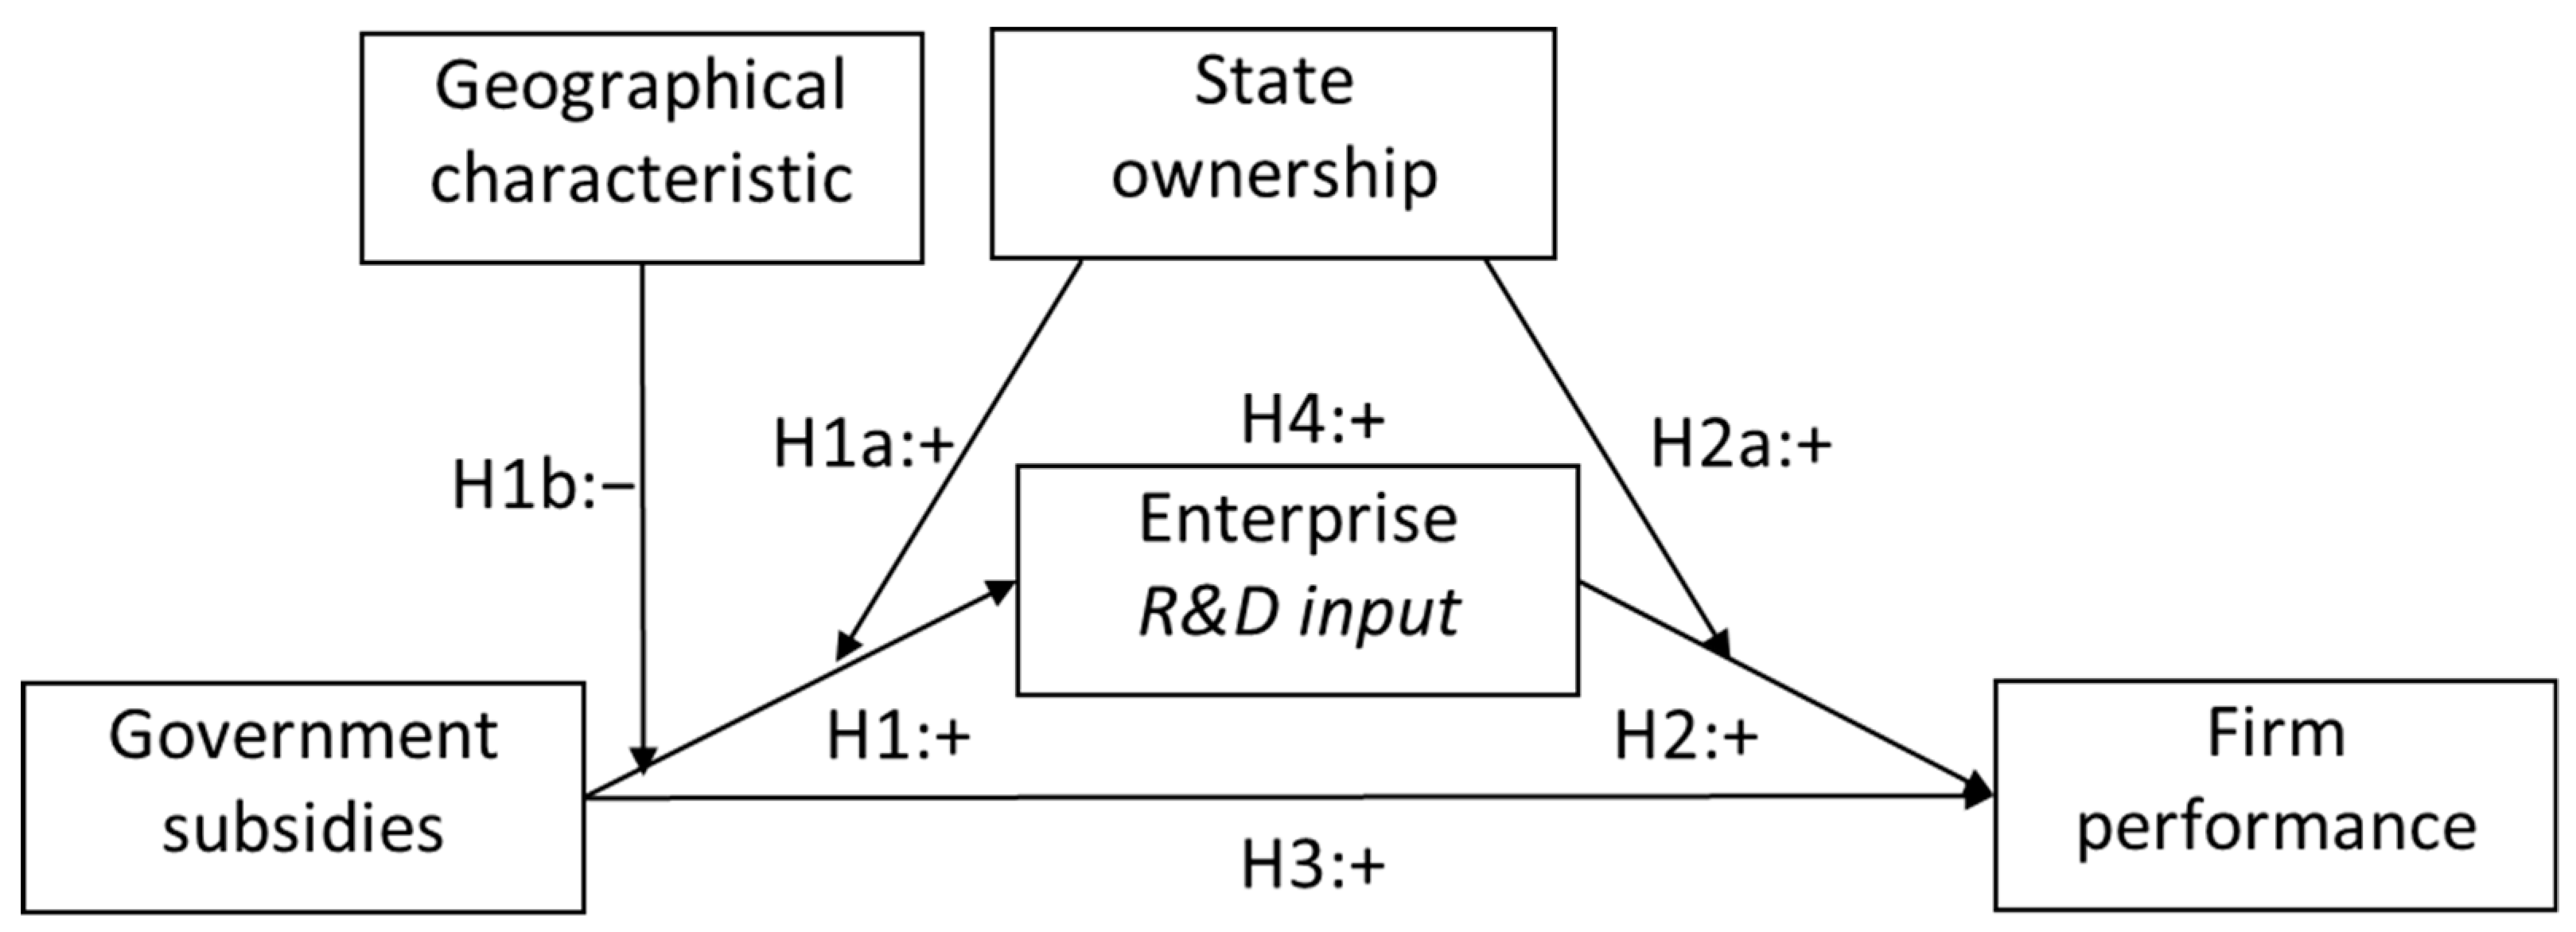
4.1. Descriptive Statistical Analysis of the Samples

The 42 newly listed companies selected are classified according to state ownership type, geographical characteristics and industrial types. There are 12 state-owned enterprises and 30 non-state-owned enterprises. There are 22, 13, 3, and 4 companies in the home, photovoltaic, wind power, nuclear power, and biomass energy industries.
Stata software was used for the descriptive statistical analysis of the research variables of 42 A-share new energy enterprises listed in the Shanghai and Shenzhen stock exchanges from 2012 to 2016. The results are summarized in Table 2.
From the analysis in Table 2, the mean of return on equity (ROE), GS, RD, LEV, CF, SIZE, SO, and GC are −0.0030, 16.6157, 0.0430, 0.5228, 0.2805, 22.6474,0.7143, and 0.2619, respectively. The minimum and maximum values of ROE are GCL company integration in 2013 and 2015, respectively, which means that the firm performance has improved year by year. The minimum and maximum values of GS are solar energy company in 2012 and Shanghai electric company in 2013, respectively; the minimum and maximum values of R&D are for Silver Star Energy in 2014 and Tianlong Optoelectronics in 2012, respectively. The mean of state ownership (SO) 0.7143 indicates the amount of non-state-owned enterprises is higher than that of state-owned enterprises in the sample. The mean of geographical characteristics (GC) 0.2619 shows the size of the eastern coastal area firms is more than that of non-eastern coastal area firms.

4.2. The Relationship Test between Government Subsidies and Enterprise R&D Input

To analyze the relationship between government subsidies and R&D input, a panel multiple linear regression model is constructed as follows:
R D = α + β 1 G S + β 2 S I Z E + β 3 LEV + β 4 C F + ξ
where α is the intercept, β is the coefficient, and ξ is the residual. A multi-panel regression is used to analyze panel data on 42 new energy listed companies from 2012 to 2016. To select a panel model that is suitable for the data features, first, the F-test, BP test, and Hausman test are used to determine the choice of the fixed-effects model for regression analysis. Problems related to intergroup heteroscedasticity and cross-section caused by multi-panel regression will lead to a biased estimation. To improve the accuracy of the estimation result and to show that bias is not an issue to the greatest extent possible. White and Newey corrections are used for processing. Because the time span of the panel data used is small, the sequence-related problems are not considered here. The regression results of the government subsidies and enterprise R&D input are shown in Table 3 below.
The results of the data analysis are shown in Table 3 and show that government subsidies (β = 0.0041, p < 0.05) are significantly and positively correlated with the R&D input of enterprises, which is consistent with the research results of documents [53,54,55], and so on. That is, government subsidies have a positive effect on the R&D input of new energy companies. This result shows that when the government increases the amount of subsidies for new energy companies, these enterprises will increase their R&D input; when the government reduces the amount of subsidies for new energy companies, these enterprises will reduce their R&D input accordingly. Therefore, it is assumed that H1 is supported. In addition, the asset-liability ratio (β = −0.0502, p < 0.05) is significantly and negatively correlated with the R&D input of the enterprises; that is, the higher the asset-liability ratio of the enterprise, the less R&D input of the enterprise. The impacts of the enterprise scale and cash flow on the R&D input of the enterprise are not obvious.

4.3. Inspection of the State Ownership and Geographical Characteristics of Firms

Among the moderation variables, enterprise nature (state-owned, non-state-owned) and regional characteristics (the eastern coastal region and other coastal regions) are categorical variables. Because the independent variable, government subsidy, is a continuous variable, grouping regression analysis is conducted. After the test and adjustment, the final regression results are shown in Table 4.
The results of the analysis are shown in Table 4 and indicate that among the 42 new energy companies, the government subsidies of state-owned new energy enterprises (β = 0.0042, p < 0.05), and the government subsidies of non-state-owned enterprises (β = 0.0076, p < 0.05) are significantly and positively related to R&D input, but the coefficient for government subsidies for non-state-owned enterprises is larger than that of state-owned enterprises; that is, government subsidies promote the R&D input of non-state-owned new energy enterprises more strongly than that of state-owned enterprises. Therefore, it is assumed that H1a is supported; that is, state ownership has a significant moderating effect on the relationship between government subsidies and R&D input.
The reason for this phenomenon may be that management and institutional problems existing in state-owned enterprises have caused government subsidies to not be fully invested in R&D activities. Therefore, government subsidies have a weaker effect on R&D input. Therefore, the government should establish a corresponding supervision system to strengthen the measurement of the supervision and the subsidy effect of enterprises in terms of the use of relevant subsidies and guide enterprises to effectively use government subsidies. State-owned new energy enterprises should focus on improving internal governance and creating a good external environment for R&D activities. The environment should also focus on improving enthusiasm for internal technological innovation and R&D. In addition, in the group of state-owned enterprises, the enterprise scale, the asset-liability ratio, and the cash flow have no significant impact on the R&D input of the enterprise. In the group of non-state-owned enterprises, the asset-liability ratio (β = −0.0541, p < 0.1) is significantly and negatively correlated with the R&D input of the enterprise, while cash flow (β = 0.0037, p < 0.05) is significantly and positively correlated with the R&D input of the enterprise. This result shows that state-owned enterprises have not yet realized the role of real market players.
The regression results grouped by geographical characteristics show that the government subsidies of new energy enterprises in the eastern coastal areas (β = 0.0060, p < 0.05) are significantly positively correlated with the R&D input of enterprises; that is, the government subsidies of new energy enterprises in the eastern coastal areas have significant promotion of R&D input. The government subsidies for new energy enterprises in the other coastal areas (β = −0.0021, p < 0.05) are significantly negatively correlated with the R&D input of enterprises; that is, the government subsidies for new energy enterprises in the other coastal areas have a significant extrusion effect, and the results of this study are consistent with the results of document [14]. This may be because the location conditions and resource endowments in the other coastal areas are poor, the degree of marketization is low, and the level of enterprise management is poor. Therefore, enterprises are less motivated and less conscious of technology R&D. However, government subsidies increase the income of new energy enterprises, which has caused these enterprises to be less interesting in technological innovation and R&D. Therefore, the government subsidies have a crowding-out effect on R&D input.
The scale of new energy enterprises in the other coastal regions (β = 0.0120, p < 0.01) has a significant positive impact on R&D input; the asset-liability ratio (β = −0.0877, p < 0.01) has a significant negative impact. The impact of cash flow on R&D input is not significant. In the eastern coastal areas, cash flow (β = 0.0040, p < 0.05) has a significant positive impact on corporate R&D input, while the asset-liability ratio and firm size have no significant impact on R&D input. According to the above analysis, H1b is supported; that is, the geographical characteristics are different, and the influence of government subsidies on R&D input of new energy enterprises is different. This means that the regional characteristics have significant effects on the regulation of government subsidies and R&D input.

4.4. The Relationship between Enterprise R&D Input and Firm Performance

To analyze the relationship between R&D input and the firm performance of new energy companies, based on documents [12,38], the panel multiple linear regression model is constructed as follows to test hypothesis 2:
R O E = α + β 1 R D + β 2 S I Z E + β 3 L E V + β 4 C F + ξ
The performance of the dependent variable in Equation (2) is measured by ROE, where α is the intercept, β is the coefficient and ξ is the residual. Table 5 shows the results of the regression analysis when the independent variable is ROE. Model II, Model III, and Model IV are the regression results of the enterprise’s R&D input without a lag period, lag phase 1, and lag phase 2, respectively. According to the Hausman test, Model I, Model II, and Model III in Table 5 are better when the random effect model is used, while Model IV is better when the fixed effect model is used.
The results of the data analysis are shown in Table 5 and show that when using ROE to measure firm performance, the R&D input of new energy companies (β = −1.2181, p < 0.05) has a significant negative impact on current firm performance without a lag period. That is, the more R&D input of the enterprise in the current period, the greater the negative impact on the performance of the company. In addition, the size of the enterprise (β = 0.0738, p < 0.01) has a significant positive impact on the current firm performance; that is, the larger the enterprise, the better the current firm performance. The asset-liability ratio (β = −0.5026, p < 0.01) has a significant negative impact on the current firm performance; that is, the higher the asset-liability ratio of the enterprise, the worse the firm performance. Cash flow has a positive impact on the current firm performance. However, the impact is not significant.
Model III shows that the enterprise’s R&D input of lag phase 1 (β = −0.9797, p < 0.01) has a significant negative impact on firm performance; that is, the enterprise’s R&D capital investment will still have a negative impact on firm performance after one year. Model IV shows that the enterprise’s R&D input of the 2nd-order lag (β = 1.3382, p < 0.05) has a significant positive impact on firm performance; that is, the enterprise’s R&D input has positively promoted firm performance after 2 years. This result is similar to previous research conclusions. R&D capital investment and personnel input are significantly positively correlated with firm performance. The lag period of R&D capital investment is 1 period, and the lag period of R&D personnel investment is 2 periods.
The reason for this phenomenon may be that after a certain amount of R&D funds and R&D personnel are invested in the company, it takes a period of time for technology R&D to result in innovation. During this time, the funds and manpower invested cannot be immediately converted into enterprise income. The funds originally used by the company to improve performance are no longer available for other uses. Therefore, in the same year and one year after the investment, the enterprise’s R&D input has a significant negative impact on the firm performance. However, after investing in R&D funds for 2 years, the company has completed the development and application of new technologies and pushed new products to the market, so the firm performance has been significantly improved. It can be seen that the R&D input of enterprises has a significant positive impact on the performance of new energy enterprises, but it has a lag, and the lag period is 2 years. Therefore, we assume that H2 is supported.
The nature of the firm (state-owned, non-state-owned) has a significant moderating effect on the relationship between corporate R&D input and firm performance (Table 6). The non-state-owned new energy enterprises’ R&D input (β = −0.2754, p < 0.05) has a significant negative correlation with the current firm performance and the state-owned new energy enterprise R&D input (β = −0.4024, p < 0.1) and the enterprise The current performance also has a significant negative correlation, but the negative impact of increased R&D input on state-owned new energy companies is greater than that of non-state-owned new energy companies. Therefore, if H2a is supported, then state ownership has different effects on the R&D input of enterprises. The impact of performance is different; that is, state ownership has a significant moderating effect on the relationship between R&D input and firm performance.
In the group of state-owned enterprises and the group of non-state-owned enterprises, the independent R&D input as measured by the independent variable are delayed by one period and delayed by two periods. According to the regression results, in the group of non-state-owned enterprises, the R&D input of the first phase (β = −0.1925, p < the R&D input of 0.05) and the lag phase 2 (β = 1.8851, p < 0.05) are significantly positively correlated with the firm performance. In the group of state-owned enterprises, the R&D input of the lagged phase 1 and lagged phase 2 were not related to firm performance.
In addition, in the group of non-state-owned enterprises, the enterprise scale (β = 0.1538, p < 0.1) has a significant positive correlation with the performance of new energy enterprises; that is, the larger the enterprise scale, the better the firm performance. The impact of asset-liability ratio and cash flow on firm performance is not significant. In the group of state-owned firms, the enterprise scale (β = 0.1080, p < 0.05) is significantly positively correlated with the performance of new energy companies and the asset-liability ratio (β = −1.1288, p < 0.1) Cash flow is significantly negatively correlated with firm performance, and the impact of cash flow on the performance of new energy companies is not significant.

4.5. The Mediation Effect of R&D Input on the Relationship between Government Subsidies and Firm Performance

First, based on documents [12,38], we conduct a regression analysis of the relationship between government subsidies and firm performance to test hypothesis 3 (Equation (3)).
R O E = α + β 1 G S + β 2 S I Z E + β 3 LEV + β 4 C F + ξ
The regression results of the independent government subsidy without a lag period and with lagged period 1 and lagged period 2 show that government subsidies for new energy enterprises (β = 0.0106, p > 0.1) have a positive impact on the current firm performance, but the impact is not significant. The government subsidy of the first phase (β = 0.0340, p > 0.1) still has a positive impact on the performance of new energy companies, but the impact is still not significant. The government subsidies of the second phase (β = 0.0356, p < 0.1) have a significant positive impact on the performance of new energy businesses. We assume that H3 is supported.
Second, we conduct a regression analysis of the relationships among government subsidies, R&D input and firm performance. The regression analysis of government subsidies and firm performance shows that government subsidies in the second phase are significantly and negatively correlated with firm performance. The R&D input in the 2 lagged phase is significantly and positively correlated with firm performance [35]. Therefore, the mediating effect of R&D input with 2 lags on the relationship between government subsidies with 2 lags and firm performance (hypothesis 4) is tested by constructing models (4), (5), and (6) based on [38].
R O E = α + β 1 G S ( 2 ) + β 2 S I Z E + β 3 LEV + β 4 C F + ξ
R D ( 2 ) = α + β 1 G S ( 2 ) + β 2 S I Z E + β 3 LEV + β 4 C F + ξ
R O E = α + β 1 G S ( 2 ) + β 2 R D ( 2 ) + β 3 S I Z E + β 4 LEV + β 5 C F + ξ
The regression results are shown in Table 7. In Model II, the dependent variable is firm performance (ROE) and the independent variable is government subsidy with the lag phase 2. In Model III, the dependent variable is the lag phase 2 R&D input and the independent variable is the lag phase 2 government subsidy. In Model IV, the dependent variable is firm performance (ROE). According to the results of the Hausman test, Model II and Model IV are better when using the fixed effect model, and Model III is better when using the random effect model.
Table 7 shows that the regression coefficients for the independent variables in Model II and Model III are significant, and the coefficients for GS (−2) and RD (−2) in Model IV are significant when using the mediation effect test method. The partial mediation effect of R&D input is significant; that is, the relationship between the two-stage government subsidy and firm performance is transmitted through the partial mediation effect of the late stages of R&D input. Therefore, we assume that H4 is supported.

4.6. Discussion

4.6.1. Government Subsidies and R&D Input

Government subsidies have a positive effect on the R&D input of new energy companies. When governments increase the amount of subsidies provided to new energy companies, new energy companies will increase their R&D input. When the government reduces the amount of subsidies for new energy companies, R&D input of new energy companies will be reduced accordingly. This result is consistent with findings of Hyytinen [54], Reinthaler [53], Almus [55], etc. It is believed that public subsidies can make up for the lack of enterprise R&D input and thus promote the development of enterprises. Government subsidies have a significantly positive impact on R&D intensity. It is confirmed that government subsidies can make up for the gap between the private income and social benefits brought about by the externalities of R&D activities, thus improving enthusiasm in R&D activities. It is believed that government subsidies can promote enterprise investment.
The state ownership moderates the relationship between government subsidies and corporate R&D input. Government subsidies can better promote R&D input in non-state-owned new energy companies than that in state-owned new energy companies. This is similar to the results reported by [38]. The reason for this phenomenon may be because management and institutional problems exist. Therefore, government subsidies have a weaker effect on R&D input.
Regional characteristics have a moderating effect on government subsidies and R&D input. Government subsidies for new energy companies in eastern coastal areas have positive effects on R&D input. Government subsidies for new energy companies in the other coastal areas have a significant crowding-out role in R&D input. The results can be explicated by institutional logic and efficiency logic. This may occur because the other coastal areas are subject to poor conditions and resource endowments, their marketization degree (that refers institutional development) is low [38,56] and their enterprise management level is low. In in less developed regions of China (mid-west regions), local governments remain as “visible hands” that intervene in economic activities and business practices; in more developed regions(eastern regions), the governments tend to coordinate economic activities in their territory and let the market govern business transactions [57,58].Therefore, enterprises are less motivated and less conscious of technology R&D. Government subsidies increase the income of new energy enterprises but intensify negativity towards technological innovation and R&D; in this case, government subsidies crowd-out R&D input. The results of this study are consistent with the findings of document [14]; that is, government subsidies have a leverage effect on R&D input in the eastern regions but have a crowding-out effect in the mid-west regions.

4.6.2. R&D Input and Firm Performance

During the current period and considering one hysteretic phase, the R&D input of new energy enterprises has a significant and negative impact on firm performance, while the R&D input of second-order hysteretic enterprises has a significant and positive impact on firm performance. That is, the R&D input of enterprises has a positive effect on firm performance after two years. This may occur because the company needs a period of time for technology R&D and time to develop innovation after it invests a certain amount of R&D funds and a certain number of R&D personnel. During this time, the funds and manpower invested cannot be immediately converted into enterprise income. The funds that the company originally used to improve performance are not available for other expenses, so in the same year and one year after the investment, the enterprise’s R&D input has a significant negative impact on performance. However, after investing in R&D funds for 2 years, the company has completed the development and application of new technologies and pushed new products to the market, so the firm performance is significantly improved. This result is similar to previous research conclusions. For example, if the hysteretic period of R&D capital investment is 1 period, then the hysteretic period of R&D personnel investment is 2 periods [35].

4.6.3. Government Subsidies and Firm Performance

Current and one-phase delayed fiscal subsidies do not have a significant effect on company performance, but financial subsidies of two-phase delayed government subsidies have a significant positive impact on the performance of new energy companies. This result is similar to research results reported by [34]. He claimed that government subsidies can promote R&D growth in many aspects and ultimately have a significant positive impact on firm performance. Government financial support is beneficial in increasing the efficiency of large new energy vehicle firms. This paper finds that financial subsidies help companies overcome short-term working capital tension, and these firms can use surplus funds to supplement R&D input, which will ultimately help enterprises improve R&D, enhance their production efficiency and boost their performance.

5. Conclusions and Policy Implications

5.1. Research Conclusions

To explore the relationships among government subsidies, R&D input and the firm performance of new energy companies, this paper establishes a research model based on relevant theories and current research. This paper also selects A-share new energy companies listed in the Shanghai and Shenzhen stock exchanges from 2012 to 2016 as samples to conduct panel data multiple regression analysis. The main conclusions are as follows.

5.1.1. Government Subsidies Have Significant Positive Impacts on the R&D Input of New Energy Enterprises. The State Ownership and Geographical Characteristics of Enterprises Have Significant Moderating Effects on this Relationship

Government subsidies have a significant role in promoting the R&D input of new energy companies. When the government increases financial subsidies, enterprises will increase their technological innovation and R&D input. The role of government subsidies in promoting non-state-owned enterprises is significantly more important than that of state-owned enterprises. That is, non-state-owned enterprises are more efficient in using government subsidies than state-owned enterprises. Government subsidies can significantly facilitate the R&D input of new energy companies in the eastern coastal areas. Government subsidies have a significant crowding-out effect on the R&D input of new energy companies in other coastal areas. That is, when the government increases financial subsidies, new energy companies in the eastern coastal areas will increase R&D input, while new energy companies in the other coastal areas will reduce R&D input.

5.1.2. Increasing R&D Input Can Increase the Performance of New Energy Enterprises, but This Effect Has a Two-Year Lag Phase. The State Ownership Has a Significant Moderating Effect on This Relationship

Enterprises need a certain amount of time to carry out technology R&D and develop innovation. In this process, technology needs to be transformed into products that will eventually generate income. In addition, a large amount of manpower and capital will be used in this process. Therefore, new energy companies’ R&D input in the same year has a significant and negative impact on the performance of enterprises in the current year and the next year. However, within one year after the enterprise increases R&D input, the inhibitory effect on firm performance is reduced compared with the suppression effect of R&D input on firm performance. The results of empirical research show that it takes new energy companies two years to carry out technology R&D and transformation. That is, firm performance will be significantly improved after the R&D input has been invested for two years.
The R&D input of non-state-owned and state-owned new energy enterprises has a significant negative correlation with the current firm performance, but the effect of R&D input on the current performance of state-owned new energy enterprises will have larger negative impacts than that of non-state-owned new energy enterprises. The different moderating effect of corporate nature on state ownership and geographical characteristics from firm heterogeneity perspectives can be explicated by institutional logic and efficiency logic [38,56,58].

5.1.3. Government Subsidies Improve the Performance of China’s New Energy Enterprises through R&D Input, but This Effect Has a Two-Year Lag Period

China is actively promoting energy conservation, emission reduction, and the utilization of clean energy. China has issued a series of favorable policies to support the development of the new energy industry and provided a large amount of financial subsidies to new energy enterprises. However, government subsidies do not have a significant role in the performance of companies when they are issued. The relationship between government subsidies and two-phase hysteretic firm performance is transmitted through the mediating effect of R&D input. This occurs for the following reasons: First, the new energy industry, as China’s emerging industry, is still immature. This industry is faced with low marketization and industrialization, so new energy companies cannot effectively use government subsidies. Second, China’s new energy enterprises have weak technological innovation capability. These enterprises have a long technological innovation cycle, which cannot effectively drive firm performance. Third, the government’s continued provision of financial subsidies for new energy enterprises may cause these enterprises to depend on the government to a certain extent. Therefore, these enterprises may lose their enthusiasm for improving firm performance by improving business operations, enhancing internal corporate governance, and conducting technical innovation. Therefore, government subsidies are less effective in driving firm performance.

5.2. Relevant Policy Implications

5.2.1. Continue to Strengthen Financial Subsidies for the New Energy Industry

First, government subsidies can significantly increase the R&D input of new energy companies. New energy companies are both capital-intensive and technology-intensive. These companies can enhance their core competitiveness, increase their market share and achieve healthy development through technological innovation. Therefore, the enthusiasm of new energy companies for technology R&D can be improved by increasing government subsidies. Second, the effect of real government subsidies on the R&D input of non-state-owned new energy enterprises is more obvious than that of state-owned enterprises. Therefore, the government should focus on strengthening financial subsidies for non-state-owned new energy enterprises and issuing corresponding policies to improve state-owned enterprises’ efficiency in using financial subsidies and enhance their enthusiasm for R&D activities. Third, government subsidies have a significant crowding-out effect on the R&D input of new energy enterprises in the central and western coastal areas. Therefore, the government should strengthen its guidance and support for technological innovation in new energy enterprises in those regions and play a role in promoting their enthusiasm for R&D input.

5.2.2. Strengthen the Supervision of Government Subsidies and Improve the Efficiency of Subsidy Allocation

The results of this empirical research show that government subsidies have no significant impact on firm performance in the first year that the subsidies are released and in the following year. The effect of government subsidies on firm performance starts two years later. New energy companies in China cannot effectively use government subsidies. Therefore, the supervision of government subsidies should focus on subsidy selection and subsidy fund issuance. After the government subsidy funds are actually issued to enterprises, the usage of funds should be properly supervised, and detailed rules for the usage of funds should be established. To ensure that financial subsidies for new energy enterprises are effectively used, the government should strengthen the risk management and control of the application, approval, use, and evaluation of subsidy funds to ensure that all aspects of the government subsidy fund flow process are standardized and orderly. In addition, the government should rationally allocate government subsidy funds according to actual situation of the demand for capital and strictly control government subsidy funds. The government should avoid issuing a large amount of unnecessary funds and should ensure that the funds are released timely and to the right person. In addition, the government should have beneficial connections with enterprises to improve the efficiency of the government subsidy funds. Finally, the government should actively strengthen the transparency of the subsidy system in the new energy industry so that governments at all levels can achieve fairness and justice in the subsidy process. At the same time, the government should disclose the details of new energy enterprises that receive these funds and reduce enterprises’ rent-seeking behaviors.

5.3. Research Limitations and Prospects

5.3.1. Insufficient Sample Size

Due to the lack of annual reports for many of the new energy listed companies before 2011, this study included only A-share new energy companies listed in the Shanghai and Shenzhen stock markets from 2012 to 2016. This study utilizes data on new energy industries and firms for which the energy-related companies account for more than 20% of their main business income. Most of these firms are leading enterprises in the new energy industry. In addition, to ensure that the results of this research are scientific and accurate, the firms reporting an abnormal financial situation and other abnormal conditions as well as firms missing data are excluded. These screening conditions are set to ensure the results are representative and accurate and to reduce the number of samples. Because one limitation of this study is the sample size, this paper does not explore the impacts of different types of enterprises (photovoltaic enterprises, wind power enterprises, nuclear energy enterprises, and biomass energy enterprises) on the relationship among government subsidies, R&D input and firm performance.

5.3.2. Incomplete Measurement Indicators of Firm Performance

This paper uses only the net asset income rate to reflect the current performance of the companies. This measure does not effectively measure firm performance. This aspect of this study needs to be further revised and improved in future research. Future studies can select a number of indicators to measure the firm performances considering profitability, development ability, solvency and other aspects to establish a comprehensive evaluation system. In addition, future studies can use the principal component analysis method to calculate the comprehensive score function of the performance of manufacturing enterprises.

5.3.3. Detailed Information on Government Subsidies Is Not Available for Measuring the Relationships among Different Types of Government Subsidies, R&D Input and Firm Performance

Due to the imperfect capital market in China, in the process of data collection and consolidation, only limited information on government subsidies for new energy companies is available. In the annual reports issued by new energy listed companies, the amount received from government subsidies is included in the current profit and loss and is noted as “nonrecurring profit and loss items and amount”. The report does provide other information about the government subsidies that have been received—such as the amount and type of subsidy. Therefore, the results of this paper are less useful for governments and enterprises. In future research, a variety of channels can be used to obtain more comprehensive information about government subsidies so that we can conduct a more detailed exploration of the relationships among government subsidies, R&D input, and the firm performance of new energy industries. This paper aims to provide more detailed and accurate suggestions for the government and new energy enterprises that seek to develop new policies.

Author Contributions

Conceptualization, M.L. and S.X. Methodology and software, X.L., M.D. and M.L. Validation, X.L., M.D. and M.L. Formal analysis, L.L. Investigation, X.L. and L.L. Resources, X.L., L.L. and Y.Z. Data curation, X.L. and L.L. Writing—original draft preparation, X.L. and L.L. Writing—review and editing, M.L. and S.X. Visualization, Y.Z.

Acknowledgments

This research was funded by National Natural Science Foundation of China (grant number 71573253), Key Projects of Philosophy and Social Sciences for Universities by Jiangsu Provincial Department of Education (grant number 2018SJZDI109), and the Fundamental Research Funds for the Central Universities (grant number 2019XKQYMS83).

Conflicts of Interest

The authors declare no conflict of interest. The funders had no role in the design of the study; in the collection, analyses, or interpretation of data; in the writing of the manuscript, and in the decision to publish the results.

References

  1. Li, M. China new energy industry development and security report. Energy Res. Util. 2013, 1, 8–9. [Google Scholar]
  2. Peng, Z.; Wen, Y.; Huang, Y. The effect of government subsidies on the performance of new energy companies: The moderating role of corporate internal governance. J. Cent. Univ. Financ. Econ. 2015, 7, 80–85. [Google Scholar]
  3. Yu, J. An Empirical Analysis of the Relationship between Capital Structure and Firm Performance of New Energy Listed Companies. Ph.D. Thesis, Zhejiang University, Zhengjiang, China, 2015. [Google Scholar]
  4. Yu, M.; Hui, Y.; Pan, H. Political connection, rent-seeking and the effectiveness of local government financial subsidy. Econ. Res. J. 2010, 3, 65–77. [Google Scholar]
  5. Shao, M.; Bao, Q. Government subsidy and enterprise productivity—Based on the empirical analysis of china’s industrial enterprises. China Ind. Econ. 2012, 7, 70–82. [Google Scholar]
  6. Li, M. Government Subsidy, Export and Innovation Ability of Enterprise. Ph.D. Thesis, Nanjing University, Nanjing, China, 2015. [Google Scholar]
  7. Li, Y.; Zeng, B.; Wu, T.; Hao, H. Effects of urban environmental policies on improving firm efficiency: Evidence from Chinese new energy vehicle firms. J. Clean. Prod. 2019, 215, 600–610. [Google Scholar] [CrossRef]
  8. Lee, C. The differential effects of public R&D support on firm R&D: Theory and evidence from multi-country data. Technovation 2011, 31, 256–269. [Google Scholar]
  9. Montmartin, B.; Herrera, M. Internal and external effects of R&D subsidies and fiscal incentives: Empirical evidence using spatial dynamic panel models. Res. Policy 2015, 44, 1065–1079. [Google Scholar] [Green Version]
  10. Zheng, S.; Liu, H. Impact of government introduced the investment of high-tech industrialization on the firm performance. J. Quant. Tech. Econ. 2013, 7, 66–80. [Google Scholar]
  11. Buchmann, T.; Kaiser, M. The effects of R&D subsidies and network embeddedness on R&D output: Evidence from the German biotech industry. Ind. Innov. 2019, 26, 269–294. [Google Scholar]
  12. Jiang, C.; Zhang, Y.; Bu, M.; Liu, W. The Effectiveness of Government Subsidies on Manufacturing Innovation: Evidence from the New Energy Vehicle Industry in China. Sustainability 2018, 10, 1692. [Google Scholar] [CrossRef]
  13. Catozzella, A.; Vivarelli, M. The possible adverse impact of innovation subsidies: Some evidence from Italy. Int. Entrep. Manag. J. 2016, 12, 351–368. [Google Scholar] [CrossRef]
  14. Xiao, D.; Zhu, G.; Wang, J. The impact of government S&T input on the enterprise’s R&D expenditure-empirical research based on a quantile regression. RD Manag. 2013, 3, 25–32. [Google Scholar]
  15. Czarnitzki, D.; Hottenrott, H.; Thorwarth, S. Industrial research versus development investment: The implications of financial constraints. Camb. J. Econ. 2011, 35, 527–544. [Google Scholar] [CrossRef]
  16. Bai, Y.; Song, S.; Jiao, J.; Yang, R. The impacts of government R&D subsidies on green innovation: Evidence from Chinese energy-intensive firms. J. Clean. Prod. 2019, 233, 819–829. [Google Scholar]
  17. Hou, X.; Zhang, Y. The impact of R&D investment on corporate performancefirm performance. Sci. Technol. Manag. Res. 2006, 12, 108–110. [Google Scholar]
  18. Koellinger, P. The relationship between technology, innovation, and firm performance—Empirical evidence from e-business in Europe. Res. Policy 2008, 37, 1317–1328. [Google Scholar] [CrossRef]
  19. Guo, B. Firm size, R&D and performance: An empirical analysis on software industry in China. Sci. Res. Manag. 2006, 1, 613–616. [Google Scholar]
  20. Samuelson, P.A.; North, D.C. Economics, 19th ed.; The Commercial Press: Shanghai, China, 2013. [Google Scholar]
  21. Bergson, A. A reformulation of certain aspects of welfare economics. Q. J. Econ. 1938, 52, 310–334. [Google Scholar] [CrossRef]
  22. Tong, A.; Chen, Y. An empirical study on the influence of government subsidies on R&D investments: From a new perspective of political connection of private small and medium-sized listed firms. Stud. Sci. Sci. 2016, 34, 1044–1053. [Google Scholar]
  23. Wang, Y. Government input, ownership structure and technological innovation—Ownership from high-tech industry. Financ. Superv. 2012, 12, 70–72. [Google Scholar]
  24. Wu, Y. Which kind of ownership type enterprise in china is the most innovative? J. World Econ. 2012, 6, 3–29. [Google Scholar]
  25. Pan, X.; Liu, F. Research on industrial enterprise’s innovation efficiency in china based on regional comparison. Manag. Rev. 2010, 2, 59–64. [Google Scholar]
  26. Liu, D.; Chen, T.; Liu, X. Do more subsidies promote greater innovation? Evidence from the Chinese electronic manufacturing industry. Econ. Model. 2019, 80, 441–452. [Google Scholar] [CrossRef]
  27. Zhu, B.; Li, L. An empirical analysis of the impact of public subsidies on private an empirical analysis of the impact of public subsidies on private enterprise’s R & D investment. Chin. J. Sociol. 2014, 4, 165–186. [Google Scholar]
  28. Zhang, D.; Xu, G. Does government subsidy affect firm survival? Evidence from Chinese manufacturing firms. Emerg. Mark. Financ. Trade 2019, 55, 2628–2651. [Google Scholar] [CrossRef]
  29. Wallsten, S.J. The effects of government-industry R&D programs on private R&D: The case of the small business innovation research program. RAND J. Econ. 2000, 31, 82–100. [Google Scholar]
  30. Chen, H.; Lu, D. Research on the correlation between R&D investment R&D input and corporate value. Soft Sci. 2011, 2, 20–23. [Google Scholar]
  31. Jiang, N.; Huang, W. An empirical study of the impact of government’s subsidies on enterprises R&D investment in china’s hightech industry. Sci. Sci. Manag. S&T 2010, 7, 28–33. [Google Scholar]
  32. Zhang, X.; Liang, Z.; Chen, X. The timing mode selection of government subsidies: Based on the mediating effect analysis of government subsidy, R&D investment and firm performance of hi-tech industry. Sci. Technol. Prog. Policy 2016, 11, 42–47. [Google Scholar]
  33. Zang, Z. Government subsidies, R&D investment and the performance of listed cultural companies: An empirical study based on the mediating effect of the panel data of 161 listed cultural companies. East China Econ. Manag. 2015, 6, 80–88. [Google Scholar]
  34. Lach, S. Do R&D subsidies stimulate or displace private R&D? evidence from Israel. J. Ind. Econ. 2002, 4, 369–390. [Google Scholar]
  35. Zhou, Y.; Ceng, J. An empirical study on the relationship between R&D and firm performance: Based on the data dug of Chinese listed companies. Sci. Sci. Manag. S&T 2011, 1, 146–151. [Google Scholar]
  36. Martin-Barrera, G.; Zamora-Ramirez, C.; Gonzalez-Gonzalez, J. Impact of flexibility in public R&D funding: How real options could avoid the crowding-out effect. Renew. Sustain. Energy Rev. 2017, 76, 813–823. [Google Scholar]
  37. Hu, A.G.; Jefferson, G.H. Returns to research and development in Chinese industry: Evidence from state-owned enterprises in Beijing. China Econ. Rev. 2004, 15, 86–107. [Google Scholar] [CrossRef]
  38. Zhou, K.Z.; Gao, G.Y.; Zhao, H. State ownership and firm innovation in china: An integrated view of institutional and efficiency logics. Adm. Sci. Q. 2017, 62, 375–404. [Google Scholar] [CrossRef]
  39. Zhou, Y.; Pu, Y.; Chen, S.; Fang, F. Government support and development of emerging industries-a new energy industry survey. Econ. Res. J. 2015, 6, 147–161. [Google Scholar]
  40. Zhang, H.; Li, L.; Zhou, D.; Zhou, P. Political connections, government subsidies and firm financial performance: Evidence from renewable energy manufacturing in China. Renew. Energy 2014, 63, 330–336. [Google Scholar] [CrossRef]
  41. Geng, Q.; Lu, D. Learning by exporting, R&D effects and firm productivity upgrading. The evidence from chinese manufacturing firms. Sci. Res. Manag. 2015, 6, 137–144. [Google Scholar]
  42. Zhou, X. Evaluation of government subsidy performance in china’s listed companies: From the perspective of enterprise life cycle. Contemp. Financ. Econ. 2014, 2, 40–49. [Google Scholar]
  43. Zhou, H.; Zhang, Z. The effects of different ways of government R&D investment on enterprise innovation investment and performance. Chin. J. Manag. 2015, 12, 1797–1804. [Google Scholar]
  44. Neely, A. Exploring the financial consequences of the servitization of manufacturing. Oper. Manag. Res. 2008, 1, 103–118. [Google Scholar] [CrossRef] [Green Version]
  45. Antioco, M.; Moenaert, R.K.; Lindgreen, A.; Wetzels, M.G.M. Organizational antecedents to and consequences of service business orientations in manufacturing companies. J. Acad. Mark. Sci. 2008, 36, 337–358. [Google Scholar] [CrossRef] [Green Version]
  46. Fang, E.E.; Palmatier, R.W.; Steenkamp, J.E.M. Effect of service transition strategies on firm value. J. Mark. 2008, 72, 1–14. [Google Scholar] [CrossRef]
  47. Guellec, D.; Potterie, B.V.P.D. The impact of public R&D expenditure on business R&D. Econ. Innov. New Technol. 2003, 12, 225–243. [Google Scholar]
  48. Li, Y.; Liu, B.; Ning, X. Research Based on panel data on the relationship between the overconfidence of leadership and the firm performance: Exploration on the mediating effect of business investment level. J. Cent. Univ. Financ. Econ. 2015, 6, 105–112. [Google Scholar]
  49. Liao, X.; Gu, W.; Wang, L. Research on the effects of public R&D subsidies, influencing factors and choices of objects. China Ind. Econ. 2013, 11, 148–160. [Google Scholar]
  50. Zou, C.; Liu, S.; Wang, L.; Xie, Q. Governmental R&D subsidy, technological strength and firm behavior. J. Ind. Technol. Econ. 2013, 10, 117–125. [Google Scholar]
  51. Zhang, J.; Li, L. The study on the relationship between different R&D fundingways and the enterprise technology innovation stage. Stud. Sci. Sci. 2014, 11, 1740–1746. [Google Scholar]
  52. Hillman, A.; Zardkoohi, A.; Bierman, L. Corporate political strategies and firm performance: Indications of firm- specific benefits from personal service in the U.S. Government 1999, 20, 67–81. [Google Scholar] [CrossRef]
  53. Reinthaler, V.; Wolf, G.B. The effectiveness of subsidies revisited: Accounting for wage and employment effects in business R&D. Res. Policy 2008, 37, 1403–1412. [Google Scholar] [Green Version]
  54. Hyytinen, A.; Toivanen, O. Do financial constraints hold back innovation and growth? Evidence on the role of public policy. Res. Policy 2005, 34, 1385–1403. [Google Scholar] [CrossRef]
  55. Almus, M.; Czarnitzki, D. The effects of public R&D subsidies on firms’ innovation activities. J. Bus. Econ. Stat. 2003, 21, 226–236. [Google Scholar]
  56. Meyer, K.E.; Nguyen, H.V. Foreign investment strategies and sub-national institutions in emerging markets: Evidence from Vietnam. J. Manag. Stud. 2005, 42, 63–93. [Google Scholar] [CrossRef]
  57. Zhou, K.Z.; Li, J.J.; Sheng, S. The evolving role of managerial ties and firm capabilities in an emerging economy: Evidence from China. J. Acad. Mark. Sci. 2014, 42, 581–595. [Google Scholar] [CrossRef]
  58. Li, J.T.; Qian, C.L. Principal-principal conflicts under weak institutions: A study of corporate takeovers in China. Strateg. Manag. J. 2013, 34, 498–509. [Google Scholar] [CrossRef]
Figure 1. Conceptual model.
Sustainability 11 04518 g001
Table 1. Description of research variables.
Variable Name Symbol Description
Firm performanceROEWe used the rate of return on common stockholders’ equity to measure firm performance. The ratio of net profit to average shareholders’ equity reflects the company’s profitability and reflects the performance of the company in the current period.
Government subsidiesGS“Government subsidies included in the current profit and loss”; due to the large amount, the natural logarithm is used to measure the government subsidy.
Enterprise R&D inputRDR&D input intensity, which is the ratio of enterprise R&D input cost to main business income. RD (−1) and RD (−2) represents the 1ag phase 1 of RD and lag phase 2 of RD, respectively.
State ownershipSOState ownership is a nominal variable to be divided into two categories: State-owned enterprises and non-state-owned enterprises.
Geographical characteristicGCGeographical characteristics are a nominal variable to be divided into two categories: The eastern coastal area and the non-eastern coastal area (i.e., mid-west area).
Enterprise scaleSIZEThe nature logarithm of the total assets at the end of the year of the firm.
Asset-liability ratioLEVThe ratio of the total liabilities at the end of the period to total assets at the end of the period.
Cash flowCFCash flow from operating activities per share.
Table 2. Descriptive statistics.
VariablesMeanS.D.Minimum ValueMaximum Value
1. Firm performance (ROE)−0.00300.3274−3.68310.9927
2. Government subsidies (GS)16.61571.406013.110520.4076
3. Enterprise R&D input (RD)0.04300.03400.00240.3553
4. Asset-liability ratio (LEV)0.52280.20310.06650.8958
5. Cash flow (CF)0.28050.7189−2.59003.8400
6. Enterprise scale (SIZE)22.64741.122620.229925.8917
7. State ownership (SO) *0.71430.452801
8. Geographical characteristic (GF) **0.26190.440701
Note: * 0 and 1 represents state-owned enterprises and non-state-owned enterprises, ** 0 and 1 represents the eastern coastal area and the non-eastern coastal area respectively.
Table 3. Regression results of government subsidies and R&D input (H1).
VariableModel IModel II
SIZE0.00010.0036
(0.03)(1.24)
LEV−0.0514 **−0.0502 **
(−2.01)(−2.03)
CF0.00260.0021
(0.73)(0.64)
H1: GS 0.0041 **
(2.56)
Intercept0.06890.0828 *
(1.55)(1.77)
Obs210210
Adjusted R20.13080.2992
F value/Wald chi28.4256.24
Note: *, **, *** indicate that the significance level is 10%, 5%, and 1%, respectively, and the t value of each coefficient is in parentheses.
Table 4. Group regression results (H1a &H1b).
Variable H1a: State OwnershipH1b: Geographical Characteristic
State-Owned Enterprise Non-State-Owned EnterpriseEastern Coastal AreasNon-Eastern Coastal Areas
SIZE0.00080.00390.00880.0120 ***
(−0.97)(−1.44)(0.03)(3.44)
LEV−0.0130−0.0541 *−0.0431−0.0877 ***
(1.51)(−1.74)(−2.52)(−4.71)
CF0.00170.0037 **0.0040 **0.0030
(0.09)(2.24)(2.74)(1.67)
GS0.0042 **0.0076 **0.0060 **−0.0021 **
(2.01)(2.54)(2.92)(−2.31)
Intercept−0.03710.09150.1639−0.1513 *
(−0.67)(0.97)(0.78)(−1.88)
Obs6015015555
Adjusted R20.19440.27630.17430.4266
F value30.2737.9328.3559.49
Note: *, **, *** indicate that the significance level is 10%, 5%, and 1%, respectively, and the t value of each coefficient is in parentheses.
Table 5. Analysis results of R&D input and firm performance (H2).
VariableModel IModel IIModel IIIModel IV
SIZE0.0769 ***0.0738 ***0.0776 **0.3038 **
(2.73)(2.86)(2.58)(2.30)
LEV−0.4509 ***−0.5026 ***−0.5364 ***−0.4724 *
(−2.86)(−3.12)(−2.75)(−1.84)
CF0.01770.01430.00200.0006
(1.07)(0.23)(0.41)(0.19)
RD −1.2181 **
(−3.83)
RD (−1) −0.9797 ***
(−3.76)
RD (−2) 1.3382 **
(2.28)
CON−1.4954 ***−1.3456 ***−1.4164 **−1.0924 **
(−2.58)(−2.58)(−2.34)(−2.25)
Obs210210168126
Adjusted R20.26340.27250.30870.3461
F value/Wald chi280.60130.84115.6435.28
Note: *, **, *** indicate that the significance level is 10%, 5%, and 1%, respectively, and the t value of each coefficient is in parentheses.
Table 6. Moderating effect of state ownership on the impact of R&D Input on firm performance (H2a).
VariableNon-State-Owned EnterpriseState-Owned Enterprise
Model IModel IIModel IIIModel IVModel VModel VI
SIZE0.1538 *0.1381 *0.1724 ***0.1080 **0.1074 *0.1882
(1.76)(1.69)(3.05)(2.00)(1.93)(1.27)
LEV−1.0487−0.9964−0.2698−1.1288 *−0.9482 *−1.3465 *
(−1.57)(−1.55)(−0.96)(−1.81)(−1.81)(−1.81)
CF0.00010.00460.04620.02910.04150.0677
(0.01)(0.14)(1.08)(1.06)(1.20)(1.62)
RD−0.2754 ** −0.4024 **
(−2.31) (−2.47)
RD (−1) −0.1925 ** −0.2854
(−2.66) (−1.58)
RD (−2) 1.8851 ** 1.3467
(3.51) (0.78)
CON−2.8830 *−2.5636 *−3.7507 ***−1.6605−1.8152−3.5900
(−1.75)(−1.65)(−3.16)(−1.05)(−1.51)(−1.03)
Obs15012090604836
Adjusted R20.31940.29100.40940.18770.16640.1147
F value/Wald chi218.0614.6135.5622.499.067.37
Note: *, **, *** indicate that the significance level is 10%, 5%, and 1%, respectively, and the t value of each coefficient is in parentheses.
Table 7. Regression results of mediating effect test (H4).
VariableModel IModel IIModel IIIModel IV
SIZE0.1146 *0.0899 **0.1041 **0.2461 ***
(1.89)(2.45)(2.59)(2.85)
LEV−0.8301 *−0.3907 **−0.4314 *−0.4707
(−1.80)(−2.38)(−1.90)(−1.02)
CF0.01050.00670.00400.0070
(0.47)(0.35)(0.21)(0.26)
RD (−2) 1.6619 ***
(2.85)
GS (−2) 0.0356 *0.0002 *0.0353 *
(1.92)(1.88)(1.89)
CON−2.1662 *−1.2228 **−1.4016 **−4.7267 **
(−1.88)(−2.27)(−2.4)(−2.61)
Obs210210126126
Adjusted R20.26340.39940.32760.3754
F value/Wald chi280.60729.592.883.76
Note: *, **, *** indicate that the significance level is 10%, 5%, and 1%, respectively, and the t value of each coefficient is in parentheses.

