Article

Opinion Mining on Social Media Data: Sentiment Analysis of User Preferences

by
Vasile-Daniel Păvăloaia
1,*,
Elena-Mădălina Teodor
2,
Doina Fotache
1 and
Magdalena Danileţ
3
1
Department of Accounting, Business Information Systems and Statistics, Faculty of Economics and Business Administration, Alexandru Ioan Cuza University of Iasi, 700506 Iaşi, Romania
2
Web Department, Falcon Trading Company, 700521 Iaşi, Romania
3
Department of Management, Marketing and Business Administration, Faculty of Economics and Business Administration, Alexandru Ioan Cuza University of Iasi, 700506 Iaşi, Romania
*
Author to whom correspondence should be addressed.
Sustainability 2019, 11(16), 4459; https://doi.org/10.3390/su11164459
Submission received: 23 July 2019 / Revised: 7 August 2019 / Accepted: 14 August 2019 / Published: 17 August 2019
(This article belongs to the Special Issue Big Data Research for Social Sciences and Social Impact)

Abstract

:
Any brand’s presence on social networks has a significant impact on emotional reactions of its users to different types of posts on social media (SM). If a company understands the preferred types of posts (photo or video) of its customers, based on their reactions, it could make use of these preferences in designing its future communication strategy. The study examines how the use of SM technology and customer-centric management systems could contribute to sustainable business development of companies by means of social customer relationship management (sCRM). The two companies included in the study provide a general consumer good in the beverage industry. As such, it may be said that users interacting with the posts these companies make on their official channels are in fact customers or potential customers. The study aims to analyze customer reaction to two types of posts (photos or videos) on six social networks: Facebook, Twitter, Instagram, Pinterest, Google+ and Youtube. It brings evidence on the differences and similarities between the SM customer behaviors of two highly competitive brands in the beverage industry. Drawing on current literature on SM, sCRM and marketing, the output of this study is the conceptualization and measurement of a brand’s SM ability to understand customer preferences for different types of posts by using various statistical tools and the sentiment analysis (SA) technique applied to big sets of data.

1. Introduction

The current research deals with an essential topic of interest for any company that intends to have a sustainable development and also to thrive in the current economic landscape which is ever more competitive. Though it belongs to the artificial intelligence (AI) domain, namely is considered a machine learning (ML) technique, sentiment analysis (SA) is a social media (SM) analytics tool that involves checking how many negative and positive keywords are included in a text message associated with a SM post. This in-depth analysis also involves finding opinions in SM content and extracting the sentiment they contain. Furthermore, those interested in this type of information can process it in real-time and take actions in the benefit of their company.
In light of the above information, the study looks into why organizations should change the way they develop business in order to be in line with the requirements of the new digital age. As such, according to Forrester experts, it is estimated that approximately 1 million B2B sales agents will lose their jobs by 2020 in favor of e-commerce. Adopting a selling strategy leveraging SM channels can lead to an increase in sales (social selling) [1] and therefore to a more sustainable development. Future digital experiences are impacted by fast developments in mobile technology and by developments of SM. Therefore, the organizations should strive towards providing a consistent experience across communication channels and integrated business platforms. This way, companies are able to reach a new level of competitive customer management as customers are no longer passive recipients but mostly proactive.
The exponential growth of individual SM users and SM active companies (only Facebook reported over 2.27 billion active accounts in early 2019) has turned SM into a company/brand and into a customer interaction space [2,3]. SM facilitates vivid communication with customers through text, sound, photo and video [4], in which the SM user emotional response influences brand-page engagement [5,6], brand advocacy and loyalty [5] and, indirectly, purchase behaviors [3,7,8]. Although there is an abundant source of materials [9,10] focusing on strong relationship between purchase behaviors and customer preferences for the content displayed by companies on SM, this study only covers the preference of users (as potential customers) for photo compared to video posts.
As social networks play an important role for the sustainable development in business, this study provides a deep analysis of customer reactions to SM posts using a set of artificial intelligence (AI) techniques, such as sentiment analysis, sentiment polarity classification (SPC) and mosaic plots.
Social networks represent an abundant source of big data that could be difficult to handle without automation. ML algorithms may be an effective method for managing big data and interpreting the results in such a way that it could be beneficial for companies.
To conduct the study, the following set of premises were formulated: ML algorithms for big data can be successfully applied to social network posts (massive source of big data) as to identify the emotional reactions of customers depending on the type of posts (1); the ML approach is effective and reliable for opinion mining and sentiment classification of user posts on any company’s official channel (2); SM users tend to express their sentiments differently depending on the type of post. Some are reluctant to view videos and embrace photos, while others react positively (3); SM users consider that photos, compared to videos, express clearer and more concise messages so they perceive the message faster (4); a company’s ability to capture and analyze user preferences as regards to the two different types of posts on official SM channels leads to sustainable business development (5).
Recently, rich literature has been produced on the use of SM for customer interactions with companies, in general, and also on SA. Further, this study used SA for studying customer preferences (video versus photo SM posts), which is in line with internationally accepted research practices. For the first months of 2019, there is evidence on the existence of a high number of literature reviews discussing the use of SA combined with text mining (TM), as well as the use of natural language processing (NLP) techniques for analyzing customers from several perspectives. Table 1 shows a few studies published in early 2019 by top journals on topics similar to this study. The studies have been extracted from ISI Web of Science using the keywords, sentiment analysis and customer.
The authors believe that this study fills the identified gap in knowledge and contributes to the literature in the field by focusing on the use of various SM platforms by two competitive brands in the beverage industry in order to analyze the preferences of their customers towards photo versus video posts.
The article is divided into five sections and comprises a study analyzing the emotions and sentiments expressed by customers on SM official channels of Coca-Cola and Pepsi by focusing on customer reactions (number of likes, commentary and distributions, retweets, repins) and on posts (photos or videos) on six SM platforms.

2. Theoretical Framework

Can and Alatas [25] argued that a high source of big data provided by user interactions on social network platforms created a new concept (big social network data) which, through its effective use of specific technologies, leads to a sustainable development of a business.
Some authors [26] stress that continued development of social instruments has led to a multiplication of human interactions, while others [27] argue that this is the reason why new business models allow a customization of transactions by consumer preference. With the dawn of SM [28], the power seems to have shifted from marketing managers to individuals and communities. SM is a group of applications built on the ideological and technological foundations of Web 2.0 which aims to create and share content generated by a community of users. Therefore, Kaplan and Haenlein [29] believe that this new technology has improved the way companies deal with their customers. According to Kornum and Mulbacher [30], the changing role of marketing from the perspective of online communities should be studied, where the participants with different interests and resources wish to increase their influence on company decisions. Other authors investigated the role of SM, while Casteleyn et al. [31] put forward the idea that among the main reasons why people use Facebook are social interaction, professional advancement and entertainment. These are all tools that can be leveraged by companies to gain a competitive advantage. Another interesting study [32] brought evidence on the fact that many social tools are used by companies to communicate directly with customers, increase brand loyalty, find new sales opportunities and develop new marketing research paths.
In terms of the classification of social networks, there are two main viewpoints. The first is based on theories of media research and theories on social processes developed by Kaplan and Haenlein [29]. By combining the two theoretical perspectives, according to the contact level and image-building, SM tool opportunities can be classified into four categories: Social communities, content, virtual reality, and 3D corporate virtual games. The second classification is based on common features of social tools which identify the type of used media [33]. This classification includes ten categories of SM tool types: Social communities (Facebook, LinkedIn, Google+, Yammer, Twitter); Blogs (Quora, WordPress, Blogger); microblogs (Twitter, Tumblr); photo publishing tools (Pinterest, Instagram, Flickr, Picasa); audio Publishing Tools (Spotify, iTunes, Podcast.com), video publishing tools (Youtube, Vimeo, Vine); on-line gaming (World of Warcraft), RSS (Google, FeedBurner); second life (Kaneva) and document storage tools and forms (Google Docs, SurveyMonkey, Doodle). Specialists sustained that a company does not have to use all of these tools [33], but rather it should focus on the most important or beneficial ones for the business model that is being employed.
As has been observed earlier, a substantial amount of literature has been published on SM. A recent systematic literature review concluded that the authors, by drawing on the concept of SM [34], were able to show that a new term emerged, namely, strategic social media marketing (SSMM). In the same study [34], the authors devised a framework for SSMM comprising four central dimensions: Social media marketing (SMM) scope, SMM culture, SMM structure and social SMM governance. They concluded that cross-functional collaborations along the four dimensions of SMM were needed to successfully navigate in this dynamic arena, where stakeholders play an essential role. Another author also presents a new trend [34] in SM which points out that the term SM should no longer be used, but social business and social enterprise. The main feature of social enterprise is its wide openness towards customers. Even more, a social enterprise thinks and lives in SM and integrates it into all of its process. In order to do so, many AI techniques are used on big sets of data for pursuing different types of complex analyses.
Acker and Gröne [35] underline that some of the main benefits of social CRM are building trust and gaining knowledge on customers, establishing customer loyalty, developing customer retention and their involvement into new products or services development process, improving the organization’s reputation and lowering service costs. The aspects related to the identification of business needs and most suitable technology were studied by Kietzmann et al. [36]. Other researchers [37] are further arguing that in order to be able to implement a business strategy, companies have to integrate algorithms into CRM platforms, such as SA and predictive modeling, if they want to increase the efficiency and effectiveness of customer relationship management activities. However, Belch and Belch [38] believe that these terms are used inconsistently as the costs and results are extremely different, being dependent on which SM tools are used. Cui, Lui and Guo et al. [39,40,41,42,43] consider that there are three categories of values that can be used to measure earned involvement in SM: Volume, valence and dispersion. Volume metrics is quantity-related and it measures the number of consumer reviews. Valence values refer to the positive or negative opinions, and dispersion measures the speed at which community impressions and opinions are spread.
Related to the use of opinion mining techniques on SM posts, Pozzi et al. [44] state that social networks represent an emerging challenging sector, where natural language expressions of users can be easily reported through short but meaningful text messages. Further, they argue that the key information that can be grasped from social environments relates to the polarity of text messages (i.e., positive, negative or neutral). In this respect, there are many approaches in the literature, some of them referring to the use of lexicons for sentiment polarity classification.
In fact, many authors applied different ML algorithms or other hybrid techniques to data collected from SM for various reasons. A further study [45] researched a multilingual sentiment detection framework used to compute the European gross national happiness (GNH) of Twitter users. Their framework consists of a novel data collection, filtering and sampling method, and a newly constructed multilingual sentiment detection algorithm for SM big data, tested in some EU countries over a six-year period. Carrera and Jung [46] applied on Facebook users the SentiFlow algorithm as a plug-in of the ProM platform to verify their proposed framework. ProM is an open source platform providing practical applications for process mining and supporting many kinds of process discovery algorithms. Gamalet et al. [47] used ten different ML algorithms with two feature extraction algorithms that were implemented on four SA datasets (IMDB, Cornell movies, Amazon and Twitter) in a comparative analysis of their methodology. Sobhani et al. [48] investigate the problem of jointly predicting the stance expressed toward multiple targets using Twitter posts. Stance detection is the task of automatically determining from the text whether the author of the text is for, against, or has a neutral view towards a proposition or target.
Concerning lexically-based approaches, in [49], the seed-word selection for semi-supervised sentiment classification is addressed through a joint lexicon corpus learning approach. Some authors [40,50,51] pursue in their research an approach that combines lexicons, labeled and un-labeled data for sentiment transfer across different domains. They first extract automatically labeled samples by using emotion keywords. Then, both the automatically-labeled samples from the target domain and the real labeled samples from the source domain were combined to create a new labeled data set. The updated methods rely on the automatic construction of lexicons [44]. Lu et al. [52] tackled the problem of deriving a sentiment lexicon that was not only domain-specific but also aspect-dependent. To achieve this aim, an optimization framework was suggested to combine different sources of information for learning context-dependent sentiment lexicons.
To sum up, the opinion mining and SA techniques in the past decade have become immensely popular and have been viewed as the most active areas of research due to the following reasons [20]: These two techniques have a wide array of applications in very different domains (1); it is considered to be a highly challenging research problem that has scarcely been studied in the past (2); due to the advent of the big data technologies, a massive volume of opinionated data is easily accessible in digital formats on the Web (3).
Whilst some research has been carried out on the use of SA on SM [39,40] and [44,45,46], no studies have been identified that attempt to analyze the interactions with a company posts of users on six social networks. Further, very few studies extract user preferences on the two types of posts analyzed in this study (photos and videos), and which are used by companies to get in touch with its customers on their SM official channels.
As the literature review highlights, there is a lack of studies that analyzed whether SM participants reacted differently to posts containing photos versus posts containing videos. The analysis of those two features are considered as they are the most frequently-used elements of SM posts. Due to the advent of technology, especially in the smartphone industry, people manifest a tendency to posting photos and/or videos when interacting in the online environment. The questions that the study intends to answer are which type of posts are the most preferred and what is the intensity of their preference for SM users across a wide variety of SM platforms.

3. Research Methodology

The study aims to analyze CocaCola’s and PepsiCo’s users or potential customer preferences for different types of posts (photos or videos) on six SM official pages posts, namely Facebook, Twitter, Instagram, Pinterest, Google+ and Youtube. Consequently, the paper intends to emphasize that user interactions with companies through SM posts bring a relevant contribution to both society and the business sector by achieving a social good.

3.1. Research Problem

To reach its aims, a two-step methodology was designed: A detailed literature review (used to make an overview of the domain and to identify the gap in knowledge) and a study [53]. For each step of the study, several inductive methods based on cause-effect have been used.
This way, the qualitative traffic on Coca-Cola (coca-cola.com) and PepsiCo (pepsico.com) web sites have been analyzed considering the global rank (in the hierarchy of searching tools), the traffic differences regarding mobile tools, the number of unique visitors, the search words used by users to get to company pages, and the types of channels used by companies to reach their customers. Some of the results are shown in Figure 1.
The highest global rank was recorded for Coca-Cola, worth 742,309, followed by PepsiCo, with less than half the score, and worth 317,978. Considering the relation between the searched words (organic versus paid), the highest traffic percentages were found in organic searches (ranging between 2.52% and 19.30%), while in paid searches, the percentages started from 0.12%, and 0.57%. The overall results are shown in Figure 1. Based on the above results, the two analyzed websites do not require significant assistance from paid traffic as these companies get good results from unpaid traffic. Considering our results, it may be concluded that social tools have not been used to their highest capacity by PepsiCo and Coca-Cola companies.
The potential number of users that can be reached on main social networks can be visualized at [54]. In order to understand the customer experience on social networks (especially the analysis of reactions to posting photos or video), this study took into account the analysis of specific key performance indicators (KPI) based on different categories.
The aim is to investigate emotional responses to photos or video posts distributed via main SM channels of two well-known international brands in the beverages industry. The research question was associated with the following primary (main) hypothesis (PH): On social networks, the expressed emotions of users have a considerable impact on their activities by type of posts (photos or videos). Consequently, the main hypothesis had been tested for each SM investigated in this study, so the following secondary research hypotheses (one for each social network) was formulated: There are significant differences in the user emotional reactions in its activities on Facebook-SH1, Instagram (number of likes, commentary and distributions)-SH2, Twitter (number of likes and retweets)-SH3, Pinterest (the number of repins and comments)-SH4, Youtube-SH5 and Google+(SH6) for each type of post (photos or videos).
Initially, the data was analyzed for a normal distribution, and since the result was positive, the Student test was further applied to validate the secondary and, implicitly, the main hypothesis. Moreover, for a more in-depth analysis, the Wilcoxon test was applied to assess the intensity (by using ranks) (user preference for)/preference for photo versus video posts.

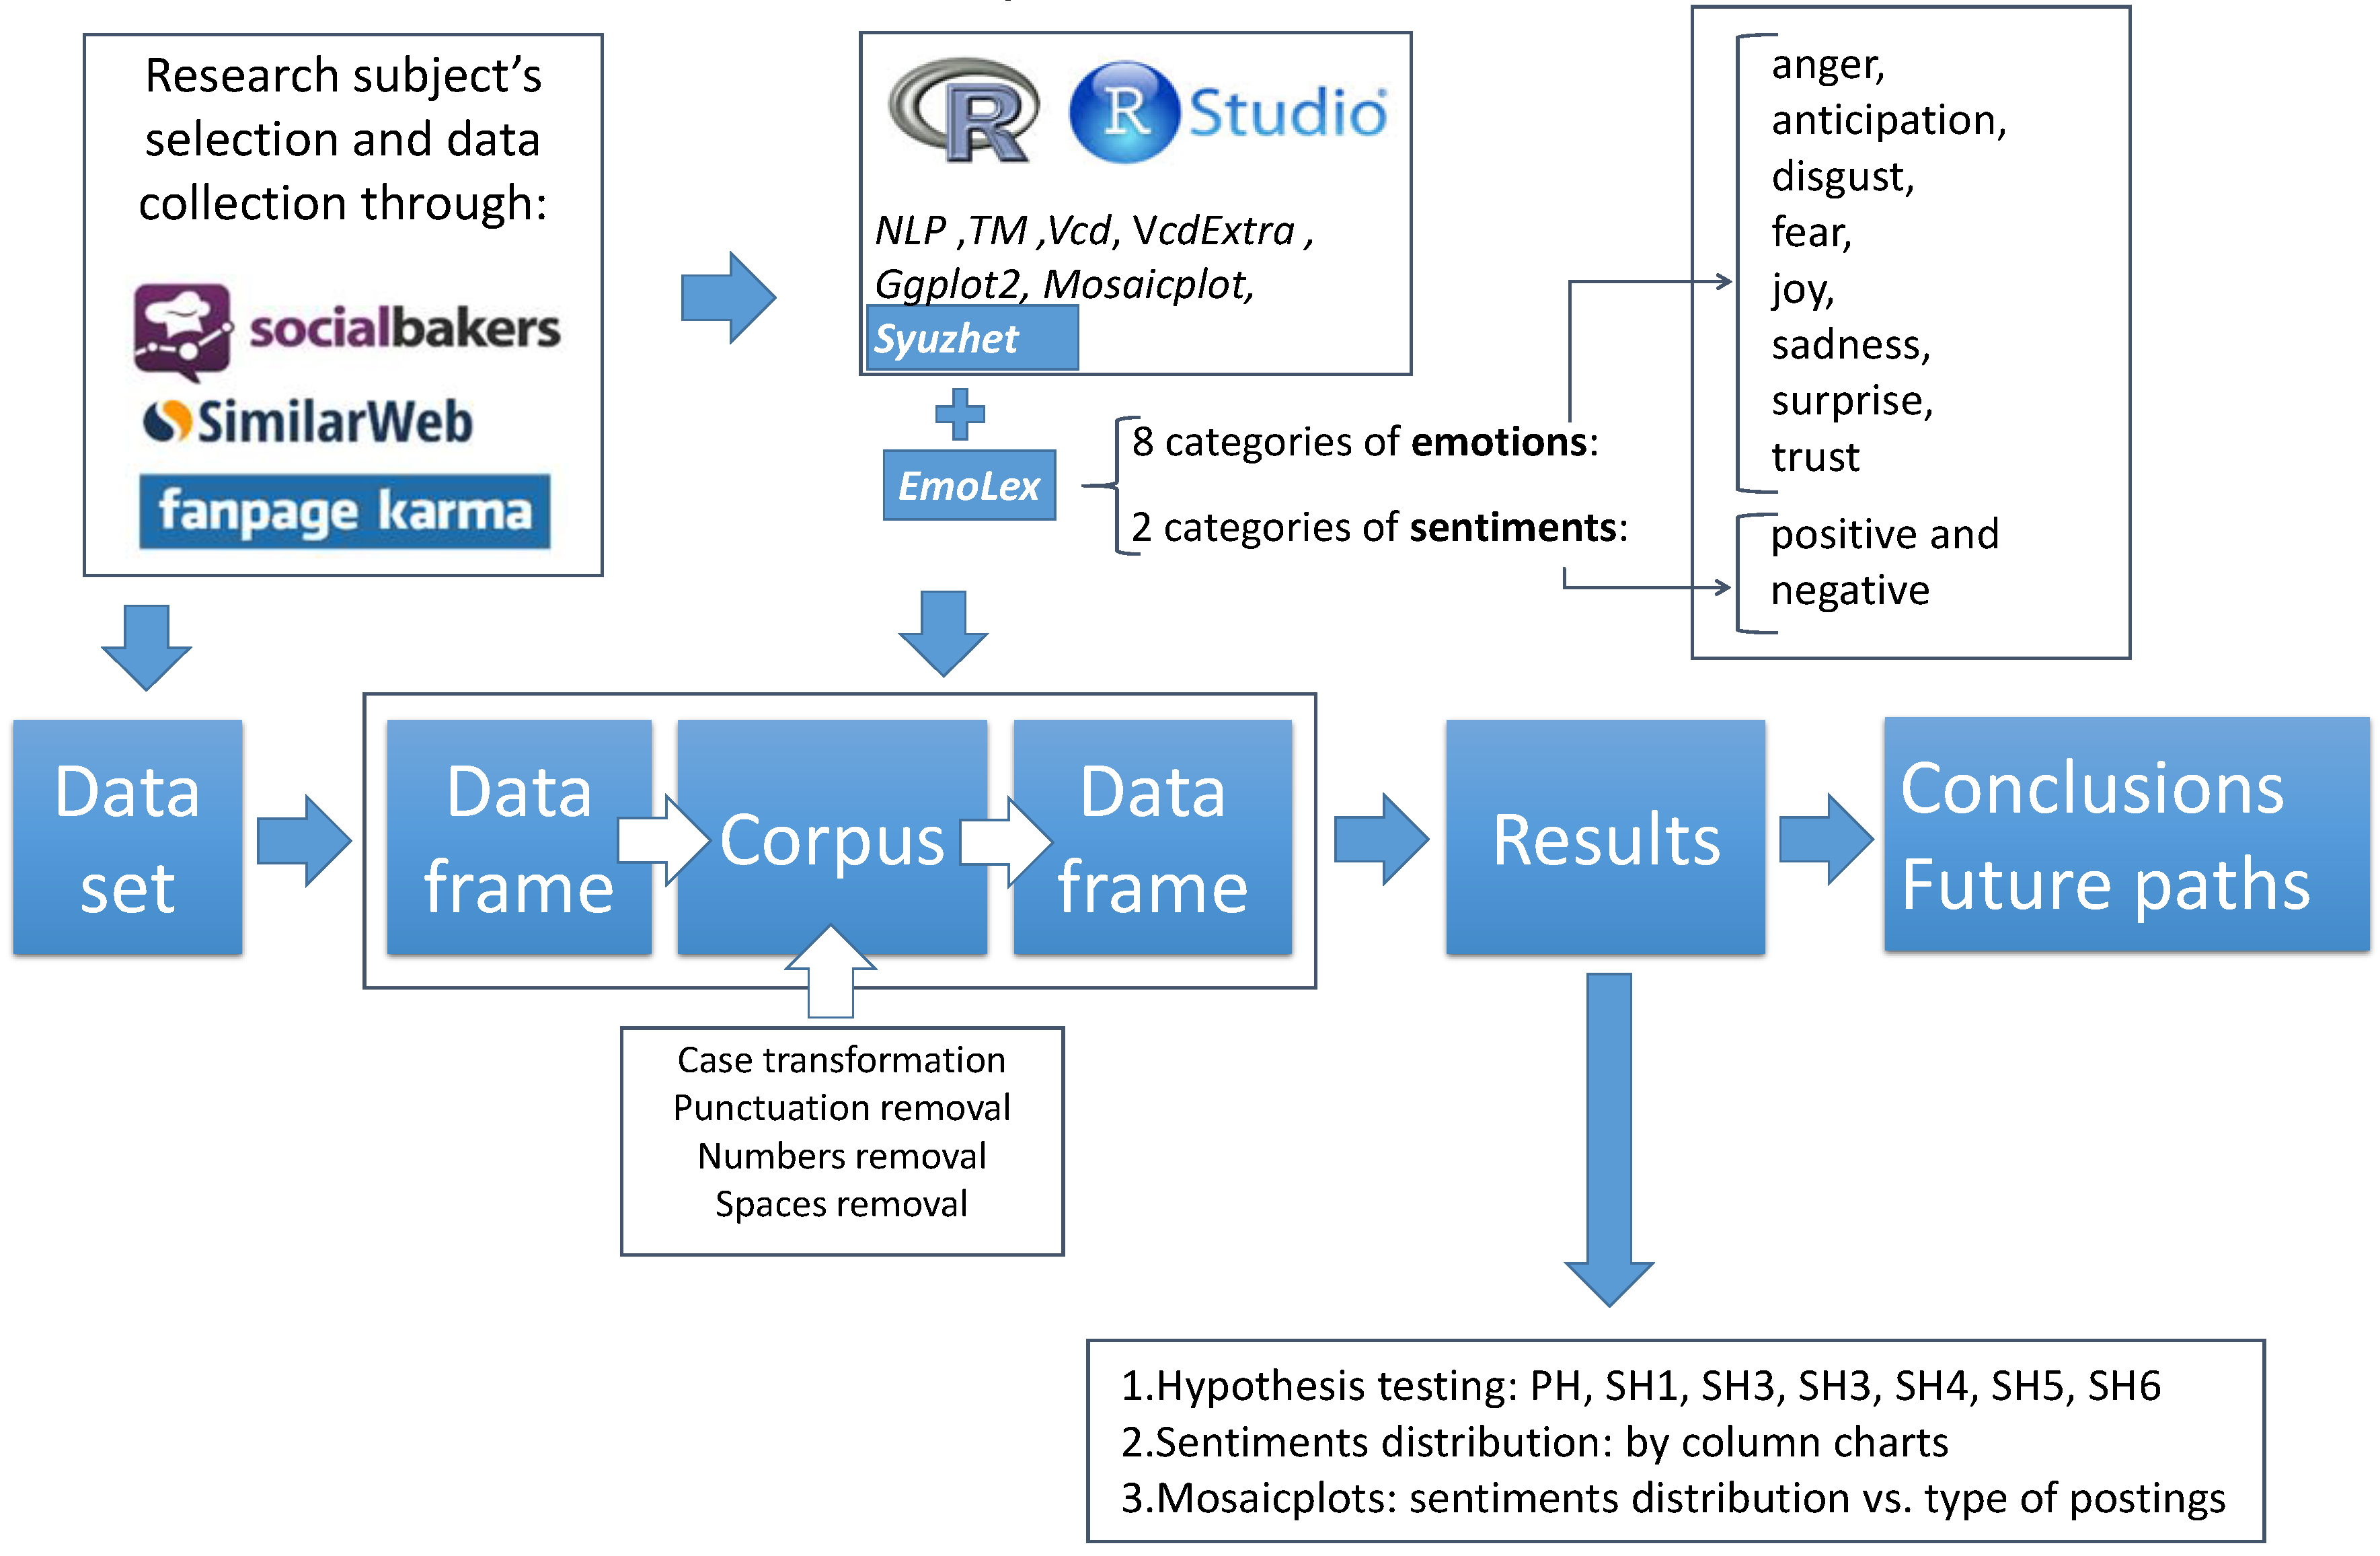
3.2. Data Analysis and Research Methodology

The data analysis was conducted using two main methods: Qualitative method—an analysis of existing theoretical concepts and methods; and quantitative method—an analysis of data collection and processing. The mathematical and statistical methods were the basis for the processing and interpretation of data, especially the statistical estimation for the hypotheses demonstration, using statistical tests for statistical comparison. The source of data for the above-mentioned methods was obtained from an application developed in C#. The computer application accommodates on a single platform all the charts and, more importantly, the laborious calculations required for determining the rankings of each post which have been made using KPI’s for each company and social network.
The research methodology adopted for this study is a mixed one. Figure 2 shows the conceptual model used to achieve the aims of the study.
The case-study was used as the main method of investigation for collecting necessary social network data. The first phase of the study was focused on the activities carried out on the official websites of Coca-Cola and PepsiCo (global market with the domains.com) in the first part of 2018, namely, between January and May. The research subjects were nominated according to the rankings made by Social Barker’s experts obtained by targeting Facebook pages with the most followers. In this ranking, Coca Cola was ranked the 4th (with approximately 105 million followers), and its competitor PepsiCo being ranked the 31st (47.8 million followers). Although Facebook is the main SM tool used in the interaction with actual fans, the two analyzed companies have active pages on other social network platforms, such as: Twitter, Instagram, Pinterest, Google+ and Youtube. Moreover, according to top social network demographics, the two brands had the highest number of active users in the beverage industry in 2017. It should be noted that the above ranking was conducted globally in 2017, although it was published in early 2018.
The analyzed data was collected through the Similar Web site (https://www.similarweb.com/), a well-known marketing intelligence tool. The second phase of this study was the assessment of the activities for the two companies on official SM channels. The collection of data on social networks required the use of an online tool needed to analyze and monitor SM data, namely, FanPageKarma [55] which, according to reviews from g2Crowd, provides comprehensive services, and a complete picture of fan interactions on company pages. The data collected with FanPageKarma were exported and stored in spreadsheet format. The collected data was extracted from the top 50 posts from January to May 2018 of the official social network pages of Coca-Cola and Pepsi (@CocaColaCo, @PepsiCo) at a global level, and it is based on the key performance indicators divided by categories. The model based on the KPI matrix has a set of indicators and to each of them, points were awarded. Based on this, a top of the 50 posts was made for each brand and for each SM page. Depending on the carried-out activities, KPI’s can be classified, as presented in Figure 3.
The data have been the source for interpreting the information in SA conducted in R language and R studio. The SA aims to establish whether the words (within posts, in this case) have a positive, negative or neutral significance. For this purpose, the Syuzhet package available in R was used. From this package, the NRC Word-Emotion Association Lexicon (aka EmoLex) [41] was applied, which contains a list of words associated with eight categories of emotions: Anger, fear, anticipation, trust, surprise, sadness, joy, disgust, as well as two categories of sentiments, positive and negative.
Considering the above, the focus was to highlight the following features in the analyzed text as presented in Figure 4.
The data for analysis was converted into a data frame, and then into a corpus (six csv files, one for each social network), which required certain minor changes, such as, turning small letters into capitals, elimination of punctuation signs, numbers, blanks, etc.
In terms of data processing and interpretation, especially for the KPI’s, several mathematical and statistical methods were used, especially statistical estimation for defining statistical hypotheses that had to be confirmed or rejected on the basis of statistical tests applied for statistical comparisons. The development environment used for hypothesis testing was R Studio, together with the R language that comprises a pack of tools for SA purposes (NLP—helps with data processing; TM—provides text mining features; Syuzhet, sentiment—performs the analysis of sentiments on the text; vcd, vcdExtra—provides features for statistical tests, ggplot2, mosaic plot—libraries for graphing).

4. Results

The results of analysis presented below are divided into three categories: Hypothesis testing (1), sentiment distribution by histogram charts (2); and polarity categories distribution by Mosaic plots (3).

4.1. Hypothesis Testing

The secondary hypothesis (SH1, SH2, SH3, SH4, SH5 and SH6) were tested. There are significant differences in the user emotional reactions in their activities on Facebook-SH1, Instagram (number of likes, commentary and distributions)-SH2, Twitter (number of likes and retweets)-SH3, Pinterest (the number of repins and comments)-SH4, Youtube-SH5, and Google+ SH6 for each type of post (photos or videos). Consequently, each secondary hypothesis was tested for every social network platform included in the study.
First, the t-test was used to analyze the relationship between the user’s reactions and the two types of posts, and the Wilcoxon test was applied to test the intensity of preference for photo vs. video posts. Second, the Chi-square test was applied for the analysis of the variable (sentiment categories) and the type of post. Third, the significance levels were set at the 5% using both the student t-test, the Wilcoxon test and the Chi-square test.
The first analyzed social platform was Facebook. As can be seen from Table 2, the results of the independence tests (t-test results) show the following: (1) The variable number of likes is noticed in all cases, the secondary hypothesis has been validated; (2) in the case of number of comments, it is noted in almost all cases, the second hypothesis has been validated, except the t test for @PepsiCo; and (3) for the variable number of distributions, in almost all cases, the secondary hypothesis has been validated, except the t-test for @PepsiCo. Therefore, based on the results shown in Table 2, it could be assumed that, with an assumed risk of 5%, there is a correlation between the three types of analyzed reactions and the type of post (photo or video).
Table 2 also presents the analysis of the results for the independence tests conducted on the Instagram platform. The t-test results show the following: (1) There is a correlation between the number of likes and the type of posting, as in almost all cases, the secondary hypothesis has been confirmed, except for the t-test for @PepsiCo; (2) it shows a strong correlation between the number of comments and the type of posts, as in all cases, the secondary hypothesis has been validated (P-value < 0.05).
The analysis of the results regarding the association test between the sentiment category and the type of posting (for both Facebook and Instagram pages) is shown in the last line of Table 2 (Chisq test). From the data, it can inferred that in all cases, for each category of sentiments, the secondary hypotheses (SH1 and SH2) have been confirmed. Therefore, it can be concluded, with a 5% assumed risk, that there is strong correlation between sentiment categories and the type of post (photo or video).
Furthermore, what is striking about the intensity (Wilcoxon test results in Table 2) of the user’s preferences for the type of posts is that on both SM platforms (Facebook and Instagram), for both companies (@CocaColaCo, @PepsiCo), the reactions are very different. Consequently, the reactions for photo versus video are very well-differentiated so that the intensity of the user’s preference for photo posts is significantly different compared to users who prefer video posts.
Table 3 shows the summary statistics of the analysis conducted for the variables on Pinterest and Twitter pages (t-test results). Notably, what stands out in the table for the Pinterest pages is: (1) The results of testing the variable, the number of Repins, show that in all cases the secondary hypothesis (SH3) has been validated; (2) the results of testing the variable, the number of comments, shows that in almost all cases, the secondary hypothesis has been validated (except for the t test for @PepsiCo). As a result, these findings suggest that, with an assumed risk of 5%, the two analyzed variables (Reactions: Repins and Comments) are correlated with the type of post (photos or video). Clearly, what is apparent for the Twitter pages is that: (1) for the first variable, the number of likes, it can be stated that, in all cases, the secondary hypothesis has been validated; (2) for the second variable, the number of retweets, it has been observed that, in almost all cases, the secondary hypothesis (SH4) has been validated (except for the t-test for @PepsiCo). Therefore, the analysis proves that there is a strong correlation between the number of likes and retweets, and the type of posting (photo or video).
The association analysis (also included in Table 3—Chisq test) between the category of expressed sentiments by customers and the type of postings (for both Pinterest and Twitter pages) shows that, in all cases, and for each category of sentiments, the secondary hypothesis has been validated. Therefore, it can be asserted, with a 5% assumed risk, that for both Pinterest and Twitter accounts, there is a strong correlation between the categories of sentiments that the user displays for the two types of posts.
The most interesting aspect related to the intensity of the user’s preference for photo versus video posts on Pinterest and Twitter pages (Wilcoxon test results in Table 3) is that: (1) In the case of @CocaColaCo, the users have significantly different reactions (RePins, Comments, Likes, Retweets) for the two type of posts while (2) in case of @PepsiCo, the users do not manifest significant differences in their preferences for photo versus video posts.
Regarding the analysis conducted for the variables, the number of comments and the number of views on the Youtube page, the results are summarized in Table 4 (t-test results). The results of the independence test for both variables, the number of comments and the number of views, show that in all cases the secondary hypothesis (SH5) has been validated. Further, it can be asserted, with an assumed risk of 5%, that the two analyzed variables are correlated with the type of post (photos or video).
Similarly, Table 4 includes the t-test results of testing the variables, the number of distributions and the number of comments on the type of posts (photos and videos) on Google+ official channels owned by @CocaColaCo and @PepsiCo. In all cases, it is noticed that the results of the t-test show a strong statistical significance. Therefore, it can be asserted that there is a correlation between the analyzed variables and the types of posts on the Google+ platform validating the secondary hypothesis (SH6).
The last line of Table 4 clearly shows that the result of the independence test between the sentiment categories and the type of posts indicates a strong correlation between the variables, as in all cases, the significance value of Chi-square test is < 0.05.
As Table 4 shows (based on the Wilcoxon test results), there is no significant difference between the two SM users, in terms of intensity of the preference for photo versus video posts. Therefore, it can be concluded that, on Youtube and Google+ platforms, the users of @CocaColaCo and @PepsiCo SM channels, react similarly in terms of intensity of their preference for photo versus video posts.
Together, these results (summarized in Table 2, Table 3 and Table 4) and the above interpretation provide an insight into the analysis aimed to validate (or invalidate) the secondary hypotheses (SH1-SH6), and ultimately to validate (or not) the main hypothesis (PH). Therefore, the analyzed variables (the number of likes, comments, distributions, retweets, repins, views) on the six SM platforms (Facebook, Instagram, Pinterest, Twitter, Youtube and Google+) are relatively dependent on the variables, the type of posts and expressed emotions, which lead to the validation of the secondary hypothesis for each analyzed social tool. Moreover, the above results implicitly lead to the validation of the main research hypothesis (PH).
It can be seen in Table 2, Table 3 and Table 4 that SM users have different and random reactions to the posts of the two analyzed companies containing photos and/or video on all studies SM platforms.
Additionally, the intensity of the user preference for photo versus video posts has also been tested. The results show that, besides Facebook, Instagram and Pinterest (only for @CocaColaCo), users do not react significantly differently in terms of their preference for one of the two types of posts that have been studied.
Finally, a more refined distribution of sentiments valences (positive, negative and neutral) of the users due to the type of post (photos or videos) should be made. Therefore, a Mosaic Plot analysis was performed and the results of the sentiments valence distribution are described in Section 4.3.

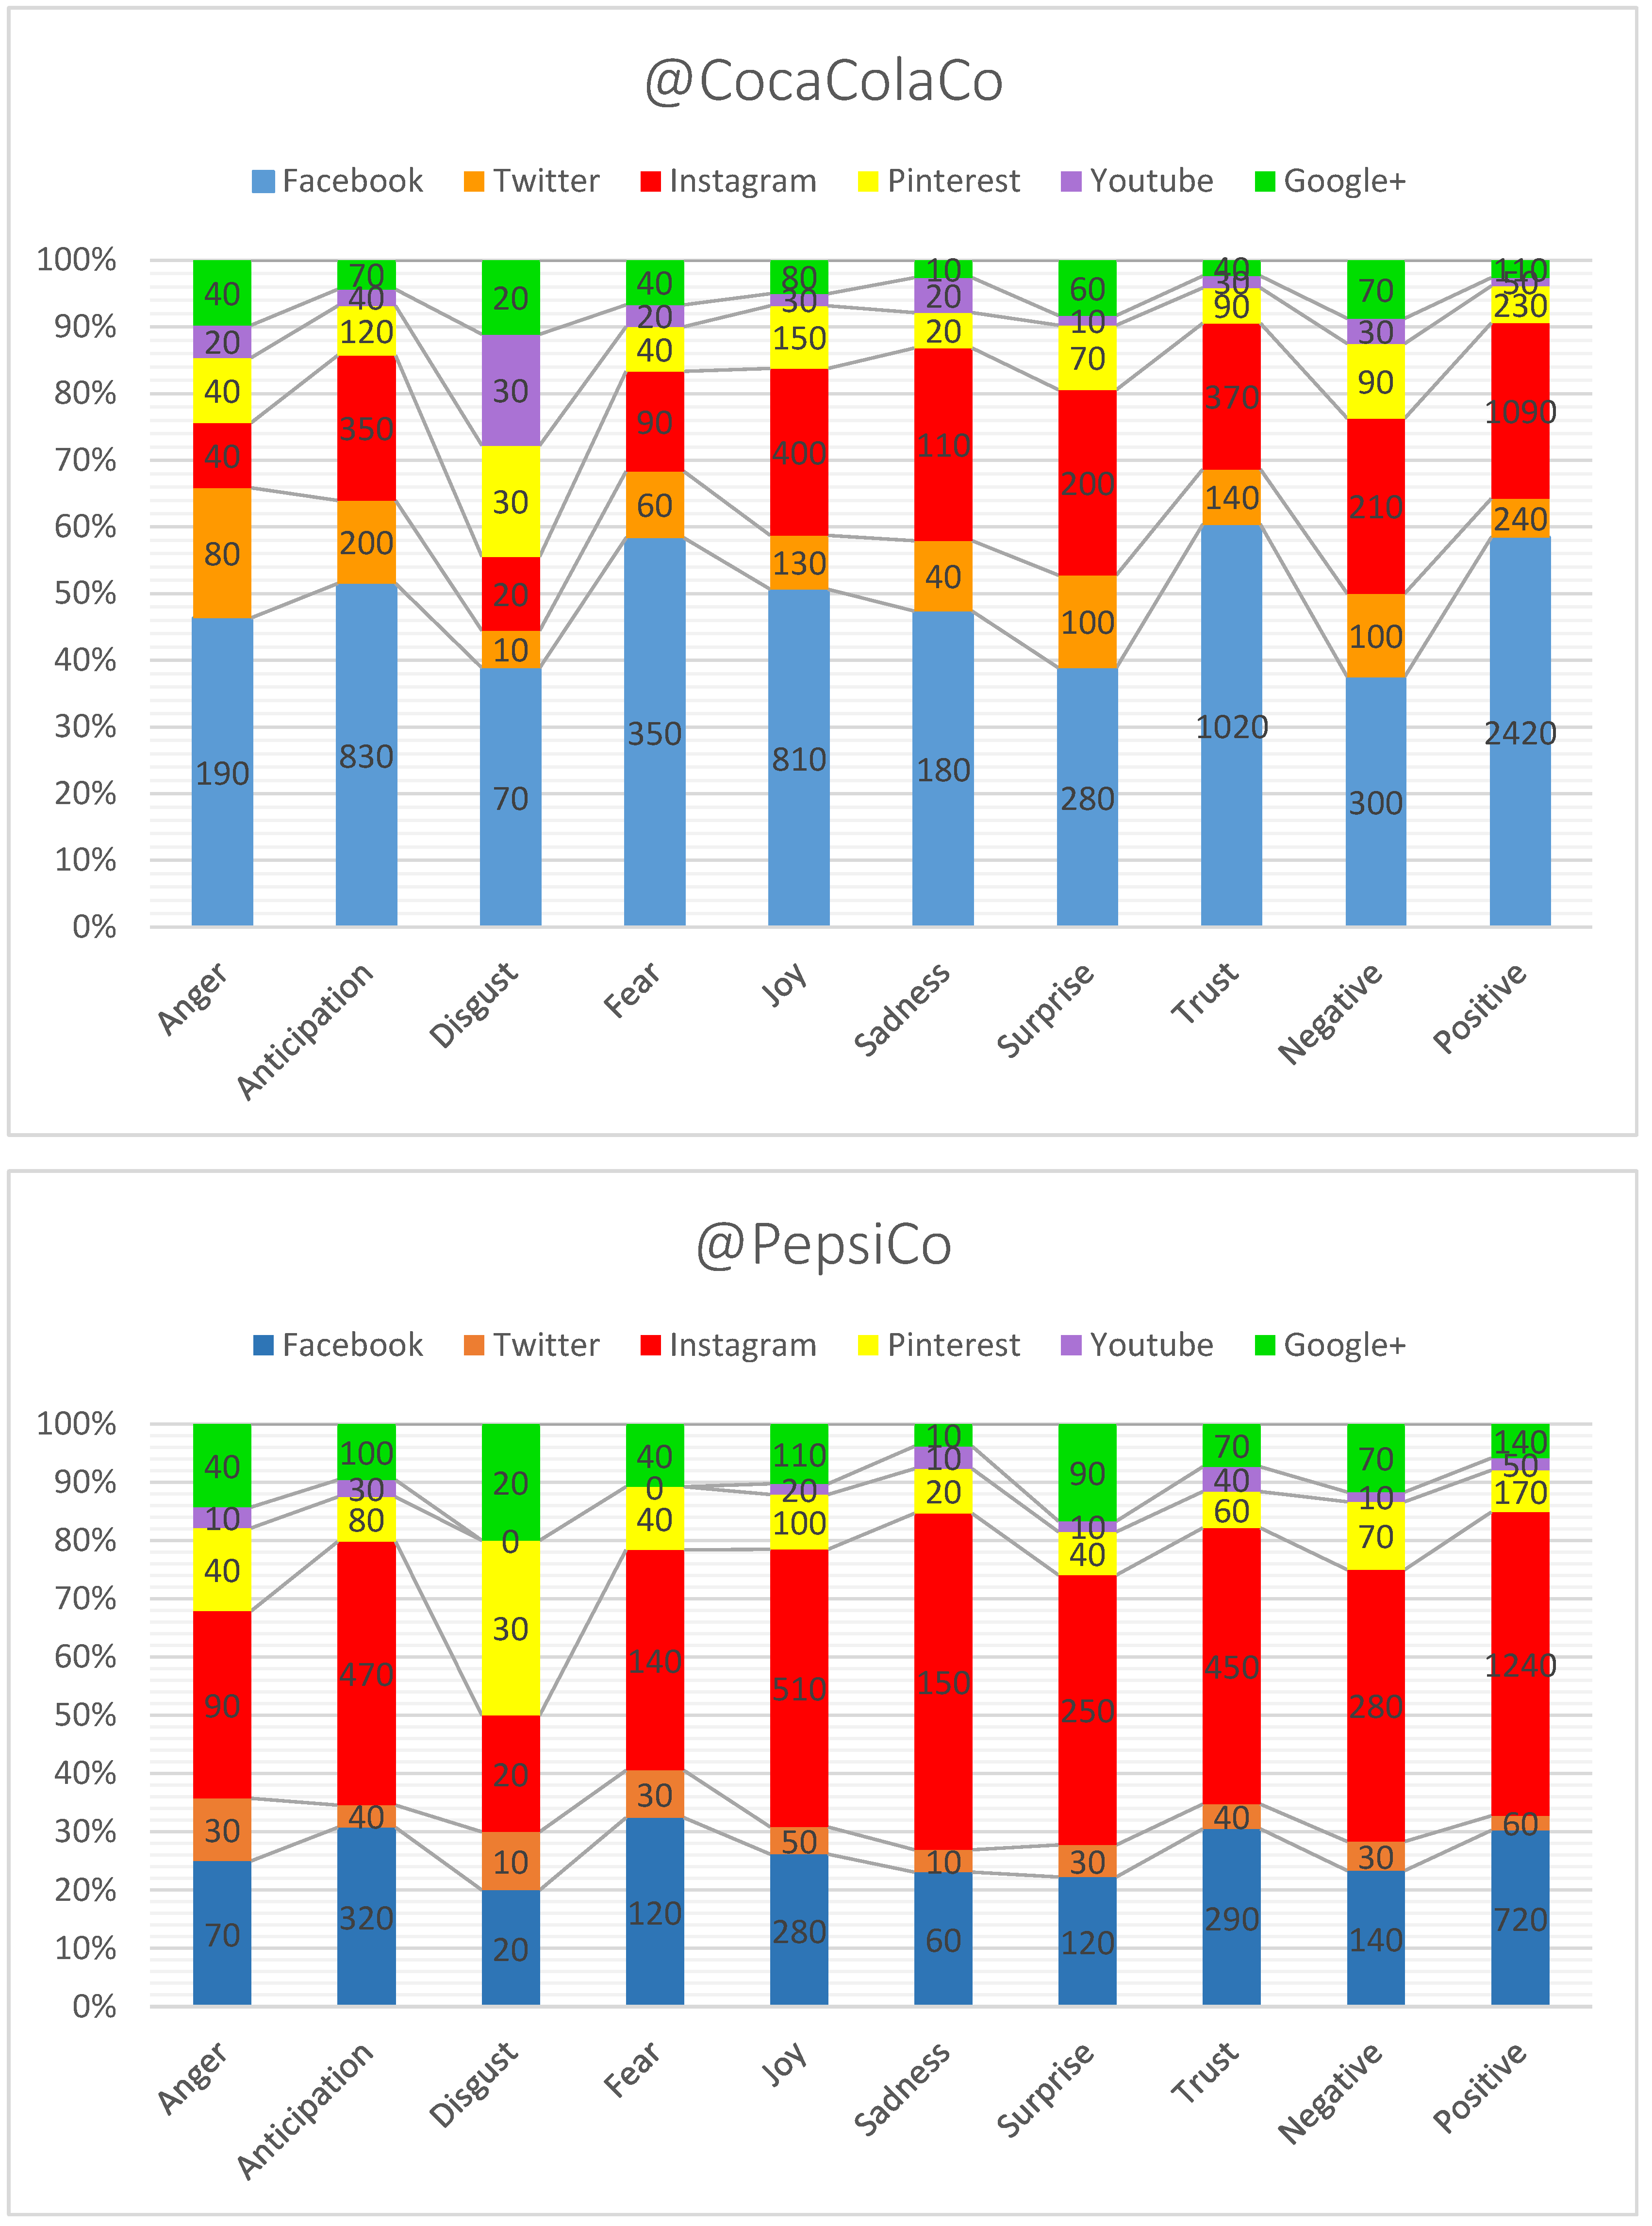
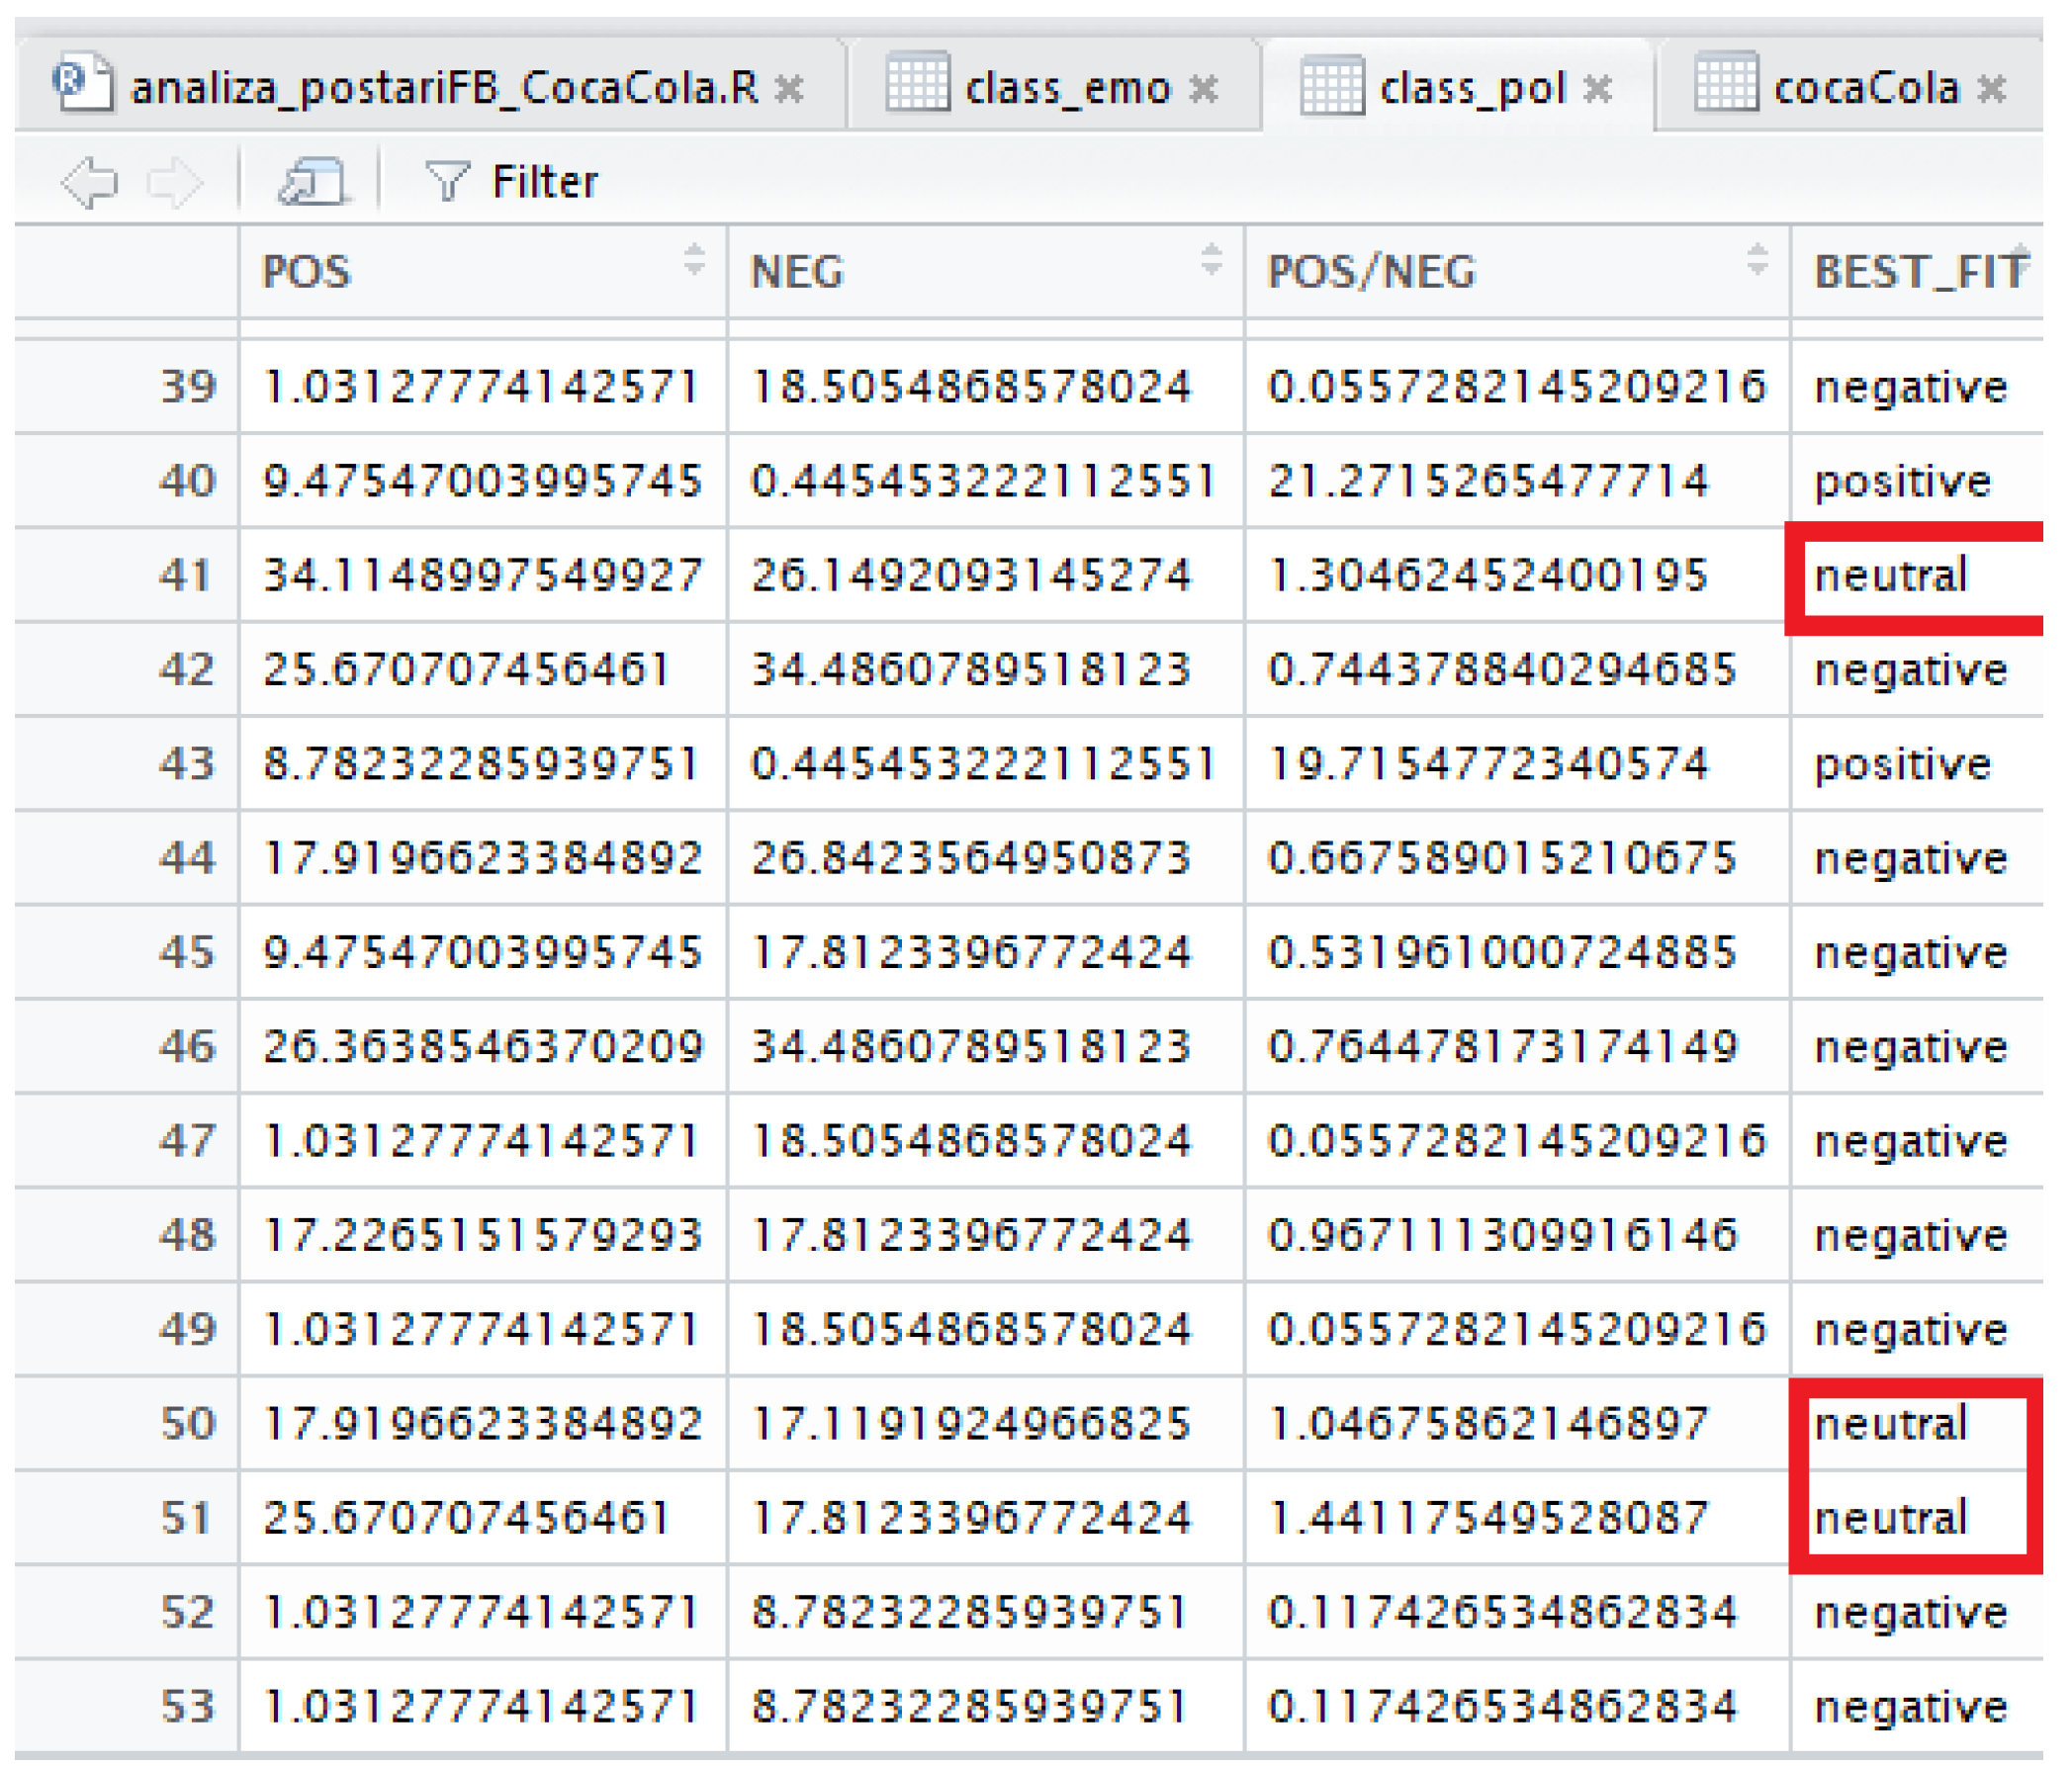
4.2. Sentiment Distribution by Histogram Charts

This section contains a sentiment distribution analysis shown via histogram charts. Consequently, the use of the function get_nrc_sentiment returns another data frame where, for each analyzed term from the original (spreadsheet) file containing the posts, a new column for each type of emotion (eight in total) and the sentiment polarity (positive and negative) is created.
For each social network page of the two companies, a histogram was developed displaying the sentiments distribution for the analyzed posts by using ggplot2 package. Due to space constraints, this paper presents the results in two cumulative histogram charts, instead of individual ones. The histogram is shown in Figure 5. For Facebook, @CocaColaCo has predominantly positive posts with a score of 2420 points. The highest scores for expressed emotions are: Trust with 1020 points; anticipation with 830 points and joy with 810 points. The lowest score was recorded by the emotions of disgust (70 points), which is a positive fact for the company. For @PepsiCo, a similar trend was noticed compared to @CocaColaCo, as also the positive (720 points) sentiments predominated and the negative ones had only 140 points. The emotions of anticipation achieved the highest score of 320, followed by the emotions of trust (290 points) and joy (280 points).
On Twitter, the situation of the two analyzed companies is slightly different, but only in terms of the value of points. The trend line is similar, namely, @CocaColaCo channel has mostly positive sentiments, with a total of 240 points, while the negative ones score a total of 100 points. In terms of emotions, the emotions of anticipation are the highest (200 points), then trust (140 points), joy (130 points) and surprise (100 points). In the case of @PepsiCo, positive sentiments are also ranked first (60 points), while negative ones have a score of 30 points. The emotions of joy are first ranked, with 50 points, followed by trust (40 points) and anticipation (40 points), surprise (30 points), anger (30 points), fear (30 points), sadness (10 points) and disgust (10 points).
As for the sentiment distribution analysis developed on Instagram posts, it can be said that for the @CocaColaCo channel, the postings predominantly show positive sentiments as they score 1090 points, while the negative ones score only 210 points. The emotions of joy have 400 points, trustworthiness 370 points, and anticipation 350 points. In the case of @PepsiCo, there is an increased score for positive sentiments (1240 points), which is supported by the emotions of joy (510 points), anticipation (470 points), trust (450 points) and surprise (250 points). Negative sentiments scored 280 points, and the emotions of fear 140 points, sadness 150, anger 90 points and disgust 20 points.
The histograms display for the channels of the two companies on Pinterest platform that in the case of @CocaColaCo, positive sentiments are ranked the first (with 230 points). In terms of expressed emotions, both emotions of joy (150 points) and anticipation (120 points) predominated, while trust was given 90 points. In the case of @PepsiCo, it was found that positive sentiments are prevalent (170 points), while negative ones are at a distance of 100 points. The emotions of joy received 100 points, anticipation 80 points, trust 60 points, and there is equality in points for anger, fear and surprise (40 points each).
Regarding Youtube, the results show that both @CocaColaCo and @PepsiCo pages are similar, in the sense that there is a uniform distribution of points in the range 10–50 points, and a similarity of point distributions for both categories (sentiments and emotions). Positive sentiments predominate (50 points) over the emotions of anticipation (40 points for @CocaColaCo and 30 for @PepsiCo), joy (30 points for @CocaColaCo and 20 for @PepsiCo), trust (30 points @CocaColaCo and 40 for @PepsiCo). In Figure 5, the Youtube histogram for @PepsiCo showed that zero words were identified for the emotions of disgust and fear.
For Google+, the results in Figure 5 were obtained after the analysis of the activity for the two companies on global channels. In the case of @CocaColaCo, there is a distribution oriented towards positive sentiments, with 110 points, while the emotions of joy have 80 points, anticipation 70 points and surprise 60 points. Negative sentiments recorded 70 points, while the emotions of sadness had 10 points, anger and fear 40 points, and disgust 20 points. @PepsiCo first shows positive sentiments (140 points), while negative sentiments have half the score (70 points). The emotions of joy were given 110 points, while anticipation (100 points), surprise (90 points), and at equality, were found the emotions of anger and fear (40 points).
Overall, based on the sentiment histograms analysis, a specific pattern of positive and negative sentiments expressed by customers for the two analyzed companies was observed. The results are shown below in Table 5.
The general conclusion drawn based on the analysis shown in Table 5 is that for most (four out of six) SM platforms, the highest share of positively expressed sentiments appear in favor of @CocaColaCo channels compared to @PepsiCo. Google+ and Youtube channels are the only ones with an advance of 20% and 6%, respectively.

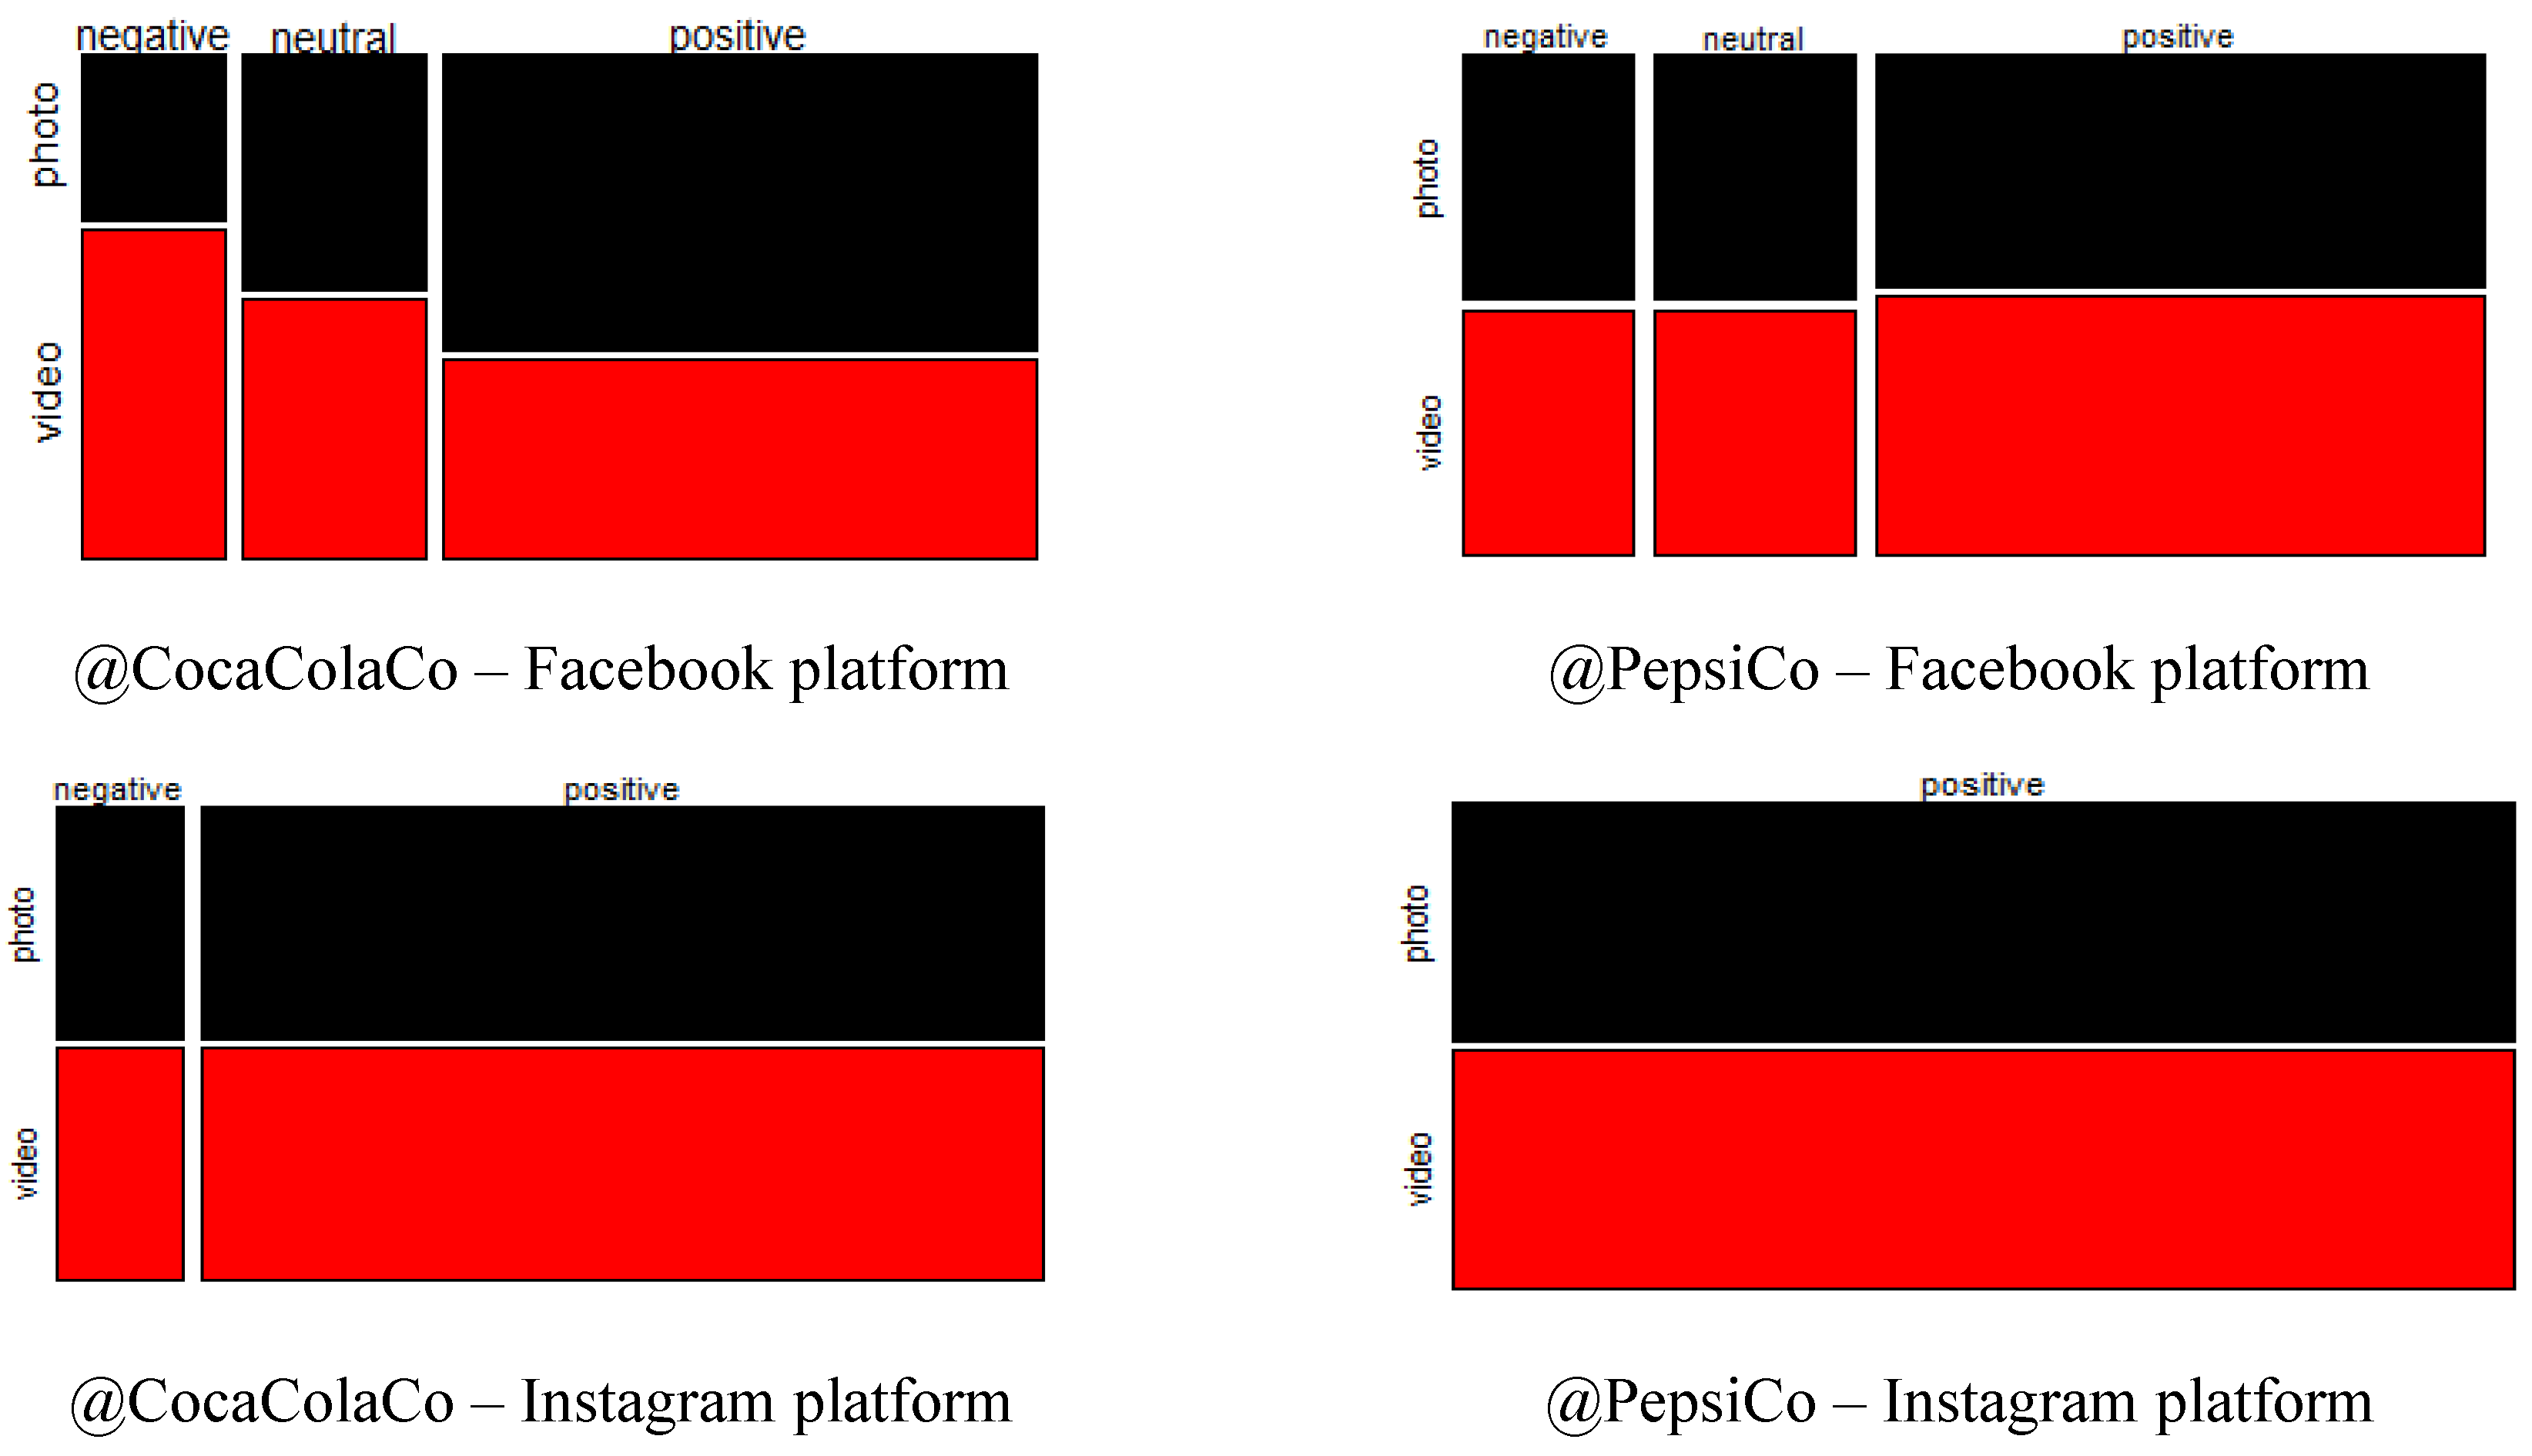
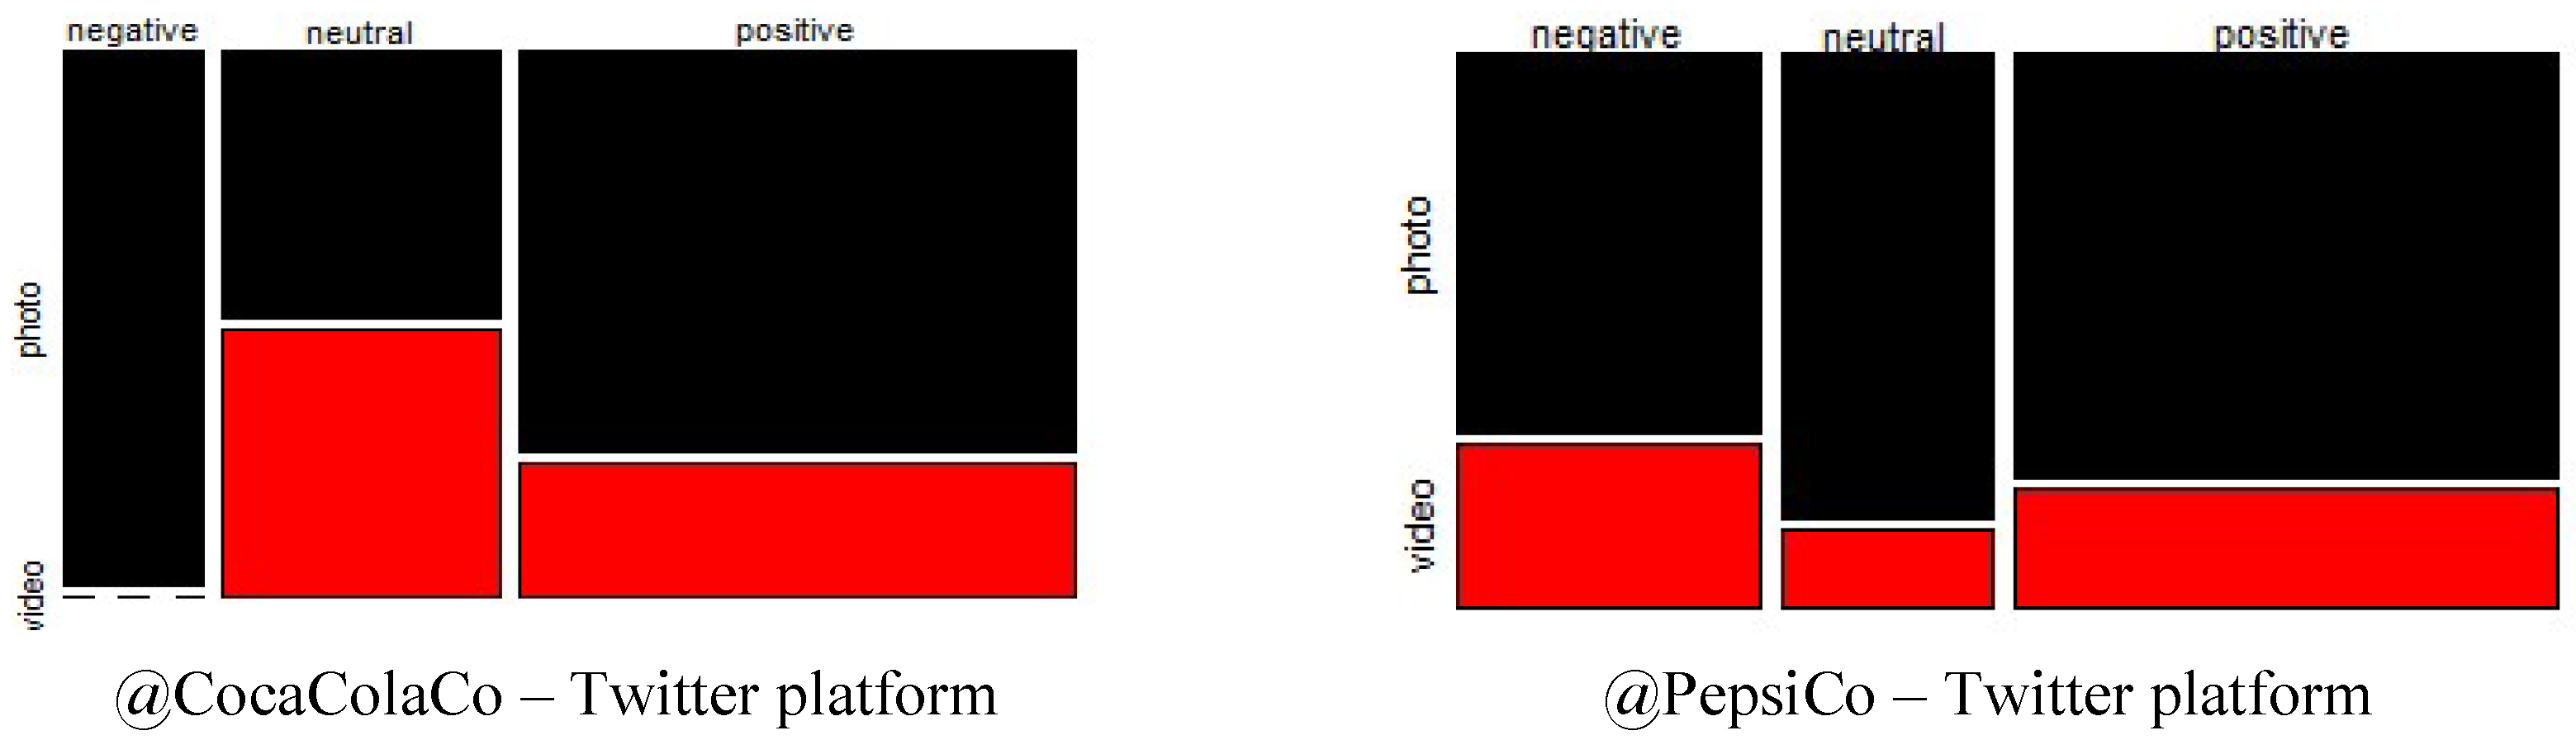
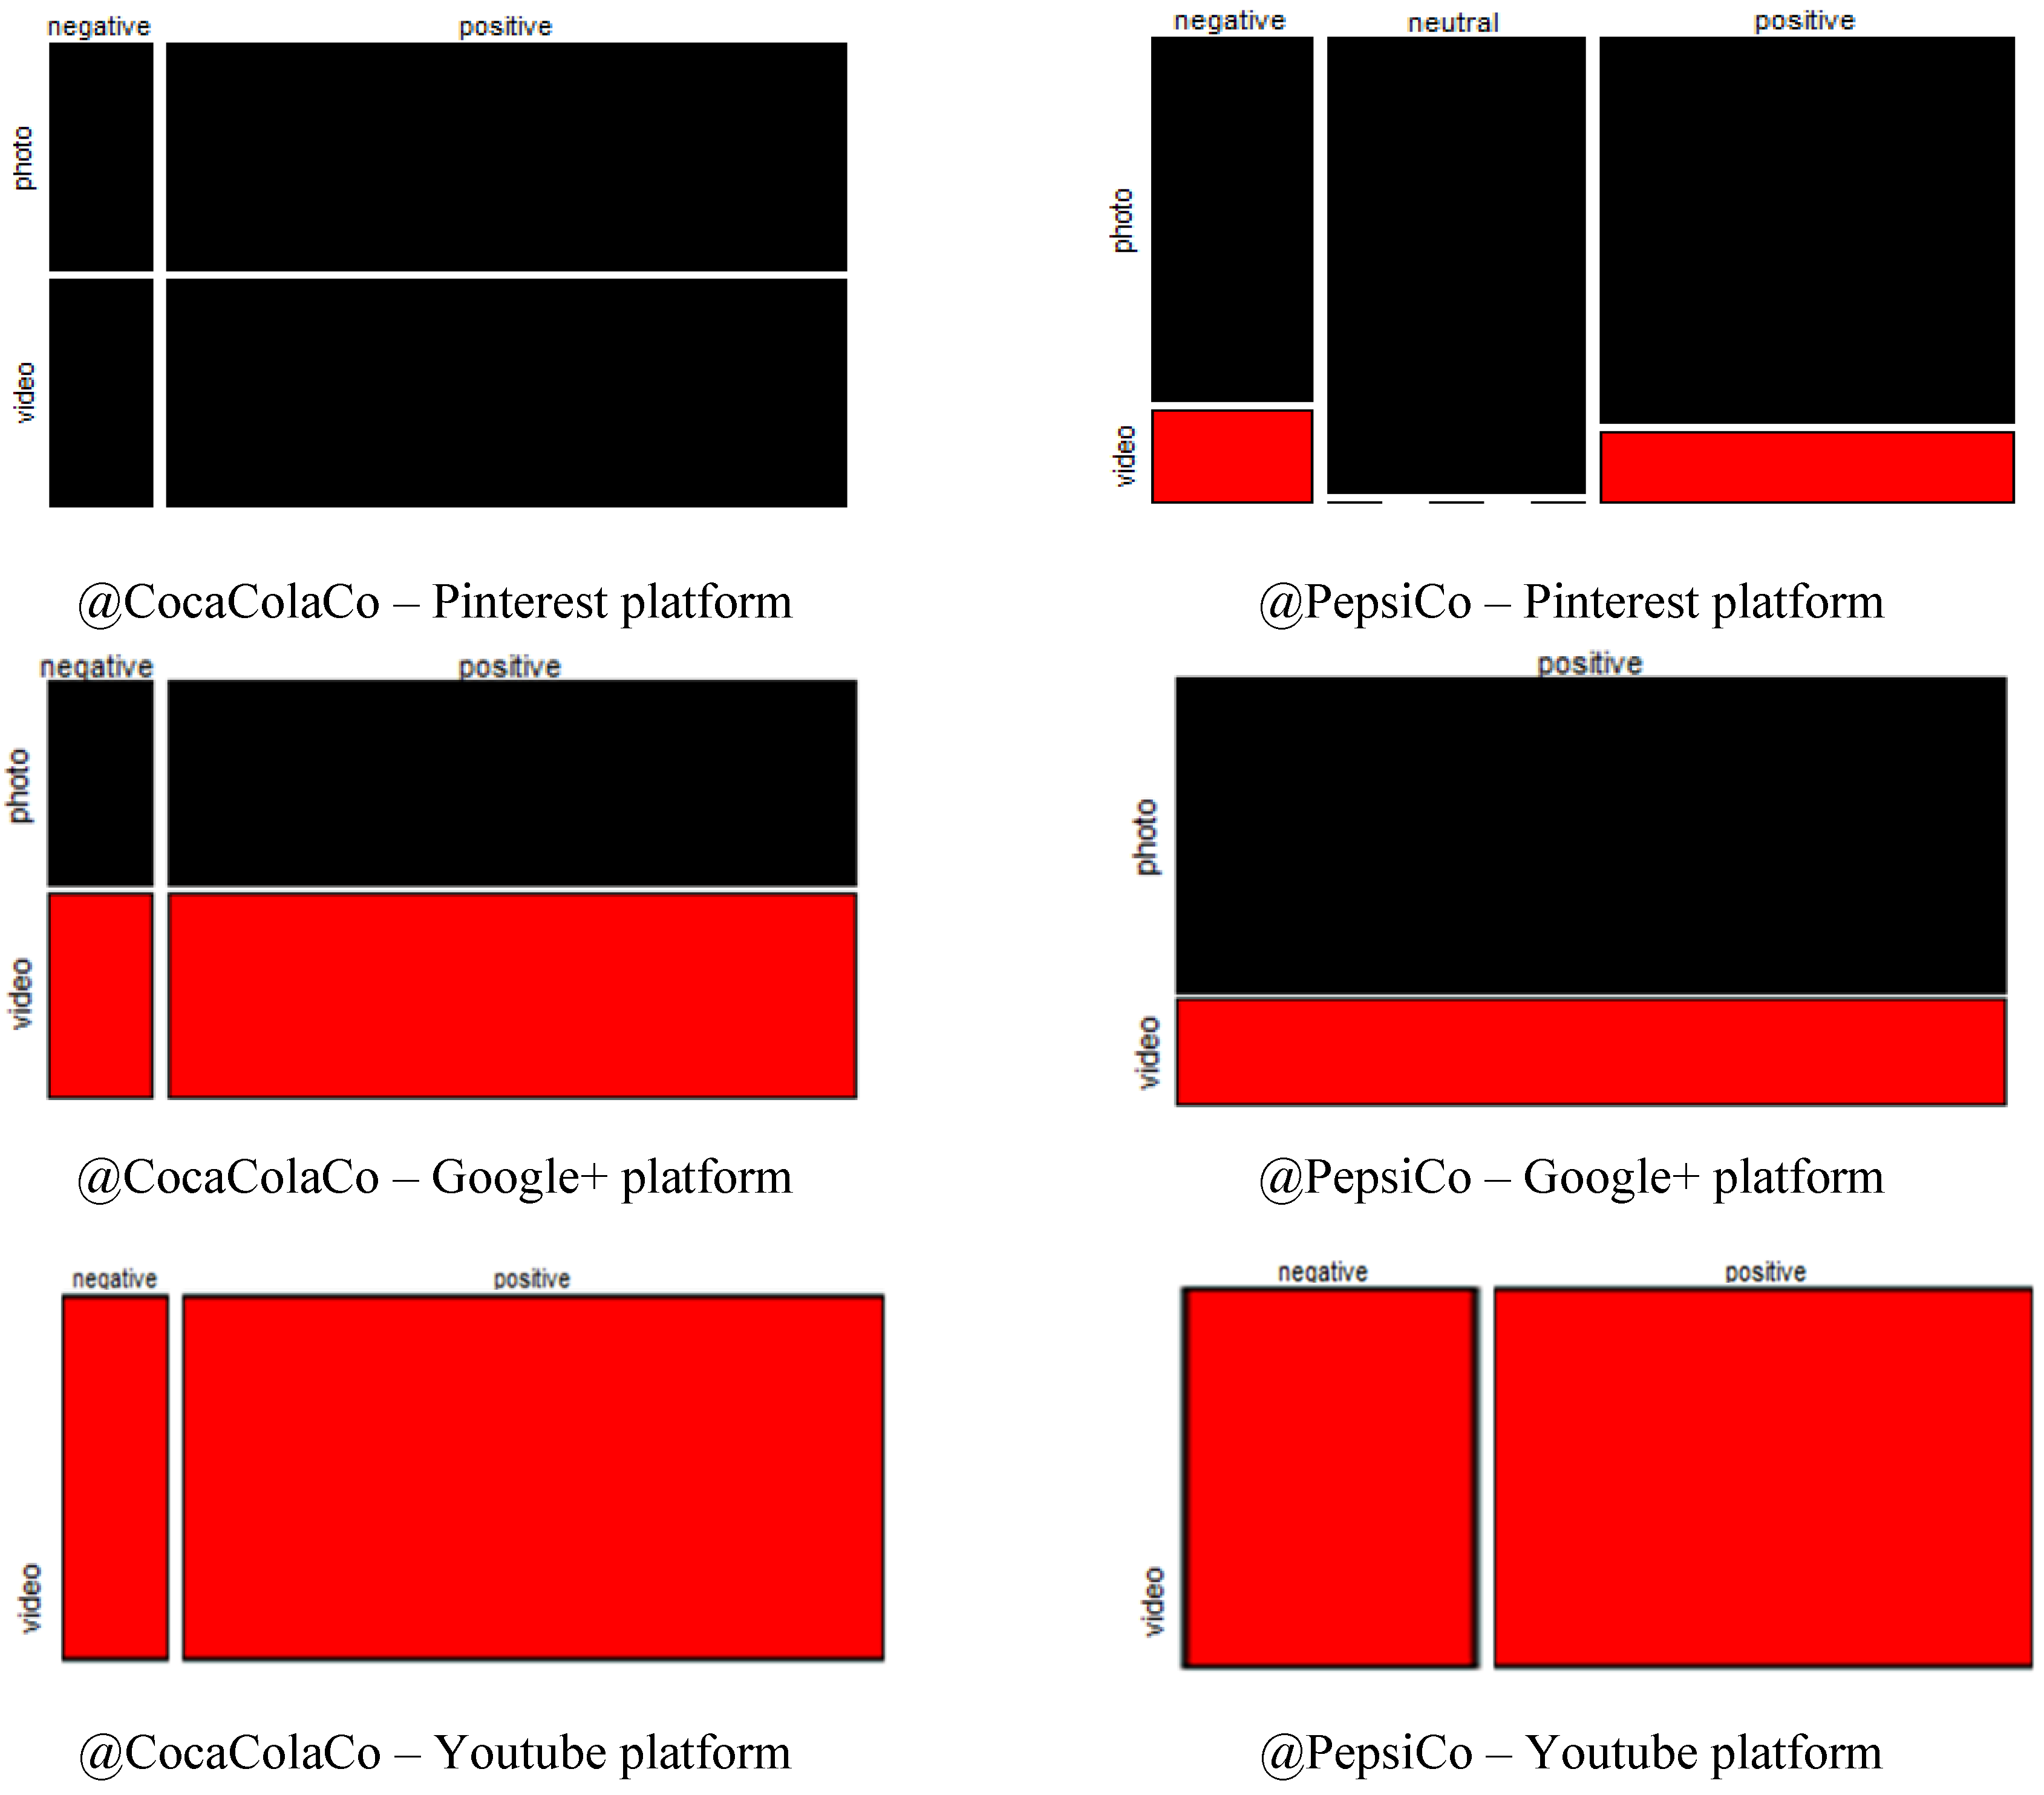
4.3. Polarity Categories Distribution by Type of Posts: The Mosaic Plot

In order to analyze the distribution of the expressed sentiments by the type of postings (photos and videos), mosaic plots have been developed. In the original corpus, this study used the naive Bayes algorithm for assessing the polarity of information conveyed by words. Therefore, the words included into the corpus were classified as positive, negative and neutral. From the package sentiment (from R Studio), classify emotion and classify polarity methods have been applied. The result was stored into a data frame that generated the scores obtained for each post and each emotion, and ultimately for each valence of sentiment.
Figure 6 shows an example of post classifying by its valence, positive, negative or neutral for CocaCola’s Facebook official page.
The mosaic plots provide an overview of the data and make it possible to emphasize the relationships between the analyzed variables. For this purpose, in the R language, the packages grid and vcd were used to generate the plots.
For the Facebook platform, the mosaic plots obtained for the posts of the two companies can be interpreted, as follows (in the first line of Figure 7): @CocaColaCo—the share of positive sentiments for the posts with photos is predominant, the share of neutral sentiments is equal for both types of posts (photo and video), and negative sentiments are mostly developed for video posts; @PepsiCo—there is no difference in the distribution of negative and neutral sentiments for both types of posts (photo and video), and for positive sentiments, it is noticeable that a small difference is favorable to video postings.
On Instagram accounts, the share of sentiments displayed in the second line of Figure 7: @CocaColaCo—it can be said that there are no neutral sentiments, and positive sentiments are equal to the negative ones for both the photos and the video posts; @PepsiCo—negative and neutral sentiments are missing, and both the types of posts are equal in weight for positive sentiments.
Regarding the share of expressed sentiments on Twitter accounts, the results show the following (the third line Figure 7): @CocaColaCo—the share of positive sentiments for the posts with photos is predominant, the share of words with neutral valence is equal for both types of postings, and the negative sentiments appear only for posts with photos; @PepsiCo—positive sentiments associated with the posts with photos prevail, negative ones are more for photos and the same trend is noted for neutral sentiments (negative valence is higher for photo).
For Pinterest, the mosaic charts express the following (in the first line of Figure 8): @CocaColaCo—there are no neutral sentiments, while the negative and positive sentiments are equal for both photo and video posts; @PepsiCo—neutral sentiments are missing for the video posts, positive sentiments are higher than negative sentiments for the photo posts.
As for the share of sentiments by the type of posts on Google+, the results are only global for the two companies and can be interpreted, as follows (in the second line of Figure 8): @CocaColaCo—both types of posts, photos and video, are predominantly associated with positive sentiments; @PepsiCo—there are only positive sentiments, a higher quantity of posts with photos than videos.
As only videos can be loaded on the Youtube channel, the polarity of sentiments could not be distributed by the two types of posts (photos and videos). Therefore, for video posts, there is a slight distinction by the type of posting for the two brands. As the last line shows in Figure 8, @PepsiCo has a higher share of negatively expressed sentiments compared to @CocaColaCo. Further, neutral sentiments are not present in any of the two companies on their Youtube channels.

5. Discussion and Conclusions

Social tools, along with appropriate performance metrics (KPI), can be used to capture and then analyze big data, using ML techniques, generated by SM posts as to ensure sustainable development of a company’s relationship with its customers. Metrics, such as the number of likes per post, or the number of fans on the Facebook page, are not enough to confirm a company’s success on the social market. Social CRM is a tool linking public sentiments to engagement, subsequent purchase intent and ultimately to product purchasing.
The two analyzed companies (Coca-Cola and PepsiCo) have different approaches in terms of SM activity. Coca-Cola focuses on paid traffic, while PepsiCo uses a more organic one. In terms of used platforms, it was observed that PepsiCo prefers promotion on Facebook, Twitter and Instagram, while its direct competitor prefers posts on Facebook, Pinterest, and other social networks.
This study found that there are significant differences in user emotions and sentiments expressed on different SM networks in the two types of posts (photos or videos). Related to the level of KPI’ dependence on the types of posts (photos or videos), as shown by the independence tests (t-test and Chi-square), in almost all cases, the secondary hypothesis was confirmed (the variables analyzed in turn, two by two, are relatively dependent on each analyzed social instrument).
This study found that the users tend to express their sentiments differently depending on the type of post. Some are reluctant to use videos, while others embrace photos. A possible explanation for this might be the fact that photos express clearer and more concise messages, and users perceive them faster. However, in terms of intensity of the user’s preferences for photo versus video posts, the results display a significant difference for the users of Facebook, Instagram and Pinterest (only for @CocaColaCo), and not a significant difference for other SM platforms included in the study.
The study confirms that the activity of the two brands in the online environment has an emotional impact on current or potential customers and always generates new data sources. This data could be analyzed with a CRM platform and could assist companies in correct segmentation of customers. Consistent with the results, a CRM platform is required to integrate all accounts of a company on SM and to automate its interaction with followers or subscribers in order to learn in a structured way what the market thinks (react, feel) about the provided products and services. This way, important information can be targeted at the right people to be analyzed and, eventually to be used in the strategic decision-making.
Finally, emotional reactions on SM of users, in general, and especially of customers can influence purchasing decisions, taking into account that the number of people using mobile devices to exchange opinions in online communities has been increasing almost exponentially.
Marketing research has already pointed out the driving force of customer emotions and sentiments in the buying decisions. As such, the emotional reaction of customers to company posts on various social networks becomes an important input in the decision-making process at a strategic management level.
The methodology (presented in Figure 2) used in this research can be extended to the analysis of customer reactions to posts of any company’s official social network channel. As long as SM posts are captured through FanPage Karma or any similar platform, a new corpus can be developed and analyzed based on the proposed methodology. Furthermore, the proposed methodology can be applied for the purpose of identifying other company’s potential customer preferences for this type of posts (videos or photos) on the SM official channel. This way, companies can better understand and address the requests of their customers. As such, the massive amount of data that is daily being sent through the official company’s SM channels can be captured and analyzed through ML techniques leading to sustainable development of a business.
In the future, the SM platforms are likely to be reinventing themselves and with the advances of new communication gadgets, SM media will probably shift into photo and video communication (ShapChat, WeCHat, Whatsup, etc.). The AI advances are changing our online experiences into good or bad ones. Bots and fake likes may change the real perception of companies towards true reactions of their customers to posts. Laghate [56] warns that if companies rely too much on metrics, they can be easily gamed. Unfortunately, as a study [57] highlights, there are companies that have employed armies of low-paid workers in developing countries to create fake SM profiles and boost a company or product metrics. They can boost any company’s followers and reactions to specific posts on SM, or post favorable reviews and boost ratings on third party aggregators and review platforms. Undoubtedly, SM platforms are fighting back with advanced algorithms based on AI and mass purges, with mixed success. As a further study [55] declares, it is a game of cat and mouse because whenever these platforms fight against fake followers, the click farms devise a new way to game the system and the menace grows.
Similar unwanted situations can be prevented by law enforcement and ML algorithms for detecting and isolating bots and fake SM reactions. As bots and other fake accounts have been running rampant on SM platforms, law enforcement has started to pay off. As such, Keith [58] stated in 2019, the New York General Attorney underlined for the first time that a law enforcement agency has found that selling fake social media engagement is illegal. Therefore, as the authors in [59] declare, some industry sources hope this marks a turning point in a long-running battle against bot and sock puppet accounts that do not reflect genuine opinions of real people.
The cases illustrated above are beyond the scope of this study and represent this study’s first limitation. Consequently, the second limitation of our study is that the research does not engage with the examination of the negative impact of bots and fake likes (or other similar aspects) on altering the analysis of customers’ reactions to different types of posts on a brand SM channel.
This study has brought up many questions that need further investigation. Thus, in the context of a broader research, the analysis could be extended by continuing to investigate the interactions of customers of Coca-Cola and Pepsi-Cola on other social networks compared to those investigated in this study. The explanation could be that the more social networks, client profiles, tracking comments, posts or hash tags are included in the study, the more comprehensive is the generated behavioral analysis.
Another interesting line of a future research could be a predictive analysis. The models for customer predisposition towards choosing and buying a specific product have already started to raise interest for a wide range of market segments.

Author Contributions

Conceptualization, D.F. and E.-M.T.; methodology, V.-D.P. and E.-M.T.; software, E.-M.T.; validation, V.-D.P. and E.-M.T.; writing-original draft preparation, D.F. and V.-D.P.; writing-review and editing, M.D.; visualization, M.D.; supervision, D.F.

Funding

This research received no external funding.

Conflicts of Interest

The authors declare no conflicts of interest.

References

  1. Minsky, L.; Quesenberry, K.A. How B2Bsales can benefit from social selling. Harv. Bus. Rev. 2016. [Google Scholar] [CrossRef]
  2. Ladhari, R.; Rioux, M.C.; Souiden, N.; Chiadmi, N.-E. Consumers’ motives for visiting a food retailer’s Facebook page. J. Retail. Consum. Serv. 2018. [Google Scholar] [CrossRef]
  3. Chang, S.-H.; Chih, W.-H.; Liou, D.-K.; Hwang, L.-R. The influence of web aesthetics on customers’ PAD. Comput. Hum. Behav. 2014, 36, 168–178. [Google Scholar] [CrossRef]
  4. Gangadharbatla, H.; Hopp, T.; Sheehan, K. Changing user motivations for social networking site usage: Implications for internet advertisers. Int. J. Internet Mark. Advert. 2012, 7, 120. [Google Scholar] [CrossRef]
  5. Gutiérrez-Cillán, J.; Camarero-Izquierdo, C.; San José-Cabezudo, R. How brand post content contributes to user’s Facebook brand-page engagement. The experiential route of active participation. BRQ Bus. Res. Q. 2017, 20, 258–274. [Google Scholar] [CrossRef]
  6. Brodie, R.J.; Ilic, A.; Juric, B.; Hollebeek, L. Consumer engagement in a virtual brand community: An exploratory analysis. J. Bus. Res. 2013, 66, 105–114. [Google Scholar] [CrossRef]
  7. Poecze, F.; Ebster, C.; Strauss, C. Social media metrics and sentiment analysis to evaluate the effectiveness of social media posts effectiveness of social media posts. Procedia Comput. Sci. 2018, 130, 660–666. [Google Scholar] [CrossRef]
  8. He, J.; Shao, B. Examining the dynamic effects of social network advertising: A semiotic perspective. Telemat. Inform. 2018, 35, 504–516. [Google Scholar] [CrossRef]
  9. Anojan, V.; Subaskaran, T. Consumers Preference and Consumers Buying Behavior on Soft Drinks: A Case Study in Northern Province of Sri Lanka. Glob. J. Manag. Bus. Res. 2015. Available online: https://journalofbusiness.org/index.php/GJMBR/article/view/1687 (accessed on 18 March 2019).
  10. Puschmann, C.; Powell, A. Turning Words Into Consumer Preferences: How Sentiment Analysis Is Framed in Research and the News Media. Soc. Media Soc. 2018, 4, 2056305118797724. [Google Scholar] [CrossRef] [Green Version]
  11. Saura, J.R.; Palos-Sanchez, P.; Grilo, A. Detecting Indicators for Startup Business Success: Sentiment Analysis Using Text Data Mining. Sustainability 2019, 11, 917. [Google Scholar] [CrossRef]
  12. Kim, E.-G.; Chun, S.-H. Analyzing Online Car Reviews Using Text Mining. Sustainability 2019, 11, 1611. [Google Scholar] [CrossRef]
  13. Morente-Molinera, J.; Kou, G.; Pang, C.; Cabrerizo, F.; Herrera-Viedma, E. An automatic procedure to create fuzzy ontologies from users’ opinions using sentiment analysis procedures and multi-granular fuzzy linguistic modelling methods. Inf. Sci. 2019, 476, 222–238. [Google Scholar] [CrossRef]
  14. Goswami, S.; Nandi, S.; Chatterjee, S. Sentiment Analysis Based Potential Customer Base Identification in Social Media. In Contemporary Advances in Innovative and Applicable Information Technology; Advances in Intelligent Systems and Computing; Mandal, J., Sinha, D., Bandopadhyay, J., Eds.; Springer: Singapore, 2019; Volume 812. [Google Scholar] [CrossRef]
  15. Kumar, S.; Yadava, M.; Roy, P.P. Fusion of EEG response and sentiment analysis of products review to predict customer satisfaction. Inf. Fusion 2019, 52, 41–52. [Google Scholar] [CrossRef]
  16. Sun, Q.; Niu, J.; Yao, Z.; Yan, H. Exploring eWOM in online customer reviews: Sentiment analysis at a fine-grained level. Eng. Appl. Artif. Intell. 2019, 81, 68–78. [Google Scholar] [CrossRef]
  17. Joseph, G.; Varghese, V. Analyzing Airbnb Customer Experience Feedback Using Text Mining. In Big Data and Innovation in Tourism, Travel, and Hospitality; Sigala, M., Rahimi, R., Thelwall, M., Eds.; Springer: Singapore, 2019. [Google Scholar]
  18. Ibrahim, N.F.; Wang, X. Decoding the sentiment dynamics of online retailing customers: Time series analysis of social media. Comput. Hum. Behav. 2019, 96, 32–45. [Google Scholar] [CrossRef] [Green Version]
  19. Wang, C.H.; Fan, K.C.; Wang, C.J.; Tsai, M.F. UGSD: User Generated Sentiment Dictionaries from Online Customer Reviews. 2019. Available online: https://www.aaai.org/Papers/AAAI/2019/AAAI-WangC.3191.pdf (accessed on 14 April 2019).
  20. Madan, D.; Jobanputra, M.; Shah, H.; Rathod, S. COMM-AN Opinion Mining of Customer Feedback. In Proceedings of the 2nd International Conference on Advances in Science & Technology (ICAST-2019), Maharashtra, India, 9 April 2019; Available online: https://ssrn.com/abstract=3368898 (accessed on 10 May 2019).
  21. Gunasekar, S.; Sudhakar, S. Does hotel attributes impact customer satisfaction: A sentiment analysis of online reviews. J. Glob. Sch. Mark. Sci. 2019, 29, 180–195. [Google Scholar] [CrossRef]
  22. McColl-Kennedy, J.R.; Zaki, M.; Lemon, K.N.; Urmetzer, F.; Neely, A. Gaining customer experience insights that matter. J. Serv. Res. 2019, 22, 8–26. [Google Scholar] [CrossRef]
  23. He, W.; Zhang, W.; Tian, X.; Tao, R.; Akula, V. Identifying customer knowledge on social media through data analytics. J. Enterp. Inf. Manag. 2019, 32, 152–169. [Google Scholar] [CrossRef]
  24. Yang, B.; Liu, Y.; Liang, Y.; Tang, M. Exploiting user experience from online customer reviews for product design. Int. J. Inf. Manag. 2019, 46, 173–186. [Google Scholar] [CrossRef]
  25. Can, U.; Alatas, B. Big Social Network Data and Sustainable Economic Development. Sustainability 2017, 9, 2027. [Google Scholar] [CrossRef]
  26. Colliander, J.; Dahlén, M. Following the fashionable friend: The power of social media. J. Advert. Res. 2011, 51, 313–320. [Google Scholar] [CrossRef]
  27. Curras-Perez, R.; Ruiz-Mafe, C.; Sanz-Blas, S. Determinants of user behavior and recommendation in social networks: An integrative approach from the uses and gratifications perspective. Ind. Manag. Data Syst. 2014, 114, 1477–1498. [Google Scholar] [CrossRef]
  28. Georgescu, M.; Popescul, D. Students in Social Media: Behavior, Expectations and Views. In Proceedings of the International Conference on Informatics in Economy, Cluj-Napoca, Romania, 2–3 June 2016; pp. 84–98. [Google Scholar] [CrossRef]
  29. Kaplan, A.M.; Haenlein, M. Users of the world, unite! The challenges and opportunities of Social Media. Bus. Horiz. 2010, 53, 59–68. [Google Scholar] [CrossRef]
  30. Kornum, N.; Mühlbacher, H. Multi-stakeholder virtual dialogue: Introduction to the special issue. J. Bus. Res. 2013, 66, 1460–1464. [Google Scholar] [CrossRef]
  31. Casteleyn, J.; Mottart, A.; Rutten, K. Forum-How to Use Facebook in your Market Research. Int. J. Mark. Res. 2009, 51, 439–447. [Google Scholar]
  32. Hyllegard, K.H.; Ogle, J.P.; Yan, R.; Reitz, A.R. An exploratory study of college students’ fanning behavior on Facebook. Coll. Stud. 2011, 45, 601–616. [Google Scholar]
  33. Safko, L.; Brake, D. The Social Media Bible: Tactics, Tools, and Strategies for Business Success; John Wiley & Sons: Hoboken, NJ, USA, 2009. [Google Scholar]
  34. Felix, R.; Rauschnabel, P.; Hinsch, C. Elements of strategic social media marketing: A holistic framework. J. Bus. Res. 2016. [Google Scholar] [CrossRef]
  35. Acker, O.; Gröne, F.; Akkad, F.; Pötscher, F.; Yazbek, R. Social CRM: How companies can link into the social web of consumers. J. Direct Data Digit. Mark. Pract. 2011, 13, 3–10. [Google Scholar] [CrossRef] [Green Version]
  36. Kietzmann, J.H.; Hermkens, K.; McCarthy, I.P.; Silvestre, B.S. Social media? Get serious! Understanding the functional building blocks of social media. Bus. Horiz. 2011, 54, 241–251. [Google Scholar] [CrossRef] [Green Version]
  37. Rodriguez, M.; Peterson, R.M.; Krishnan, V. Social Media’s influence on business-to-business sales Performance. J. Pers. Sell. Sales Manag. 2012, 32, 365–378. [Google Scholar] [CrossRef]
  38. Belch, G.E.; Belch, M.A. Advertising and Promotion: An Integrated Marketing Communications Perspective, 11th ed.; McGraw-Hill Education: New York, NY, USA, 2017; pp. 567–589. [Google Scholar]
  39. Cui, G.; Lui, H.-K.; Guo, X. The Effect of Online Consumer Reviews on New Product Sales. Int. J. Electron. Commer. 2012, 17, 39–58. [Google Scholar] [CrossRef]
  40. Genc-Nayebi, N.; Abran, A. A systematic literature review: Opinion mining studies from mobile app store user reviews. J. Syst. Softw. 2017, 125, 207–219. [Google Scholar] [CrossRef]
  41. Mohammad, S.M.; Turney, P.D. Emotions evoked by common words and phrases: Using Mechanical Turk to create an emotion lexicon. In Proceedings of the NAACL HLT 2010 Workshop on Computational Approaches to Analysis and Generation of Emotion in Text, Los Angeles, CA, USA, 5 June 2010; pp. 26–34. [Google Scholar]
  42. Trainor, K.J. Relating Social Media Technologies to Performance: A Capabilities-Based Perspective. J. Pers. Sell. Sales Manag. 2012, 32, 317–331. [Google Scholar] [CrossRef]
  43. Carp, M.; Păvăloaia, L.; Afrăsinei, M.-B.; Georgescu, I.E. Is Sustainability Reporting a Business Strategy for Firm’s Growth? Empirical Study on the Romanian Capital Market. Sustainability 2019, 11, 658. [Google Scholar] [CrossRef]
  44. Pozzi, F.A.; Fersini, E.; Messina, E.; Liu, B. Beyond Sentiment: How Social Network Analytics Can Enhance Opinion Mining and Sentiment Analysis. In Sentiment Analysis in Social Networks, 1st ed.; Morgan Kaufmann Publishers Inc.: Los Angeles, CA, USA, 2016. [Google Scholar]
  45. Coskun, M.; Ozturan, M. #europehappinessmap: A Framework for Multi-Lingual Sentiment Analysis via Social Media Big Data (A Twitter Case Study). Information 2018, 9, 102. [Google Scholar]
  46. Carrera, B.; Jung, J.-Y. SentiFlow: An Information Diffusion Process Discovery Based on Topic and Sentiment from Online Social Networks. Sustainability 2018, 10, 2731. [Google Scholar] [CrossRef]
  47. Gamal, D.; Alfonse, M.; M El-Horbaty, E.S.; M Salem, A.B. Analysis of Machine Learning Algorithms for Opinion Mining in Different Domains. Mach. Learn. Knowl. Extr. 2019, 1, 224–234. [Google Scholar] [CrossRef]
  48. Sobhani, P.; Inkpen, D.; Zhu, X. Exploring deep neural networks for multitarget stance detection. Comput. Intell. 2019, 35, 82–97. [Google Scholar] [CrossRef]
  49. Ju, S.; Li, S.; Su, Y.; Zhou, G.; Hong, Y.; Li, X. Dual word and document seed selection for semi-supervised sentiment classification. In Proceedings of the 21st ACM International Conference on Information and Knowledge Management, Maui, HI, USA, 29 October–2 November 2012; pp. 2295–2298. [Google Scholar] [CrossRef]
  50. Zhu, Z.; Dai, D.; Ding, Y.; Qian, J.; Li, S. Employing emotion keywords to improve cross-domain sentiment classification. In Workshop on Chinese Lexical Semantics; Springer: Berlin/Heidelberg, Germany, 2012; pp. 64–71. [Google Scholar]
  51. Medhat, W.; Hassan, A.; Korashy, H. Sentiment analysis algorithms and applications: A survey. Ain Shams Eng. J. 2014, 5, 1093–1113. [Google Scholar] [CrossRef] [Green Version]
  52. Lu, Y.; Castellanos, M.; Dayal, U.; Zhai, C. Automatic construction of a context-aware sentiment lexicon: An optimization approach. In Proceedings of the 20th International Conference on World Wide Web, Hyderabad, India, 28 March–1 April 2011; pp. 347–356. [Google Scholar] [CrossRef]
  53. Fotache, M.; Strimbei, C. SQL and Data Analysis. Some Implications for Data Analysits and Higher Education. Procedia Econ. Financ. 2015, 20, 243–251. [Google Scholar] [CrossRef] [Green Version]
  54. Statista. Most Popular Social Networks Worldwide as of July 2019, Ranked by Number of Active Users. Available online: https://www.statista.com/statistics/272014/global-social-networks-ranked-by-number-of-users/ (accessed on 22 July 2019).
  55. Fanpage Karma. The Allround—Tool for Strong Social-Media Management. Available online: http://www.fanpagekarma.com/ (accessed on 18 June 2018).
  56. Laghate, G. Shadow of bot followers and fake likes mars social media influencers. The Economic Times. 21 June 2018. Available online: https://economictimes.indiatimes.com/articleshow/64674668.cms?utm_source=contentofinterest&utm_medium=text&utm_campaign=cppst (accessed on 17 August 2019).
  57. Edwards, J. A Flaw in Facebook Lets Anyone Create as Many Fake ‘Likes’ as They Want without Using a Bot Army. Business Insider. 25 March 2015. Available online: https://www.businessinsider.com/how-fake-facebook-likes-are-created-2015-3 (accessed on 11 June 2019).
  58. Keith, K. AG Letitia James: Selling Fake Social Media Engagement is Illegal. New York Post. 31 January 2019. Available online: https://nypost.com/2019/01/31/ag-letitia-james-selling-fake-social-media-engagement-is-illegal/ (accessed on 22 July 2019).
  59. Stempel, J. New York Settles with Sellers of ‘Fake’ Online Followers, ‘Likes’. Reuters. 31 January 2019. Available online: https://www.reuters.com/article/us-new-york-socialmedia-settlement/new-york-settles-with-sellers-of-fake-online-followers-likes-idUSKCN1PP01O (accessed on 21 July 2019).
Figure 1. Top searched words organic versus paid searches; Source: SimilarWeb analysis.
Sustainability 11 04459 g001
Figure 2. Research methodology.
Sustainability 11 04459 g002
Figure 3. The classification of key performance indicators (KPIs).
Sustainability 11 04459 g003
Figure 4. The highlighted features in the analyzed text.
Sustainability 11 04459 g004
Figure 5. Cumulative histogram charts displaying the sentiment distribution on each of the six social network pages for Coca-Cola and PepsiCo official channels.
Sustainability 11 04459 g005
Figure 6. An example of post classification by its valence.
Sustainability 11 04459 g006
Figure 7. Mosaic plot representations for sentiment analysis (SA) for photo and video posts of Facebook, Instagram and Twitter platforms.
Sustainability 11 04459 g007aSustainability 11 04459 g007b
Figure 8. Mosaic plot for SA of photo and video posts on Pinterest, Google+ and Youtube platforms.
Sustainability 11 04459 g008
Table 1. Similar articles published in 2019 using the key-words, sentiment analysis (SA) and customer.
Research Objectives of the StudyCRD * AnalyzedR **
Identifies key factors in User Generated Content on Twitter for the creation of successful startups.SM User Content[11]
Examines consumer reviews of three different competitive automobile brands and analyzes the advantages and disadvantages of each vehicle using TM *** and association rule methods.Customer reviews[12]
A novel method that uses SA procedures in order to automatically create fuzzy ontologies from free texts provided by users on SM.SM User Content[13]
Addresses the issue of SM domain by identifying the potential customer base for advertisement activities.SM User Content[14]
Prediction of customer satisfaction has been proposed using fusion of EEG and sentiments.Customer reviews[15]
Develop a fine-grained SA supervised by semantic knowledge, context sensitive sentiments are extracted from online customer reviews.Customer reviews[16]
A case of TM on Airbnb user reviews to analyze and understand various aspects that drive customer satisfaction.Customer reviews[17]
Explore and decode the sentiment dynamics of Twitter users regarding online retailing brands.Customer reviews[18]
Leverage the relationship between user-generated reviews and the ratings of the reviews to associate the reviewer sentiment with certain entities.Customer reviews[19]
Classify all reviews and comments of customers to extract most popular category, theme and feature.Customer reviews[20]
Identify hotel attributes that contribute to customer satisfaction or dissatisfaction using online reviews for hotels in India.Customer reviews[21]
A guide for implementing the TM approach highlighting 6 key insights practitioners need in order to manage their customers’ journey.Customer interview[22]
TM and SA techniques used to analyze the SM data set and to visualize relevant insights and patterns in order to identify customer knowledge.SM User Content[23]
The discovery of valuable user experience data, and their relations to product design and business strategic planning by analyzing a large volume of customer online data.Customer reviews[24]
* CRD—Customer related data; ** R—Reference; *** TM—Text mining.
Table 2. Testing the type of post (photos or videos) influence on the Facebook and Instagram user’s reactions.
Facebook Page for the Company:Instagram Page for the Company:
@CocaColaCo@PepsiCo@CocaColaCo@PepsiCo
Stat. testStudent test
(P value)
Wilcoxon test
(P value)
Student test
(P value)
Wilcoxon test
(P value)
Student test
(P value)
Wilcoxon test
(P value)
Student test
(P value)
Wilcoxon test
(P value)
Reactions
Likes2.9998 (0.0037 ***)108 (0.001 ***)2.1537 (0.0357 **)150 (0.044 **)2.4305 (0.0028 **)128 (0.019 **)0.17804 (0.8754)150 (0.044 **)
Comments3.883 (0.0303 **)142 (0.044 **)0.3458 (0.730)146 (0.030 **)3.2365 (0.0245 **)135 (0.001 ***)0.27735 (0.0363 **)151 (0.01 **)
Distributions2.045 (0.0172 **)127 (0.011 **)0.1234 (0.902)115 (0.001 ***)----
Stat. testChisq testP valueChisq testP valueChisq testP valueChisq testP value
Variable
Sentiment categories3.68130.0458 **0.42190.0191 **3.73100.0474 **2.0000.036 **
* P-value < 0.1, ** P-value < 0.05, *** P-value < 0.001.
Table 3. Testing the type of post (photos or videos) influence on the Pinterest and Twitter user’s reactions.
Pinterest Page for the Company:Twitter Page for the Company:
@CocaColaCo@PepsiCo@CocaColaCo@PepsiCo
Stat. testStudent test
(P value)
Wilcoxon test
(P value)
Student test
(P value)
Wilcoxon test
(P value)
Student test
(P value)
Wilcoxon test
(P value)
Student test
(P value)
Wilcoxon test
(P value)
Reactions
RePins1.039 (0.0315 **)144 (0.0142 **)1.980 (0.0127 **)42.5 (0.8341)----
Comments3.883 (0.0303 **)128 (0.032 **)0.3457 (0.7303)183 (0.262)----
Likes----1.1248 (0.0232 **)201 (0.049 **)1.893 (0.0163 **)195 (0.963)
Retweets----3.883 (0.0303 **)128 (0.032 **)0.3457 (0.7303)183 (0.262)
Stat. testChisq testP valueChisq testP valueChisq testP valueChisq testP value
Variable
Sentiment categories2.21540.0251 **1.81960.0163 **1.2620.0268 **1.2610.0213 **
* P-value < 0.1, ** P-value < 0.05, *** P-value < 0.001.
Table 4. Testing the type of post (photos or videos) influence on the Youtube and Google+ user reactions.
Youtube Page for the Company:Google+ Page for the Company:
@CocaColaCo@PepsiCo@CocaColaCo@PepsiCo
Stat. testStudent test
(P value)
Wilcoxon test
(P value)
Student test
(P value)
Wilcoxon test
(P value)
Student test
(P value)
Wilcoxon test
(P value)
Student test
(P value)
Wilcoxon test
(P value)
Reactions
Distributions----3.373 (0.0470 **)117 (0.0145)2.172 (0.042 **)159 (0.0143)
Comments1.0658 (0.0161 **)163 (0.048)2.887 (0.0203 **)123 (0.0362)2.692 (0.04 **)170 (0.0187)3.883 (0.0252 **)113 (0.028)
Views2.127 (0.0162 **)141 (0.0034)3.211 (0.0072 **)236 (0.0011)----
Stat. testChisq testP valueChisq testP valueChisq testP valueChisq testP value
Variable
Sentiment categories3.12030.0103 **2.98650.0278 **4.45450.0348 **3.9090.0105 **
* P-value < 0.1, ** P-value < 0.05, *** P-value < 0.001.
Table 5. Shares of sentiment analysis on social media (SM) platforms.
@CocaColaCo@PepsiCo@CocaColaCo@PepsiCo
SentimentsPositivePositiveNegativeNegative
SM platform
Facebook89%84%11%16%
Twitter71%67%29%33%
Instagram84%82%16%18%
Pinterest72%71%28%29%
Youtube63%83%38%17%
Google+61%67%39%33%

