Article

Contrasting Trends of Forest Coverage between the Inland and Coastal Urban Groups of China over the Past Decades

School of Earth Sciences and Engineering, Hohai University, Fochengxi Road 8, Nanjing 211100, China
*
Author to whom correspondence should be addressed.
Sustainability 2019, 11(16), 4451; https://doi.org/10.3390/su11164451
Submission received: 21 July 2019 / Revised: 14 August 2019 / Accepted: 15 August 2019 / Published: 17 August 2019

Abstract

:
China is building forest urban groups through reforestation and afforestation. However, the fast process of urbanization inevitably conflicts with multiple vegetated areas around cities. Hence, it is critical to evaluate the changes in regional vegetation cover and its spatial pattern due to complex natural and anthropogenic factors. Nevertheless, systematic studies to quantify and compare the development of forest urban agglomerations were rarely reported. Based on a remote sensing landcover dataset from 1992 to 2015, this study investigated forest cover changes and the impacts on landscape pattern in several urban groups, and tried to explore their differences between the inland and coastal regions of China. The results showed that over the past 24 years, the forest coverage in the coastal urban agglomerations declined (103 km2/year) while it increased (26 km2/year) in the inland urban agglomerations. There was a certain conflict between forest and cropland for the coastal urban agglomerations where the forest area converted to cropland accounted for 61.9% of the total forest loss. The increase in forests coverage in inland urban agglomerations mainly came from grassland which nearly accounted for 66.47% of the total increase. The landscape diversity has also changed in areas where forests have changed significantly (e.g., Shanghai, Changzhi, and Jincheng).

1. Introduction

As the largest developing country in the world, China is in the stage of rapid urban development, which has caused a drastic spatio-temporal impact on land-use/land-cover (LULC) around cities [1,2]. In addition, land cover changes caused by urbanization can directly affect the ecological landscape pattern around cities. Studies have shown that different land cover types have different biomass, water, and soil conditions and, consequently, land cover changes can affect community structure and landscape structure in the environment [3,4]. Many studies, based on landscape ecology, have focused on the internal structural systems of cities and surrounding areas in the context of rapid urban land cover change, and evaluated the ecological environment.
The landscape pattern is closely related to various processes in the landscape. The study of it has laid an important theoretical foundation for the study of regional ecological security pattern [5,6,7]. Landscape pattern is a concept in landscape ecology, which indicates that a series of landscape elements of different sizes and shapes are formed by nature or man-made. It is a complex interaction of various complex physical, biological, and social factors [8,9,10,11,12]. It helps to clarify changes in ecological effects in land-use change. The landscape pattern index is a commonly used method and tool in current research. Many indices, such as the Shannon diversity index, fragmentation index, and aggregation index, are widely used to quantitatively evaluate the relationship between land cover and regional spatial patterns (such as patch fragmentation, landscape diversity, and spatial aggregation) [13,14,15,16] and the relationship between LUCC and ecological processes [17,18,19,20].
Edurne et al. used several Landsat TM images for different months of 1987 and 2010 to assess the forest cover change of the Natural Natural Park (Spain) based on remote sensing and landscape metrics. The results showed that the change of forest cover in the region leaded to the increase of landscape fragmentation, and they believed that the spatial and temporal changes of tree species distribution in forests were closely related to the landscape structure [21]. Fabio Recanatesi used aerial photographs from 1930 and 2010 to analyze the changes in land cover and landscape patterns around the Castelporziano Nature Reserve over the past 80 years. They found that the land cover categories of the protected areas tend to be dispersed mainly due to the construction of infrastructure, such as roads. Moreover, the degree of landscape fragmentation had increased significantly [22]. Yuan Yi and Shi Peijun analyzed the land cover change pattern under the background of rapid urbanization based on the remote sensing images of 1980, 1988, 1994, and 2000. They believed that the economy and topography are important factors affecting the land cover pattern in the process of urbanization [23]. Wang et al. quantitatively evaluated the impact of urbanization on the vegetation coverage and landscape pattern in the Beijing-Tianjin-Hebei region from 2000 to 2010. They believed that the urbanization process in the Beijing-Tianjin-Hebei region had a negative impact on high vegetation coverage areas, and the higher the vegetation coverage, the higher the level of fragmentation [24].
However, there are still some problems. Firstly, most studies do not use continuous long-term sequence data to study regional changes. It is difficult to fully grasp the important information in the change, and the conclusions obtained have certain limitations. Secondly, many studies pointed out that due to the different economic conditions, natural conditions, and policy influences in different regions, there is also a great difference in the coupling between the different urban regions and their surrounding ecological environment [25,26]. Recently, comparisons of regional land cover changes have rarely been reported.
The spatial pattern of land use reflects the impact of potential anthropogenic processes on the ecological environment [27]. Land cover in urban areas usually contains a large amount of vegetation, especially forests, which play an important role in the ecosystem around the city [28,29]. China’s urbanization process was quick after the 1980s, and at the end of the 20th century, the urbanization showed a trend of accelerating growth [30,31]. The expansion of artificial surface resulted from urbanization process may exert a coercive effect on the ecological environment around the city which, in turn, has a negative impact [32,33]. The forest is an extremely important part of the ecological chain around the city [34], and it has sensitive feedback and response to changes in the surrounding ecological environment. In urban development, forest-based vegetation cover can give full play to its functions of optimizing urban pattern, mitigating heat island effect, coping with climate change, maintaining ecological stability to realize the urban development mode of urban coordination, regional integration and harmonious coexistence of man and nature furthermore. Since 2004, China has begun to build the forest cities and received strong responses. In 2016, China incorporated forest cities development into its national development strategy and implemented it in some regions of China. Among the important construction targets, the Yangtze River Delta and Pearl River Delta urban agglomerations are typical coastal urban agglomerations, and the Guanzhong-Tianshui and Central Plains urban agglomerations are typical inland urban agglomerations. However, due to the great difference in latitude, climate diversity, altitude, economic development, and the interaction of other different policies, the forest cover in the urbanization process showed uneven spatial characteristics. In addition, with the development of cities, urbanization has greatly changed the spatial pattern of land cover due to the different needs for different land resources. It is precisely because of the influence of various complicated factors that we still lack a deep understanding of the differences in land cover and ecological patterns between the two in recent decades. It is also a challenge to quantify the impact of these changes. In order to understand these issues more clearly, this study analyzed the characteristics of forests of different urban agglomerations in inland and coastal areas of China from 1992 to 2015 using remote sensing landcover data. We tried to explore the causes of forest changes in urban areas and assess the changes in landscape patterns in the study area through landscape indices.

2. Materials and Methods
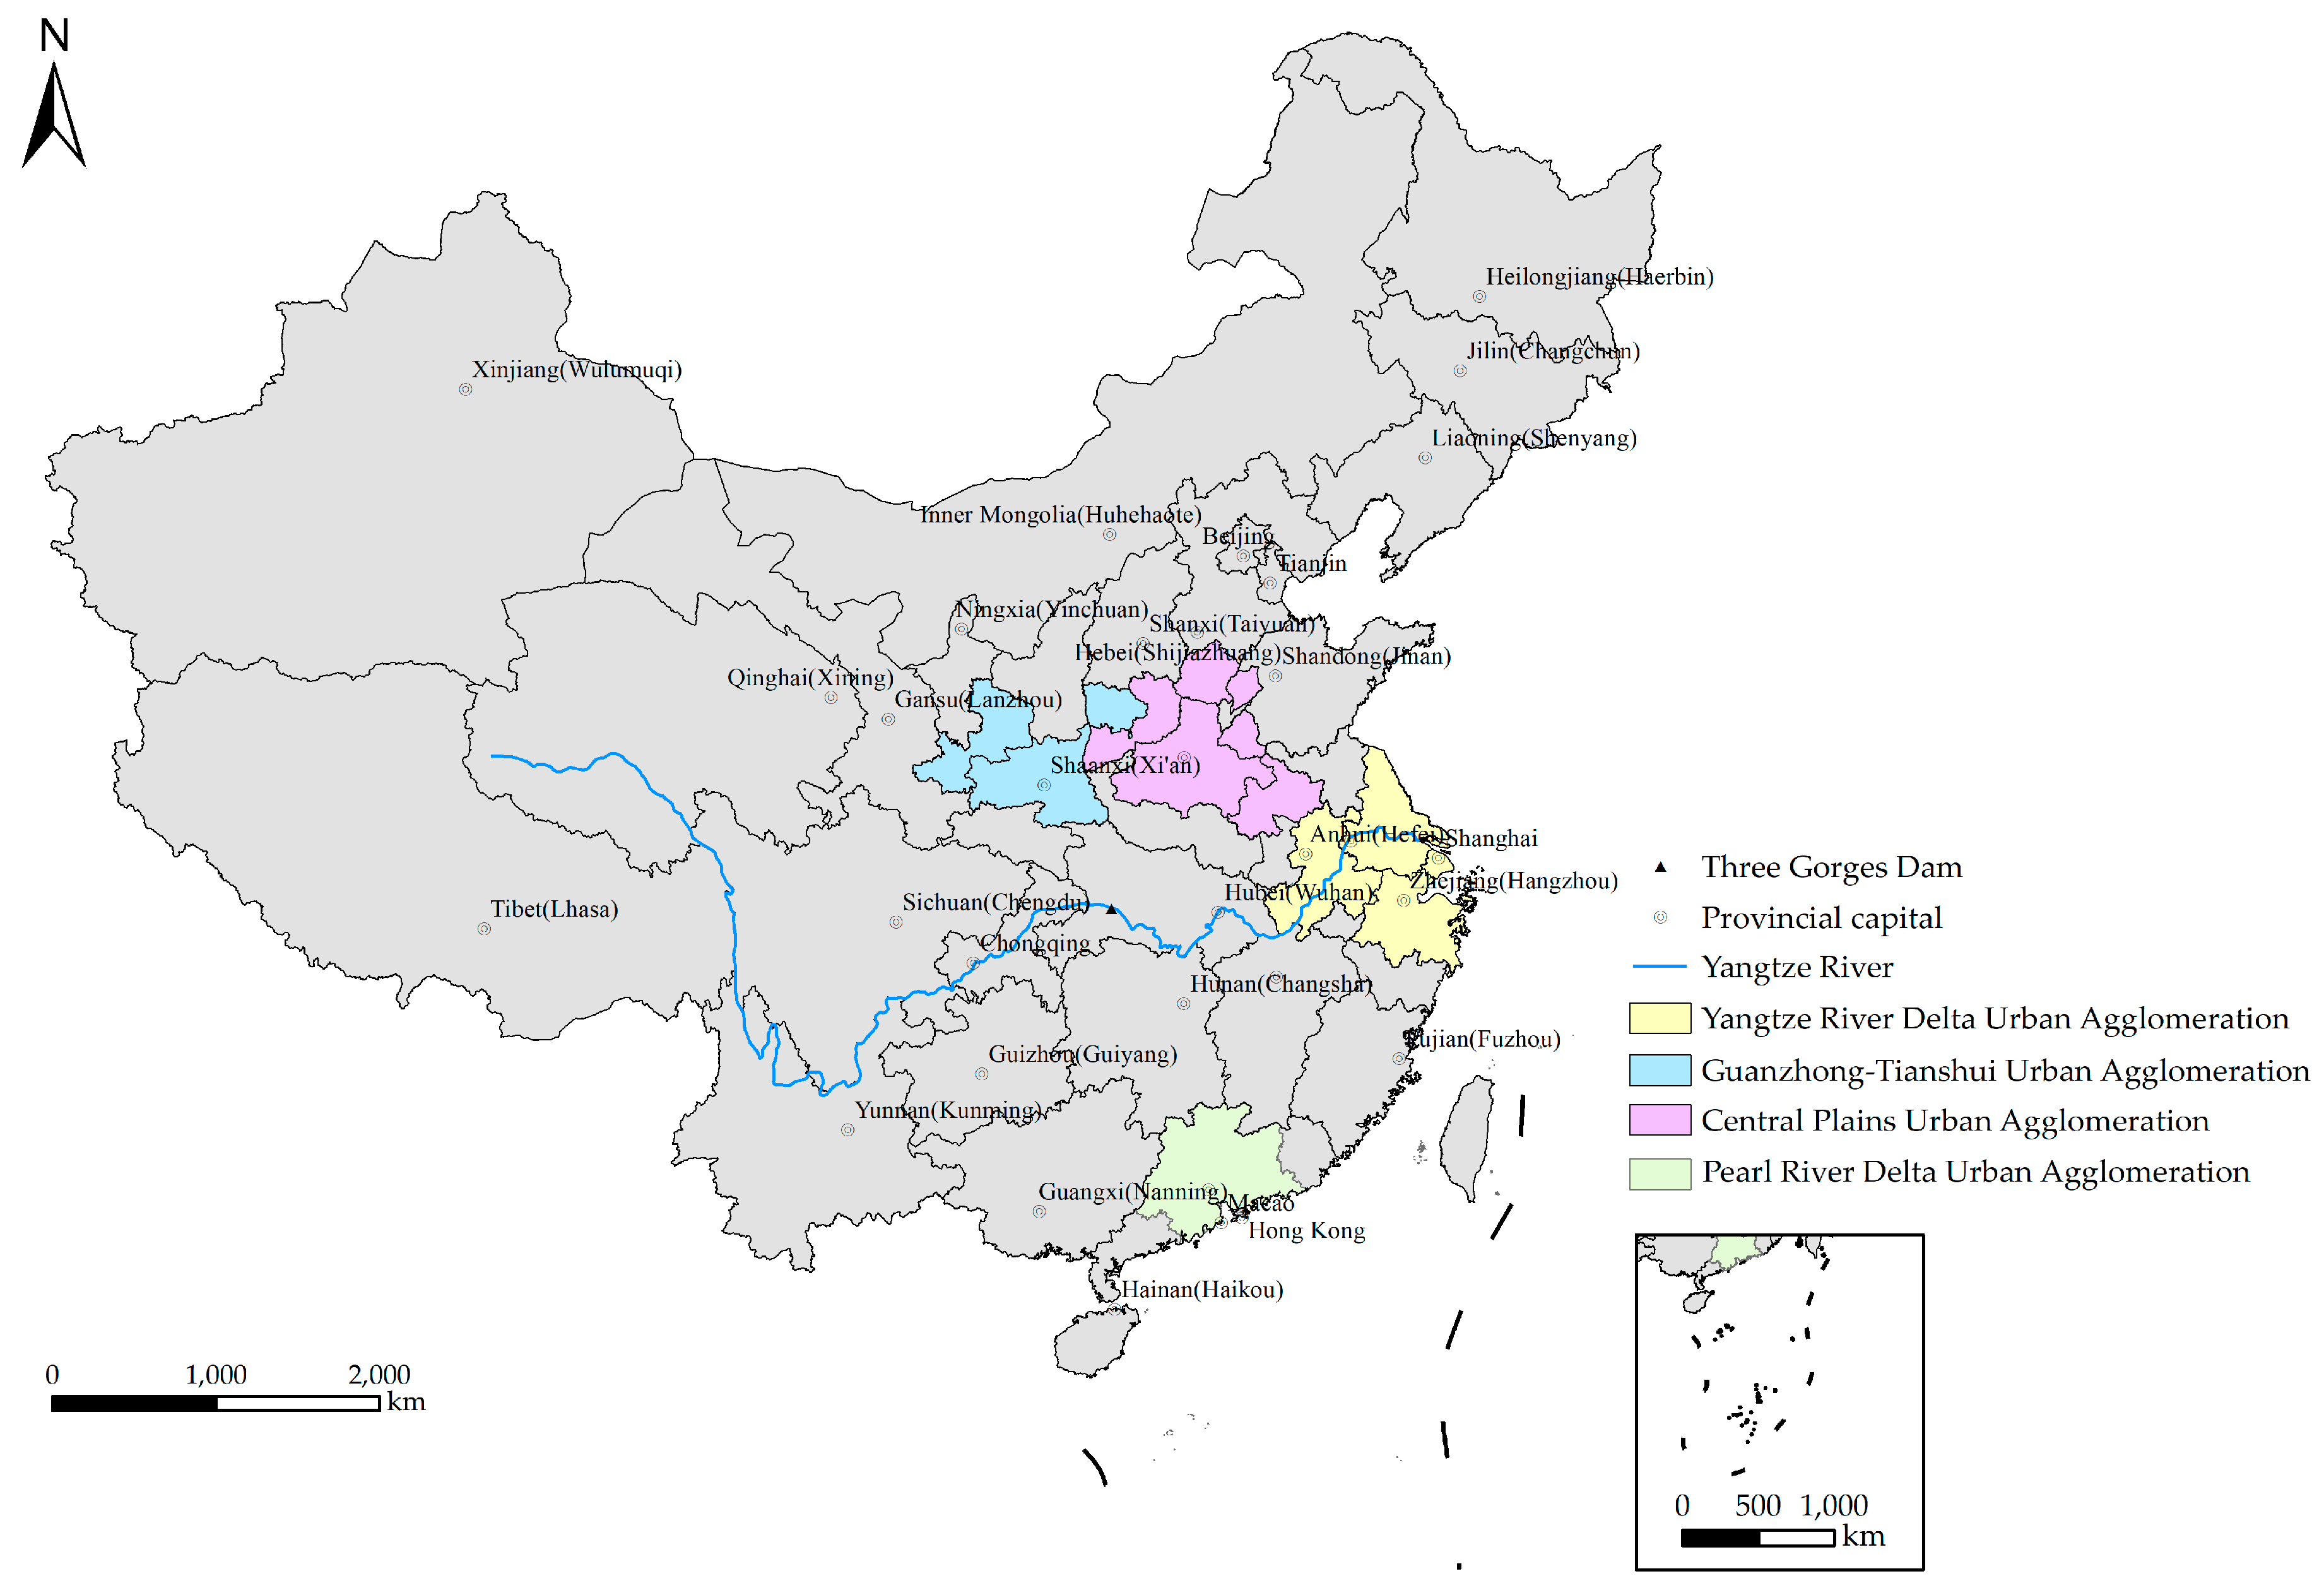
2.1. The Study Area

The Yangtze River Delta urban agglomeration (termed YRDua) (115°45′–122°57′ E, 28°23′–34°29′ N) is located in the middle and lower reaches of the Yangtze River, adjacent to the Yellow Sea and the East China Sea, with an area of 196,600 km2. The urban agglomeration radiates from Shanghai as the center, Nanjing and Hangzhou as the sub-centers, including cities such as Suzhou, Wuxiin Jiangsu Province, Hangzhou and Ningbo in Zhejiang Province and Hefei and Huangshan in Anhui Province. It is subtropical monsoon climate and the landforms are mainly plains and hills. The main vegetation types are the evergreen broad-leaved forest and the evergreen needle-leaved forest. The Pearl River Delta urban agglomeration (termed PRDua) (111°32′–116°6′ E, 21°42′–25°15′ N) is located on the eastern coast of Guangdong Province, adjacent to Hong Kong and Macau (Figure 1), which is composed of nine cities such as Guangzhou, Shenzhen, and Zhuhai. The Pearl River Delta region, with a central pain surrounded by hills and mountains, is characterized by distinct topographical relief. The climate of the region belongs to the subtropical climate, most of which is located south of the Tropic of Cancer; the main vegetation type is the evergreen broad-leaved forest.
The Central Plains urban agglomeration (termed CPua) (110°9′–118°18′ E, 32°24′–37°48′), the core of the Central Plains economic zone, is located in the central transportation hub of China. It includes 30 prefecture-level cities such as Zhengzhou, Henan Province and Changzhi, Shanxi Province and Handan, Hebei Province and Liaocheng of Shandong Province and Huaibei of Anhui Province. The CPua is typical Eastern monsoon climate with mild climate and distinct seasons. Much of its landform is plain, the terrain is flat, and the main vegetation type is the deciduous broad-leaved forest. The Guanzhong-Tianshui urban agglomeration (termed GTua) (104°31′–112°48′ E, 33°09′–37°24′ N) is located in the Guanzhong Plain area of Shaanxi Province (Figure 1), with Xi’an as the central city and Baoji as the sub-central city, including Tianshui, Weinan, Tongchuan, Longnan, and other secondary cities. It is semi-humid and semi-arid climate. From north to south, loess hills, Guanzhong Plain, and Qinling Mountains go across the whole area. The main vegetation type is the deciduous broad-leaved forest.

2.2. ESA CCI Land Cover Data

This paper used the land cover data of ESA CCI production period of 24 years (1992–2015), with a spatial resolution of 300 m. The data came from http://maps.elie.ucl.ac.be/CCI/viewer/download.php [35]. These images divided the land surface into 37 land cover classes based on the United Nations Land Cover Classification System (UN-LCCS). This unique long-term land cover time series was achieved by combining five different global daily surface albedo observation systems with a pixel accuracy of 71.5%. The highest user accuracy values were found for the classes of rainfed cropland, irrigated cropland, broadleaved evergreen forest, urban areas, bare areas, water bodies, and permanent snow and ice [36]. In addition, this paper mainly focused on the proportion of plant functional type (PFT) in qualitative land cover types, so 37 classes of initial ESA CCI data are aggregated into 0.5 × 0.5 resolution and converted into PFT data. The vegetation types of PFT include forest, shrub, farmland, and grassland. Combining with the actual situation in the study area, we calculated the second-level classification under the first-level classification through the transformation function, including 15 s-level categories, as shown in Table 1.

2.3. Land Use Transfer Matrix

In our present work, a transfer matrix method was used to investigate the annual change of land cover pattern during the study period. The land cover transfer matrix uses two land cover images from different periods, taking the pixels whose coordinates in both images are (x, y), and the gray values in the two images are, respectively, G i , G j . All possible gray value combinations ( G i , G j )|i, j = 1…n| in the image are mapped to the position of the corresponding element S i j in the matrix, then count the number of occurrences of all gray value combinations and assign it to S i j . The transfer matrix of land use type change and its quantitative information are obtained. The mathematical expression of the transfer matrix is as follows:
S i j = | S 11 S 12 S 1 n S 21 S 22 S 2 n S 21 S 22 S n n |
where S i j is the number of land cover type i converted into type j in the formula, and S i j 0 .

2.4. Landscape Pattern Index

The Shannon Diversity Index (SHDI) refers to the diversity of landscape elements or ecosystems in terms of structural function and temporal variation. It reflects the complexity of the landscape and the heterogeneity of the landscape, especially sensitive to the uneven distribution of patch types in the landscape.
In order to explain the results, the paper also used some other landscape pattern indices, including the patch density (PD), the landscape shape index (LSI) and the aggregation index (AI). The PD expresses the number of plaques per unit area, which reflects the degree of fragmentation of the landscape to some extent. The AI is calculated based on the common boundary length between patches of the same type of plaque which indicates the non-randomness or degree of aggregation of different plaque types in the landscape. Additionally, the LSI is calculated based on the degree of deviation between the shape of a patch and a circle or square of the same area, reflecting the complexity of the shape of the patch [37,38]. The formula for the four indices is shown in Table 2.
where:
  • i the landcover class
  • p i the proportion of landscape patch types.
  • n i the area of the patch
  • A the total area of landscape.
  • E the boundary length of patches
  • g i i the number of similar adjacent patches for the corresponding landscape type.

2.5. Statistical Analysis Method

(1)
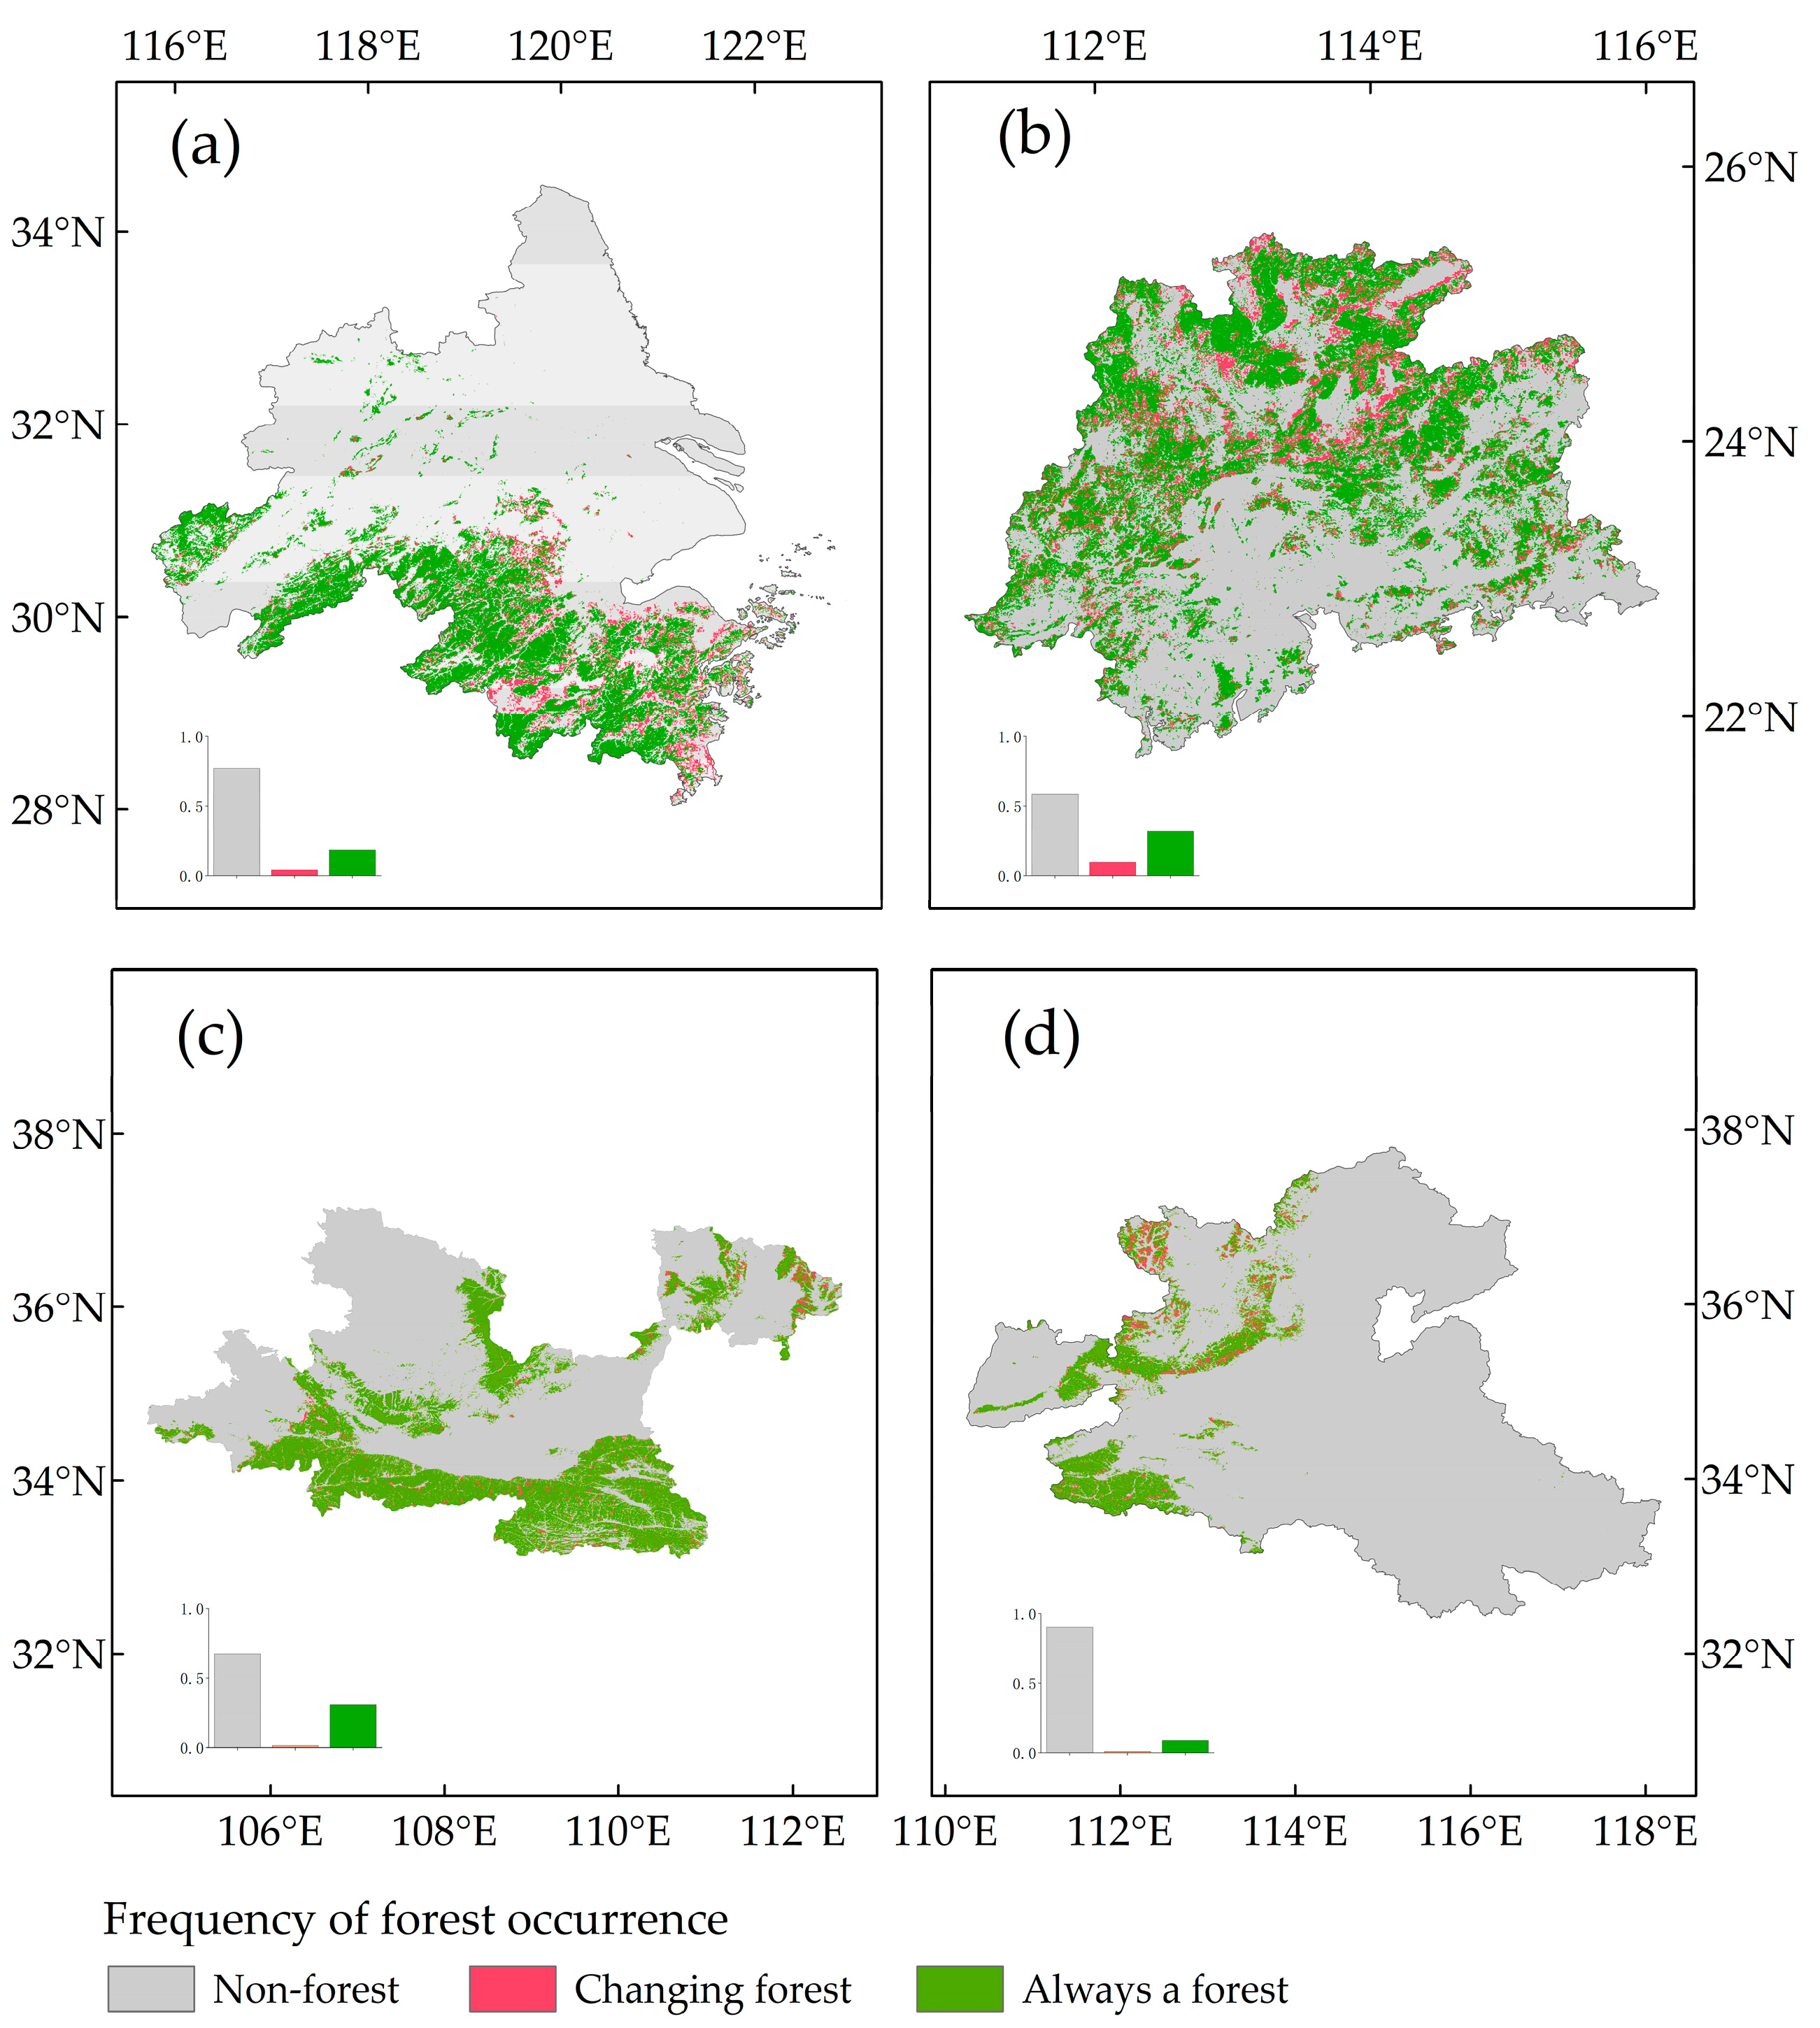
According to the frequency of forest occurrence in the study area during 1992–2015, the non-forest area, the area where the forest appeared but changed, and the area was always forest for the 24 years were obtained.
(2)
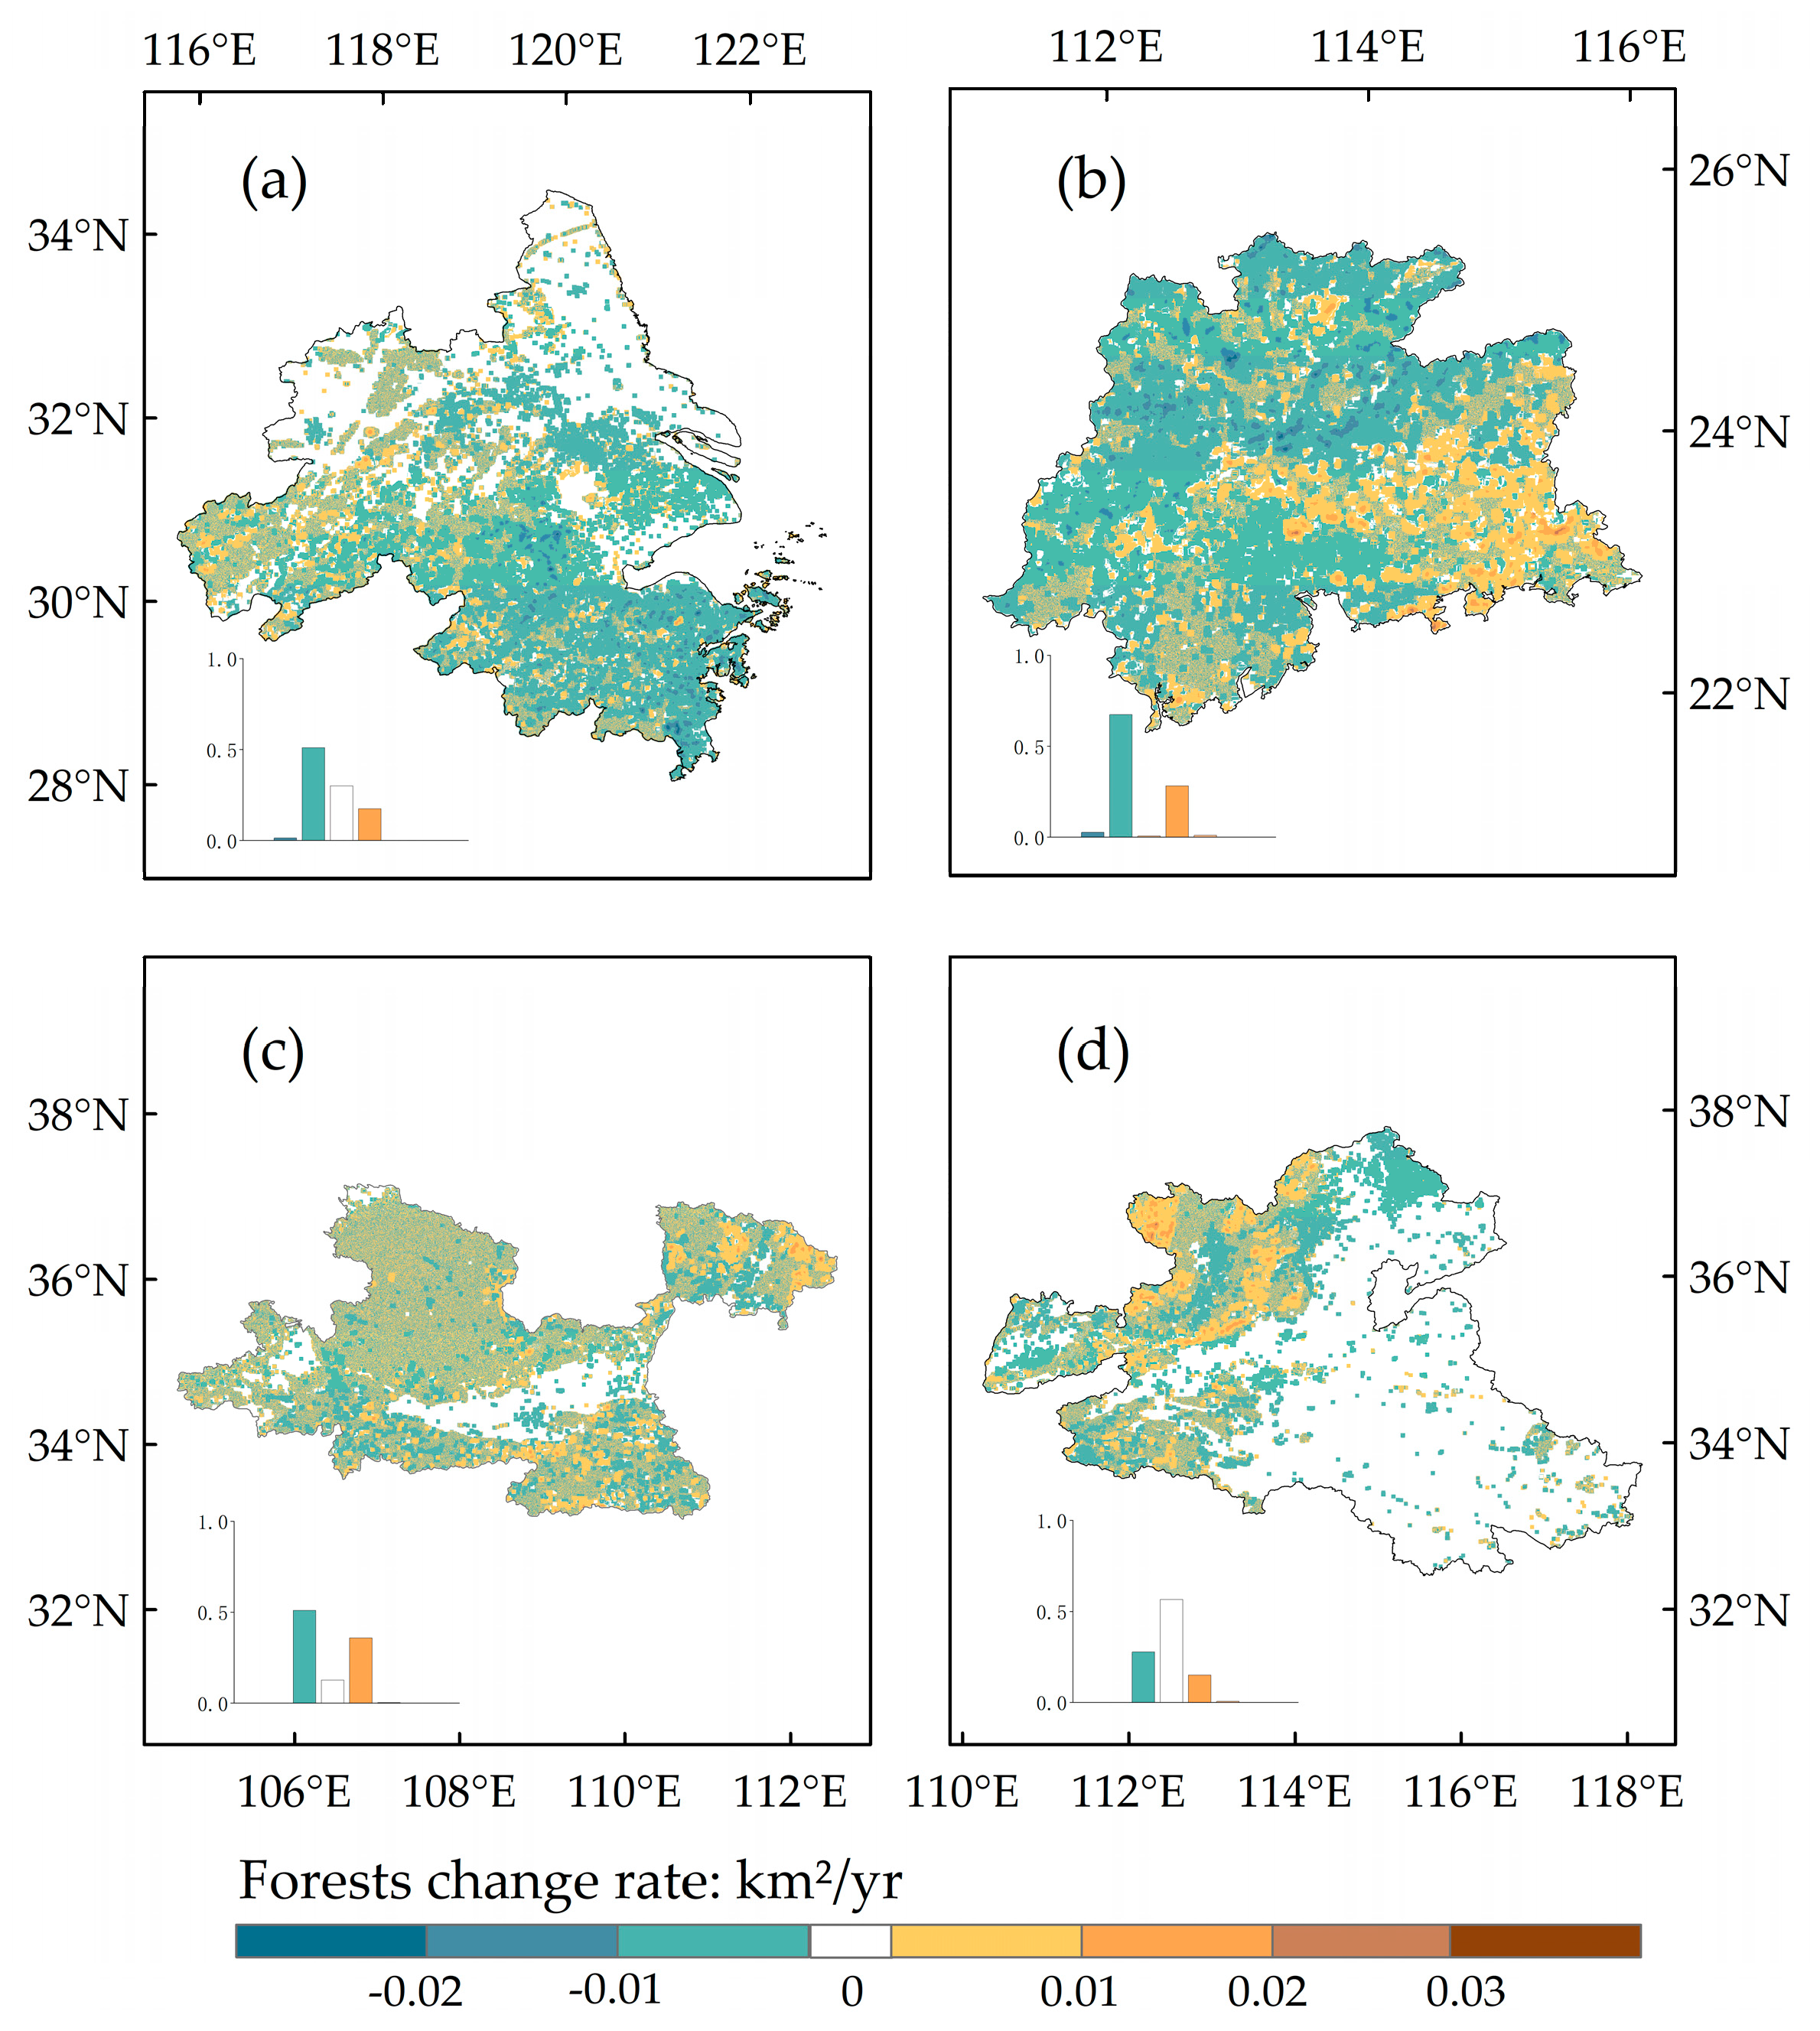
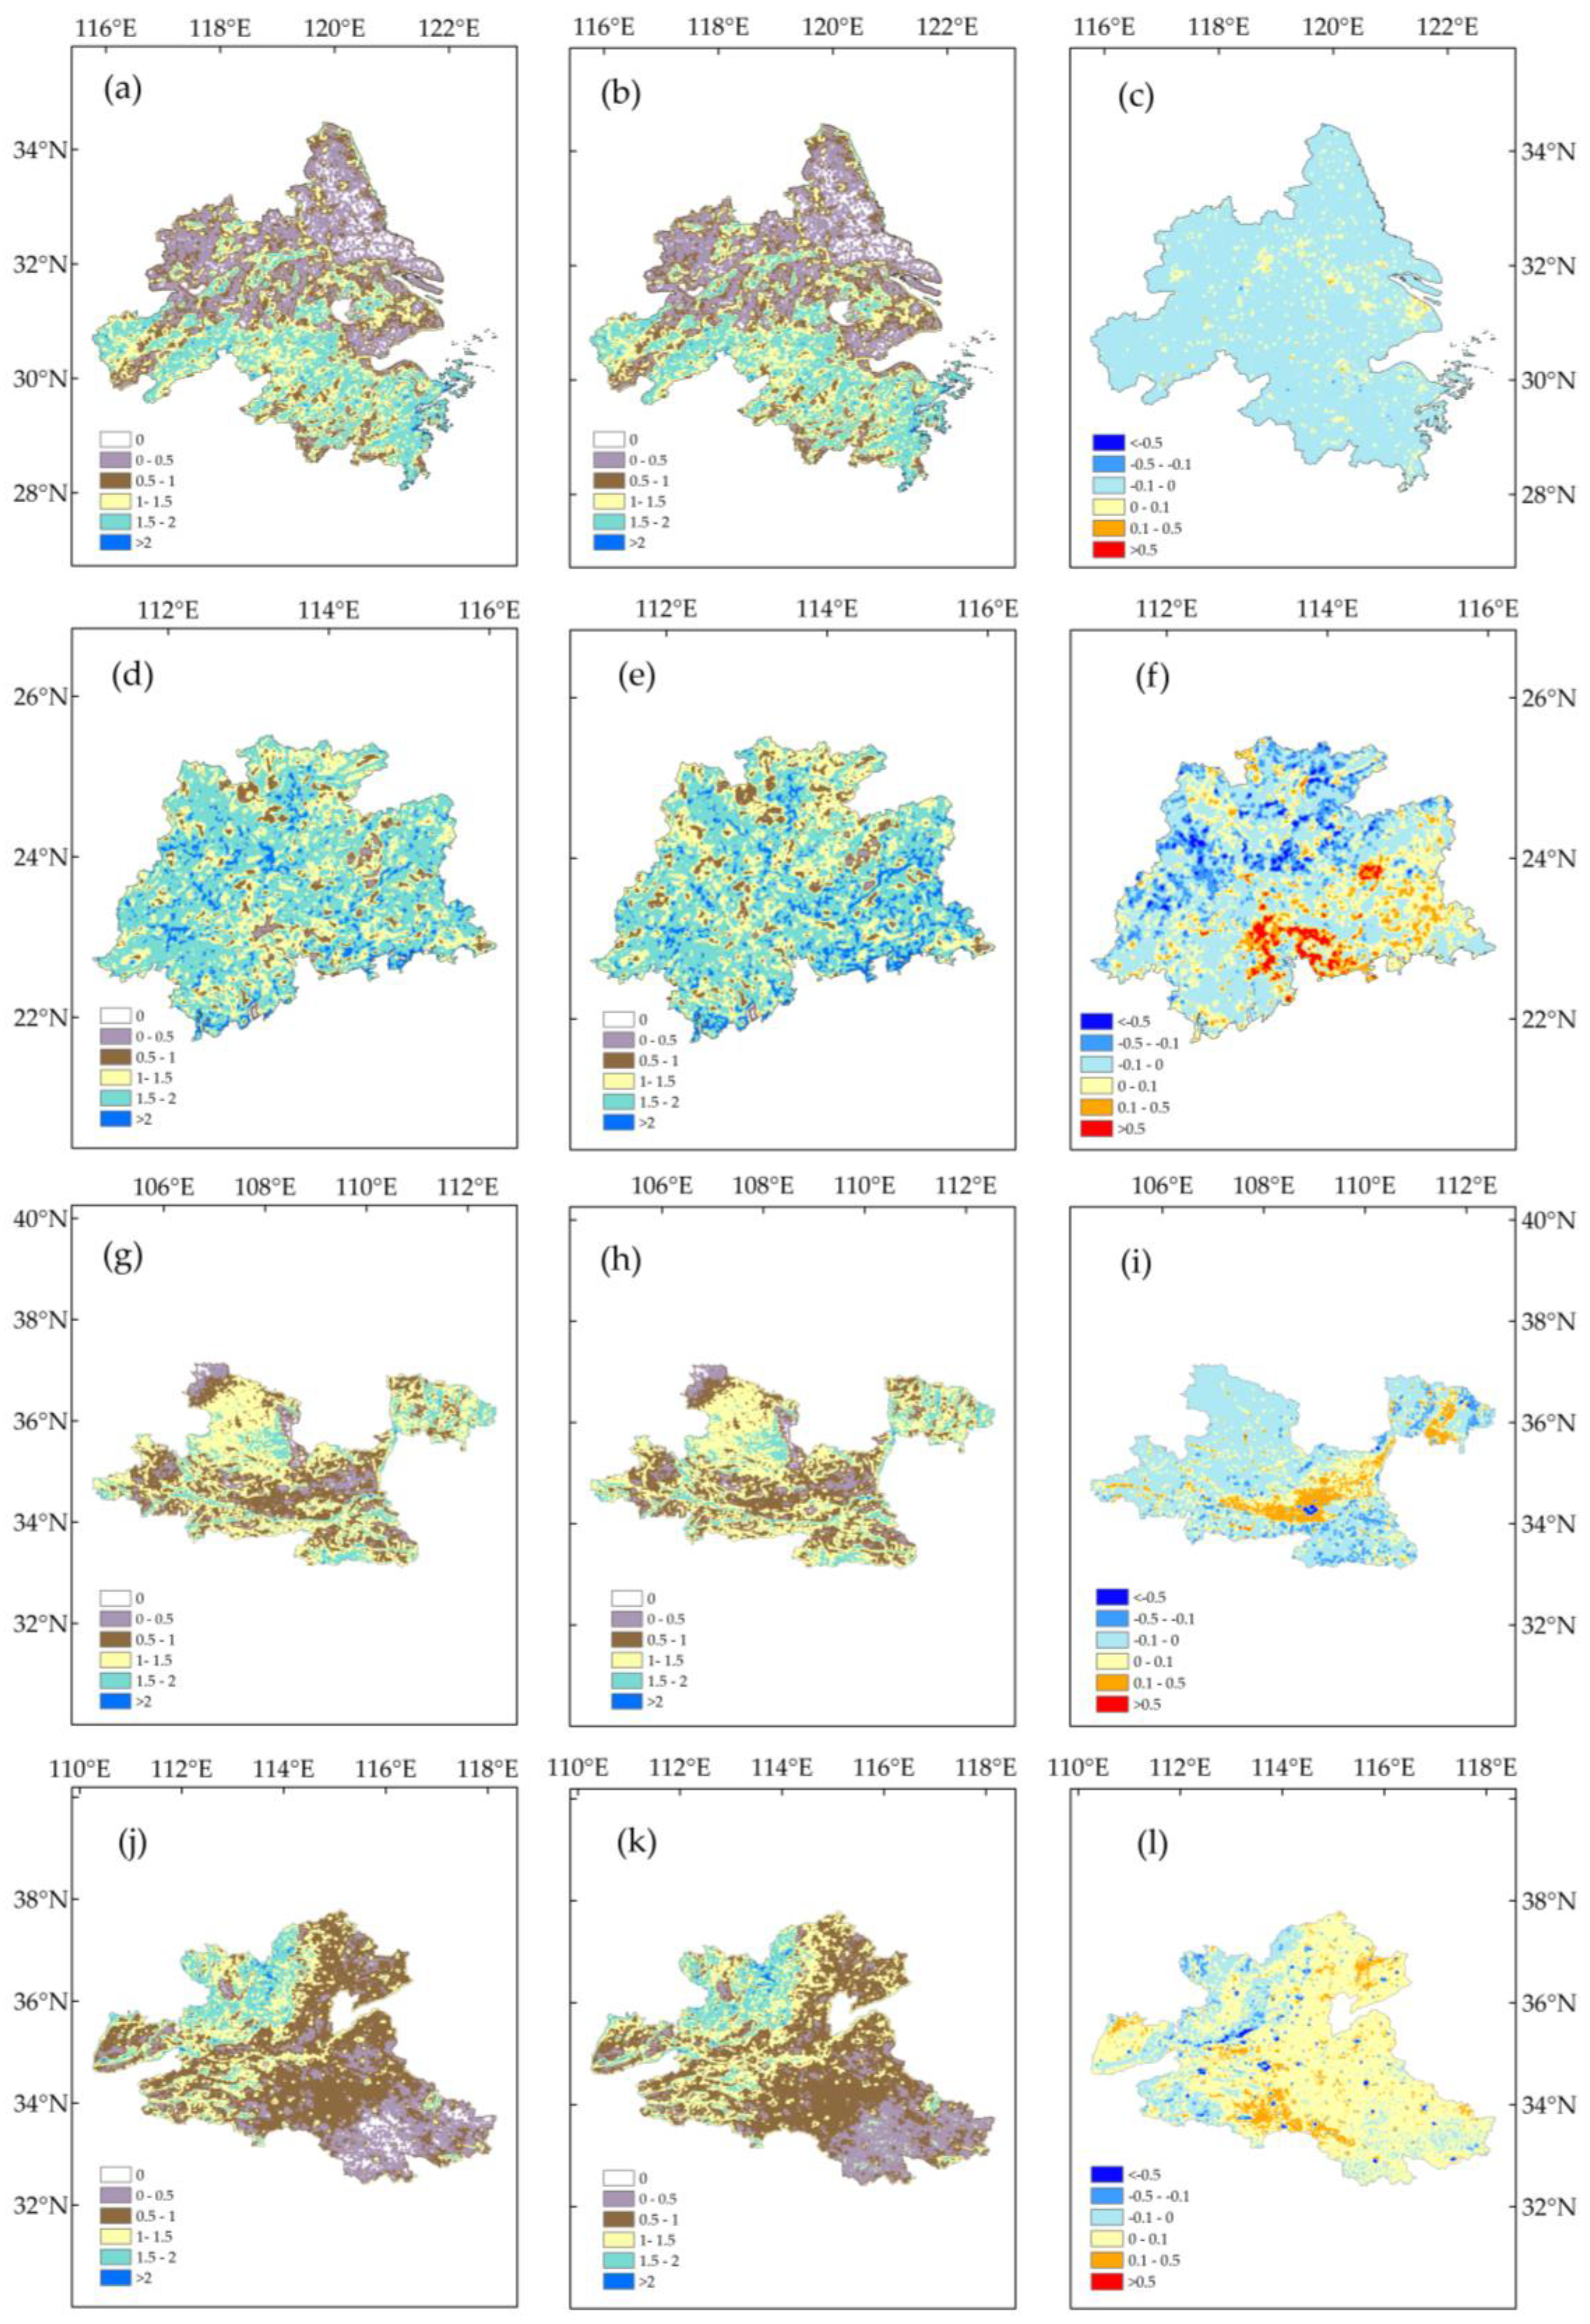
In order to assess the trend of forest cover change in the four different urban agglomerations from 1992 to 2015, the entire area was investigated with a 17 × 17 sliding window, and the 24-year trend of forest coverage in the window was analyzed by least squares method. Hence, a spatially continuous distribution of trends of forest changes over the study area was obtained.
(3)
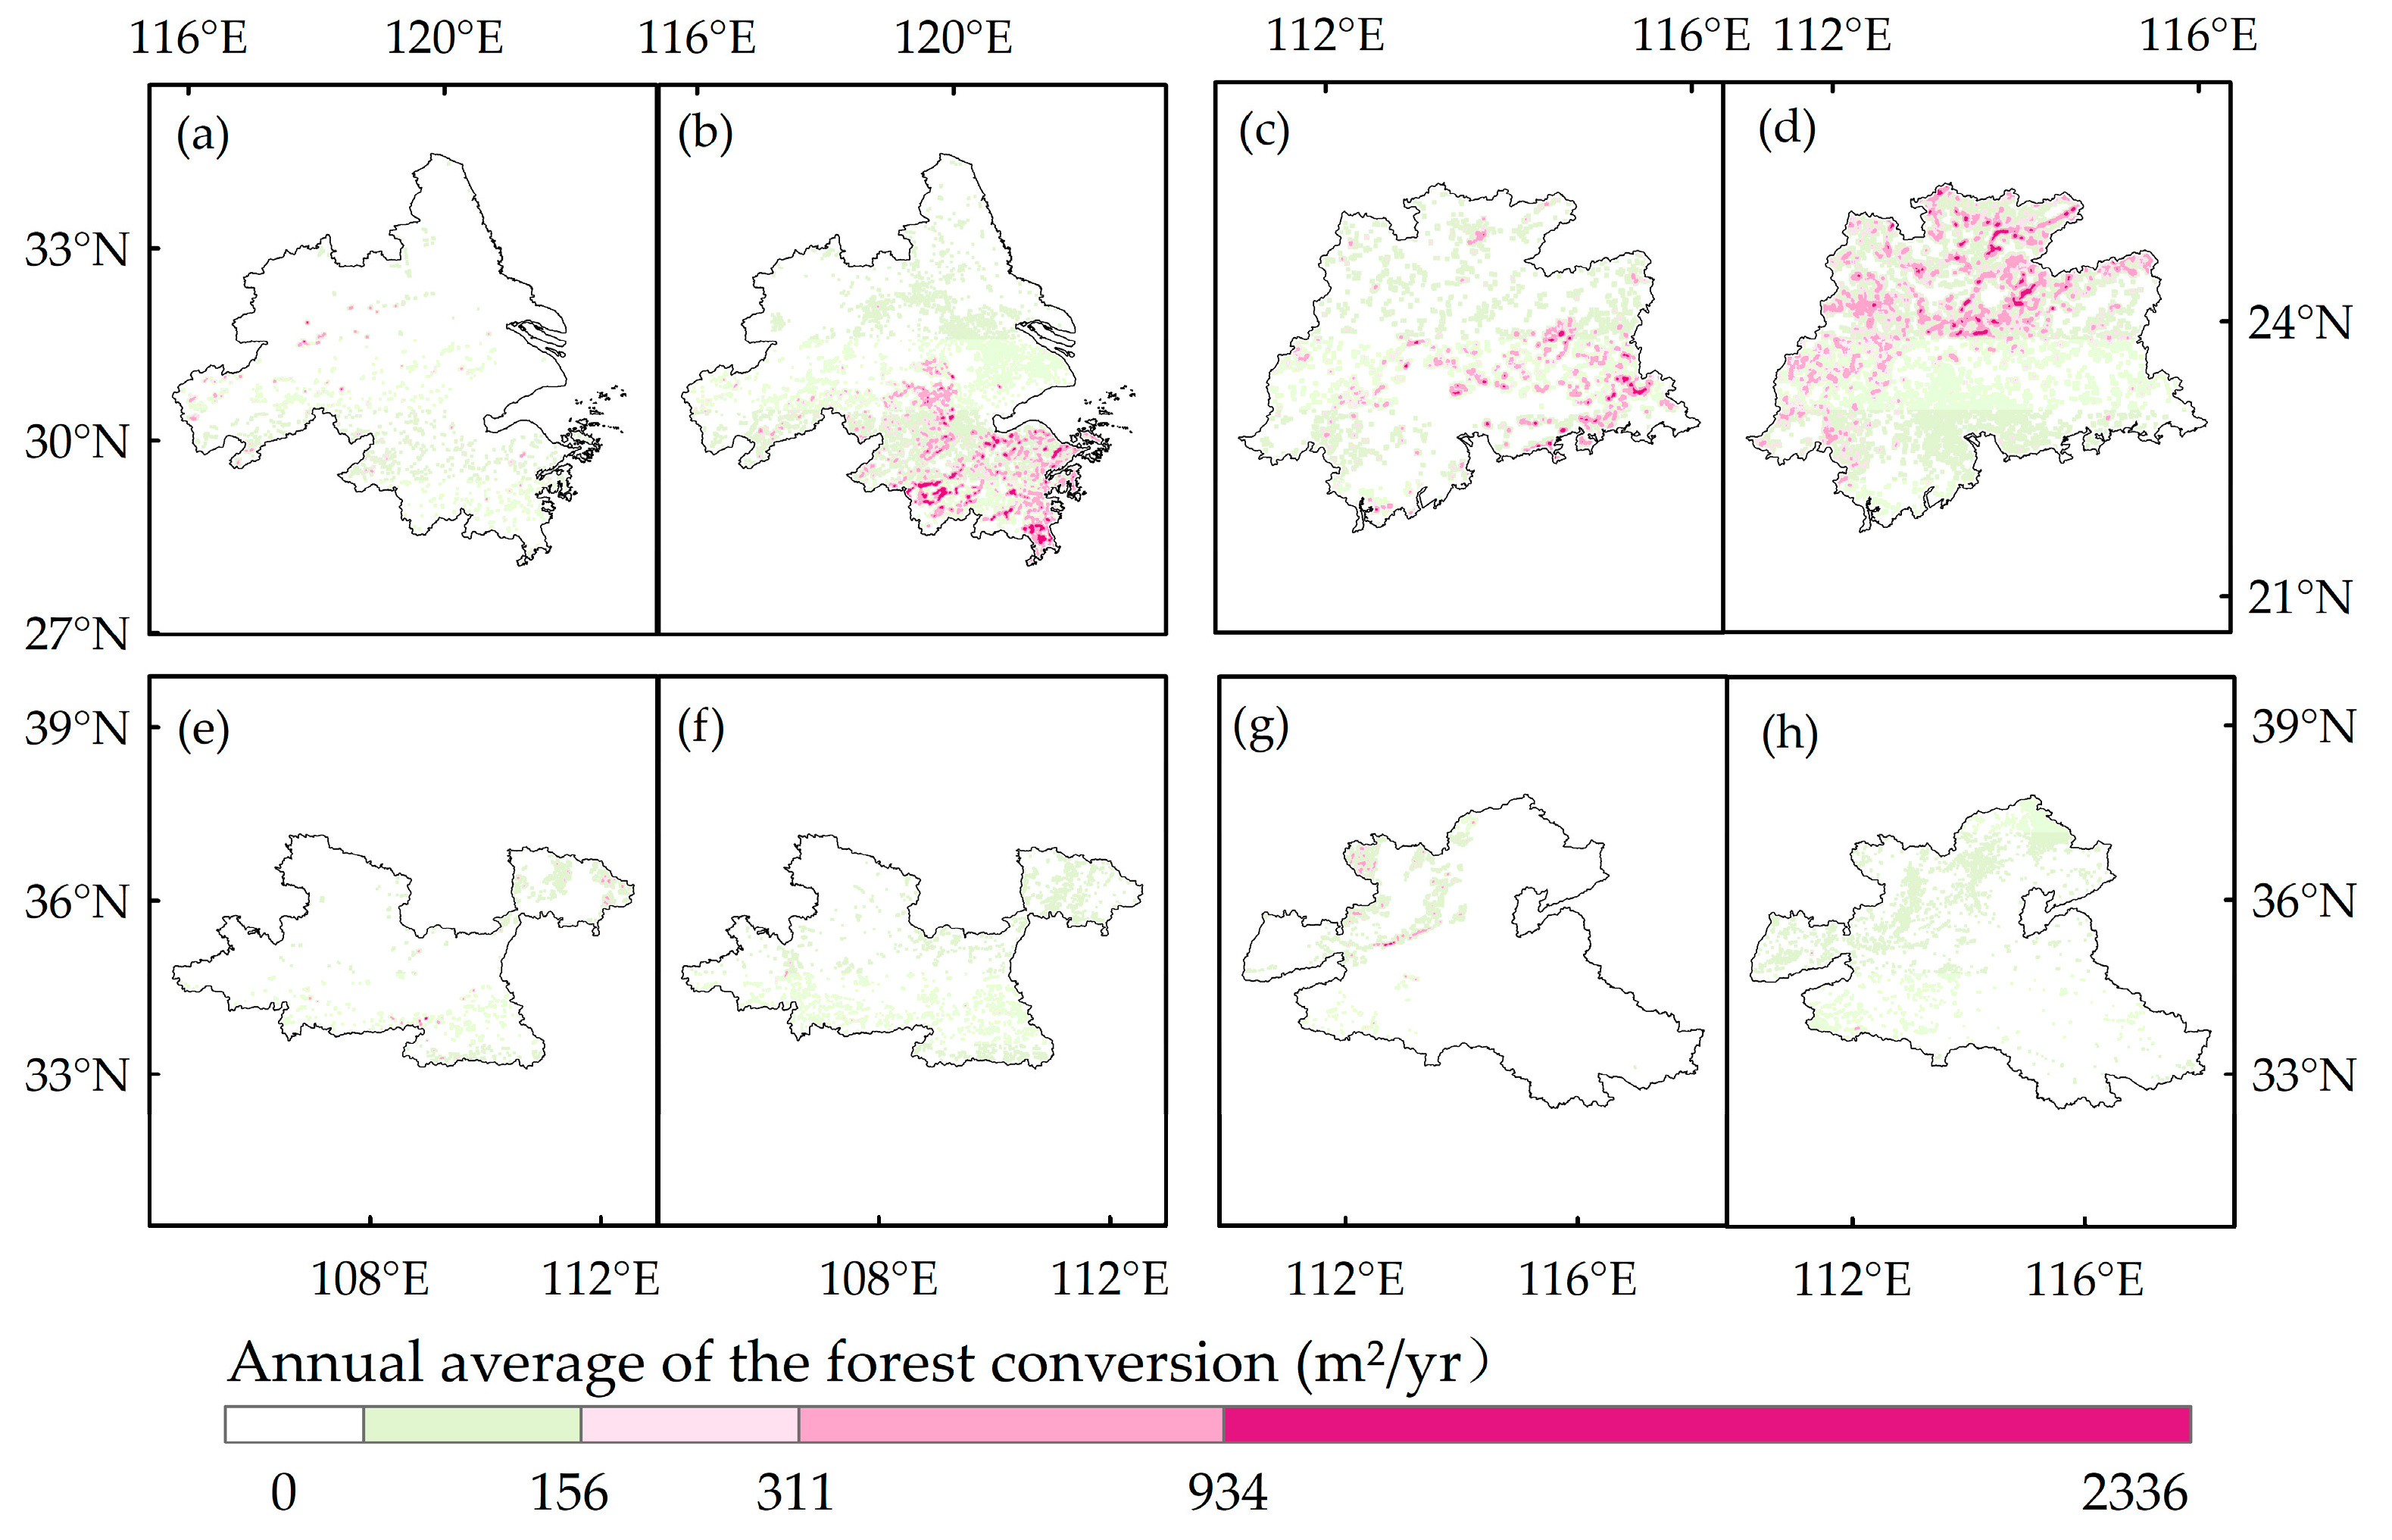
Using the 17 × 17 sliding window over the whole area, the transfer matrix for each contiguous two years was calculated, and the land cover types were converted to PFTs. Similarly, the SHDI was calculated for each window each year. Finally, the calculated forest transfer amount and SHDI were assigned to the central pixel of the window, then the transfer amount between forest and other vegetation types and the spatial distribution of landscape diversity were obtained for further analysis.

3. Results

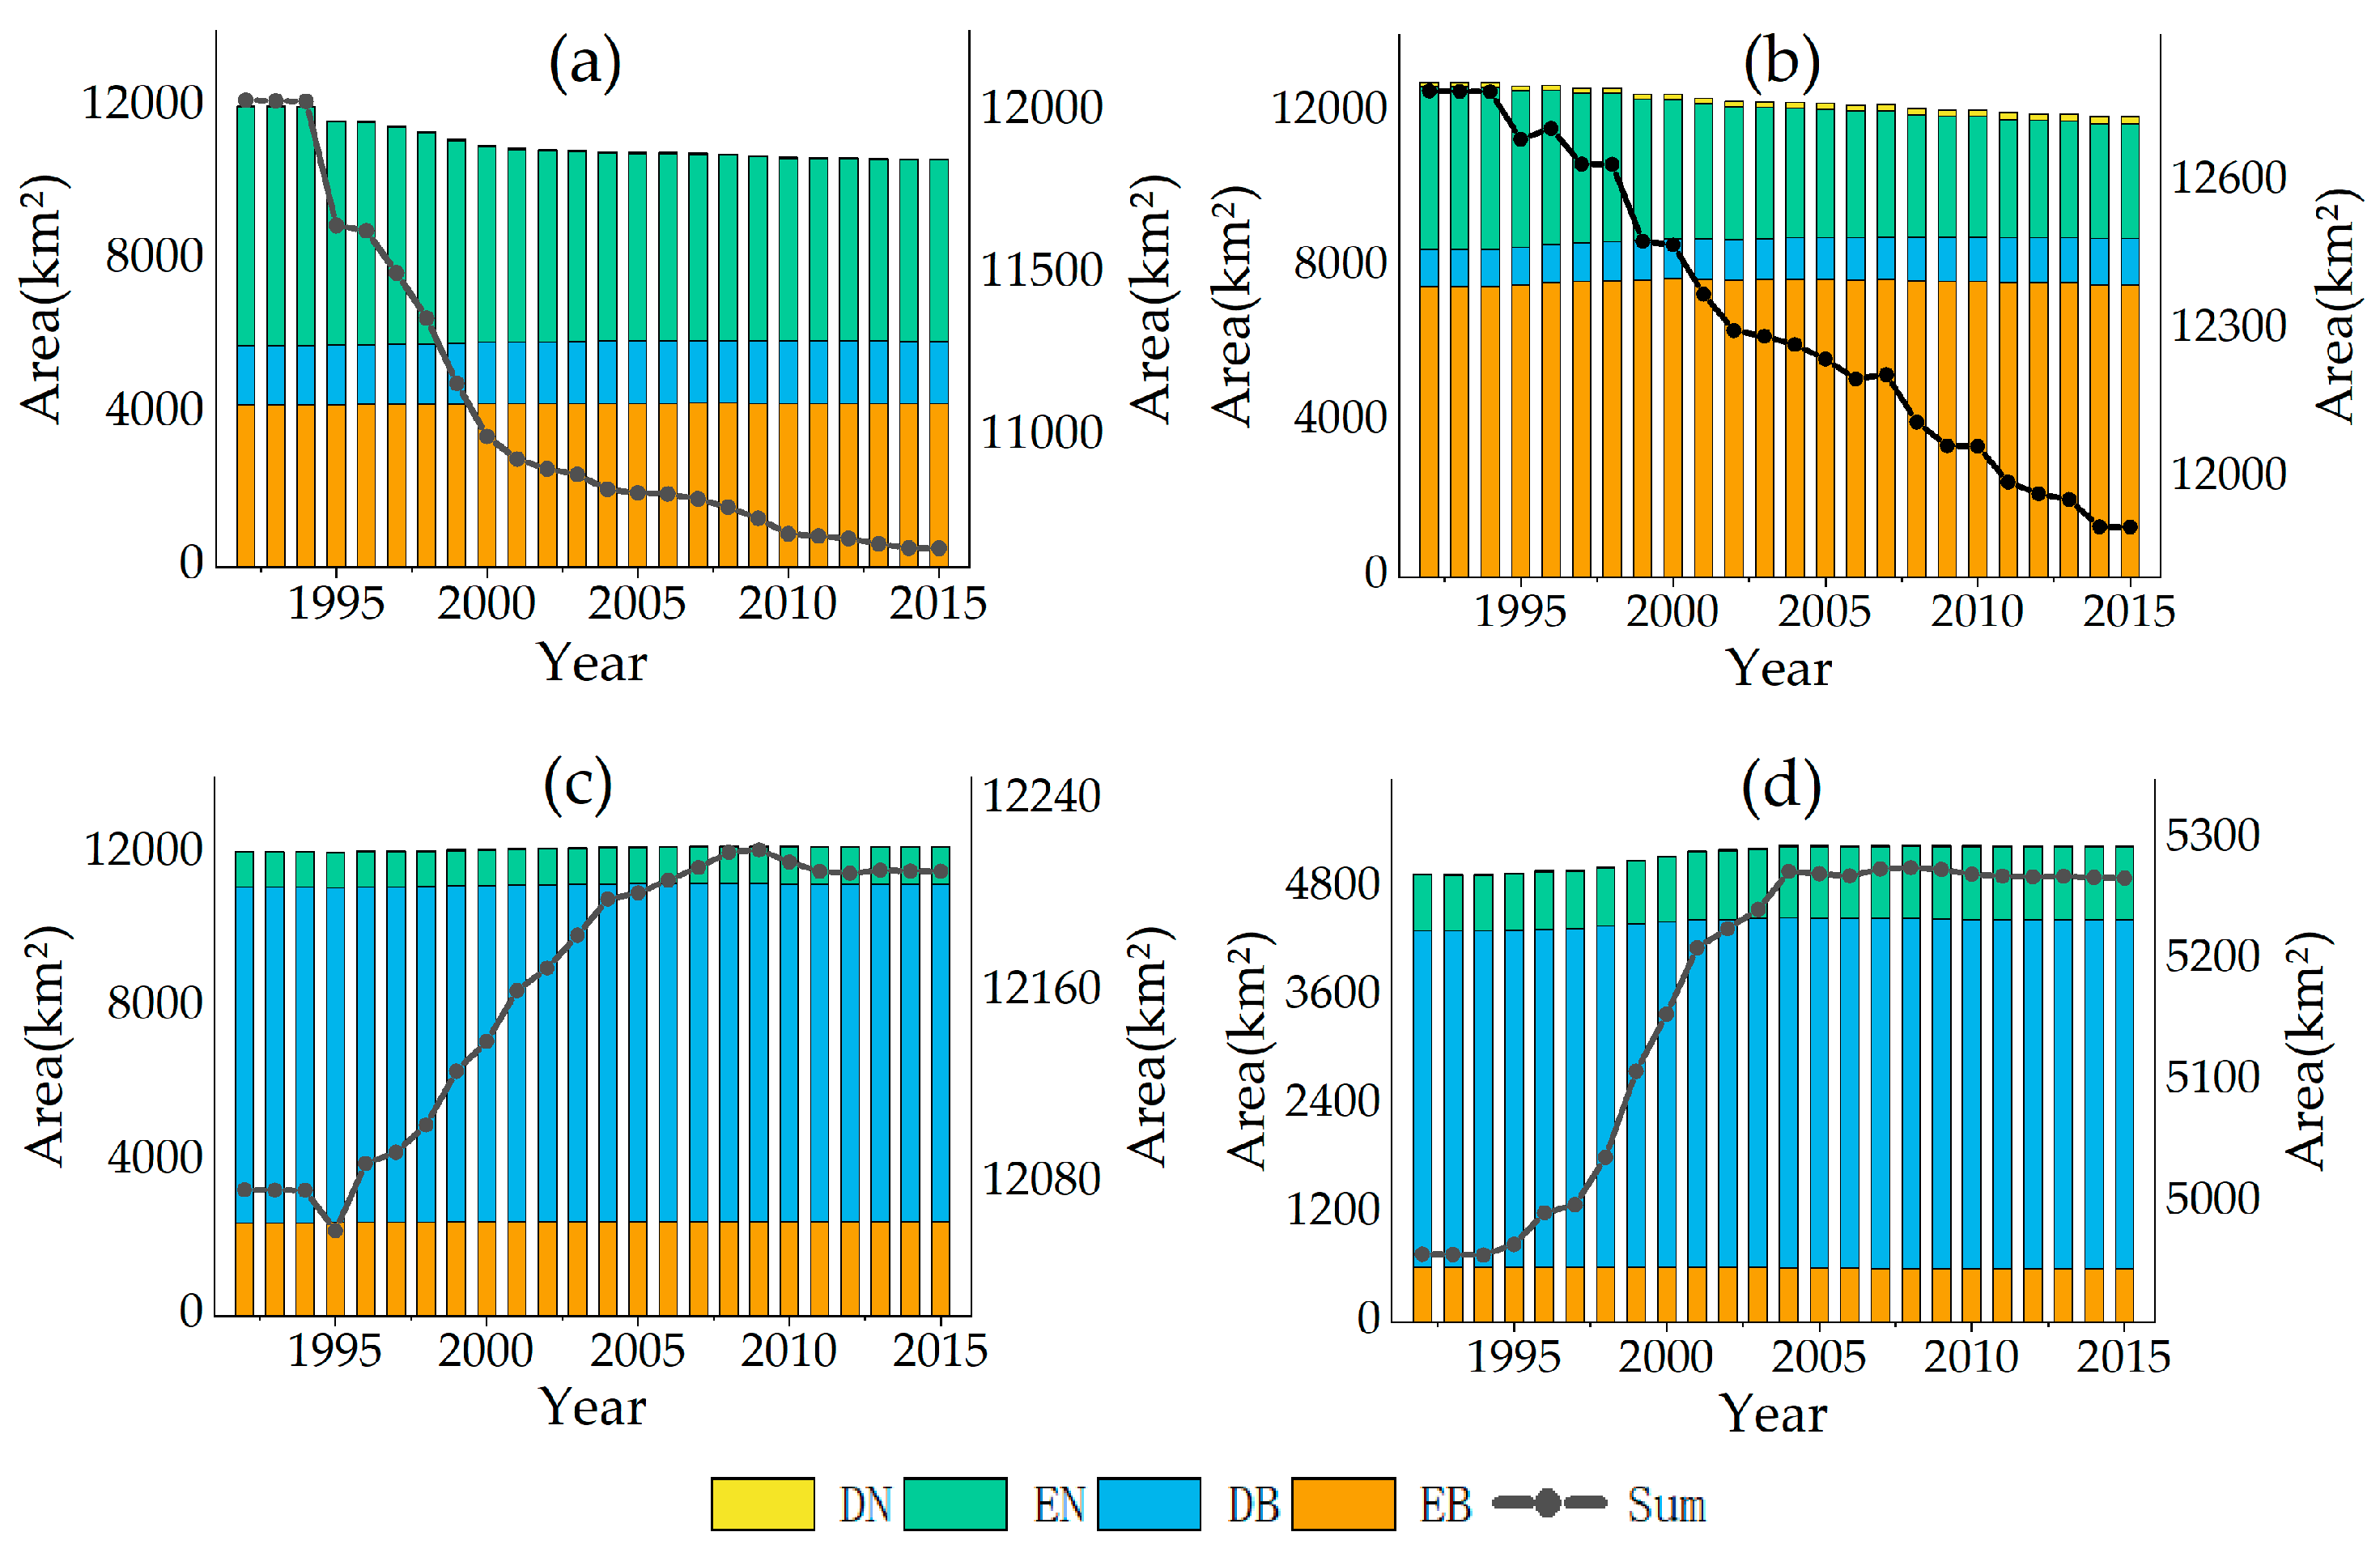
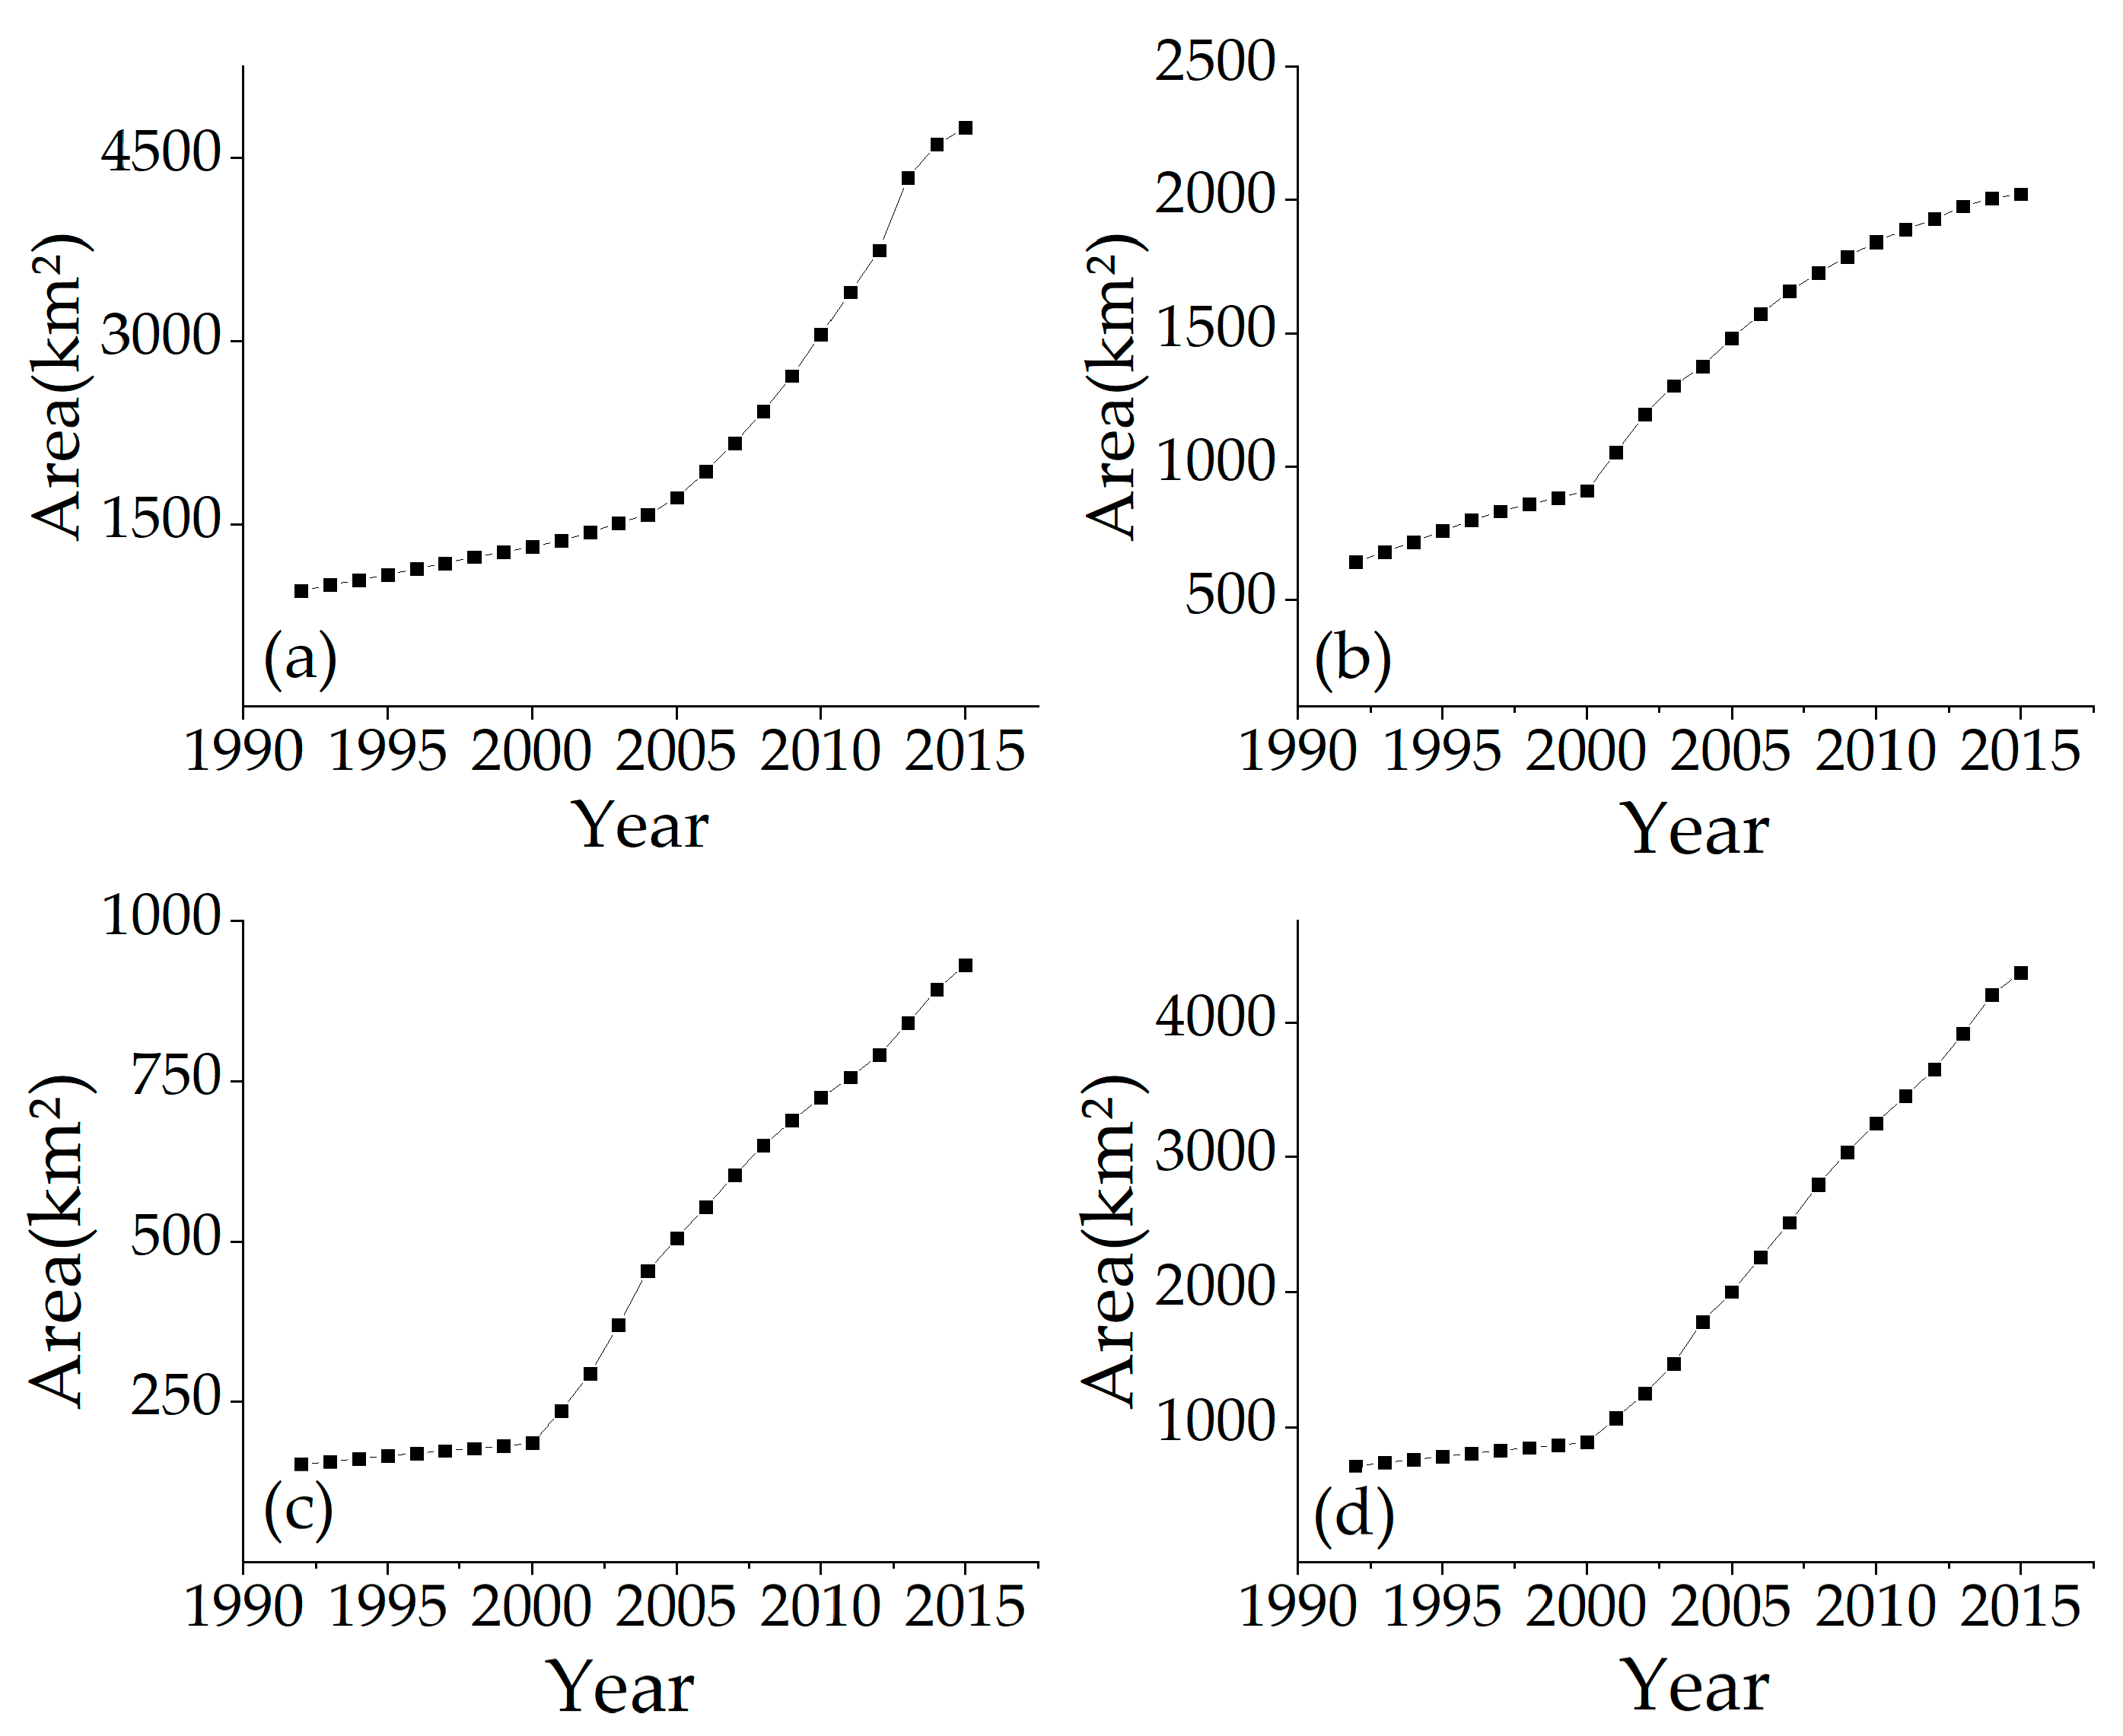
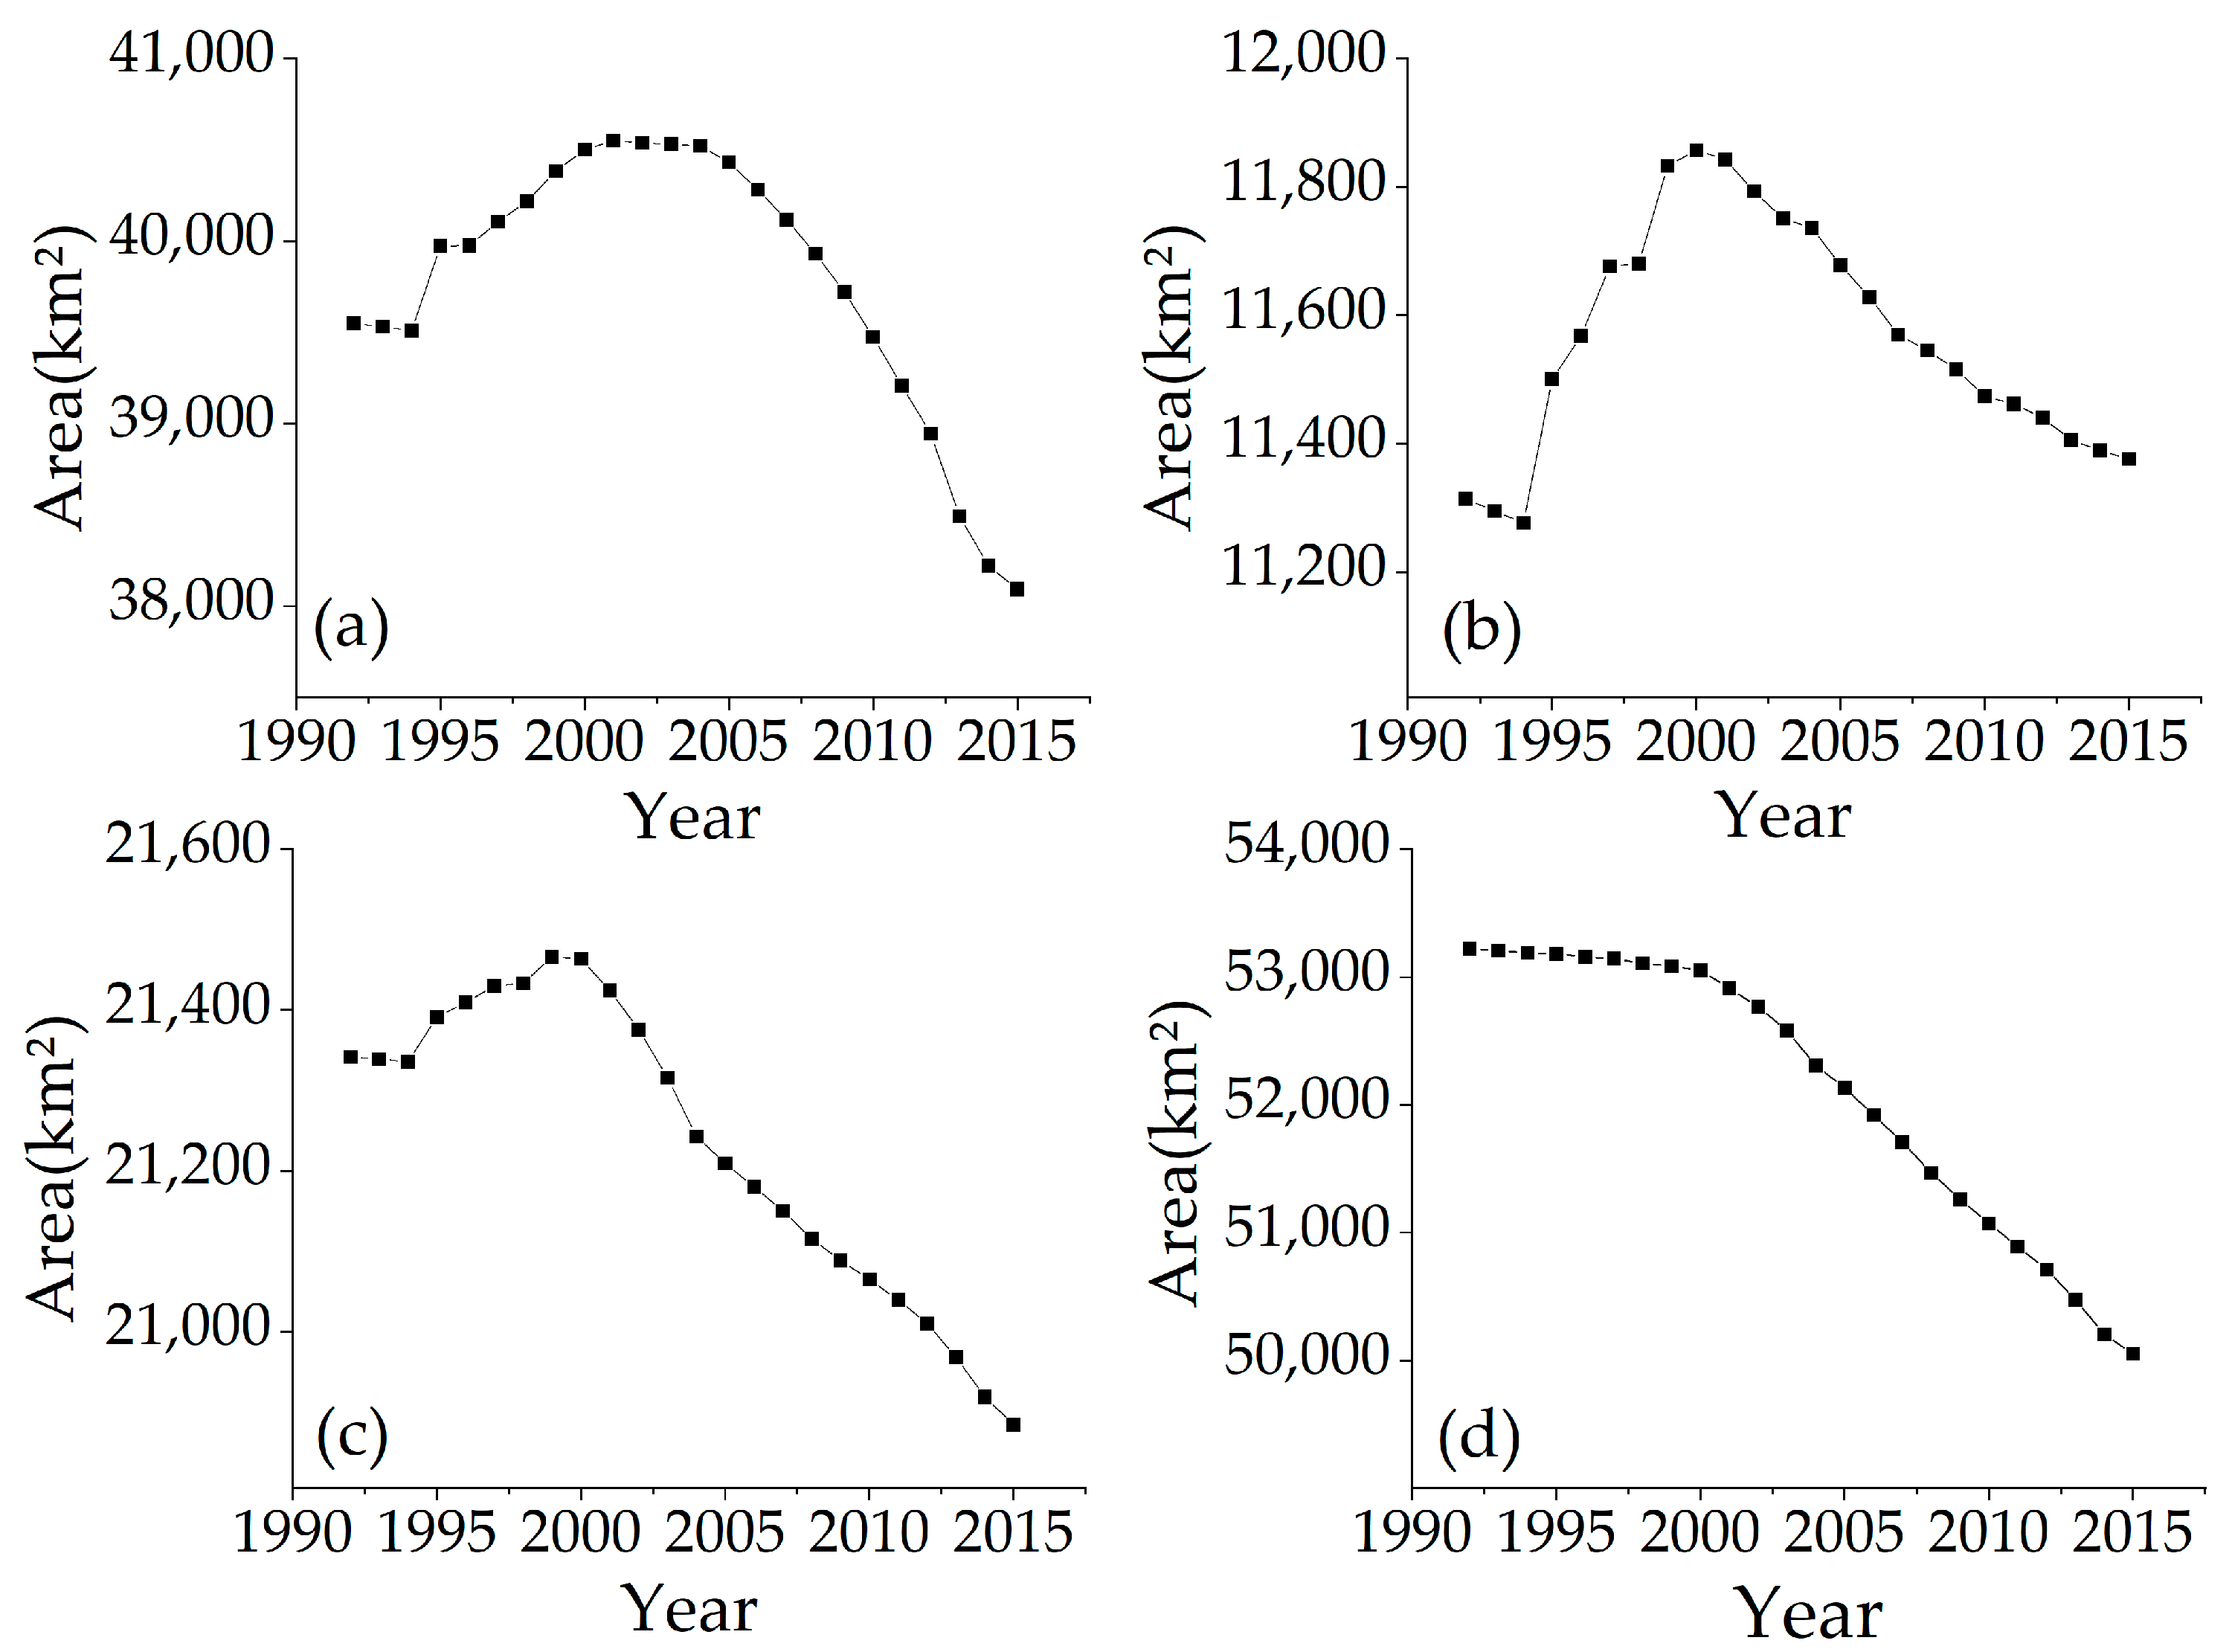
3.1. Temporal and Spatial Variations in the Forests

From 1992 to 2015, the change of forest coverage in the urban agglomerations was obvious. The statistics (PFT-based) of changing area show that the forest cover of the YRDua and the PRDua decreased by about 1384.44 km2 and 883.68 km2, respectively; the forest cover of the GTua and the CPua increased by about 311 km2 and 133.1 km2, respectively (Figure 2).
The forest coverage of the two urban agglomerations in the coastal areas declined over the past 24 years. In the YRDua, the area of forests decreased from 11,842.69 km2 (6.15%) in 1992 to 10,454.25 km2 (5.44%) in 2015. It had the highest rate of decline in 1994–2000 (147.164 km2/year) and in 2001–2010, the rate of decline slowed down and the forest area gradually became stable. The area of forests in the PRDua decreased from 112,786.53 km2 (12.17%) in 1992 to 11,902.85 km2 (11.33%) in 2015. It has declined since 1994 with an approximate linear decline trend (43.49 km2/year) to 2015. The change in the number of evergreen deciduous forests had a significant impact on the total forests of the above two urban agglomerations. The evergreen deciduous forest in the YRDua decreased by 1493.62 km2 from 1992 to 2015, and its reduction rate (67.064 km2/year) was slightly greater than the regional forest reduction rate (60.706 km2/year). The evergreen deciduous forest in the Pearl River Delta urban agglomeration decreased by 1217.11 km2, and the reduction rate (58 km2/year) was about 1.5 times that of the forest reduction rate (42.355 km2/year).
The forest area of the two inland urban agglomerations increased over the past 24 years. The area of forest in the GTua increased from 12,077.8 km2 (8.26%) in 1992 to 12,210.9 km2 (8.35%) in 2015. It experienced the fastest growth rate between 1994 and 2006, reaching 14.65 km2/year. The growth trend decreased in 2005–2009, and the annual area increased by 5.61 km2. After that, the forest coverage tended to be stable. The area of forest in the CPua increased from 4957.7 km2 (2.38%) in 1992 to 5268.7 km2 (2.53%) in 2015. It has grown in an “S” shape since 1995. The growth rate was the fastest in 1997–2001, with an average annual growth of 48.82 km2. Then it slowed down in 2004–2015 and the area remained stable.
By the statistics of the 24-year land cover data in the study area, we obtained a picture of forest cover in the four urban agglomerations between 1992 and 2015 (Figure 3). It can be seen that the forest coverage around both inland urban agglomerations and coastal urban agglomerations in the process of urbanization shows an uneven feature in space.
The forest coverage in the YRDua showed a low distribution in the south and the north. The Dabie Mountain forest area in Anhui Province and the vast hills and mountains in the central part of Zhejiang Province was located in the southern part of the YRDua, in which forests mainly grew. The regions where forests changed during 1992–2015 were mainly distributed in the southwestern part of Hangzhou, Zhejiang Province, the western part of Jinhua, and the eastern part of Taizhou. The forest coverage of the PRDua was characterized by high north and low south. The Nanling Mountains and hilly areas located in the northern part, in which the forests mainly grew. The regions where forests changed were mainly in Shaoguan, Qingyuan, Heyuan, and other cities.
The forest coverage of the CPua showed the characteristics of high in the west and low in the east. Wangwu-Taihang Mountain and Funiu Mountain were in the western region where most forests grew. The regions where forests changed during 1992–2015 were mainly in Changzhi Jincheng Jiaozuo. The forest coverage of GTua was characterized by low north and high south. Forests in the urban agglomerations were mainly grew in the southern Qinling Mountains. The regions where the forests changed were mainly in the southern part of Xi’an in Shaanxi Province and in the eastern part of Yuncheng in Shanxi Province.
Figure 4 shows the spatially continuous distribution of trends of forest changes in the coastal and the inland urban agglomerations between 1992 and 2015. In the YRDua, the area where the forest area had a slight decreasing trend (−0.01–0 of k) and a slight increasing trend (0–0.01 of k), accounted for 51% and 17%, respectively. In terms of its spatial distribution, the regions with a slight downward trend of forest coverage were mainly concentrated in the hilly areas in Central Zhejiang, including Hangzhou, Shaoxing, Ningbo, and other prefecture-level cities, while the regions with a slightly upward trend of forest coverage were mainly concentrated around the Dabie Mountains, including Anqing, Tongzhou, and Chizhou. Moreover, the regions with a significant downward trend of forest coverage (−0.03–−0.01 of k), accounting for 1.4%, mainly concentrated in the southern part of Huzhou in Zhejiang Province and the coastal areas of Taizhou and Ningbo. In the PRua, the forest change was characterized by spatial agglomeration. The regions with a slight decreasing trend (−0.01–0 of k) and a slight upward trend (0–0.01 of k) of forest coverage accounted for 67% and 28%, respectively. In the past 24 years, the areas where forest coverage slightly reduced were mainly concentrated in Qingyuan and Zhaoqing in the northern part of the urban agglomeration; the areas where forest coverage slightly reduced were mainly concentrated in Huizhou and Shanwei in the southeast coast of Guangdong Province. The area with a significant increase trend of forest coverage (0.01–0.03 of k), accounted for about 3%, concentrated in the northern part of Shanwei and the central part of Guangzhou while the area with significant reduction trend of forest coverage (−0.03–−0.01 of k) accounted for about 1% mainly distributed in Qingyuan and parts of Shaoguan.
In the GTua, the forest areas with a slight downward trend (−0.01–0 of k) were much more than those with a slight increase trend (0–0.01 of k), at 51% and 36%, respectively. The regions with a slight reduction in forest cover were mainly concentrated in the eastern part of Tianshui and southwest of Baoji. The regions with a slight increase in forest cover were mainly concentrated in the southern part of Xi’an and Yuncheng, Shanxi Province. The regions with a significant increase trend (0.01–0.03 of k) accounted for about 0.3%, mainly distributed in some areas of Yuncheng. In the CPua, the regions with a slight decrease (−0.01–0 of k) and a slight increase of forest coverage (0–0.01 of k) accounted for 27% and 15%, respectively. The regions where forests slightly shrank were mainly distributed in the central part of Changzhi and the western part of Handan, while the majority of those with increasing forest areas were around the Taihang Mountains and Wangwu Mountains. The regions with a significant upward trend (0.01–0.03 of k) accounted for 0.5% of the total, concentrated in the Taihang Mountains, Wangwu Mountains, and other mountainous areas.

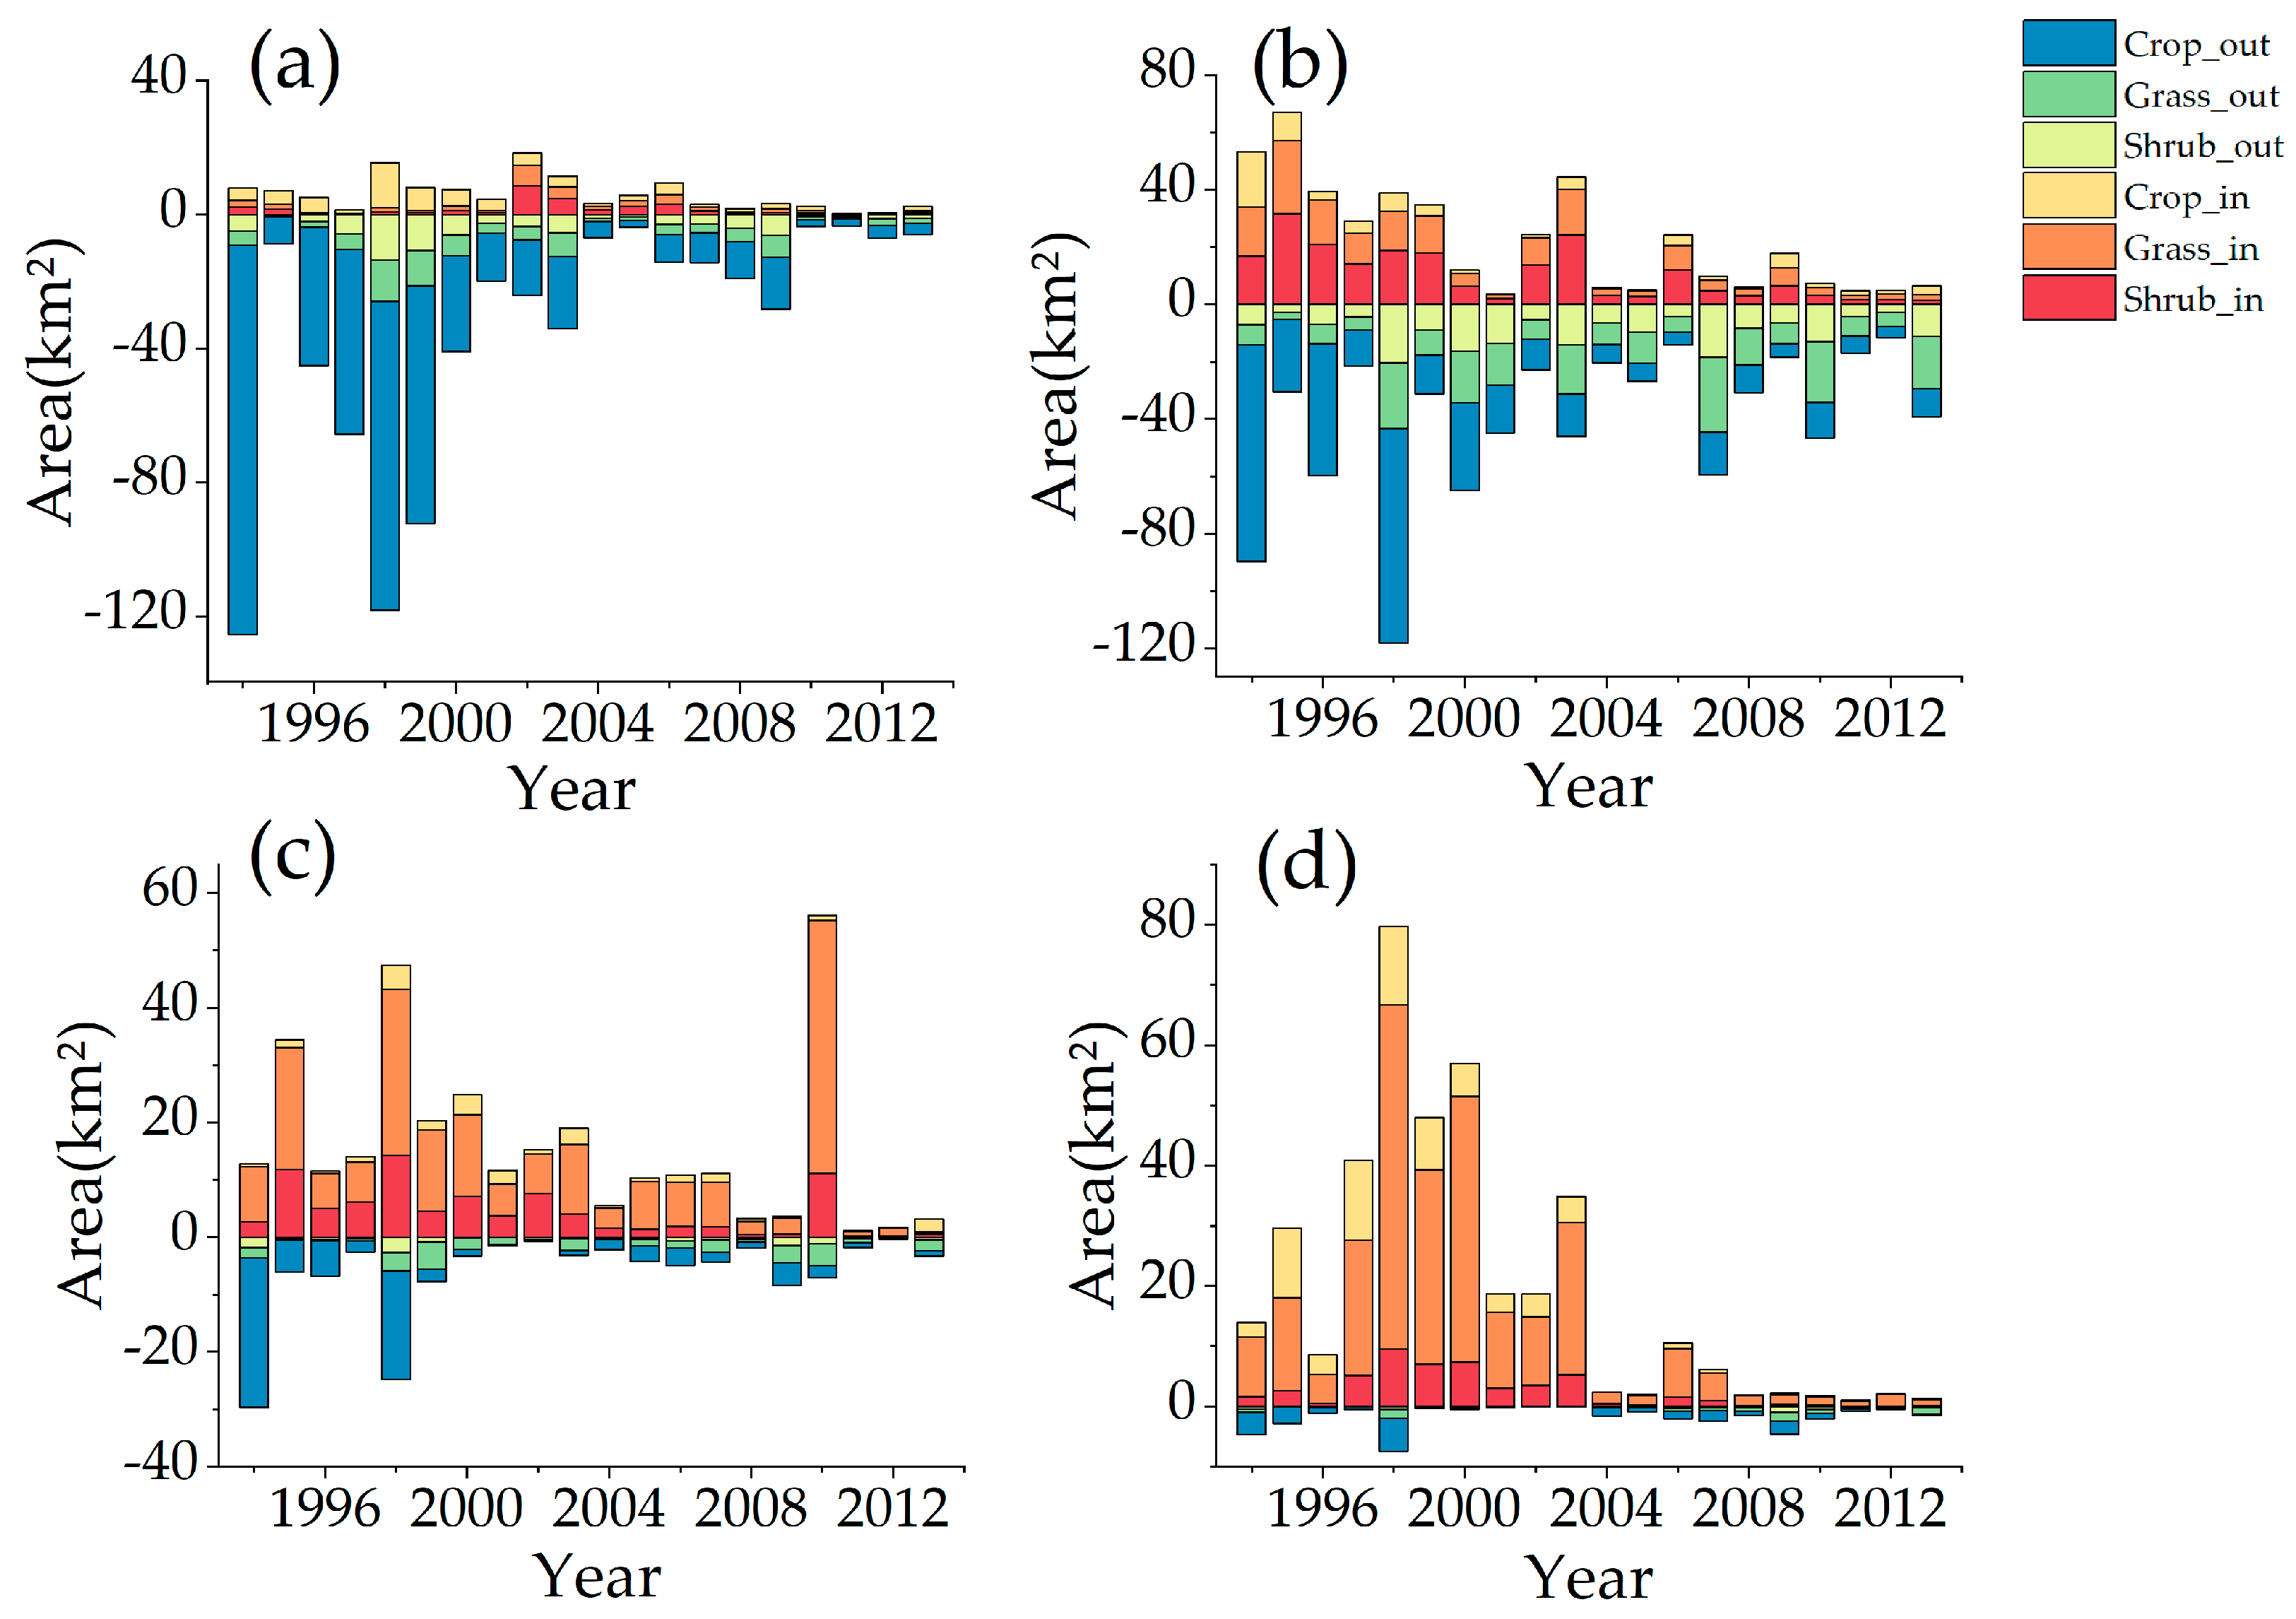
3.2. Forest Transferations

After counting the amount of transfers between the forest and the other types in the urban agglomerations, it can be found that in the YRDua, an average of 6 km2 of the other vegetation converted into forests each year, while an average of 34 km2 of forests converted into the other vegetation each year. In the PRDua, an average of 21.91 km2 of the other vegetation converted into forests every year, while an average of 40.76 km2 of forests converted into the other vegetation every year. In the GTua, an average of 15.9 km2 of the other vegetation converted into forests every year, while an average of 6.58 km2 forests converted into the other vegetation every year. In the Central Plains urban agglomeration, an average of 19.1 km2 of the other vegetation converted into forests every year, and an average annual 1.76 km2 forest converted into the other vegetation. The combined effects led to a decline in the forest area of the coastal urban agglomerations and an increase in the forest area of the inland urban agglomerations.
Figure 5 shows that between 1992 and 2015, the amount of the vegetation which converted from the forest cover followed the order: cropland > grassland > shrub from large to small, while the cropland is slightly different in the order that the number of the other PFTs transformed into the forest: that in the YRdua followed: farmland > shrub > grassland and that in the PRDua area followed: shrub > grassland > farmland. In the YRDua, the areas where the forest transformed to the other vegetation types were the largest (125.5 km2) between 1994 and 1995, of which the area from the forest to the cropland was 116.5 km2. From 1995 to 2003, the area of conversion from forest increased at first and then decreased, with an average of 49.9 km2 per year, peaked at 118.2 km2 in 1998. However, in the following years, it decreased and gradually levelled at 10.6 km2. During the 24 years, the area where the forest converted to other vegetation peaked at 18.48 km2 in 2002. The area where the forest converted to the other vegetation in the PRDua was at a relatively high level (53 km2/year) between 1994 and 2003, with the cropland turning out an average of 32.1 km2 per year. After 2003, the conversion of the forest to the other vegetation decreased to 28.5 km2/year, with cropland turning out an average of 7.87 km2/year. While the amount of the other vegetation converted to the forest in 1994–2003 was also at a relatively high level (34.6 km2/year). After 2003, it dropped sharply to 9.2 km2/year.
In general, there were a large number of forest-to-farm conversions in the two urban agglomerations in the coastal areas before 2003, while a considerable number of grasslands and shrubs converted into forests in the PRDua. After 2003 the mutual conversion between the forest and the other vegetation reduced, and the total amount of forests tended to be stable gradually.
In the GTua and the CPua, the transition from grassland to forest was widespread. And the amount of the forest transformed into the other vegetation followed the order: grassland > shrub > farmland (in the GTua), grassland > farmland > shrub (in the CPua). The number of other vegetation converted into the forest in the GTua was at a high level (21.7 km2/year) in 1994–2003, of which the grassland accounted for 10.25 km2. After 2003, the figure decreased to 10.7 km2/year, of which the grassland accounted for 7.9 km2 (especially, in 2010 the area was 56.08 km2, of which the grassland accounted for 44.06 km2). The amount of the forest converted to the other vegetation has been small for many years (6.6 km2/year), and it peaked at 29.7 km2/year in 1994. The area of the other vegetation converted to the forest in the CPua showed the characteristics of first decline and then rise in 1994–2003. It averaged 35 km2 (grassland accounted for 23.54 km2) per year and peaked in 1998 (79.68 km2/year). After 2003, the figure fell to 3.16 km2/year. While the area of the forest converted to the other vegetation was less than 10 km2 in the whole study period (1.76 km2/year).
If we pay attention to the spatial distribution (Figure 6) we will find that, in the YRDua, the regions where the forest obviously transformed into the other vegetation (300–1850 m2) were concentrated in the hills and mountains in the eastern part of Zhejiang Province, while the transformation from the other vegetation to the forest was generally relatively gentle. In the PRDua, the regions where the forest more obviously transformed into the other vegetation (380–2180 m2) appeared in Qingyuan and Shaoguan, the northern part of Guangdong Province, while other regions where the vegetation transformed into forests (300–1870 m2) were concentrated in Huizhou and Heyuan in the southeast coastal area. In the GTua, the regions with obvious forest transformation were distributed in the southern mountainous area of the Qinling Mountains. In the eastern part of Tianshui, the forest was obviously transformed into the other vegetation (370–780 m2), while in the northern part of Xi’an, the other vegetation transformed obviously into forest (31–1400 m2). In the CPua, the regions where other vegetation converted obviously into the forest (311–1550 m2) were mainly concentrated in the Wangwu-Taihang mountainous area and the Fuxiu mountainous area in Western Henan, while the situation of forest conversion to other vegetation was generally flat (0–260 m2).

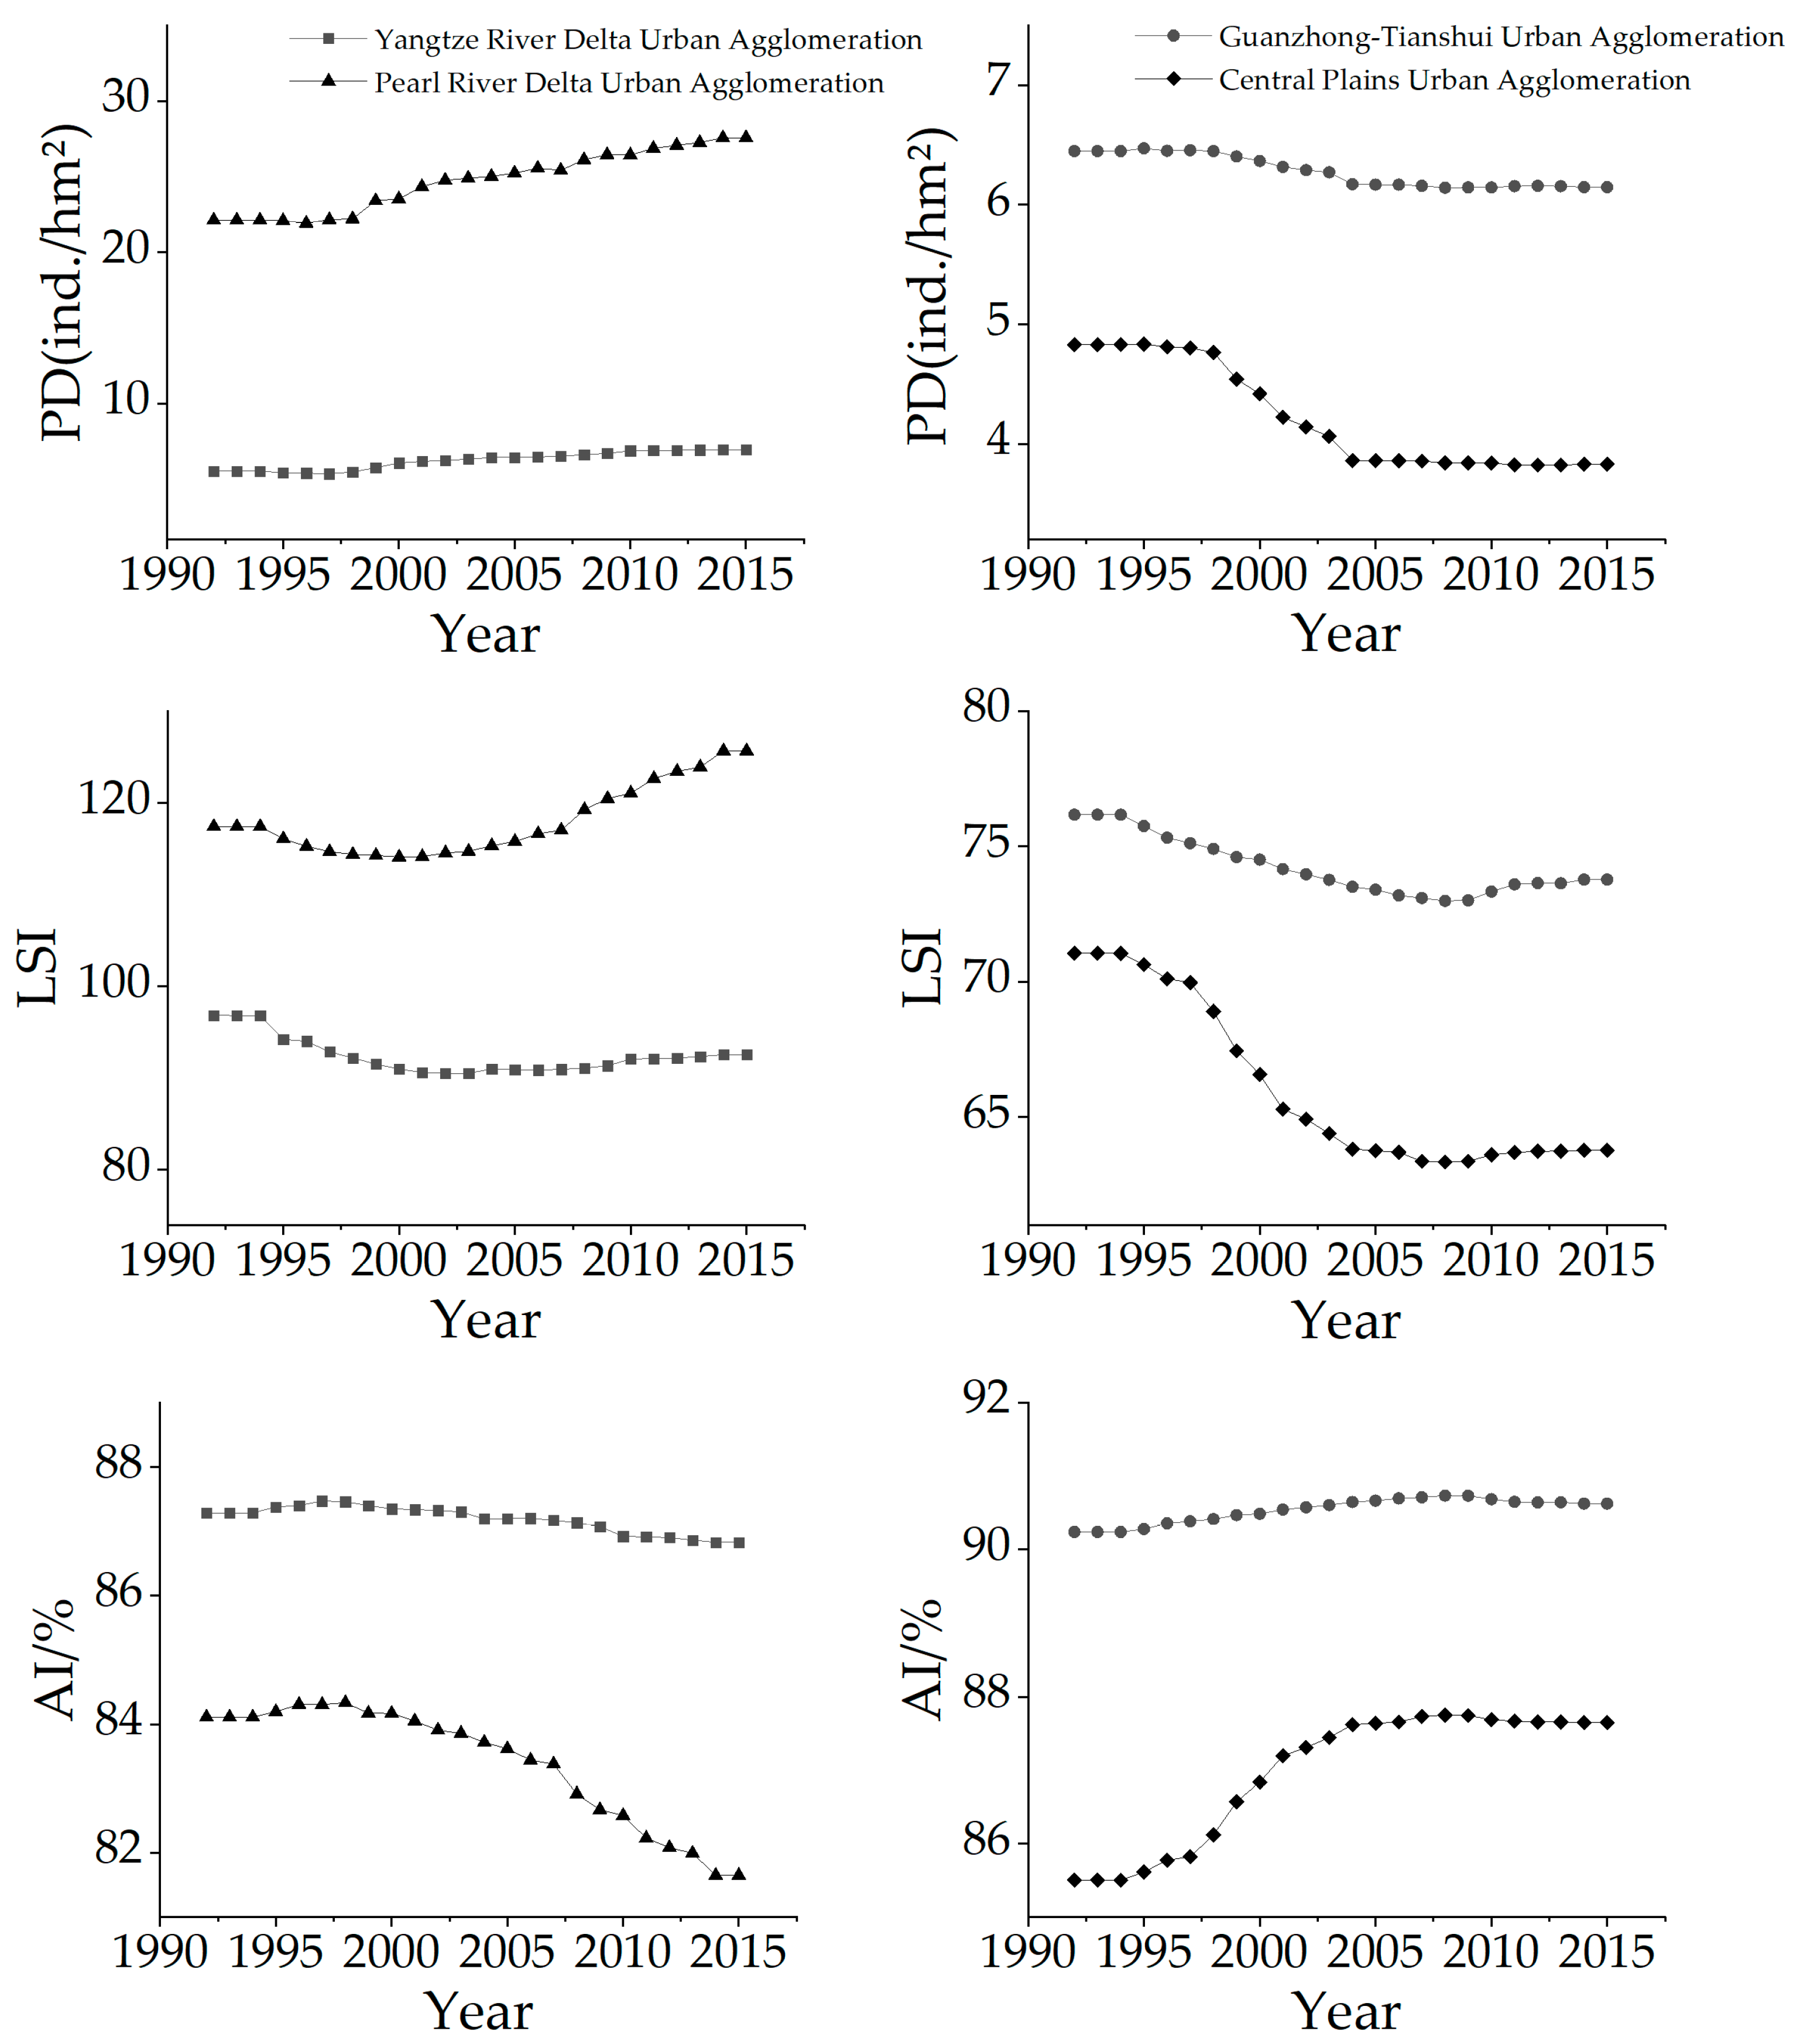
3.3. Landscape Patterns of Forest

The landscape pattern of the YRDua was characterized by low north and high south. A large number of croplands were distributed in the northern Jiangsu Plain and the Jianghuai Plain in the YRDua. Additionally, because of the single land use type, the landscape diversity was low in the northern part of the urban agglomeration. Between 1992 and 2015, the SHDI of the YRDua changed little, and it showed a downward trend (reduced by 0–0.03) in general. The areas with a significant upward trend (increased by 0.03–0.1) were mainly in central Shanghai and eastern Hangzhou. The overall landscape diversity of the PRDua was high, and the SHDI value in most areas was between 1 and 2. From 1992 to 2015, the areas where landscape diversity increased in the PRDua were more than the reduced area, accounting for 73.8% and 20.8%, respectively. In the past 24 years, the landscape diversity in the PRDua changed significantly. The southern part of Qingyuan and the central part of Shaoguan dropped significantly (reduced by 0.2–0.7), while Foshan, Zhongshan, and other regions increased significantly (increased by 0.2–0.8).
The landscape diversity of the GTua was higher in the middle and lower in the north and south. Between 1992 and 2015, in the GTua, the areas where landscape diversity declined were more than the increased area, accounting for 62.5% and 14%, respectively. During the 24 years, the landscape diversity of the GTua changed significantly. The SHDI in northern part of Xi’an, Shaanxi Province and Yuncheng, Shanxi Province increased significantly (increased by 0.2–0.5), while the SHDI in central Xi’an was significantly reduced (reduced by 0.2–1). In the CPua, the spatial distribution of landscape diversity was characterized by high northwest and low southeast. The areas where the SHDI was less than one in the urban agglomerations accounted for 61.7% in 2015, while the area where the SHDI was larger than one accounted for 38%.7%. Between 1992 and 2015, the areas where the landscape diversity increased was less than the reduced area in the CPua, accounting for 36.4% and 57%, respectively. During the past 24 years, the SHDI in Xuchang, Henan Province and parts of Liaocheng, Shanxi Province increased significantly (increased by 0.2–0.5) while the SHDI in Central Zhengzhou and Southern Jincheng decreased significantly (reduced by 0.2–0.8).
The SHDI reflects the richness of land use types. Overall, the abundance of land use in the coastal urban agglomerations was higher than that of the inland urban agglomerations. Additionally, the SHDI could reach a maximum of 2.4 or more, while the SHDI values of the inland urban agglomerations were all around 2.2.

4. Discussion

4.1. The Effect of Mixed Pixels

There is a problem of mixed pixels in low-resolution remote sensing data, which leads to inaccurate results of various landcover classification of statistics. In the LULC data, due to spatial resolution limitations, the image corresponds to a larger area of the actual ground in a pixel. When we focus on the area covered by vegetation, we will find that there are many kinds of vegetation types mixed in our research area and other areas, such as cropland and shrubs interlaced in a certain area, closed forest interlaced with shrubs in a certain area, etc. Mixed pixels are most likely to occur in these regions. Although some special land cover classification, such as mosaic cropland (it is believed that more than 50% of these types of pixels are cropland, and the rest are some mixed natural vegetation, including tree, shrub, and herbaceous cover) are classified in the CCI land cover classification system, these types are not much helpful in calculating the specific content of vegetation in mixed pixels. The LULC data we used in the study has a resolution of 1/360°, and it is difficult to eliminate the influence of mixed pixels.
In order to deal with this effect, we used the PFT conversion factors provided by ESA for further statistics for more accurate vegetation coverage. The conversion factors refer to the spatial proportion of various plant functional types in each land cover classification, which can reflect the spatial proportion of different vegetation types in mixed pixels to a certain extent. It gives the proportion of different PFTs in some complex land cover classification (such as mosaic cropland) [39,40]. Using this method, we can further calculate the amount of forest resources in the study area. However, the conversion factor is the spatial distribution scale coefficient of large-area scale vegetation. In fact, the proportion of plant function types of mixed pixels may change in different spatial regions.
In order to explore the difference between the results between the results derived from the PFT and classification of land cover, we calculated the area of forest cover for different urban agglomerations in the study area based on these two different approaches. According to the land cover data, the coverage area of the 2010 and 2015 Yangtze River Delta urban agglomerations is 12,400 km2 and 12,300 km2, respectively; the forest coverage of the YRDua obtained from the PFT was 10,700 km2 and 10,600 km2, respectively. In the CPua, the forest coverage based on PFT is 5200 km2 in the both two years. In short, the forest area obtained by calculating PFT is slightly smaller than that obtained by land cover data. When we focus on the trend of forest area, the difference between the two is almost the same, but the PFT results changes more gradual (Figure 7). This is because a pixel with a land cover classification could contained more than one PFT, which may be not consistent with the plant type of the classification. From the results, the two are different but the difference is small. We could not tell which results are more accurate. However, our research focused on the dynamic process of vegetation in a wide range of areas. Hence, the impact of trend changes was small.

4.2. Forest Resources in Different Regions

Urbanization will inevitably lead to conflicts between cities and other land resources, especially the forest resources we were concerned about. The increase in urban area also means that the population growth, which will in turn lead to an increase in demand for food. The demand for food from urban development may lead to an increase in cropland and may, therefore, have a potential impact on the spatial distribution of forests. Moreover, the protection of the ecological environment may also affect the spatial allocation of many other resources. From the above, we can see that with the development of the region, the forest resources will face complex and diverse pressures.
China’s LULC data for the past 20 years showed that the urbanization rate varies in different urban agglomerations. In the two coastal urban agglomerations, the urbanization rate has gradually declined after the initial rapid growth of the urban area. However, this feature did not appear in the inland urban agglomerations. In the Yangtze River Delta urban agglomeration, the urban area growth rate was 100 km2/year between 2013 and 2015, which was about 2.5 times lower than that in 2005–2012. In contrast, the urban areas of the inland urban agglomerations have maintained a relatively high growth rate during the study period (Figure 8). China’s urbanization rate in 2015 is 56.1% [41,42], which was in the middle and late stages of urbanization (50%–70%) [43]. According to the law of urban development summarized by some scholars, the rate of urbanization in China may gradually slowdown in the future [44]. Statistical data from municipal governments also shows that, in 2015, the urbanization rate of the Yangtze River Delta urban agglomeration was 68.2% and 75.0%, respectively, while the urbanization rate of the Central Plains urban agglomeration and the Guanzhong-Tianshui urban agglomeration was 48.3% and 51.5% respectively. The Yangtze River Delta and Pearl River Delta urban agglomerations may have entered the deceleration stage.
From the perspective of the development of the city, if we assume that the urbanization of the more developed coastal urban agglomerations has entered the later stage of urbanization, when the urban area growth slowed down and the demand for other resources tended to be stable. Additionally, the Yangtze River Delta and the Pearl River Delta in the coastal areas are in the subtropical monsoon climate, and the hydrothermal conditions there are conducive to forest growth. In this way, we have reasons to believe that in the future, the demand of coastal urban agglomerations for various resources may gradually stabilize, and the situation of forest reduction will be alleviated.
On the other hand, some regions, such as the two inland urban agglomerations in the study area, may just enter the middle and late stages of urbanization, and are likely to experience a period of rapid urban growth. More importantly, in these areas, croplands occupied a considerable area, so that changes in the cropland resources may greatly affect forests [45,46]. It is difficult to say if the development of the city will have a greater demand for cropland resources and, thus, change the spatial distribution of cropland. In fact, in the course of urban development, the area of croplands in the inland urban agglomerations even declined after 2000 (Figure 9). This change after 2000 may be mainly due to the nation’s “Grain for Green’’ program [47] and the land set-aside program. In such circumstances, whether the cropland would pose a greater threat to the forest is still worth exploring.

4.3. Regional Landscapes

Considering the long-term changes in land cover in the urban agglomerations, the impact of human activities on the ecological changes of the urban agglomerations was extremely complicated. Many studies showed that the driving factors of such impact came from social, economic and natural and other aspects. Although quantitative research under the interaction of such complex factors is difficult, the landscape pattern index and its changes can be a good indicator of the results under the influence of multiple factors [48,49]. In order to consider the change of forest landscape in the urban agglomerations, we also used some other landscape indexes to quantitatively describe it.
We selected the patch density (PD), the landscape shape index (LSI), and the aggregation index (AI) at the class level. The results showed that the PD in the two coastal urban agglomerations increased over the years, while that in the inland urban agglomerations showed a declining trend. That is to say, the fragmentation degree of forest landscape in the coastal urban agglomeration area increased, while the inland area decreased in the past 24 years. Moreover, the LSI changed slightly in the different urban agglomeration areas, but there is an upward trend in the coastal urban agglomeration areas and a downward trend in the inland urban agglomeration areas. Additionally, the AI showed a downward trend in the coastal urban agglomeration areas and an upward trend in the inland urban agglomeration areas (Figure 10).
In the coastal urban agglomerations, the forest coverage decreased, but the degree of fragmentation increased and the degree of aggregation decreased. In the inland urban agglomeration areas, because of the increasing number of forests, patches may increase or expand outward, resulting in reduced fragmentation and increased aggregation. As for the LSI, although the changes were not so obvious, we could still find that the overall level of the coastal urban agglomerations was higher than that of the inland urban agglomerations, and there was an upward trend. The decrease of forest fragmentation and the increase of forest aggregation indicated that the growth of forests in the inland urban agglomerations was more likely to be a centralized growth forced by human activities, which may be the result of some land policies of local governments such as the Grain for Green Policy. However, the growth of such a model did not make the structure of the forest landscape be more complicated, and the LSI showed a downward trend. However, from another perspective, increasing fragmentation usually means that the forest patches were divided into smaller patches by other land cover classes, which may have a negative impact on the animals living in larger areas of forest. Considering, comprehensively, whether the strategy of development in this region would help to improve regional ecological services and improve biodiversity is still worth exploring.

5. Conclusions

This research detected the differences of forest coverage between the inland and coastal urban groups of China over the past decades. The forest coverage had changed dramatically over the past 24 years. This study showed that between 1992 and 2015, the forests in the coastal urban agglomerations significantly declined (reduced by 9% compared with 1992), while that in the inland urban agglomerations raised to some extent (increased by 2.6% compared with 1992) between 1992 and 2015. The changing areas of the forest in the coastal urban agglomerations were widely observed in space and varied greatly. In contrast, the forest cover in the inland urban agglomerations changed in few regions with a relatively small magnitude. The regions with obvious changes of forest cover in the Yangtze River Delta and Pearl River Delta urban agglomerations accounted for 1.4% and 4%, respectively. In contrast, that only accounted for 0.3% and 0.5% in the Guanzhong-Tianshui and Central Plains urban agglomerations. In addition, given the spatial distribution of the forest changing trends, the forest coverage in the inland urban agglomeration tended to increase in the northern regions, while that in the coastal urban agglomeration liked to rise in the south. For the transformation of the forest cover, the mutual change between forest and cropland in the two coastal urban agglomerations were very intense, which often dominated the change of regional forest quantity. Nevertheless, grasslands tended to transform into forests in the inland urban agglomerations. The decline of forests in the two coastal urban agglomerations slowed down around 2003, and forest cover remained basically stable after 2003. It may be because that some protection policies for forests have worked. Our finding also showed that the landscape diversity of the coastal urban agglomerations is higher than that of the inland urban agglomerations, but the landscape diversity of inland urban agglomerations had increased over the past 24 years. Given the complexity of the landscape structure, we argue that more careful considerations of the landscape configuration are important for achieving the goal of sustainable development.

Author Contributions

Conceptualization: J.J.; methodology: J.J., Q.Z., and Y.J.; software: Q.Z. and Y.J.; formal analysis: Q.Z.; writing—original draft preparation: Q.Z.; writing—review and editing: Q.Z., J.J., P.W., Y.J., Y.X., F.G., C.D., and L.Q.; supervision: J.J.

Funding

This work was funded by the National Key R and D Program of China, grant number 2018YFA0605402; the National Natural Science Foundation of China, grant number 41971374 & 41601442; and the Fundamental Research Funds for the Central Universities, grant number 2017B06814.

Conflicts of Interest

The authors declare no conflict of interest.

References

  1. Huslshoff, R.M. Landscape indices describing a Dutch landscape. Landsc. Ecol. 1995, 10, 101–111. [Google Scholar] [CrossRef]
  2. Huang, L.; Yan, L.J.; Wu, J.G. Assessing urban sustainability of Chinese megacities: 35 years after the economic reform and open-door policy. Landsc. Urban Plan. 2015, 145, 57–70. [Google Scholar] [CrossRef]
  3. Vitousek, P.M. Beyond global warming: Ecology and Global Change. Ecology 1994, 75, 1861–1876. [Google Scholar] [CrossRef]
  4. Gholoubi, A.; Emami, H.; Alizadeh, A. Soil quality change 50 years after forestland conversion to tea farming. Soil Res. 2018, 56, 509–517. [Google Scholar] [CrossRef]
  5. Turner, M.G.; Romme, W.H.; Gardner, R.H.; Robert, V.O.; Timothy, K.K. A revised concept of landscape equilibrium: Disturbance and stability on scaled landscapes. Landsc. Ecol. 1993, 8, 213–227. [Google Scholar] [CrossRef]
  6. Nuissl, H.; Haase, D.; Lanzendorf, M.; Wittmer, H. Environmental impact assessment of urban land use transitions: A context-sensitive approach. Land Use Policy 2009, 26, 414–424. [Google Scholar] [CrossRef]
  7. Gustafson, E.J. Quantifying landscape spatial pattern: What is the state of the art? Ecosystems 1998, 1, 134–156. [Google Scholar] [CrossRef]
  8. Krummel, J.R.; Gardner, R.H.; Sugihara, G. Landscape patterns in a disturbed environment. Oikos 1987, 48, 321–324. [Google Scholar] [CrossRef]
  9. Turner, M.G.; Ruscher, C.L. Changes in landscape patterns in Georgia, USA. Landsc. Ecol. 1988, 1, 241–251. [Google Scholar] [CrossRef]
  10. Turner, M.G. Landscape changes in nine rural counties in Georgia. Photogramm. Eng. Remote Sens. 1990, 56, 379–386. [Google Scholar]
  11. Chen, W.B.; Xiao, D.N.; Li, X.Z. Classification, application, and creation of landscape indices. Chin. J. Appl. Ecol. 2002, 13, 121–125. [Google Scholar]
  12. Watt, A.S. Pattern and process in the plant community. J. Ecol. 1947, 35, 1–22. [Google Scholar] [CrossRef]
  13. Chi, W.F.; Shi, W.J.; Kuang, W.H. Spatio-temporal characteristics of intra-urban land cover in the cities of China and USA from 1978 to 2010. J. Geogr. Sci. 2015, 25, 3–18. [Google Scholar] [CrossRef]
  14. Fu, B.J.; Lü, Y.H.; Chen, L.D.; Su, C.H.; Yao, X.L.; Liu, Y. The latest progress of landscape ecology in the world. Acta Ecol. Sin. 2008, 28, 0798–0804. [Google Scholar]
  15. Morris, S.J.; Boerner, R.E.J. Landscape patterns of nitrogen mineralization and nitrification in southern Ohio hardwood forests. Landsc. Ecol. 1998, 13, 215–224. [Google Scholar] [CrossRef]
  16. Schwartz, N.B.; Budsock, A.M.; Uriarte, M. Fragmentation, forest structure, and topography modulate impacts of drought in a tropical forest landscape. Ecology 2019, 100, e02677. [Google Scholar] [CrossRef]
  17. Guo, C.Y.; Gao, S.; Zhou, B.Y.; Gao, J.H. Effects of land use change on ecosystem service value in Funiu Mountain based upon a grid square. Acta Ecol. Sin. 2019, 39, 3482–3493. [Google Scholar]
  18. Feng, S.; Sun, R.H.; Chen, L.D. Spatio-temporal variability of habitat quality based on land use pattern change in Beijing. Acta Ecol. Sin. 2018, 38, 4167–4179. [Google Scholar] [Green Version]
  19. Gage, E.A.; Cooper, D.J. Relationships between landscape pattern metrics, vertical structure and surface urban Heat Island formation in a Colorado suburb. Urban Ecosyst. 2017, 20, 1229–1238. [Google Scholar] [CrossRef]
  20. Zhao, Y.B.; Wang, S.J.; Zhou, C.S. Understanding the relation between urbanization and the eco-environment in China’s Yangtze River Delta using an improved EKC model and coupling analysis. Sci. Total Environ. 2016, 571, 862–875. [Google Scholar] [CrossRef]
  21. Del Castillo, E.M.; Garcia-Martin, A.; Aladren, L.A.L.; de Luis, M. Evaluation of forest cover change using remote sensing techniques and landscape metrics in Moncayo Natural Park (Spain). Appl. Geogr. 2015, 62, 247–255. [Google Scholar] [CrossRef]
  22. Recanatesi, F. Variations in land-use/land-cover changes (LULCCs) in a peri-urban Mediterranean nature reserve: The estate of Castelporziano (Central Italy). Rend. Fis. Acc. Lincei 2015, 26, 517–526. [Google Scholar] [CrossRef]
  23. Yuan, Y.; Shi, P.J.; Liu, Y.H.; Xie, F. A study on the pattern of land cover during rapid urbanization: Shenzhen City as a case study. Acta Ecol. Sin. 2003, 23, 1832–1840. [Google Scholar]
  24. Redman, C.L. Human dimensions of ecosystem studies. Ecosystems 1999, 2, 296–298. [Google Scholar] [CrossRef]
  25. Alberti, M. The effects of urban patterns on ecosystem function. Int. Reg. Sci. Rev. 2005, 28, 168–192. [Google Scholar] [CrossRef]
  26. Antrop, M. Landscape change and the urbanization process in Europe. Landsc. Urban Plan. 2004, 67, 9–26. [Google Scholar] [CrossRef]
  27. Schroter, D.; Cramer, W.; Leemans, R.; Prentice, I.C. Ecosystem Service Supply and Vulnerability to Global Change in Europe. Science 2005, 310, 1333–1337. [Google Scholar] [CrossRef] [Green Version]
  28. Briber, B.M.; Hutyra, L.R.; Reinmann, A.B.; Raciti, S.M.; Dearborn, V.K.; Holden, C.E. Tree Productivity Enhanced with Conversion from Forest to Urban Land Covers. PLoS ONE 2015, 10, e0136237. [Google Scholar] [CrossRef]
  29. Wang, J.; Zhou, W.Q.; Xu, K.P.; Yan, J.L. Spatiotemporal pattern of vegetation cover and its relationship with urbanization in Beijing-Tianjin-Hebei megaregion from 2000 to 2010. Acta Ecol. Sin. 2017, 37, 7019–7029. [Google Scholar] [Green Version]
  30. Ma, T. Spatiotemporal characteristics of urbanization in china from the perspective of remotely sensed big data of nighttime light. J. Geo-Inf. Sci. 2019, 21, 59–67. [Google Scholar]
  31. Zhou, L.M.; Dickinson, R.E.; Tian, Y.H.; Fang, J.Y.; Li, Q.X.; Kaufmann, R.K.; Tucker, C.J.; Myneni, R.B. Evidence for a significant urbanization effect on climate in China. Proc. Natl. Acad. Sci. USA 2004, 101, 9540–9544. [Google Scholar] [CrossRef] [Green Version]
  32. Bai, X.M.; McAllister, R.R.J.; Beaty, R.M.; Taylor, B. Urban policy and governance in a global environment: Complex systems, scale mismatches and public participation. Curr. Opin. Environ. Sustain. 2010, 2, 129–135. [Google Scholar] [CrossRef]
  33. Grimm, N.B.; Faeth, S.H.; Golubiewski, N.E.; Redman, C.L.; Wu, J.G.; Bai, X.; Briggs, J.M. Global change and the ecology of cities. Science 2008, 319, 756–760. [Google Scholar] [CrossRef]
  34. Jin, K.; Wang, F.; Li, P. Responses of Vegetation Cover to Environmental Change in Large Cities of China. Sustainability 2018, 10, 270. [Google Scholar] [CrossRef]
  35. Land Cover CCI Climate Research Data Package. Available online: http://maps.elie.ucl.ac.be/CCI/viewer/download.php (accessed on 10 November 2017).
  36. Li, W.; MacBean, N.; Ciais, P.; Defourny, P.; Lamarche, C.; Bontemps, S.; Houghton, R.A.; Peng, S.S. Gross and net land cover changes in the main plant functional types derived from the annual ESA CCI land cover maps (1992–2015). Earth Syst. Sci. Data 2018, 10, 219–234. [Google Scholar] [CrossRef]
  37. Luck, M.; Wu, J. A gradient analysis of urban landscape pattern: A case study from the Phoenix metropolitan region, Arizona, USA. Landsc. Ecol. 2002, 17, 327–329. [Google Scholar] [CrossRef]
  38. Hess, G.R.; Bay, J.M. Generating confidence intervals for composition-based landscape indexes. Landsc. Ecol. 1997, 12, 309–320. [Google Scholar] [CrossRef]
  39. Land Cover CCI Product User Guide Version 2.0. Available online: http://maps.elie.ucl.ac.be/CCI/viewer/download/ESACCI-LC-Ph2-PUGv2_2.0.pdf (accessed on 10 November 2017).
  40. Poulter, B.; MacBean, N.; Hartley, A.; Khlystova, I.; Arino, O.; Betts, R.; Bontemps, S.; Boettcher, M.; Brockmann, C.; Defourny, P.; et al. Plant functional type classification for earth system models: Results from the European Space Agency’s Land Cover Climate Change Initiative. Geosci. Model Dev. 2015, 8, 2315–2328. [Google Scholar] [CrossRef]
  41. National Bureau of Statistics of China. Available online: http://data.stats.gov.cn/easyquery.htm?cn=C01 (accessed on 21 November 2017).
  42. Bai, X.M.; Shi, P.J.; Liu, Y.S. Realizing China’s urban dream. Nature 2014, 509, 158–160. [Google Scholar] [CrossRef]
  43. Chen, M.X.; Liu, W.D.; Tao, X.L. Evolution and assessment on China’s urbanization 1960-2010: Under-urbanization or over-urbanization? Habitat Int. 2013, 38, 25–33. [Google Scholar] [CrossRef]
  44. Cui, Y.; Liu, J.; Xu, X.; Dong, J.; Li, N.; Fu, Y.; Lu, S.; Xia, H.; Si, B.; Xiao, X. Accelerating Cities in an Unsustainable Landscape: Urban Expansion and Cropland Occupation in China, 1990–2030. Sustainability 2019, 11, 2283. [Google Scholar] [CrossRef]
  45. Morton, D.C.; DeFries, R.S.; Shimabukuro, Y.E.; Anderson, L.O.; Arai, E.; Espirito-Santo, F.D.B.; Freitas, R.; Morisette, J. Cropland expansion changes deforestation dynamics in the southern Brazilian Amazon. Proc. Natl. Acad. Sci. USA 2006, 103, 14637–14641. [Google Scholar] [CrossRef] [Green Version]
  46. Ye, Y.; Fang, X.Q.; Ren, Y.Y.; Zhang, X.Z.; Chen, L. Cropland cover change in Northeast China during the past 300 years. Sci. China Ser. D Earth Sci. 2009, 52, 1172–1182. [Google Scholar] [CrossRef]
  47. Deng, X.Z.; Huang, J.K.; Rozelle, S.; Uchida, E. Cultivated land conversion and potential agricultural productivity in China. Land Use Policy 2006, 23, 372–384. [Google Scholar] [CrossRef]
  48. Xiao, D.N.; Zhao, Y.; Sun, Z.W.; Zhang, G.S. Study on the variation of landscape pattern in the western suburbs of shenyang. Appl. Ecol. 1990, 1, 75–84. [Google Scholar]
  49. Zhang, Y.X.; Guo, J.P. The Dynamics of Patch Density and Edge Density in Forested Landscape of Shanxi, China A Case Study in Guandis-han Mountain Forest District. Chin. J. Ecol. 2001, 20, 18–21. [Google Scholar]
Figure 1. The distribution of the urban groups in this study.
Sustainability 11 04451 g001
Figure 2. The overall changes of forest coverage in the urban agglomerations (i.e., (a) the Yangtze River Delta urban agglomeration, (b) the Pearl River Delta urban agglomeration, (c) the Guanzhong-Tianshui urban agglomeration and (d) the Central Plains urban agglomeration) across the study period. Different parts (i.e., “DN” the deciduous needleleaf forest, “EN” the evergreen needleleaf forest, “DB” the deciduous broadleaf forest, and the “EB” the evergreen broadleaf forest) of the stacked histogram indicate different vegetation types, and the line chart represents the change in the total forest area from 1992 to 2015.
Sustainability 11 04451 g002
Figure 3. The spatial distribution of forests in the urban agglomerations (i.e., (a) the Yangtze River Delta urban agglomeration, (b) the Pearl River Delta urban agglomeration, (c) the Guanzhong-Tianshui urban agglomeration, and (d) the Central Plains urban agglomeration) during the study period. The colors in the figure represent the frequency of occurrence of forests. The histograms show the proportion of forests in different frequencies.
Sustainability 11 04451 g003
Figure 4. The trends of forest coverage in the urban agglomerations (i.e., (a) the Yangtze River Delta urban agglomeration, (b) the Pearl River Delta urban agglomeration, (c) the Guanzhong-Tianshui urban agglomeration, and (d) the Central Plains urban agglomeration) during the study period. Pixels of Type I (yellow) and Type II (blue-green) indicate the pixels of which the forest coverage had an increase trend and a downtrend while the pixels of Type III (white) indicates where the trend is not significant or there is no trend. The histogram in the figure shows the proportion of different forest cover trends.
Sustainability 11 04451 g004
Figure 5. The transformations between forest and other vegetation types in the urban agglomerations (i.e., (a) the Yangtze River Delta urban agglomeration, (b) the Pearl River Delta urban agglomeration, (c) the Guanzhong-Tianshui urban agglomeration, and (d) the Central Plains urban agglomeration) across the study period. In the figure, the positive values of the y-axis indicate that other vegetation types were converted to forest, and the negative values indicate that the forest was converted to other vegetation types.).
Sustainability 11 04451 g005
Figure 6. Average annual amount of forests conversion from 1992 to 2015. Pixels of (a,c,e,g) indicate the average annual area of other plant types convert to forest while pixels of (b,d,f,h) indicate the average annual area of forest convert to other plant types in the YRDua, PRDua, CPua, and GTua during the 24 years.
Sustainability 11 04451 g006
Figure 7. Spatial distribution of landscape diversity. The images (a,d,g,j) indicate the spatial distribution of the SHDI values in the YRDua, PRDua, CPua, and GTua in 1992, and the images (b,e,h,k) indicate the spatial distribution of the SHDI values in the YRDua, PRDua, CPua, and GTua in 2015 while the images (c,f,i,l) indicate the difference of the SHDI values in the YRDua, PRDua, CPua, and GTua between the two years.
Sustainability 11 04451 g007
Figure 8. Changes in the urban area in the different urban agglomerations (i.e., (a) the Yangtze River Delta urban agglomeration, (b) the Pearl River Delta urban agglomeration, (c) the Guanzhong-Tianshui urban agglomeration, and (d) the Central Plains urban agglomeration) from 1992 to 2015.
Sustainability 11 04451 g008
Figure 9. Changes in the cropland area in the different urban agglomerations (i.e., (a) the Yangtze River Delta urban agglomeration, (b) the Pearl River Delta urban agglomeration, (c) the Guanzhong-Tianshui urban agglomeration, and (d) the Central Plains urban agglomeration) from 1992 to 2015.
Sustainability 11 04451 g009
Figure 10. Changes of PD, LSI, and AI in different urban agglomerations from 1992 to 2015.
Sustainability 11 04451 g010
Table 1. PFT classification table.
Class 1Class 2Class 1Class 2
TreeEvergreen BroadleafGrassGrass
Deciduous Broadleaf
Evergreen NeedleleafCropNatural Crop
Deciduous Needleleaf
ShrubEvergreen BroadleafNon-VegetatedBare Soil
Deciduous Broadleaf Water
Evergreen Needleleaf Snow/Ice
Deciduous Needleleaf Urban
Table 2. The select landscape indices.
IndexFormulaDescription
SHDI S H D I = i = 1 m ( p i   l n   p i ) measurement of landscape diversity
PD P D = n i / A reflections of patch fragmentation
LSI L S I = 0.25 E / A reflections of patch shape complexity
AI A I = [ g i i m a x g i i ] × 10 0reflections of patch aggregation degree

