Article

Predicting First-Year College Student Retention: Validation of the College Persistence Questionnaire in a Spanish Sample

by
Rafael García-Ros
1,
Francisco Pérez-Gónzalez
1,
María Castillo Fuentes
2 and
Francisco Cavas-Martínez
3,*
1
Department of Developmental and Educational Psychology, University of Valencia, 46010 Valencia, Spain
2
Department of Behavioral Sciences Methodology, University of Valencia, 46010 Valencia, Spain
3
Department of Structures, Construction and Graphical Expression, Technical University of Cartagena, 30202 Cartagena, Spain
*
Author to whom correspondence should be addressed.
Sustainability 2019, 11(16), 4425; https://doi.org/10.3390/su11164425
Submission received: 18 July 2019 / Revised: 13 August 2019 / Accepted: 13 August 2019 / Published: 16 August 2019

Abstract

:
This paper analyzes the factorial and predictive validity of a Spanish adaptation of the College Persistence Questionnaire (SCPQ) on the retention of first year students (FYS) at university. The participants were 490 FYS from two public universities in Southern Europe (Spain). Factorial analysis of the SCPQ (χ2/gl = 1.66, CFI = 0.92, NNFI = 0.91, RMSEA = 0.04) showed six reliable dimensions, similar to those found in the original study: Academic Integration, Social Integration, Supportive Services Satisfaction, Academic Conscientiousness, Degree Commitment and Institutional Commitment. Logistic regression showed that institutional commitment significantly predicted FYS’ permanence. The results support SCPQ’s validity as an adequate and useful tool for assessing FYS’ academic experiences involved in student retention.

1. Introduction

Higher Education institutions around the world are concerned about students’ permanence and academic success. In the North American context, only 40.3% of college students complete their degree, and 28–35% drop out of postsecondary education in their first year [1]. In Spain, the system is also inefficient, and more than 50% of dropouts occur in the first year of university [2,3,4]. Thus, a large number of studies have been designed to predict permanence between university freshman and sophomore year or student retention [5,6,7].
More traditional studies analyze the predictive capacity of students’ pre-university variables on academic success, concluding that High School GPA (HSGPA) results on standardized achievement tests (SAT-ACT) and socioeconomic status are significant predictors of first year students’ (FYS) achievement and permanence until graduation [8]. Another broad set of studies analyze the predictive capacity of students’ socio-personal characteristics (e.g., personality, learning styles and strategies), contextual influences (e.g., family support, financial difficulties), FYS experience variables (e.g., academic and social integration), and the effectiveness of actions taken by universities to foment students’ learning and involvement [9,10,11]. Recent meta-analytical studies highlight the incremental validity of these variables on precedents predicting both academic achievement and permanence [12,13,14].
From this latter perspective, Davidson, Beck and Milligan [15] developed and validated the College Persistence Questionnaire (CPQ), showing its psychometric adequacy and predictive capacity on student retention, as well as its incremental validity regarding HSGPA and SAT-ACT scores. The dimensions incorporated into the final predictive model for permanence were Institutional Commitment, Student’s High School Rank, Academic Conscientiousness and Academic Integration. Gore [16] and Lindheimer III [17] also showed the structural validity and predictive capacity of the CPQ on student retention.
The CPQ is currently a basic reference in the research on retention and persistence in university [15,18,19,20,21]. These studies focus both on determining its relationship with different psychoeducational constructs (e.g., psychological well-being [22], basic needs -competence, relatedness and autonomy- [23], academic and social overload [24], cultural intelligence [25], dropping out of post-graduate studies [5,26,27]), and on evaluating the effectiveness of different intervention programs at the university [28,29]. Moreover, its simplicity and ease of application have contributed to its use by more than 40 universities seeking to evaluate the adequacy and quality of the FYS university experiences stemming from the student’s interaction with the institution’s academic and social environment [10].
Thus, from the perspective of providing necessary conditions and services for first-year university students’ success, and in order to have tools with contrasted validity and efficacy that can evaluate FYS experience dimensions involved in retention and permanence in Spanish degrees and facilitate the development of corresponding intervention programs, we propose the Spanish adaptation and validation of the College Persistence Questionnaire (SCPQ) in the Spanish FYS university population. More specifically, we intend to analyze its factorial structure, psychometric characteristics, and capacity to predict student retention.

2. Materials and Methods

2.1. Participants

The participants were 490 FYS from two public Spanish universities during the 2012–2013 academic year. The distribution by sex was 276 females (52.3%) and 214 males (43.7%), with an average age of 18.47 years (SD = 1.77, range 18–30 years). Both the sex and age distributions of the sample reflect what is generally found in these particular degree programs. 85.5% re-enrolled in the 2013–2014 academic year as sophomores.

2.2. Measures

The CPQ is a self-reported instrument that integrates 34 items evaluating six dimensions: (a) academic integration (8 items; e.g., “How concerned about your intellectual growth are the faculty here?”, α = 0.81); (b) social integration (8 items; e.g., “How much do you think you have in common with other students here?”, α = 0.82); (c) supportive services satisfaction (6 items; e.g., “How fairly do you think students are treated here?”, α = 0.74); (d) institutional commitment (4 items; e.g., “How confident are you that this is the right university for you?”, α = 0.78); (e) degree commitment (5 items; e.g., “At this point in time, how certain are you that you will earn a degree?”, α = 0.78); and (f) academic conscientiousness (3 items; e.g., “I am not interested in academic work and do as little as possible”, α = 0.63). The items are answered on a 5-point Likert-type scale ranging from 1 = “very dissatisfied”, to 5 = “very satisfied”.
Students’ socio-demographic variables (gender and entrance age) were also considered in this study. The response variable considered was Permanence (PER), defined by whether or not students enrol in the second year of the degree program. Socio-demographic and permanence data were provided by the Information Systems Services of both universities.

2.3. Procedure

Before undertaking the research, the study was reviewed and approved by the Ethics Committee of the University of Valencia. The CPQ was translated into Spanish using back-translation design [30]. The definitive version of the SCPQ adaptation was applied collectively in the first three weeks of the second trimester of the school year in the students’ normal classrooms. Participation was voluntary.
According to the Declaration of Helsinki, the students provided their informed consent after the study objectives had been explained to them. The confidentiality of the information was emphasized, as well as its exclusive use for research purposes and for consideration in improving the services of FYS’ university programs.

2.4. Analysis

First, in order to analyze whether the original CPQ six-factor structure proposed by Davidson et al. [31] show a good fit for the Spanish data, a Confirmatory Factor Analysis was performed using EQS 6.1 program.
The original six-factor oblique model was tested since these dimensions are correlated in explaining FYS retention [31]. For that, the robust procedure was applied as estimation method, using the Satorra-Bentler Scaled Chi-square (SB-χ2) [32], which is specifically recommended for the analysis of multivariate non-normal data [33].
Furthermore, other robust indices were used: The comparative fit index (CFI) [34], the non-normed fit index (NNFI) [34] and the root mean square error of approximation (RMSEA) [35] with a confidence interval of 90%. For CFI and NNFI, values >0.95 indicate a good fit and values >0.90, an acceptable fit [35,36]. For RMSEA, values <0.05 indicate a good fit, values between 0.05 and 0.08 indicate an acceptable fit, and values >0.08, a poor fit [37].
After that, considering the CPQ scales and students’ socio-demographic variables, a logistic regression analysis was applied in order to analyze their predictive validity on student retention.

3. Results

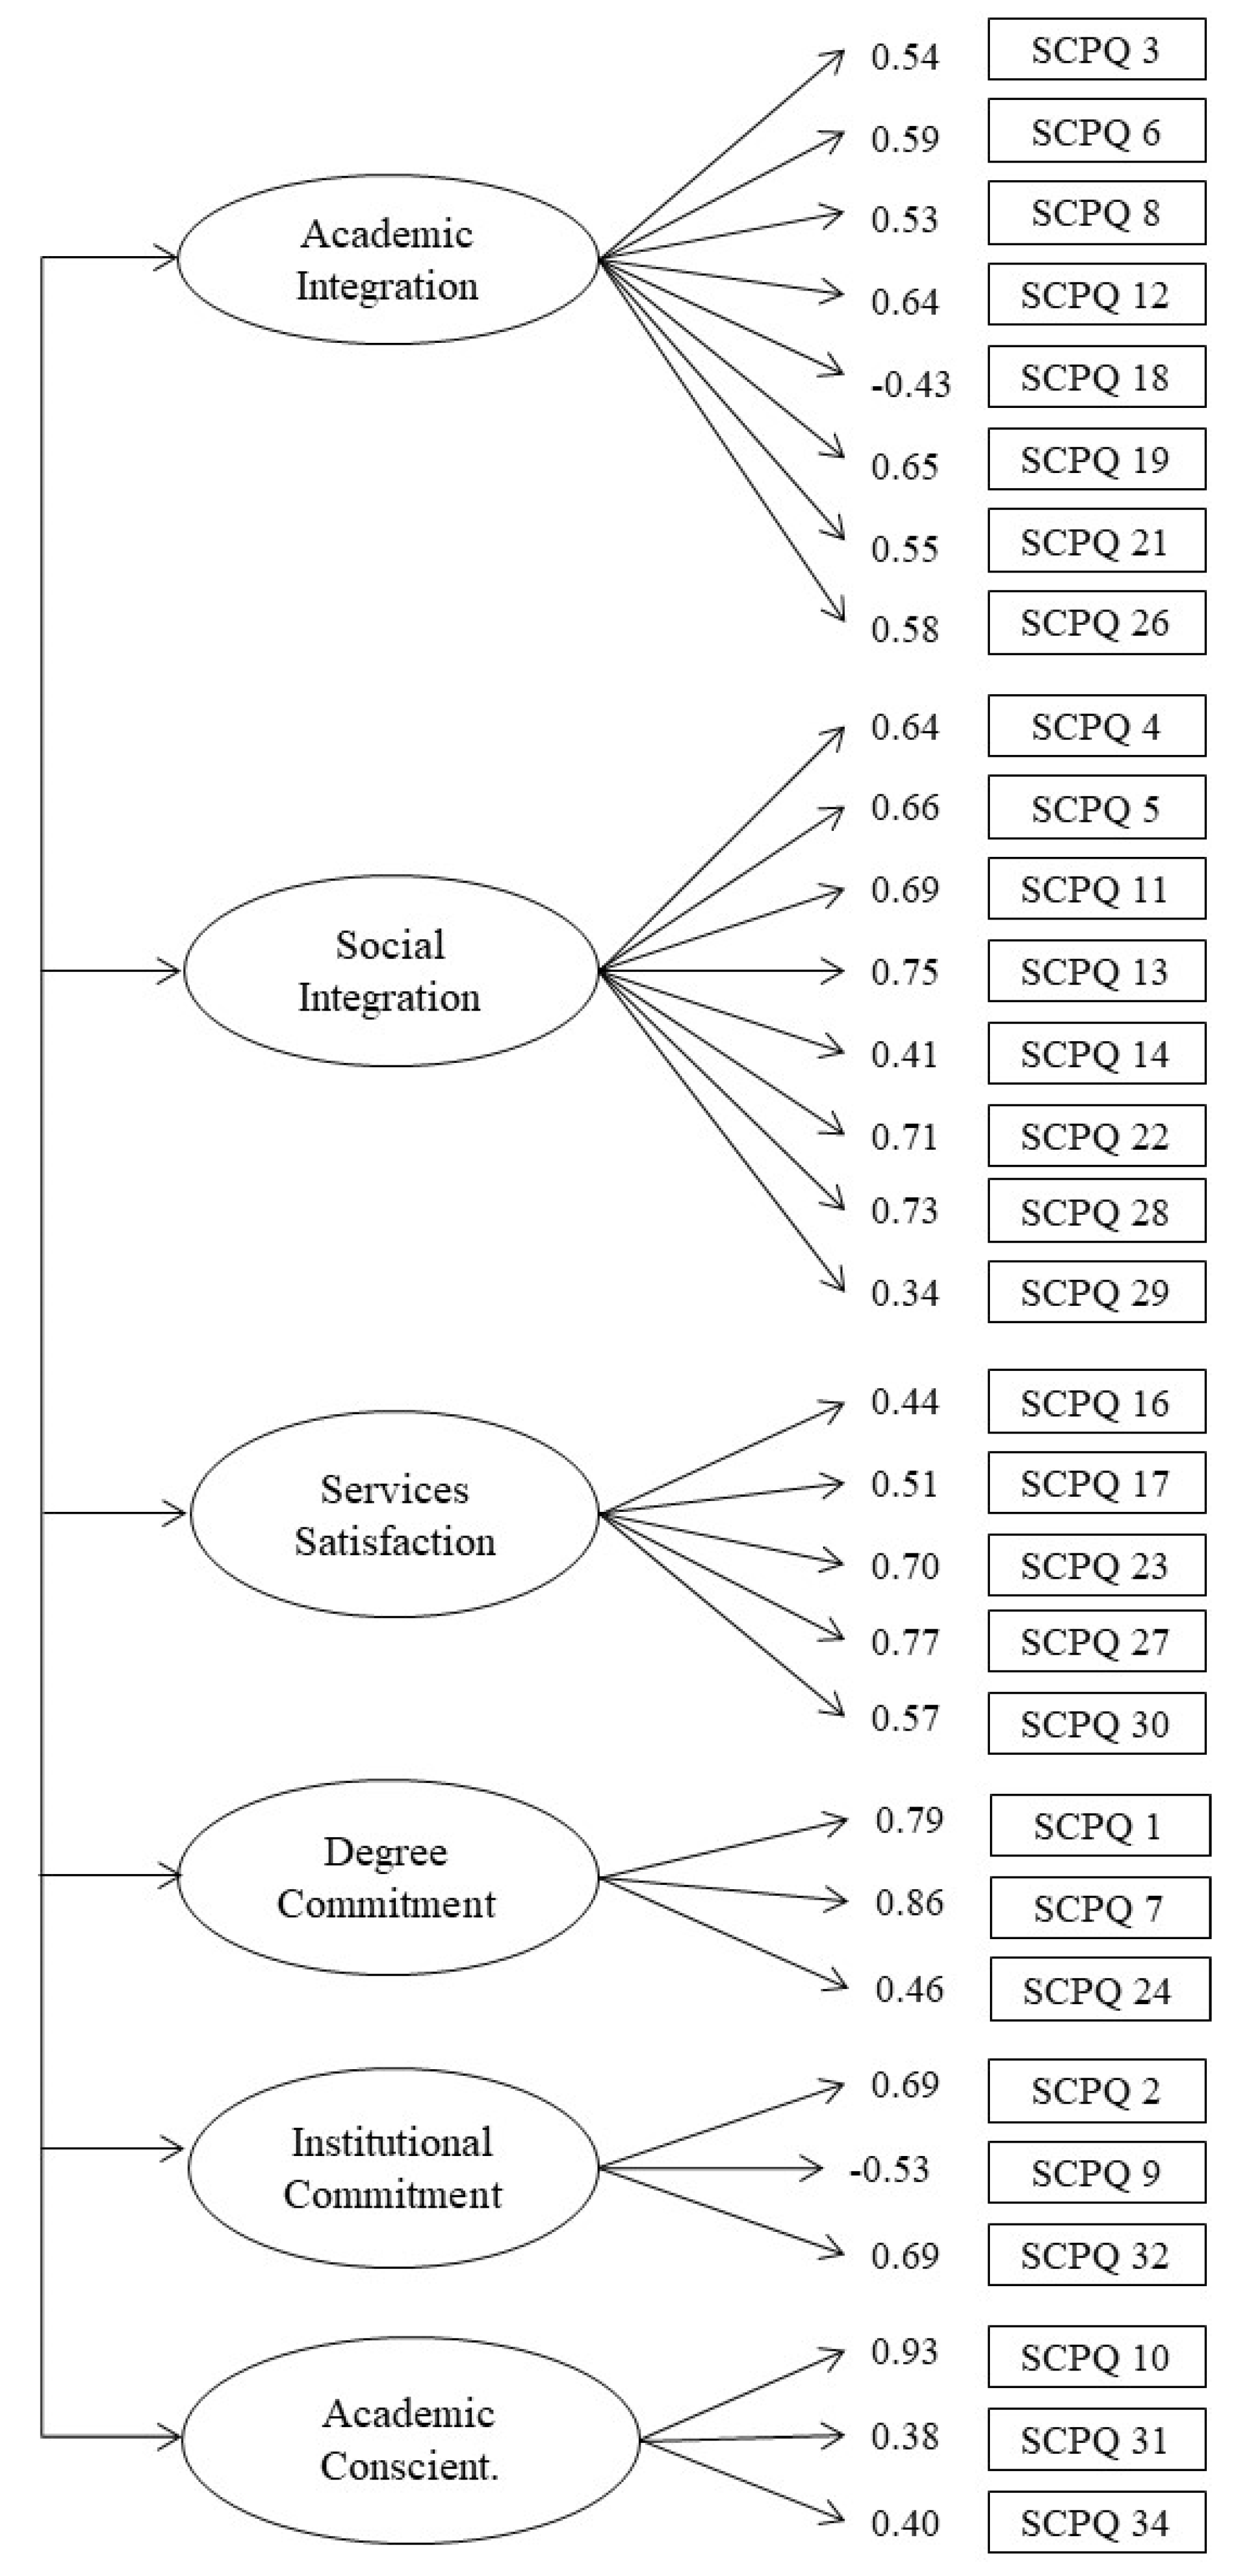
3.1. Factor Structure

Preliminary item analysis showed some problems of skewness and kurtosis, indicating absence of multivariate normality [32]. Results from CFA showed that the oblique six-factor 34-item model proposed by Davidson et al. [31] was not supported by all the fit indices considered.
Although SB-χ2 ratio values and RMSEA showed a plausible fit to the model, the CFI and NNFI values suggested that the model fit is inadequate: SB-χ2507 = 1113.23, p < 0.001, CFI = 0.85, NNFI = 0.83, RMSEA = 0.05 [0.05–0.06]. Model trimming then consisted of removing the weakest path coefficients from the original model, which included four items (15, 20, 25 and 33).
Removal of these items produces a six-factor oblique model for the Spanish data (SCPQ) that was supported by all the fit indices: SB-χ2386 = 642.08, p < 0.001, CFI = 0.92, NNFI = 0.91, RMSEA = 0.04 [0.03–0.04] (for clarity, errors are not shown and correlations among factors are shown in Table 1; see Figure 1).

3.2. Psychometric Properties

Table 1 shows the descriptive statistics, levels of association and internal consistency (Cronbach’ alpha) for the scales of the SCPQ. Results indicated a good reliability of the SCPQ scales, showing no large variations with respect to the original structure in the Social Integration, Supportive Services Satisfaction, Institutional Commitment and Academic Conscientiousness scales. Cronbach alpha in the Degree Commitment scale increases from 0.65 in the original CPQ structure to 0.70 in the SCPQ.

3.3. SCPQ and Permanence

In order to determine the predictive validity of the SCPQ on permanence, a logistic regression analysis was carried out. The variables were introduced in two blocks. Block 1 considers the variables Gender and Entrance Age, and Block 2 also considers the SCPQ dimensions. No significant relationship was found between Permanence and Gender (χ21 = 3.11; p = 0.08, VCramer = 0.08), and Permanence and Entrance age (t444 = −0.27, p < 0.97, d = 0.02). Regarding the SCPQ dimensions, the students who continued their studies show significantly higher scores on Academic Integration (t448 = −3.42, p < 0.001, d = 0.56), Social Integration (t448 = −3.39, p < 0.001, d = 0.58), Degree Commitment (t448 = −4.54, p < 0.001, d = 0.65), Institutional Commitment (t448 = −8.61, p < 0.001, d = 1.40), and lower scores in Academic Conscientiousness (t448 = 3.23, p < 0.001, d = −0.51). No significant differences were obtained on Supportive Services Satisfaction (t448 = −1.12, p < 0.26, d = 0.18).
The final model shows a significant global fit (χ21 = 56.49, p < 0.001), and the explanatory capacity of Block 2 was significantly superior to that of Block 1 (χ26 = 53.53, p < 0.001). The percentage of variance in Permanence explained by Block 1 is 0.04, while the additional consideration of the SCPQ dimensions allows it to reach a value of 0.28. The final model makes it possible to correctly classify 82.5% of all the cases in the response variable (χ28 Hosmer-Lemeshow = 5.61, p = 0.69), showing a sensitivity of 68.8% to detect subjects who do not persist in their studies and a specificity of 83.7% to identify subjects who do continue with them. The statistical modeling process led to a final model (see Table 2) that includes only the main effects of Institutional Commitment, revealing that permanence in is significantly more pronounced among students with higher levels in this dimension.

4. Discussion and Conclusions

The basic objective of this study was to adapt and validate the SCPQ through its application to a sample of FYS in two Spanish universities. The results showed the factorial validity and psychometric adequacy of the SCPQ, obtaining an underlying structure quite similar to the original proposed by Davidson et al. [31]. More specifically, after removing four items of the original scale, the AFC highlights that the six-factor oblique model corresponding to its original structure—Academic integration, Social Integration, Supportive Services Satisfaction, Degree Commitment, Institutional Commitment and Academic Conscientiousness—showed a satisfactory fit to the data. The results also show the psychometric adequacy of the SCPQ, given that the set of subscales presents satisfactory levels of internal consistency, with the exception of Academic Conscientiousness, which obtained a value of 0.66, although it is slightly higher than the one described in the original study. Moreover, the levels of association among the subscales are similar to those found in previous studies [16,17,31].
Furthermore, significant relationships were obtained in the expected direction between practically all of the dimensions of the SCPQ and Permanence. However, as in the original studies, the levels of association are reduced, with the dimension of Institutional Commitment reaching the highest value. Both results are congruent with the previous research [10,31].
The second objective of this study was to determine the predictive validity of the psychosocial dimensions evaluated through the SCPQ. The results show their predictive and incremental validity on the socio-demographic variables considered, together explaining 28% of the variance in the Permanence between the first and second years of university studies, and making it possible to correctly classify 82% of all the cases in the response variable. These results obtained are higher than those found by Davidson et al. [31] in their study with students in the US, where these variables explain 23% of the variance in permanence and make it possible to correctly classify 66% of the students. More specifically, the statistical modeling process highlight the relevance of Institutional Commitment, a unique dimension that is introduced in the final predictive model obtained.
Given that the SCPQ evaluates a wide range of experiential dimensions, and the factors that predict persistence in university studies can vary between institutions [8], this tool can be especially useful in the early identification of subjects at risk of dropping out or changing majors, in designing proposed actions for promoting permanence in them, and in evaluating the effectiveness of the measures taken to improve the psychosocial dimensions related to this phenomenon.
The limitations of the study are related to its cross-sectional nature, the relative small sample size, and the fact that these measures were administered at a specific time point in the academic year. Future studies should be carried out with broader and more representative samples, also considering more academic institutions and different university cohorts. On the other hand, future studies must consider other socio-demographic and pre-university variables—many of them available in the databases of the universities themselves (e.g., family socioeconomic and educational level, preference, dedication to study, minority groups, modality of university access, entrance grade), and different characteristics, cognitive skills and motivational dimensions of the students (e.g., self-regulated learning, academic stress and coping strategies, social support, academic goals, personality) in order to obtain a more comprehensive view of student retention, increase capacity to predict academic success at university, improve services provided to students, and adjust interventions to the specific needs of different groups of subjects [10]. Lastly, other SCPQ psychometric characteristics should be studied with a longitudinal (time-related) perspective, including the temporal stability of the scale and the stability of the factor structure along time, a stability that is needed in order to make meaningful comparisons among time points (e.g., when psycho-educational intervention effects are to be analyzed) [38]. Moreover, in spite of the importance of having tools with contrasted validity and reliability to evaluate dimensions related to persistence in university studies, it should be kept in mind that both the theoretical models of reference and the requirements of psycho-educational intervention emphasize the need to consider temporal relations and cause-effect between variables. Future studies will have to address these questions in our context, always from the perspective of responding to the growing demand to improve the efficacy of the services, programs and actions undertaken by universities to foment students’ academic success [39].
In any case, the present study provides evidence on the factorial validity, psychometric adequacy and predictive validity of the SCPQ on student retention, confirming its original structure [16,17,31]. On the other hand, according to previous research, the results highlighting that Institutional Commitment is an important predictor of student retention also show its significant relationship with the other dimensions assessed by the SCPQ. Thus, these results emphasize (a) that universities must foster students’ sense of belonging and identification with their degree and university (Institutional Commitment), and (b) there may be different student profiles that can explain the students’ lack of institutional commitment, making it possible to adjust interventions to the students’ specific needs [10,15]. For example, students’ lack of institutional commitment may be explained by their negative evaluation of the curriculum or teaching quality in their degree (Academic Integration), the low value they give to obtaining the degree (Degree Commitment), or any combination of the different SCPQ’ dimensions. This information can be especially useful for designing action proposals to meet different students’ specific needs, while providing academic and institutional decision-makers with valuable information about the strengths and weaknesses of services and programs directed toward fostering students’ academic involvement and success [5,24].

Author Contributions

Contributions: R.G.-R., F.C.-M and F.P.-G. designed the experiments, which were later executed by R.G.-R and F.C.-M. The analysis of the obtained data was performed by R.G.-R. and M.C.F. Finally, all authors contributed to the writing of the manuscript.

Funding

This research was partially funded by the University of Valencia, grant number SFPIE_DOCE12-79415.

Conflicts of Interest

The authors declare no conflict of interest.

References

  1. Alarcon, G.M.; Edwards, J.M. Ability and motivation: Assessing individual factors that contribute to university retention. J. Educ. Psychol. 2013, 105, 129–137. [Google Scholar] [CrossRef]
  2. García-Ros, R.; Pérez-González, F. Validez predictiva e incremental de las habilidades de autorregulación sobre el éxito académico en la universidad. Revista de Psicodidáctica 2011, 16, 231–250. [Google Scholar]
  3. Lassibille, G.; Gómez, M.L.N. Why do higher education students drop out? Evidence from spain. Educ. Econ. 2008, 16, 89–105. [Google Scholar] [CrossRef]
  4. Lassibille, G.; Gómez, M.L.N. Tracking students‘ progress through the spanish university school sector. High. Educ. 2009, 58, 821–839. [Google Scholar] [CrossRef]
  5. García-Ros, R.; Pérez-González, F.; Cavas-Martínez, F.; Tomás, J.M. Effects of pre-college variables and first-year engineering students’ experiences on academic achievement and retention: A structural model. Int. J. Technol. Des. Educ. 2018, 1–14. (in press). [Google Scholar]
  6. García-Ros, R.; Pérez-González, F.; Pérez-Blasco, J.; Natividad, L.A. Academic stress in first-year college students. Rev. Latinoam. de Psicol. 2012, 44, 143–154. [Google Scholar]
  7. Kitsantas, A.; Winsler, A.; Huie, F. Self-regulation and ability predictors of academic success during college: A predictive validity study. J. Adv. Acad. 2008, 20, 42–68. [Google Scholar] [CrossRef]
  8. Crissman, J.L.; Upcraft, M.L. The keys to first-year student persistence In Challenging and Supporting the First-Year Student: A handbook for Improving the First Year of College; Upcrafet, M.G.J., Betsy, O., Eds.; Wiley: Hobokem, NJ, USA, 2004; p. 640. [Google Scholar]
  9. Al-Daghri, N.M.; Al-Othman, A.; Albanyan, A.; Al-Attas, O.S.; Alokail, M.S.; Sabico, S.; Chrousos, G.P. Perceived stress scores among saudi students entering universities: A prospective study during the first year of university life. Int. J. Environ. Res. Public Health 2014, 11, 3972–3981. [Google Scholar] [CrossRef] [PubMed]
  10. Davidson, W.B.; Beck, H.P.; Grisaffe, D.B. Increasing the institutional commitment of college students: Enhanced measurement and test of a nomological model. J. Coll. Stud. Retent. Res. Theory Pract. 2015, 17, 162–185. [Google Scholar] [CrossRef]
  11. Kontoangelos, K.; Tsiori, S.; Koundi, K.; Pappa, X.; Sakkas, P.; Papageorgiou, C.C. Greek college students and psychopathology: New insights. Int. J. Environ. Res. Public Health 2015, 12, 4709–4725. [Google Scholar] [CrossRef]
  12. Lotkowski, V.A.R.S.B.; Noeth, R.J. The Role of Academic and Non-Academic Factors in 20 Improving College Retention; ACT Policy Report: Iowa City, IA, USA, 2004; p. 41. [Google Scholar]
  13. Richardson, M.; Abraham, C.; Bond, R. Psychological correlates of university students‘ academic performance: A systematic review and meta-analysis. Psychol. Bull. 2012, 138, 353–387. [Google Scholar] [CrossRef] [PubMed]
  14. Robbins, S.B.; Lauver, K.; Le, H.; Davis, D.; Langley, R.; Carlstrom, A. Do psychosocial and study skill factors predict college outcomes? A meta-analysis. Psychol. Bull. 2004, 130, 261–288. [Google Scholar] [CrossRef] [PubMed]
  15. Beck, H.P.; Milligan, M. Factors influencing the institutional commitment of online students. Internet High. Educ. 2014, 20, 51–56. [Google Scholar] [CrossRef]
  16. Gore, J.N. The Importance of Freshman Experiences in Predicting Students’ Retention Decisions; Appalachian State University: Raleigh, NC, USA, 2010. [Google Scholar]
  17. Lindheimer, J.B., III. The College Persistence Questionnaire: Developing Scales to Assess Student Retention and Institutional Effectiveness; Appalachian State University: Raleigh, NC, USA, 2011. [Google Scholar]
  18. Donnelly, J.E. Use of a web-based academic alert system for identification of underachieving students at an urban research institution. Coll. Univ. 2010, 85, 4. [Google Scholar]
  19. Muller, K.; Feuer, F.; Nyman, M.; Sokolowski, K.; Squadere, J.; Rotella, L. Examining predictors of first year college student retention. New York J. Stud. Aff. 2017, 17, 3–14. [Google Scholar]
  20. Pugh, J.D.; Cramer, J.H.; Slatyer, S.; Twigg, D.E.; Robinson, M. Adaptation and pretesting of the college persistence questionnaire v3 (short form) for measuring intention to persist among aboriginal diploma of nursing students. Nurse Educ. Today 2018, 61, 162–168. [Google Scholar] [CrossRef] [PubMed]
  21. Swecker, H.K.; Fifolt, M.; Searby, L. Academic advising and first-generation college students: A quantitative study on student retention. NACADA J. 2013, 33, 46–53. [Google Scholar] [CrossRef]
  22. Hutt, R. The Influence of Environmental and Psychological Factors on University Attrition; Pace University, ETD Collection for Pace University: New York, NY, USA, 2012. [Google Scholar]
  23. Davidson, W.; Beck, H.P. Analyzing the commitment of college students using a brief, contextualized measure of need satisfaction from the perspective of self-determination theory. Psychol. Rep. 2019, 122, 1145–1166. [Google Scholar] [CrossRef]
  24. García-Ros, R.; Pérez-González, F.; Cavas-Martínez, F.; Tomás, J.M. Social interaction learning strategies, motivation, first-year students’ experiences and permanence in university studies. Educ. Psychol. 2018, 38, 451–469. [Google Scholar] [CrossRef]
  25. Adams, S.M. Factors that Predict Persistence for Non-Immigrant, International Students at a Private, Four-Year University in Georgia; Liberty University: Lynchburg, VA, USA, 2017. [Google Scholar]
  26. Arbona, C. Ethnic minority status stress, self-efficacy, and persistence intentions among hispanic college women: A moderation analysis. J. Psychol. Behav. Sci. 2016, 4, 11–22. [Google Scholar] [CrossRef]
  27. Cadle, C. Effects of Using a Neuroeducational Intervention to Enhance Perseverance for Online Edd and Eds Students; Liberty University, Dissertations and Projects: Lynchburg, VA, USA, 2013. [Google Scholar]
  28. Burbach, M.E.M.S. Assessing retention in two fre natural resource orientation courses. Available online: https://digitalcommons.unl.edu/cgi/viewcontent.cgi?article=1033&context=dberspeakers (accessed on 16 August 2019).
  29. Mancini, O. Attrition risk and resilience among sexual minority college students. Columbia Soc. Work Rev. 2011, 2, 22. [Google Scholar]
  30. Balluerka, N.; Gorostiaga, A.; Alonso-Arbiol, I.; Haranburu, M. Test adaptation to other cultures: A practical approach. Psicothema 2007, 19, 124–133. [Google Scholar] [PubMed]
  31. Davidson, W.B.; Beck, H.P.; Milligan, M. The college persistence questionnaire: Development and validation of an instrument that predicts student attrition. J. Coll. Stud. Dev. 2009, 50, 373–390. [Google Scholar] [CrossRef]
  32. Satorra, A.; Bentler, P.M. A scaled difference chi-square test statistic for moment structure analysis. Psychometrika 2001, 66, 507–514. [Google Scholar] [CrossRef] [Green Version]
  33. Curran, P.J.; West, S.G.; Finch, J.F. The robustness of test statistics to nonnormality and specification error in confirmatory factor analysis. Am. Psychol. Assoc. US 1996, 1, 16–29. [Google Scholar] [CrossRef]
  34. Bentler, P.M. Comparative fit indexes in structural models. Psychol. Bull. 1990, 107, 238–246. [Google Scholar] [CrossRef] [PubMed]
  35. Hu, L.T.; Bentler, P.M. Cutoff criteria for fit indexes in covariance structure analysis: Conventional criteria versus new alternatives. Struct. Equ. Modeling 1999, 6, 1–55. [Google Scholar] [CrossRef]
  36. Marsh, H.W.; Hau, K. Assessing goodness of fit: Is parsimony always desirable? J. Exp. Educ. 1996, 64, 364–390. [Google Scholar] [CrossRef]
  37. Browne, M.W.; Cudeck, R. Alternative ways of assessing model fit. Sociol. Methods Res. 1992, 21, 230–258. [Google Scholar] [CrossRef]
  38. Tomás, J.M.; de los Santos, S.; Georgieva, S.; Enrique, S. Utrecht Work Engagement Scale in Dominican Teachers: Dimensionality, Reliability, and Validity. J. Work Organ. Psychol. 2018, 34, 89–93. [Google Scholar] [CrossRef] [Green Version]
  39. Zepke, N.; Leach, L. Integration and adaptation: Approaches to the student retention and achievement puzzle. Act. Learn. High. Educ. 2005, 6, 46–59. [Google Scholar] [CrossRef]
Figure 1. Standardized factor loadings for the SCPQ factors.
Sustainability 11 04425 g001
Table 1. Correlations and internal consistency (Cronbach’ alpha in the diagonal). Means (M), SD (standard deviation).
DimensionsMSD123456
1. AI3.600.580.77
2. SI3.580.680.31 ***0.83
3. SS3.530.660.46 ***0.36 ***0.73
4. DC4.610.590.33 ***0.26 ***0.25 ***0.70
5. IC4.090.870.32 ***0.26 ***0.23 ***0.45 ***0.70
6. AC1.890.83−0.38 ***−0.20 ***−0.18 ***−0.35 ***−0.32 ***0.66
Note: AI = Academic Integration, SI = Social Integration, SS = Services Satisfaction, DG = Degree Commitment, IC = Institutional Commitment, AC = Academic Conscientiousness, *** p < 0.001.
Table 2. Logistic regression analysis of permanence.
Exp (β)IC 95% Exp (β)χ2 Waldglp
Intercept0.16 0.9510.30
Gender *
  Male0.77[0.33–1.80]0.3510.55
Entrance Age0.99[0.90–1.10]0.0610.81
Academic Integration1.04[0.93–1.14]0.3410.56
Social Integration1.04[0.96–1.13]1.1210.29
Services Satisfaction0.91[0.79–1.05]1.6110.21
Degree Commitment1.03[0.86–1.24]0.1310.71
Institutional Commitment1.48[1.28–1.71]27.9710.001
Academic Conscientiousness0.96[0.83–1.12]0.2610.96
* Categories of reference: Gender→Female.

