Use of Intensity Analysis to Characterize Land Use/Cover Change in the Biggest Island of Persian Gulf, Qeshm Island, Iran


Abstract
1. Introduction
2. Materials and Methods
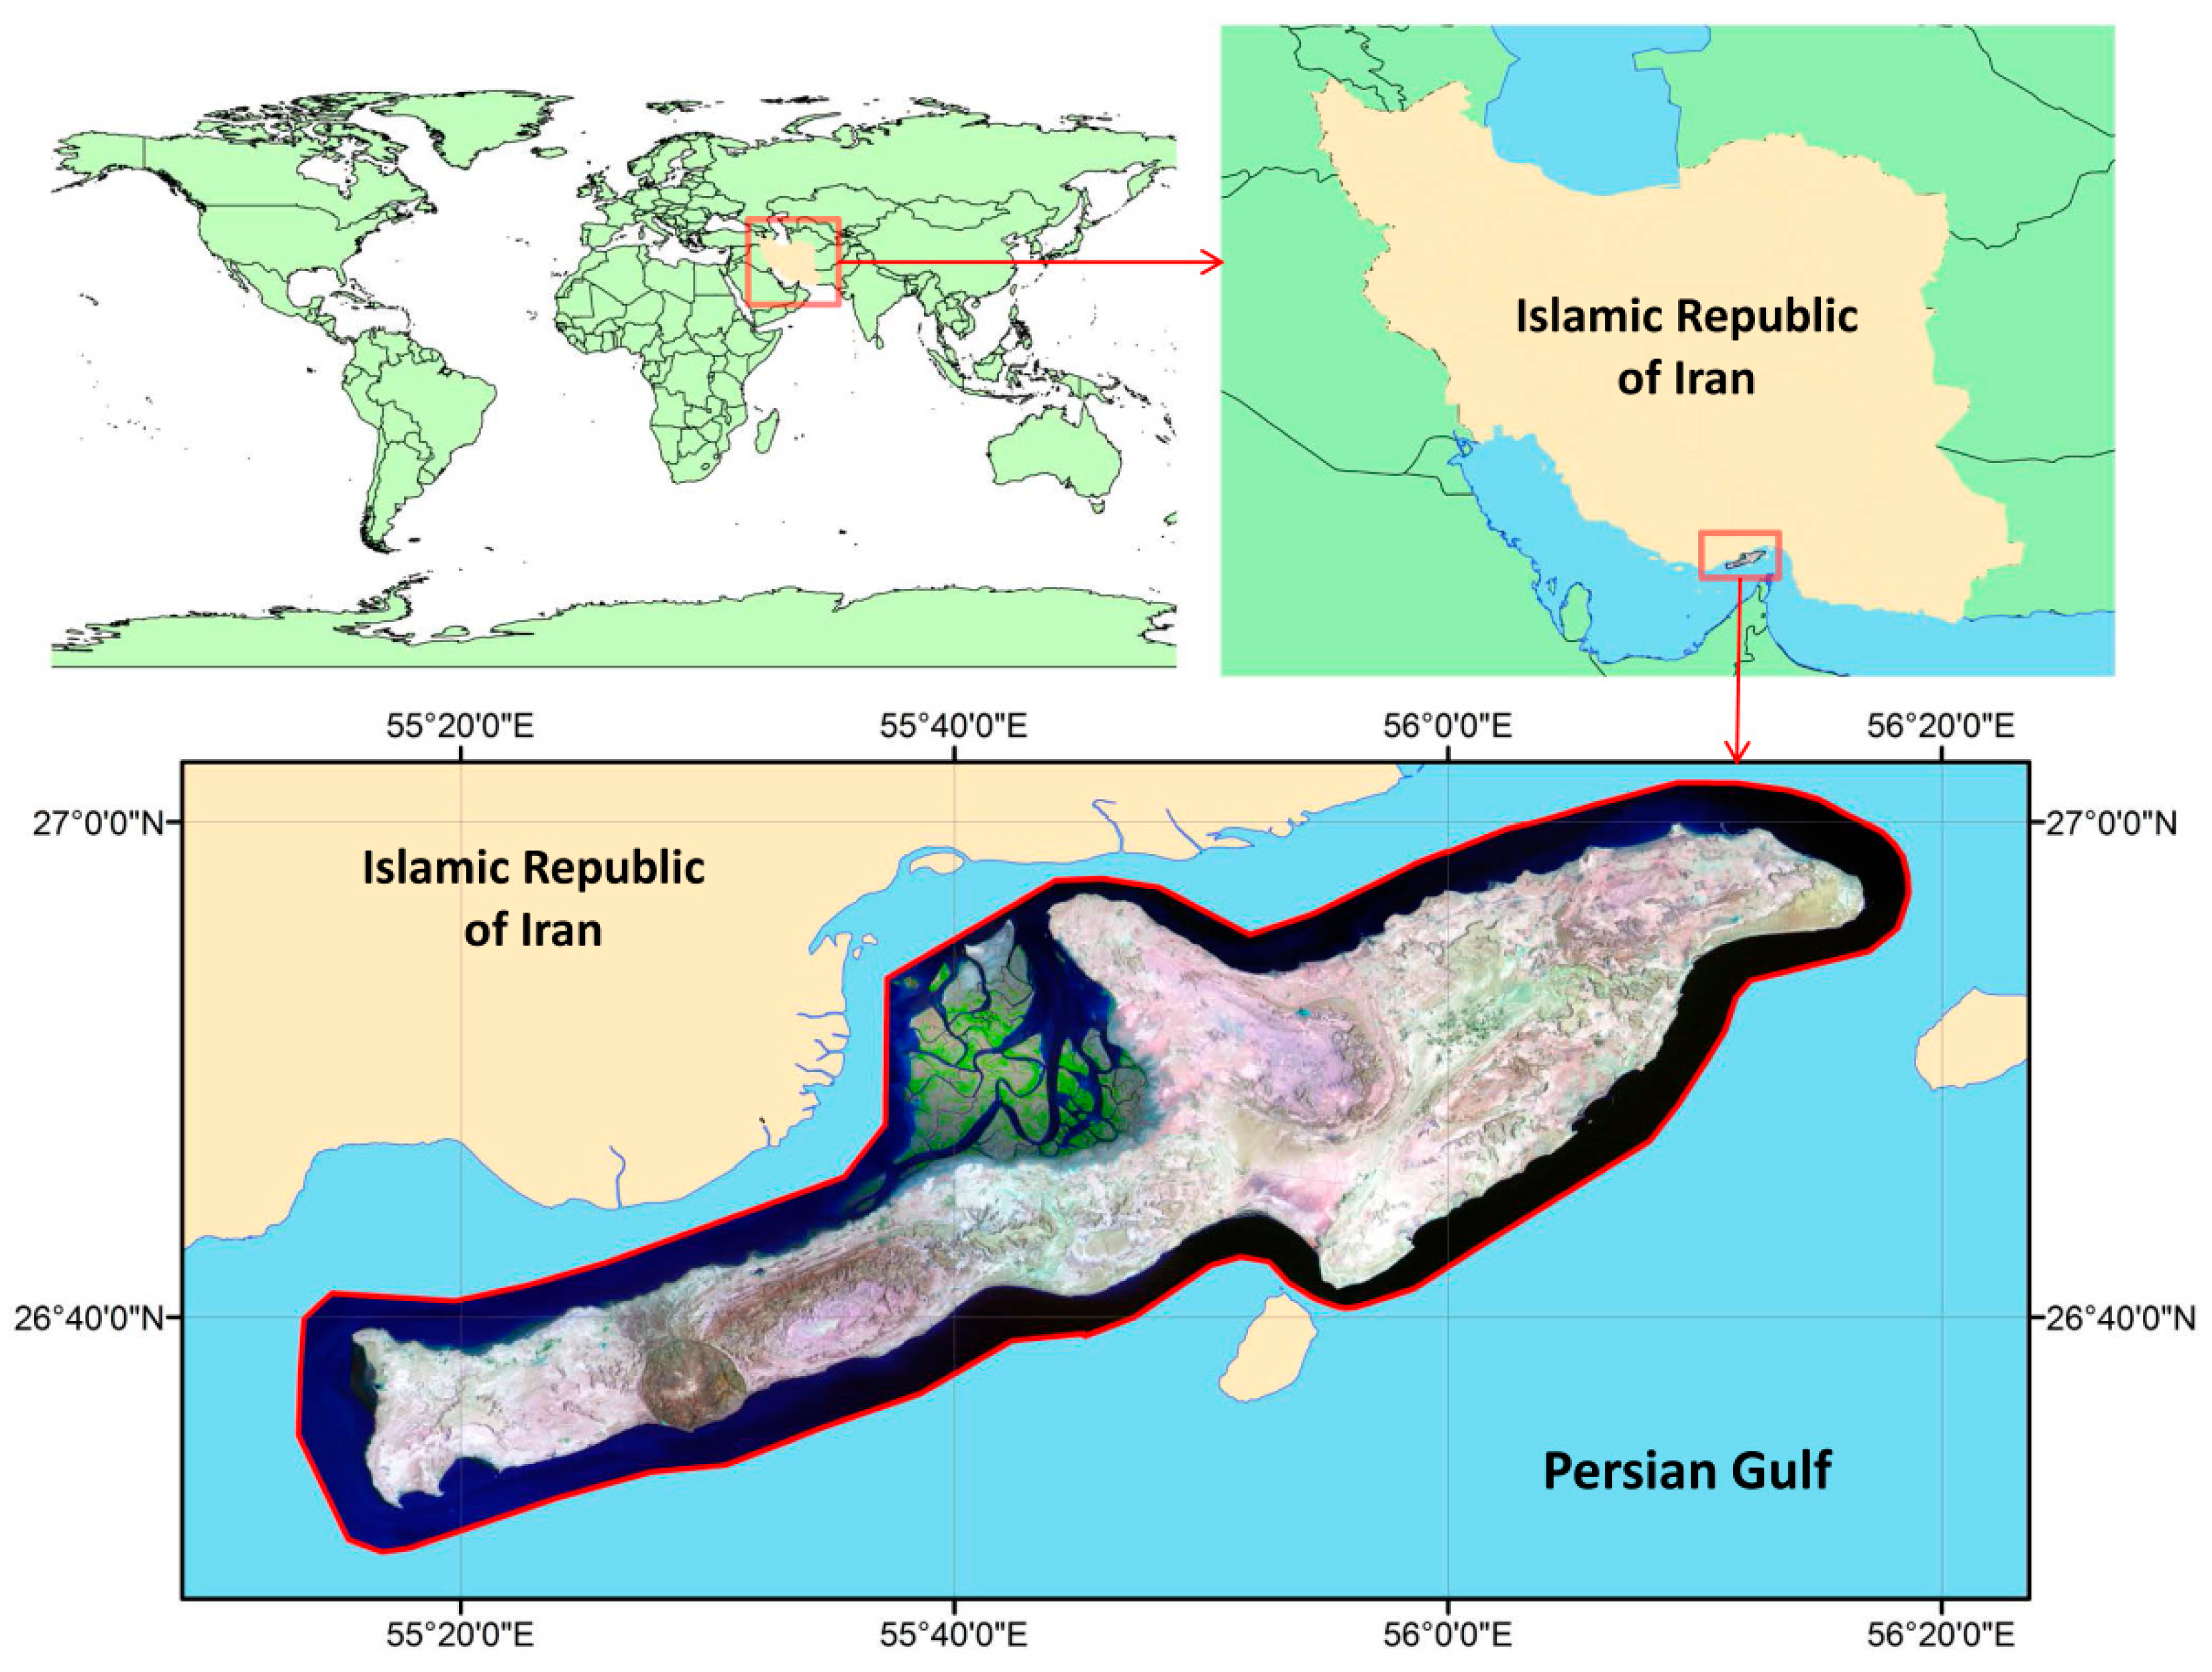
2.1. Study Area
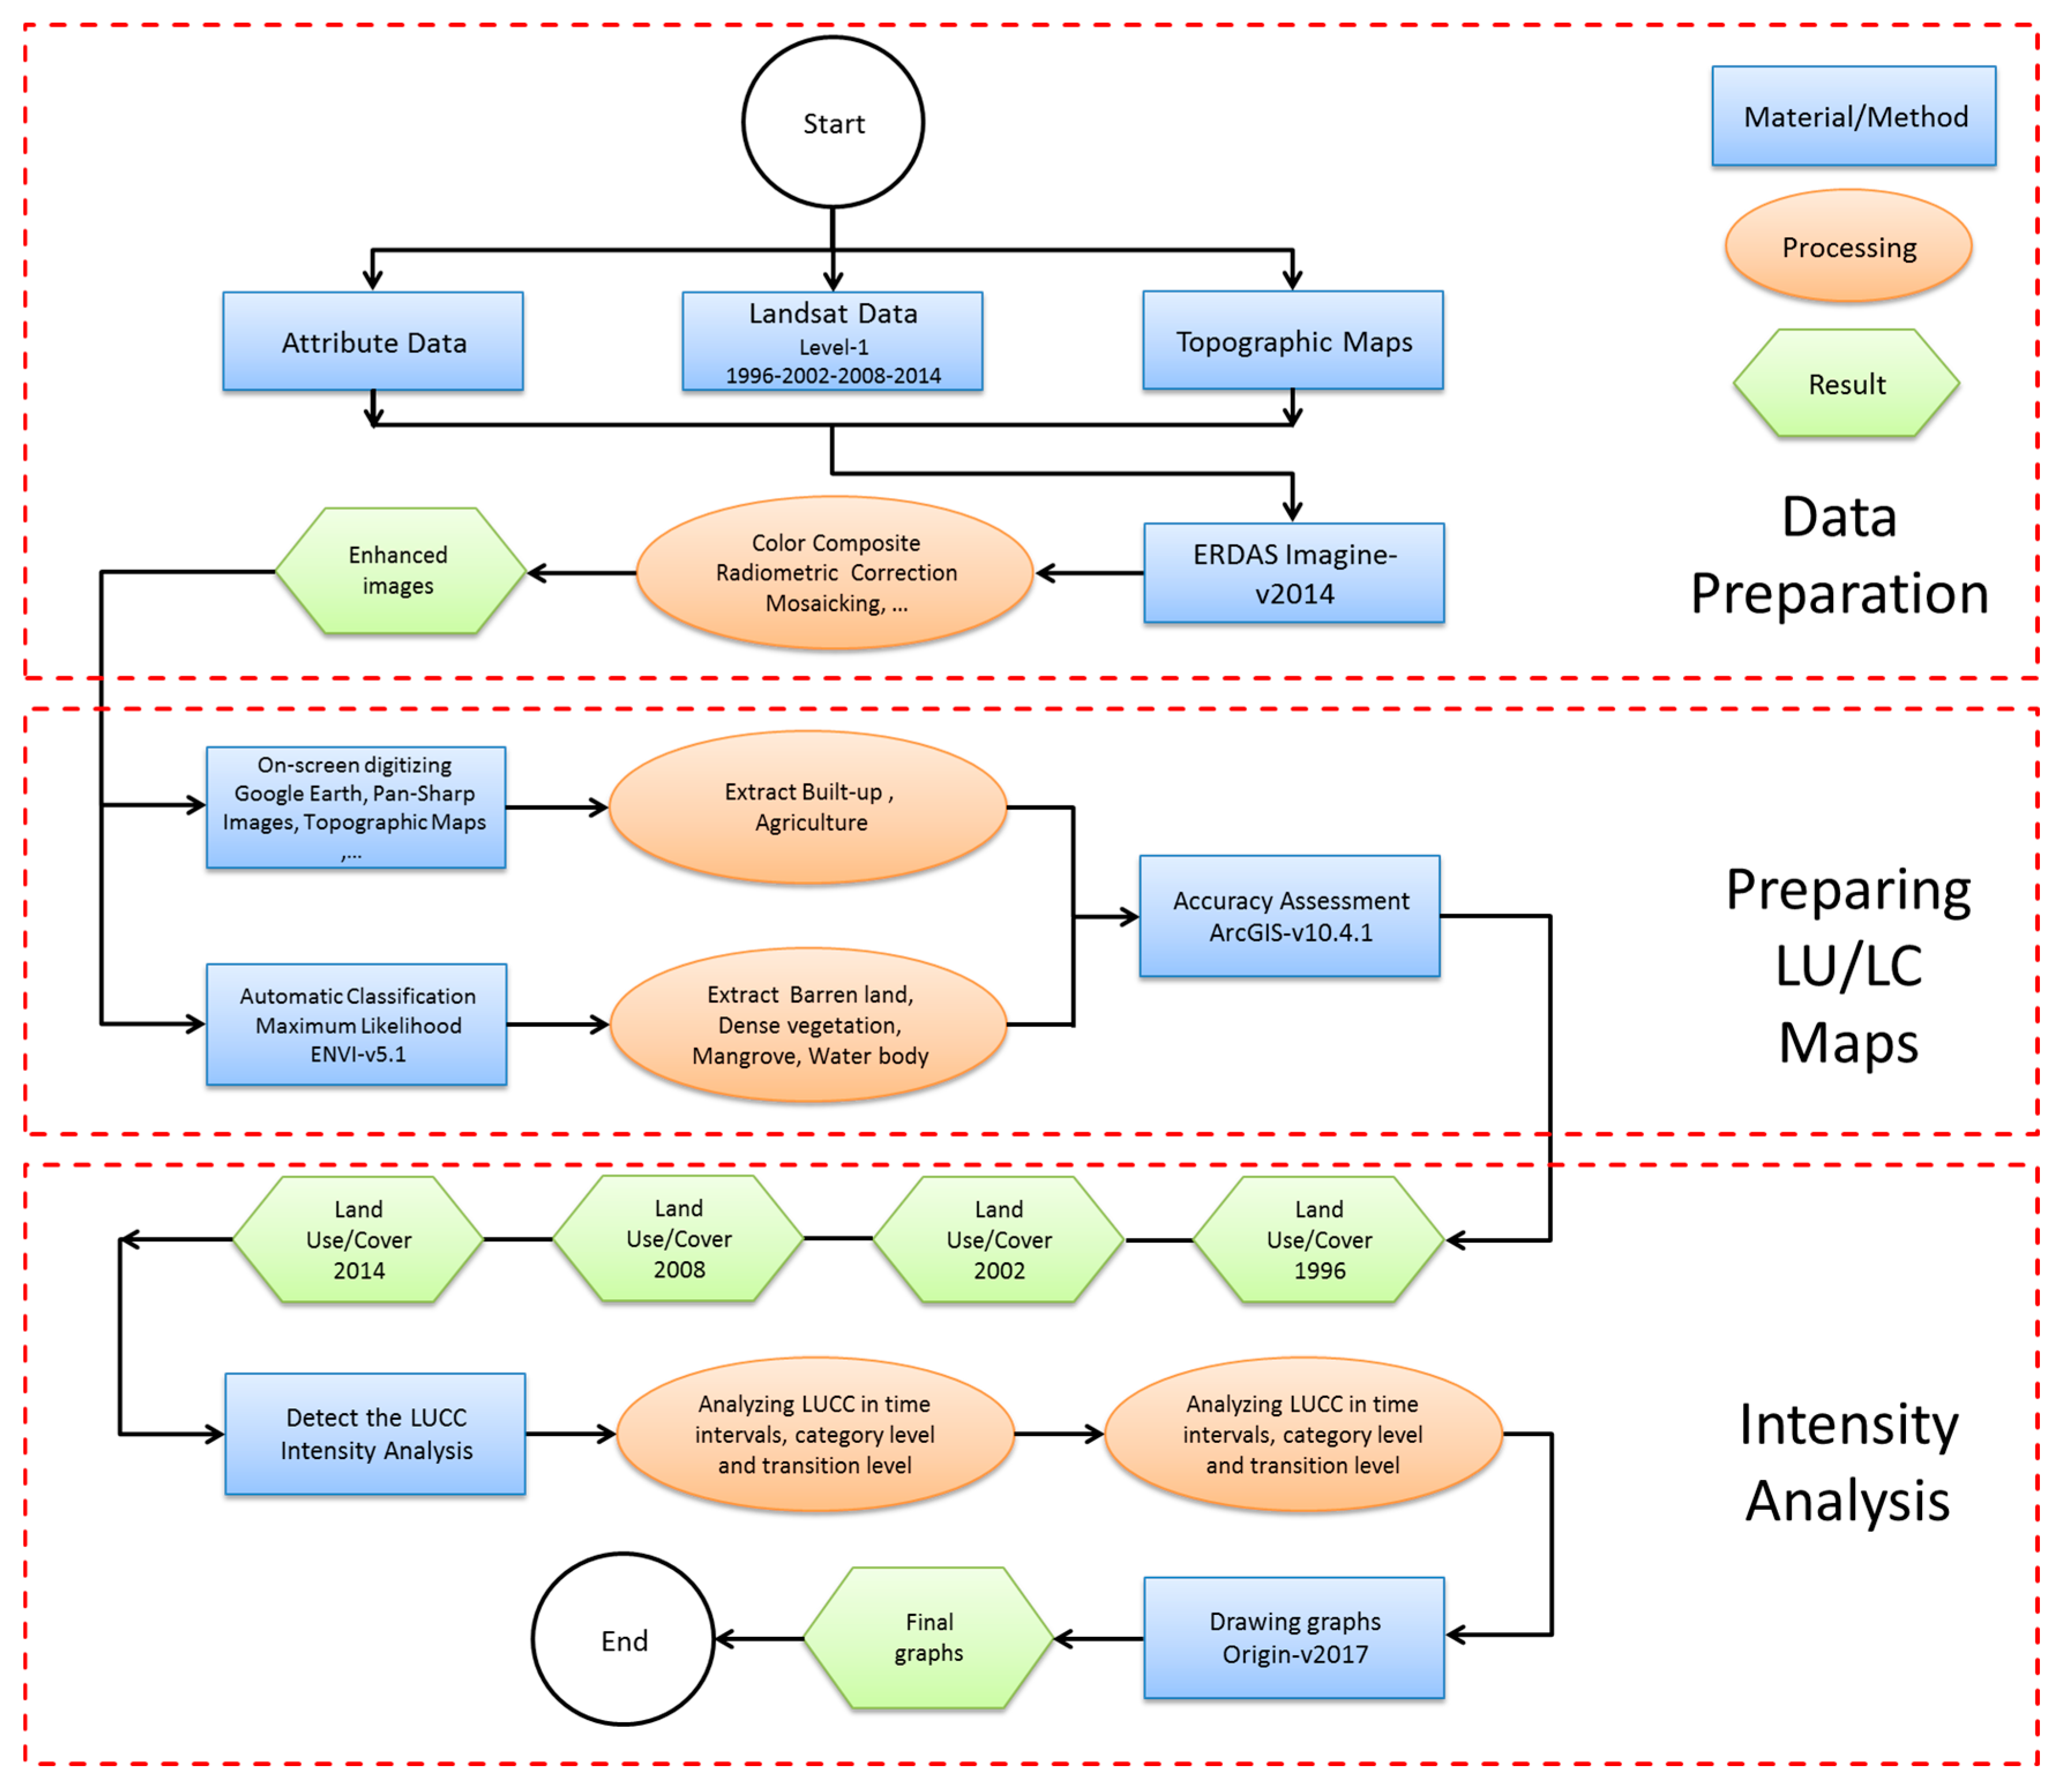
2.2. Data
2.3. Preparing LULC Maps
2.4. Intensity Analysis
3. Results
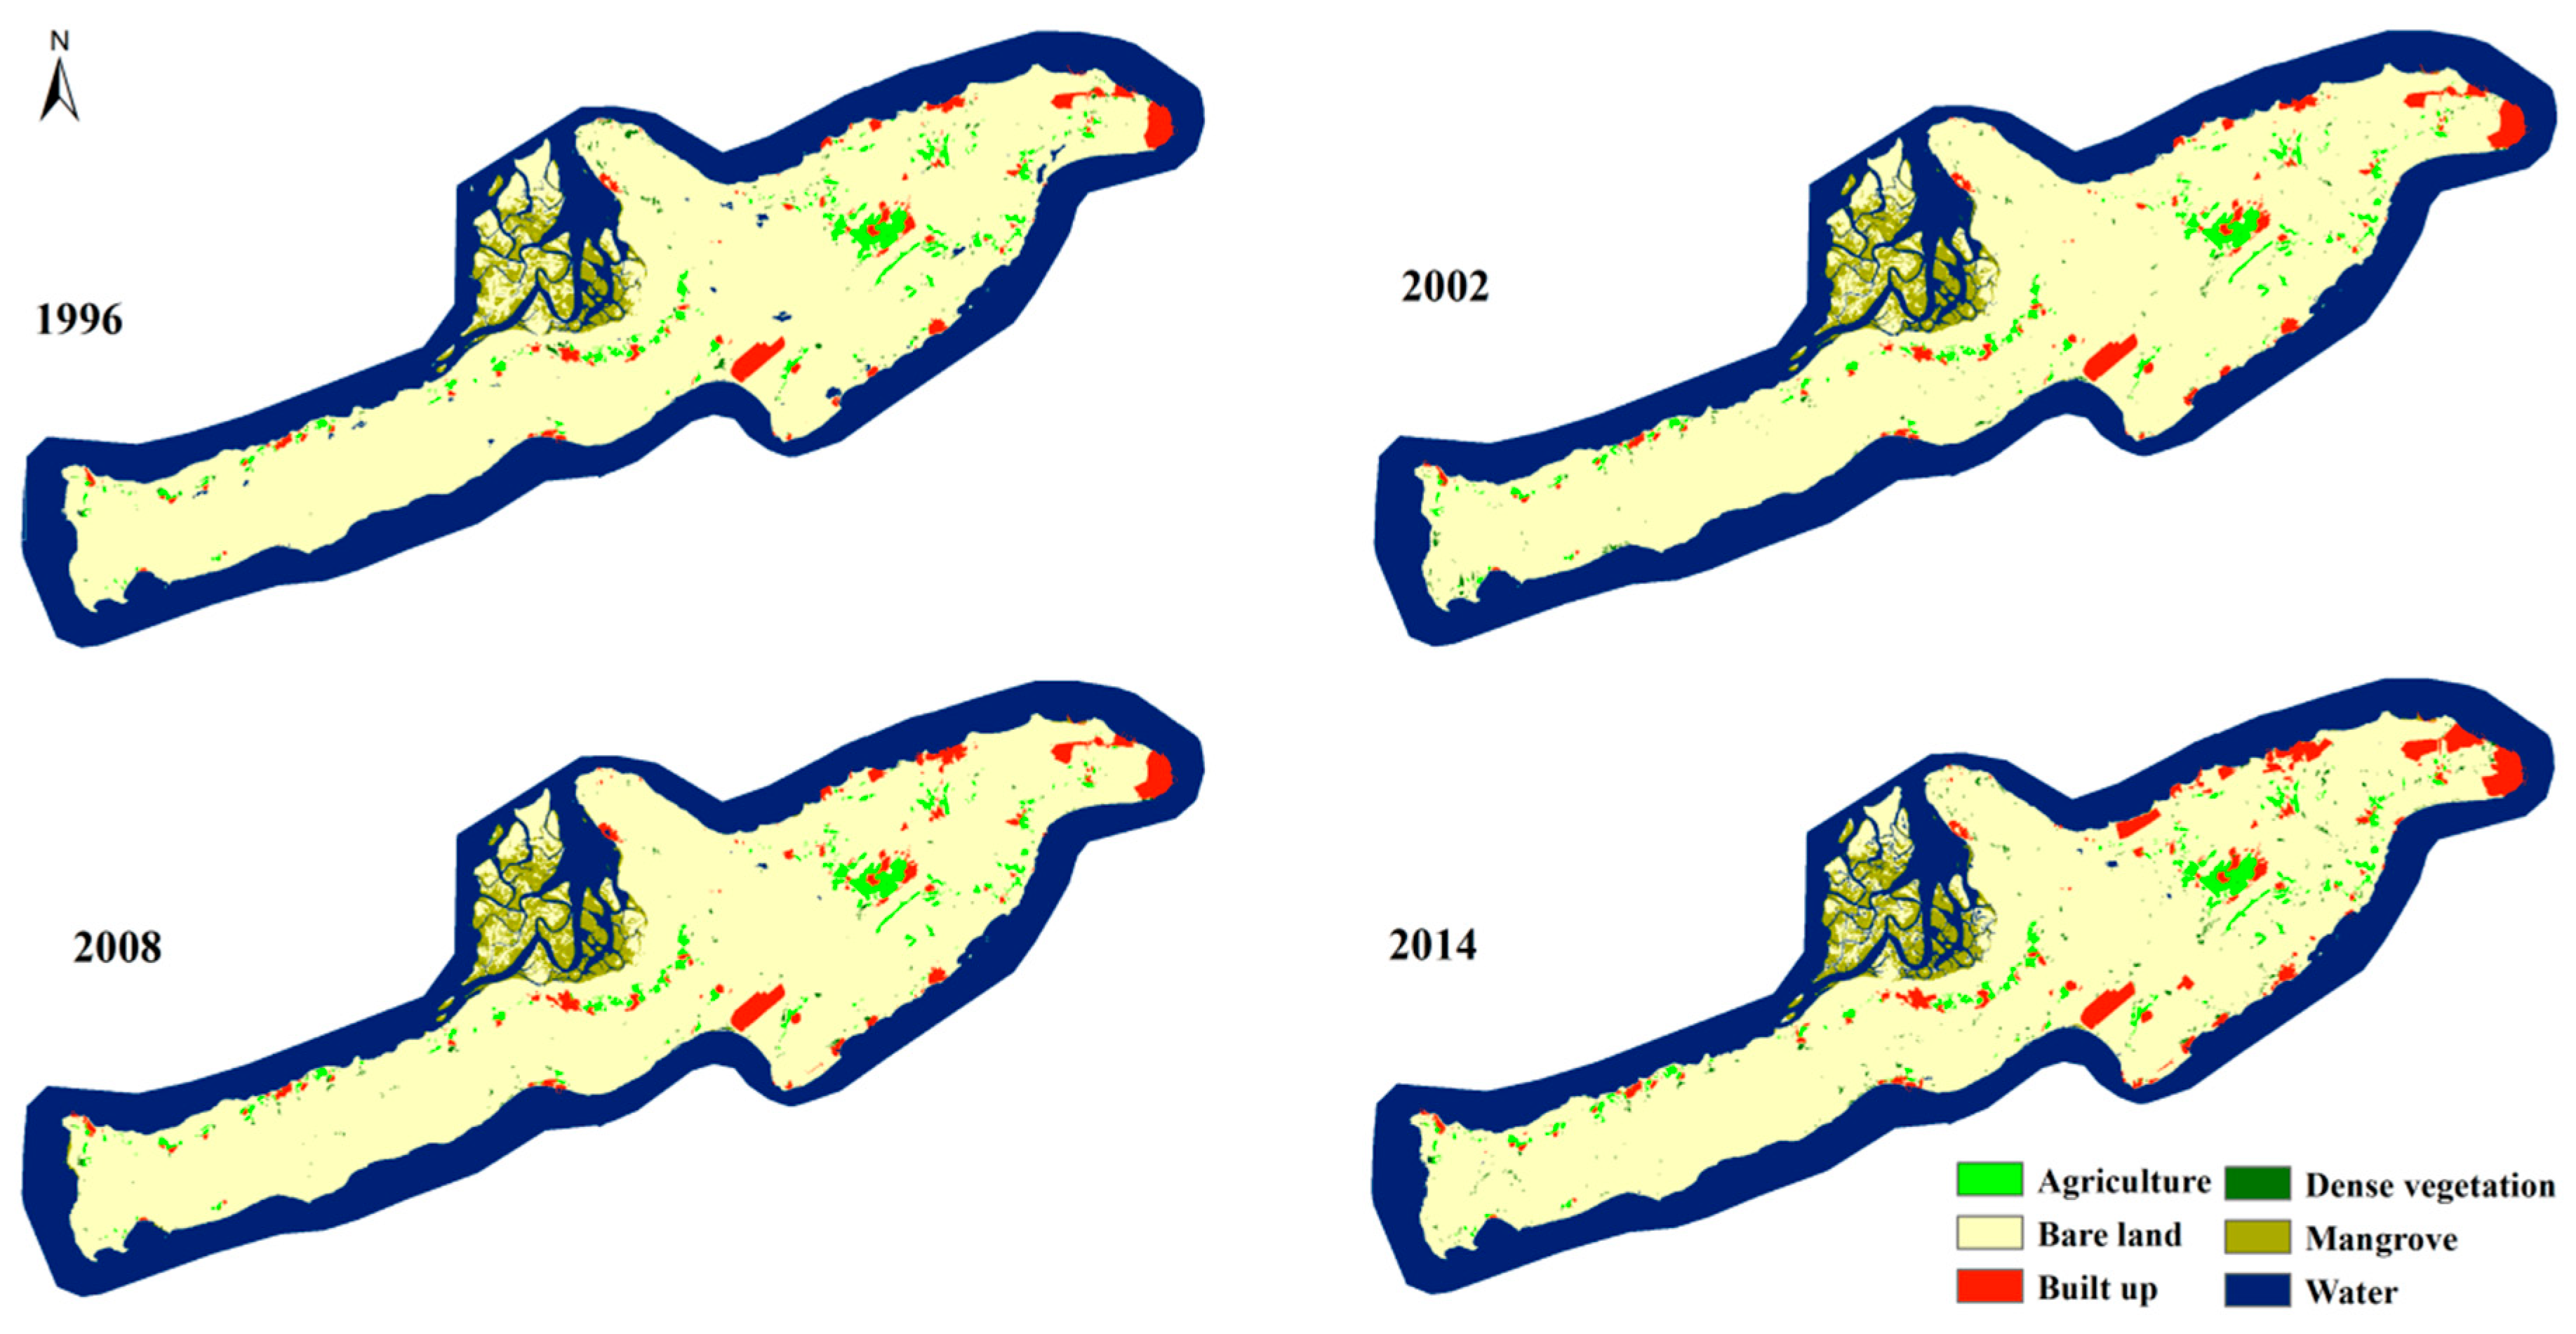
3.1. Land Use/Cover Maps
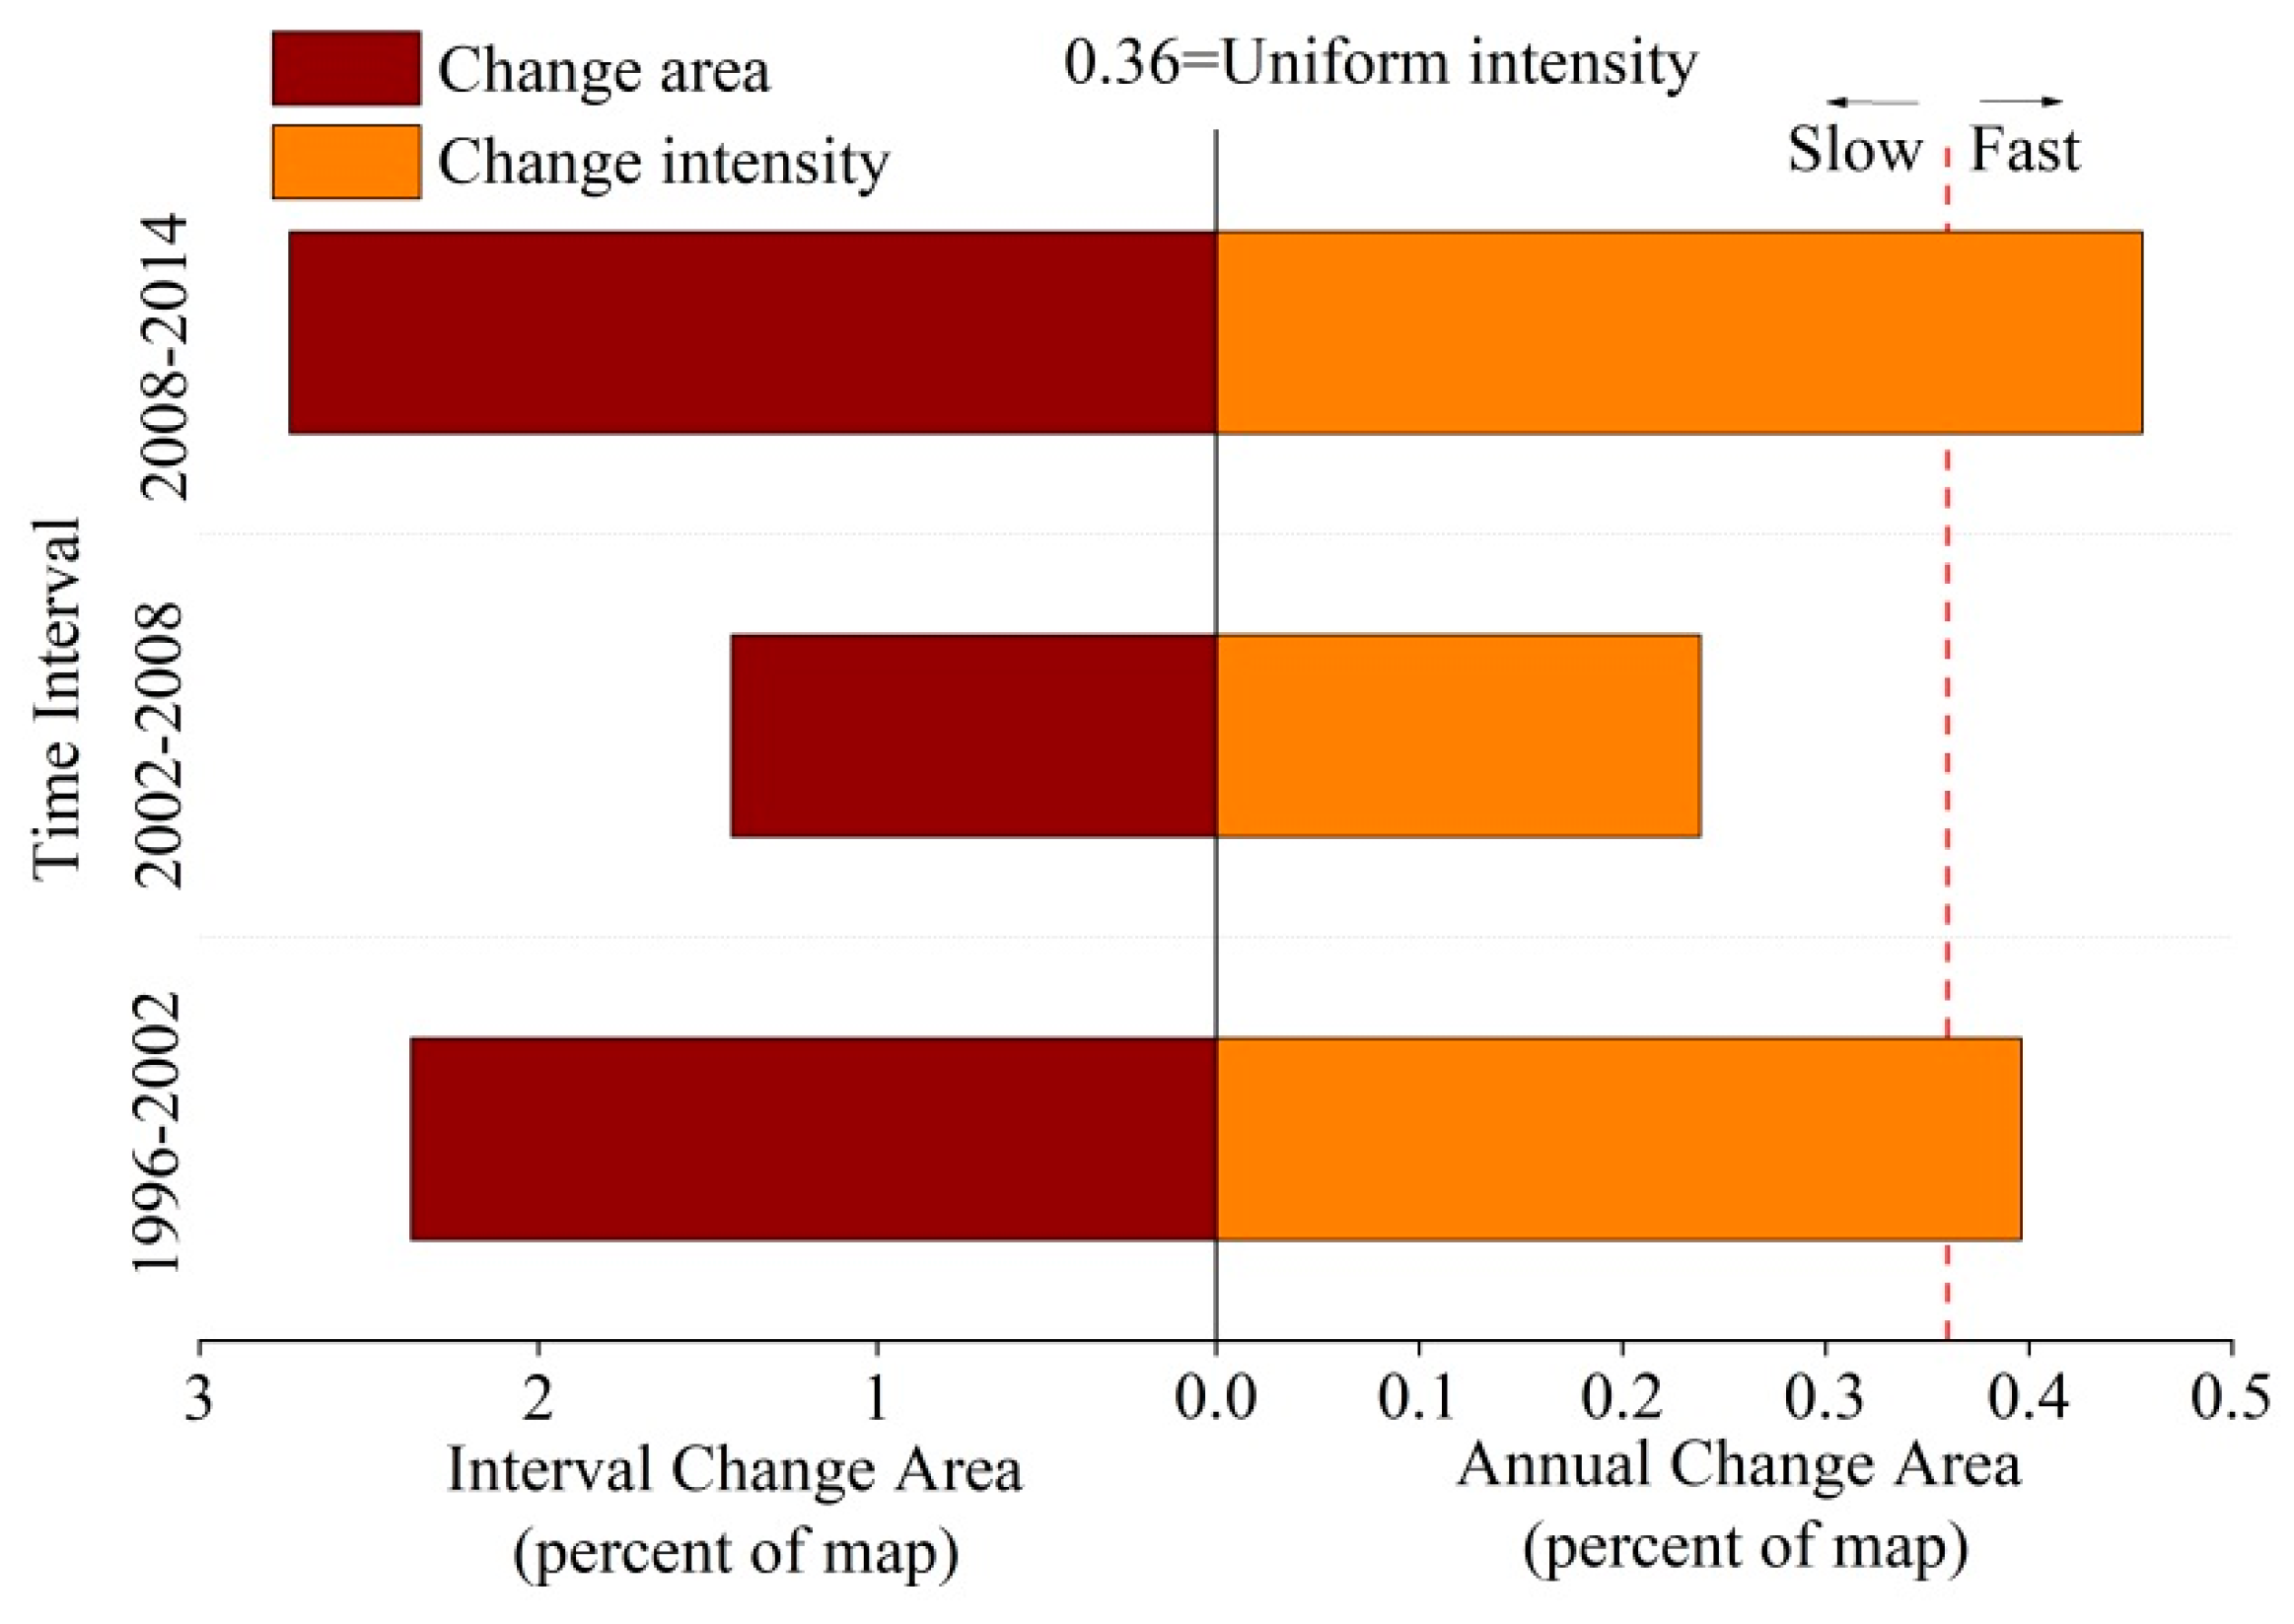
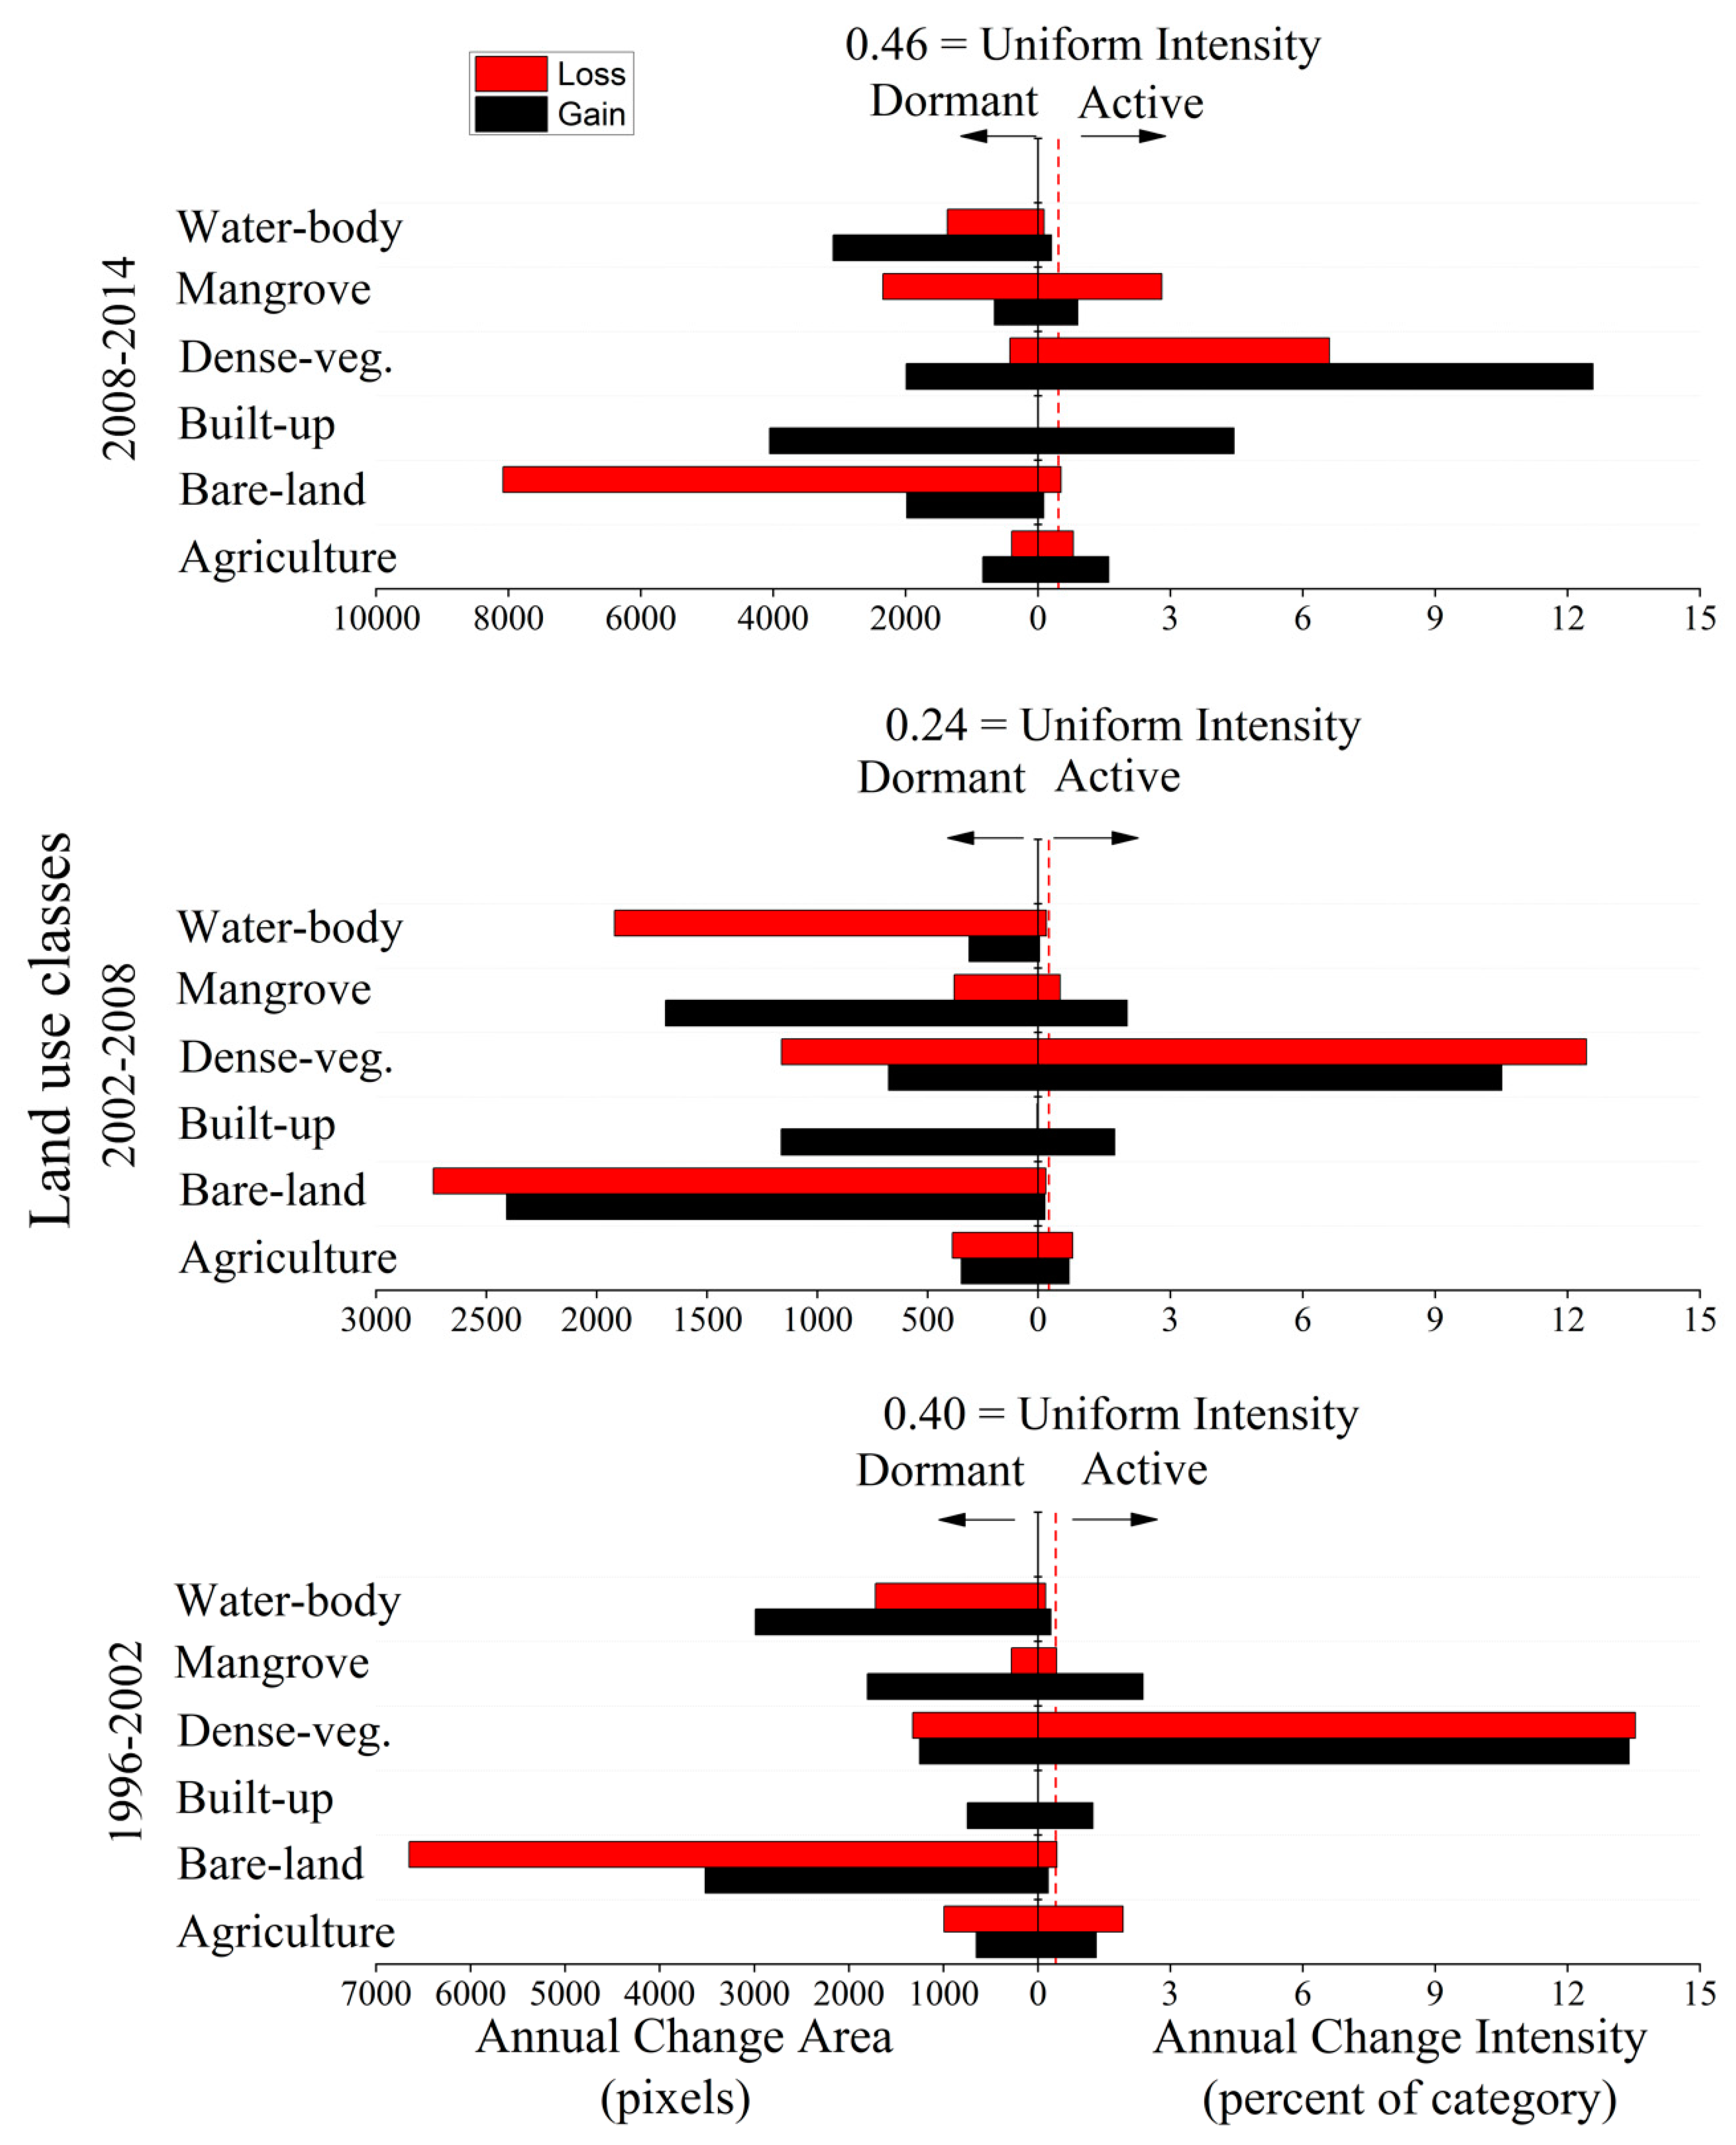
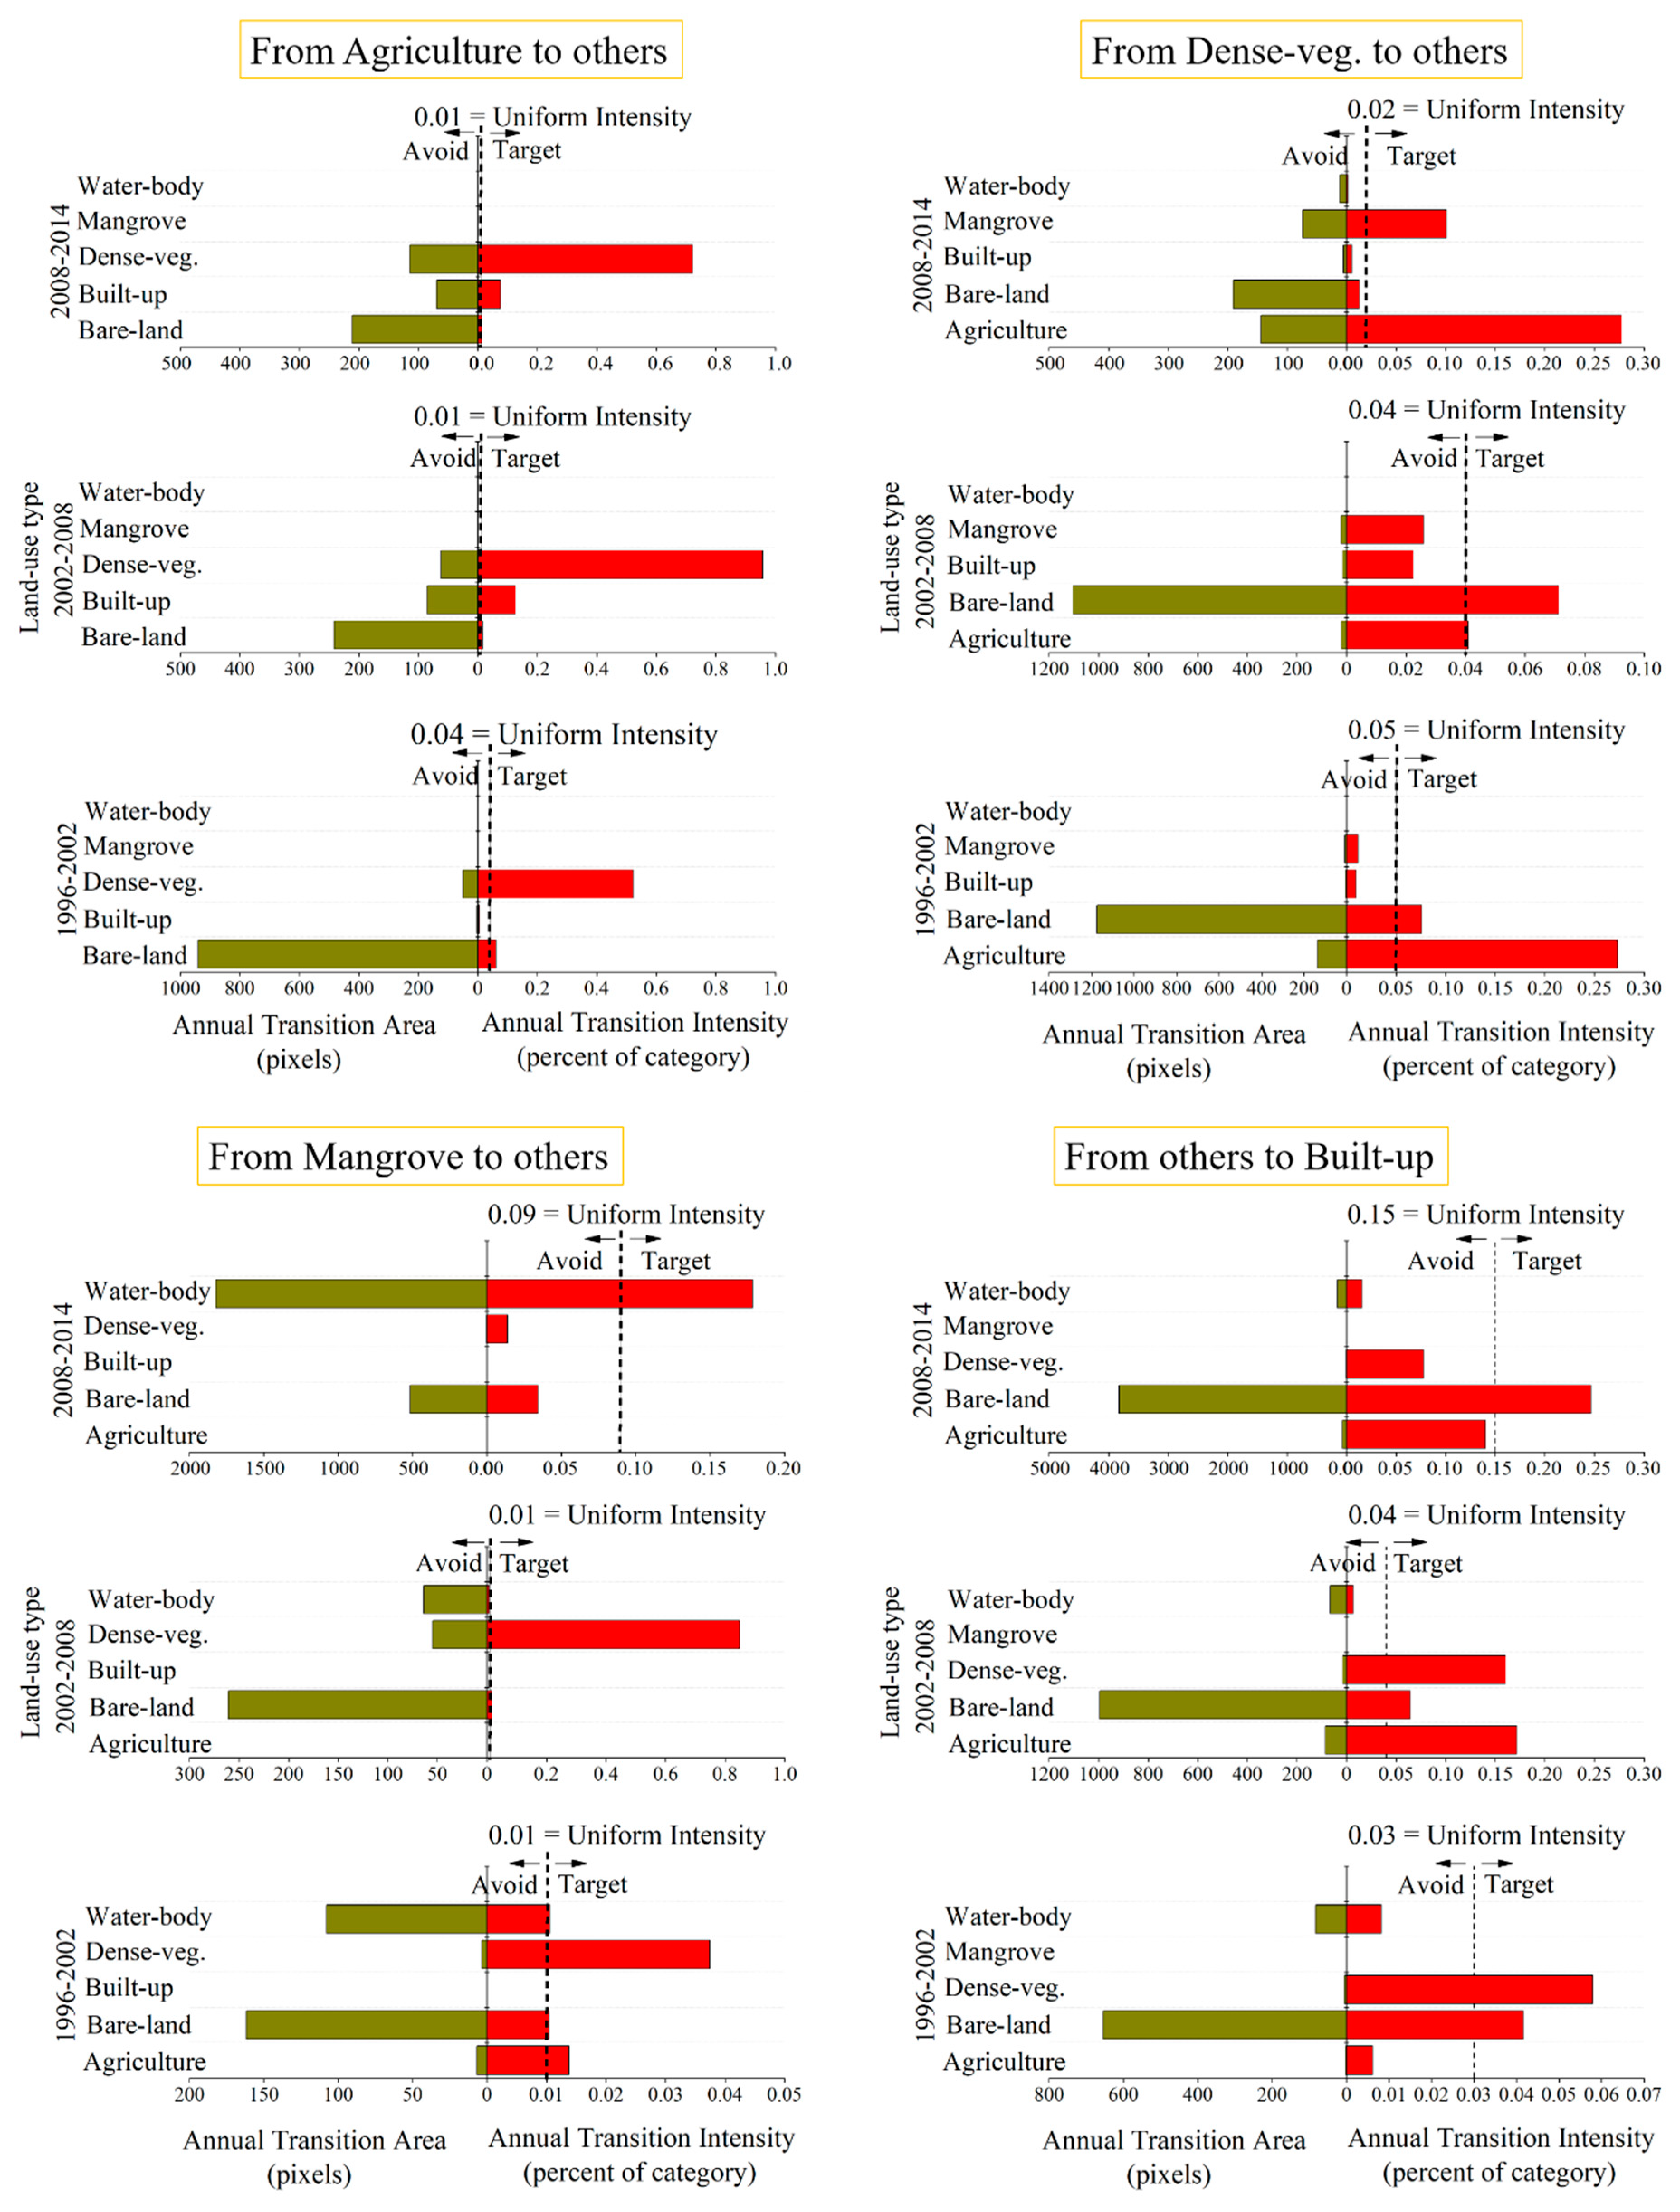
3.2. Intensity Analysis
4. Discussion
4.1. Patterns to Processes in LUCC
4.2. Driving Forces of LUCC
5. Conclusions
Author Contributions
Funding
Acknowledgments
Conflicts of Interest
References
- Mendoza-Poncea, A.; Corona-Núñezb, R.; Kraxnera, F.; Leduca, S.; Patrizioa, P. Identifying effects of land-use cover changes and climate change on terrestrial ecosystems and carbon stocks in Mexico. Glob. Environ. Chang. 2018, 53, 12–23. [Google Scholar] [CrossRef]
- Lambina, E.F.; Meyfroidt, P. Global land-use change, economic globalization, and the looming land scarcity. Proc. Natl. Acad. Sci. USA 2011, 108, 3465–3472. [Google Scholar] [CrossRef] [PubMed]
- Li, Y.; Zhang, X.; Zhao, X.; Ma, S.; Cao, H.; Cao, J. Assessing spatial vulnerability from rapid urbanization to inform coastal urban regional planning. Ocean Coast Manag. 2016, 123, 53–65. [Google Scholar] [CrossRef]
- Huang, F.; Huang, B.; Huang, J.; Li, S. Measuring land change in coastal zone around a rapidly urbanized bay. Int. J. Environ. Res. Public Health 2018, 15, 1059. [Google Scholar] [CrossRef]
- Pourebrahim, S.; Hadipour, M.; Bin Mokhtar, M. Impact assessment of rapid development on land-use changes in coastal areas; case of Kuala Langat district, Malaysia. Environ. Dev. Sustain. 2015, 17, 1003–1016. [Google Scholar] [CrossRef]
- Kourosh Niya, A.; Huang, J.; Kazemzadeh-Zow, A.; Naimi, B. An adding/deleting approach to improve land change modeling: A case study in Qeshm Island, Iran. Arab. J. Geosci. 2019, 12, 333. [Google Scholar] [CrossRef]
- Ramesh, R.; Chen, Z.; Cummins, V.; Day, J.; D’Elia, C. Land–Ocean Interactions in the Coastal Zone: Past, present & future. Anthropocene 2015, 12, 85–98. [Google Scholar]
- Huang, J.; Pontius, R.G., Jr.; Li, Q.; Zhang, Y. Use of intensity analysis to link patterns with processes of land change from 1986 to 2007 in a coastal watershed of southeast China. Appl. Geogr. 2012, 34, 371–384. [Google Scholar] [CrossRef]
- Kuemmerle, T.; Erb, K.; Meyfroidt, P.; Müller, D.; Verburg, P.H.; Estel, S.; Haberl, H.; Hostert, P.; Jepsen, M.R.; Kastner, T.; et al. Challenges and opportunities in mapping land use intensity globally. Curr. Opin. Environ. Sustain. 2013, 5, 484–493. [Google Scholar] [CrossRef]
- Mohajane, M.; Essahlaoui, A.; Oudija, F.; Hafyani, M.E.; Hmaidi, A.E.; Ouali, A.E.; Randazzo, G.; Teodoro, A.C. Land Use/Land Cover (LULC) Using Landsat Data Series (MSS, TM, ETM+ and OLI) in Azrou Forest, in the Central Middle Atlas of Morocco. Environments 2018, 5, 131. [Google Scholar] [CrossRef]
- Msofe, N.K.; Sheng, L.; Lyimo, J. Land Use Change Trends and Their Driving Forces in the Kilombero Valley Floodplain, South eastern Tanzania. Sustainability 2019, 11, 505. [Google Scholar] [CrossRef]
- Schaller, J.; Mattos, C. GIS Model Applications for Sustainable Development and Environmental Planning at the Regional Level. In GeoSpatial Visual Analytics; Amicis, R.D., Stojanovic, R., Conti, G., Eds.; NATO Science for Peace and Security Series C: Environmental Security; Springer: Dordrecht, The Netherlands, 2009. [Google Scholar]
- Aldwaik, S.Z.; Pontius, R.G. Intensity analysis to unify measurements of size and stationarity of land changes by interval, category, and transition. Landsc. Urban Plan 2012, 106, 103–114. [Google Scholar] [CrossRef]
- Mwangi, H.M.; Lariu, P.; Julich, S.; Patil, S.D.; McDonald, M.A.; Feger, K.-H. Characterizing the Intensity and Dynamics of Land-Use Change in the Mara River Basin, East Africa. Forests 2018, 9, 8. [Google Scholar] [CrossRef]
- Quan, B.; Ren, H.; Pontius, R.G., Jr.; Liu, P. Quantifying spatiotemporal patterns concerning land change in Changsha, China. Landsc. Ecol. Eng. 2018, 14, 257–267. [Google Scholar] [CrossRef]
- Pontius, R.G., Jr.; Gao, Y.; Giner, N.M.; Kohyama, T.; Osaki, M.; Hirose, K. Design and Interpretation of Intensity Analysis Illustrated by Land Change in Central Kalimantan, Indonesia. Land 2013, 2, 351–369. [Google Scholar] [CrossRef]
- Zhou, P.; Huang, J.; Pontius, J.G.R.; Hong, H. Land Classification and Change Intensity Analysis in a Coastal Watershed of Southeast China. Sensors 2014, 14, 11640–11658. [Google Scholar] [CrossRef] [PubMed]
- Akinyemi, F.O.; Pontius, R.G., Jr.; Braimoh, A.K. Land change dynamics: Insights from Intensity Analysis applied to an African emerging city. J. Spat. Sci. 2016, 62, 69–83. [Google Scholar] [CrossRef]
- Shoyama, K.; Braimoh, A.K.; Avtar, R.; Saito, O. Land Transition and Intensity Analysis of Cropland Expansion in Northern Ghana. Environ. Manag. 2018, 62, 892–905. [Google Scholar] [CrossRef]
- Da, F.; Chen, X.; Qi, J. Spatiotemporal Characteristic of Land Use/Land Cover Changes in the Middle and Lower Reaches of Shule River Basin Based on an Intensity Analysis. Sustainability 2019, 11, 1360. [Google Scholar] [CrossRef]
- Huang, B.; Huang, J.; Pontius, R.G., Jr.; Tu, Z. Comparison of Intensity Analysis and the land-use dynamic degrees to measure land changes outside versus inside the coastal zone of Longhai, China. Ecol. Indic. 2018, 89, 336–347. [Google Scholar] [CrossRef]
- Sarvar, R.; Khaliji Oskouei, M.A. The role of Qeshm city in the regional economy development. J. Urban Econ. Manag. 2014, 2, 53–67. [Google Scholar]
- Financial Tribune, Qeshm Island: Persian Gulf Commercial Hub. 2015. Available online: https://financialtribune.com/articles/economy-domestic-economy/12704/qeshm-island-persian-gulf-commercial-hub (accessed on 7 March 2015).
- Mohammadi Mazraeh, H.; Pazhouhanfar, M. Effects of vernacular architecture structure on urban sustainability case study: Qeshm Island, Iran. Front. Archit. Res. 2018, 7, 11–24. [Google Scholar] [CrossRef]
- Mirza, R.; Moeinaddini, M.; Pourebrahim, S.; Zahed, M.A. Contamination, ecological risk and source identification of metals by multivariate analysis in surface sediments of the khouran Straits, the Persian Gulf. Mar. Poll. Bull. 2019, 145, 526–535. [Google Scholar] [CrossRef]
- Pourahmad, A.; Hosseini, A.; Pourahmad, A.; Zoghi, M.; Sadat, M. Tourist Value Assessment of Geotourism and Environmental Capabilities in Qeshm Island-Iran. Geoheritage 2018, 10, 687–706. [Google Scholar] [CrossRef]
- Keshtkar, H.; Voigt, W. Potential impacts of climate and landscape fragmentation changes on plant distributions: Coupling multi-temporal satellite imagery with gis-based cellular automata model. Ecol. Inform. 2016, 32, 145–155. [Google Scholar] [CrossRef]
- Richards, J.A. Remote Sensing Digital Image Analysis, 5th ed.; Springer: Berlin, Germany, 2013. [Google Scholar]
- Li, C.; Wang, J.; Wang, L.; Hu, L.; Gong, P. Comparison of Classification Algorithms and Training Sample Sizes in Urban Land Classification with Landsat Thematic Mapper Imagery. Remote Sens. 2014, 6, 964–983. [Google Scholar] [CrossRef]
- Millard, K.; Richardson, M. On the Importance of Training Data Sample Selection in Random Forest Image Classification: A Case Study in Peatland Ecosystem Mapping. Remote Sens. 2015, 7, 8489–8515. [Google Scholar] [CrossRef]
- Abdu, H.A. Classification accuracy and trend assessments of land cover- land use changes from principal components of land satellite images. Int. J. Remote Sens. 2019, 40, 1275–1300. [Google Scholar] [CrossRef]
- Foody, G. Status of land covers classification accuracy assessment. Remote Sens. Environ. 2002, 1, 185–201. [Google Scholar] [CrossRef]
- Zaehringer, J.G.; Eckert, S.; Messerli, P. Revealing Regional Deforestation Dynamics in North-Eastern Madagascar—Insights from Multi-Temporal Land Cover Change Analysis. Land 2015, 4, 454–474. [Google Scholar] [CrossRef]
- Aldwaik, S.Z.; Pontius, R.G., Jr. Map errors that could account for deviations from a uniform intensity of land change. Int. J. Geogr. Inf. Sci. 2013, 27, 1717–1739. [Google Scholar] [CrossRef]
- Enaruvbe, G.O.; Pontius, R.G., Jr. Influence of classification errors on Intensity Analysis of land changes in southern Nigeria. Int. J. Remote Sens. 2015, 36, 244–261. [Google Scholar] [CrossRef]
- Mafi-Gholami, D.; Zenner, E.K.; Jaafari, A.; Ward, R.D. Modeling multi-decadal mangrove leaf area index in response to drought along the semi-arid southern coasts of Iran. Sci. Total Environ. 2019, 656, 1326–1336. [Google Scholar] [CrossRef]
- Zuo, L.J.; Xu, J.Y.; Zhang, Z.X. Spatial temporal land use change and landscape response in Bohai Sea coastal zone area. J. Remote Sens. 2011, 15, 604–620. (In Chinese) [Google Scholar]
- Yang, Y.; Liu, Y.; Xu, D. Use of intensity analysis to measure land use changes from 1932 to 2005 in Zhenlai County, Northeast China. Chin. Geogr. Sci. 2017, 27, 441–455. [Google Scholar] [CrossRef]
- Khoorani, A.; Bineiaz, M.; Amiri, H.R. Mangrove forest area changes due to climatic changes (Case study: Forest between the port and the Khamir island). J. Aquat. Ecol. 2015, 5, 100–111, (In Persian with English abstract). [Google Scholar]
- Liu, J.; Liu, M.; Zhuang, D.; Zhang, Z.; Deng, X. Study on spatial pattern of land-use change in China during 1995–2000. Sci. China Ser. D Earth Sci. 2003, 46, 373–384. [Google Scholar]
- Badmos, O.S.; Rienow, A.; Callo-Concha, D.; Greve, K.; Jürgens, C. Urban Development in West Africa—Monitoring and Intensity Analysis of Slum Growth in Lagos: Linking Pattern and Process. Remote Sens. 2018, 10, 1044. [Google Scholar] [CrossRef]
- Munsi, M.; Malaviya, S.; Oinam, G. A landscape approach for quantifying land-use and land-cover change (1976–2006) in middle Himalaya. Reg. Environ. Chang. 2010, 10, 145. [Google Scholar] [CrossRef]
- Hakimian, H. Iran’s Free Trade Zones: Challenges and Opportunities. In Iran’s Economy at a Crossroads: Domestic and Global Challenges; University of Southern California (USC): Los Angeles, CA, USA, 2009. [Google Scholar]
- Ministry of the Interior of the Islamic Republic of Iran. Annual Statistical Report; Ministry of the Interior of the Islamic Republic of Iran: Hormozgan Province, Iran, 2016. [Google Scholar]
- Zarei, M.; Fatemi, M.R.; Mortazavi, M.S.; Pourebrahim, S.; Ghoddousi, J. Selection of the optimal tourism site using the ANP and fuzzy TOPSIS in the framework of Integrated Coastal Zone Management: A case of Qeshm Island. Ocean Coast Manag. 2016, 130, 179–187. [Google Scholar]
- Masnavi, M.R.; Amani, N.; Ahmadzadeh, A. Ecological Landscape Planning and Design Strategies for Mangrove Communities (Hara Forests) in South-Pars Special Economic Energy Zone, Asalouyeh-Iran. Environ. Nat. Resour. Res. 2016, 6. [Google Scholar] [CrossRef]


| No. | Satellite | Sensors | Path | Row | Date |
|---|---|---|---|---|---|
| 1 | Landsat5 | Thematic Mapper (TM) | 172 | 041 | 16 May 1996 |
| 2 | Landsat5 | Thematic Mapper (TM) | 042 | 16 May 1996 | |
| 3 | Landsat7 | Enhanced Thematic Mapper Plus (ETM+) | 041 | 25 May 2002 | |
| 4 | Landsat7 | Enhanced Thematic Mapper Plus (ETM+) | 042 | 9 May 2002 | |
| 5 | Landsat5 | Thematic Mapper (TM) | 041 | 17 May 2008 | |
| 6 | Landsat5 | Thematic Mapper (TM) | 042 | 17 May 2008 | |
| 7 | Landsat8 | Operational Land Imager (OLI) | 041 | 18 May 2014 | |
| 8 | Landsat8 | Operational Land Imager (OLI) | 042 | 18 May 2014 |
| No. | Class Name | Description |
|---|---|---|
| 1 | Agriculture | Land used for cultivation including orchards, cultivated land of all kinds of agricultural products. |
| 2 | Bare-land | Unused land, including barren land, wild grass ground, alkaline land, wetland, sand, waste land. |
| 3 | Built-up | Residential area, including urban, rural, industrial, all kinds of road, airport, surrounded enterprise area and generally human-made area. |
| 4 | Dense-vegetation | Densely covered vegetation range is recognizable on Landsat which are outside the range of the built-up and agriculture classes. |
| 5 | Mangrove | The range of mangroves, both natural and artificial. |
| 6 | Water-body | Includes sea area and water bodies inside the island. |
| Symbol | Description |
|---|---|
| number of time points | |
| year at time point t | |
| index for the initial time point of an interval , where t ranges from 1 to T − 1 | |
| number of categories | |
| index for a category at the initial time point of an interval | |
| index for a category at the latter time point of an interval | |
| index of the gaining category for the selected transition | |
| size of transition from category i to category j during interval | |
| annual change during interval | |
| intensity of annual gain of category j during interval relative to size of category j at time t + 1 | |
| intensity of annual loss of category i during interval relative to size of category i at time t | |
| intensity of annual transition from category i to category n during interval relative to size of category i at time t | |
| uniform intensity of annual transition from all non-n categories to category n during interval relative to size of all non-n categories at time t |
| 2014 | ||||||||
|---|---|---|---|---|---|---|---|---|
| 2008 | Categories | Agriculture | Bare-land | Built-up | Dense-vegetation | Mangrove | Water-body | Total |
| Agriculture | 46,966 | 1266 | 415 | 686 | 0 | 0 | 49,333 | |
| Bare-land | 4122 | 1,502,515 | 22,951 | 11,247 | 2594 | 7565 | 1,550,994 | |
| Built-up | 0 | 0 | 66,958 | 0 | 0 | 0 | 66,958 | |
| Dense-vegetation | 864 | 1144 | 30 | 3890 | 443 | 70 | 6441 | |
| Mangrove | 0 | 3104 | 0 | 13 | 69,600 | 10,942 | 83,659 | |
| Water-body | 1 | 6376 | 930 | 0 | 915 | 1,002,535 | 1,010,757 | |
| Total | 51,953 | 1,514,405 | 91,284 | 15,836 | 73,552 | 1,021,114 | 2,768,142 | |
| 2008 | ||||||||
| 2002 | Categories | Agriculture | Bare-land | Built-up | Dense-vegetation | Mangrove | Water-body | Total |
| Agriculture | 47,252 | 1450 | 510 | 370 | 0 | 1 | 49,583 | |
| Bare-land | 1958 | 1,536,543 | 5978 | 3355 | 3672 | 1483 | 1,552,989 | |
| Built-up | 2 | 22 | 59,980 | 0 | 0 | 0 | 60,004 | |
| Dense-vegetation | 121 | 6629 | 90 | 2381 | 130 | 5 | 9356 | |
| Mangrove | 0 | 1565 | 0 | 328 | 73,535 | 383 | 75,811 | |
| Water-body | 0 | 4785 | 400 | 7 | 6322 | 1,008,885 | 1,020,399 | |
| Total | 49,333 | 1,550,994 | 66,958 | 6441 | 83,659 | 1,010,757 | 2,768,142 | |
| 2002 | ||||||||
| 1996 | Categories | Agriculture | Bare-land | Built-up | Dense-vegetation | Mangrove | Water-body | Total |
| Agriculture | 45,660 | 5643 | 19 | 293 | 0 | 0 | 51,615 | |
| Bare-land | 3043 | 1,531,873 | 3927 | 6821 | 8823 | 17,278 | 1,571,765 | |
| Built-up | 0 | 0 | 55,525 | 0 | 0 | 0 | 55,525 | |
| Dense-vegetation | 813 | 7049 | 34 | 1839 | 52 | 0 | 9787 | |
| Mangrove | 41 | 970 | 0 | 21 | 64,992 | 648 | 66,672 | |
| Water-body | 26 | 7454 | 499 | 382 | 1944 | 1,002,473 | 1,012,778 | |
| Total | 49,583 | 1,552,989 | 60,004 | 9356 | 75,811 | 1,020,399 | 2,768,142 | |
| Year | Error Count | Samples Count | Overall Accuracy | User’s Accuracy | Producer’s Accuracy | K-Standard |
|---|---|---|---|---|---|---|
| 1996 | 36 | 300 | 88.00 | 89.81 | 88.00 | 0.85 |
| 2002 | 32 | 300 | 89.33 | 90.35 | 89.33 | 0.87 |
| 2008 | 33 | 300 | 89.00 | 89.72 | 89.00 | 0.86 |
| 2014 | 27 | 300 | 91.00 | 90.18 | 91.33 | 0.89 |
© 2019 by the authors. Licensee MDPI, Basel, Switzerland. This article is an open access article distributed under the terms and conditions of the Creative Commons Attribution (CC BY) license (http://creativecommons.org/licenses/by/4.0/).
Share and Cite
Kourosh Niya, A.; Huang, J.; Karimi, H.; Keshtkar, H.; Naimi, B. Use of Intensity Analysis to Characterize Land Use/Cover Change in the Biggest Island of Persian Gulf, Qeshm Island, Iran. Sustainability 2019, 11, 4396. https://doi.org/10.3390/su11164396
Kourosh Niya A, Huang J, Karimi H, Keshtkar H, Naimi B. Use of Intensity Analysis to Characterize Land Use/Cover Change in the Biggest Island of Persian Gulf, Qeshm Island, Iran. Sustainability. 2019; 11(16):4396. https://doi.org/10.3390/su11164396
Chicago/Turabian StyleKourosh Niya, Ali, Jinliang Huang, Hazhir Karimi, Hamidreza Keshtkar, and Babak Naimi. 2019. "Use of Intensity Analysis to Characterize Land Use/Cover Change in the Biggest Island of Persian Gulf, Qeshm Island, Iran" Sustainability 11, no. 16: 4396. https://doi.org/10.3390/su11164396
APA StyleKourosh Niya, A., Huang, J., Karimi, H., Keshtkar, H., & Naimi, B. (2019). Use of Intensity Analysis to Characterize Land Use/Cover Change in the Biggest Island of Persian Gulf, Qeshm Island, Iran. Sustainability, 11(16), 4396. https://doi.org/10.3390/su11164396