1. Introduction
With the continuous rapid growth of the airline industry, the air traffic volume will double in the next 15 years [
1]. A report from the International Air Transport Association (IATA) in 2017 stated that aircraft fuel consumption is the largest operating expenditure of airlines [
2]. According to the International Civil Aviation Organization (ICAO), for commercial flights, airplanes should carry required fuel that includes “taxi fuel; trip fuel (to reach intended destination); contingency fuel (at least 5% of ‘trip fuel’ or 5 min of holding flight); alternate destination fuel; final reserve fuel (45 min of holding flight for reciprocating engines, 30 min for jets); additional fuel (if needed to guarantee the ability to reach an alternate with an engine failure or at a lower altitude due to a pressurization loss); and discretionary fuel (if the pilot in command wants it)” [
3]. Fuel fraction is the weight of the fuel divided by the gross take-off weight of the aircraft. The weight of fuel that an aircraft carries consumes fuel during aircraft operation, called the “oil flying oil” phenomenon. Therefore, an accurate estimation of aircraft fuel consumption—especially trip fuel, because it is a large portion of the total fuel—can help control the fuel load precisely and avoid excessive fuel consumption and the consequent negative environmental impact. It will benefit airlines through a reduced operating cost and air traffic control through accurate flight trajectory prediction and, eventually, more effective air traffic management. Among the different phases of aircraft operation, take-off consumes a significant percentage of fuel. Therefore, in this study, the focus was on modeling fuel consumption of the climbing phase of departure aircraft.
Some governmental organizations, including ICAO, the U.S. Federal Aviation Administration (FAA), and the European Organization for the Safety of Air Navigation (EUROCONTROL), have established computing devices and methods for aircraft fuel consumption and emissions [
4]. FAA established the Aviation Environmental Design Tool (AEDT) to predict jet fuel burn and emissions for all commercial flights globally [
5]. EUROCONTROL used the Base of Aircraft Data (BADA) database to calculate fuel consumption and emissions in all phases of flight operation [
6]. Extensive studies have been performed to understand factors influencing aircraft fuel consumption and to apply different methods to estimate fuel consumption [
7], including fuel consumption analysis based on performance data, principles of energy conservation, neural networks, regression analysis, and difference analysis of fuel consumption under different flight trajectories.
Analysis of influence factors of fuel consumption. Turgut et al. [
8] and Brueckner and Abreu [
9] determined that aircraft mass and speed during the cruising phase are the main influence factors of fuel consumption; their studies developed empirical equations for the cruise phase fuel flow on the basis of actual flight data of five aircraft models, but did not provide the modeling calculation of fuel consumption during the departure climbing phase. Bartel and Young [
10] established a model of fuel consumption for turbofan jet aircraft; however, the model was not used to study the influences of changes in meteorological environments, such as the atmospheric density, temperature, and pressure at different altitudes, on fuel consumption. Crosswind, a major meteorological factor that influences aircraft operation, has been studied in the existing literature. For example, Assaad et al. [
11] proposed the development of a realistic Air Traffic Flow Optimization framework that defines optimal trajectories to reduce fuel consumption considering crosswind influence. However, few studies of fuel consumption models have considered the effect of crosswind.
Calculation of fuel consumption on the basis of the BADA aircraft performance model. The BADA Aircraft Performance Model (APM) was developed and is maintained by EUROCONTROL [
6]. Many scholars have studied aircraft fuel consumption models based on the APM in the BADA database. Burzlaff [
12] and Pagoni and Psaraki-Kalouptsidi [
13] calculated aircraft fuel consumption during flight operation on the basis of an aircraft performance model in the BADA database; however, in their studies, relationships between aerodynamic parameters were acquired from static diagrams obtained through wind tunnel experiments. The static diagrams were extracted using test flight data from the wind tunnel experiment, which had gaps from true flight data and caused errors in the calculation results. Kaiser et al. [
14] established a fuel consumption model based on the BADA database, in which accurate relational expressions between aerodynamic parameters were obtained through data fitting. Their methods avoided the tedious process of manually inquiring static aircraft diagrams. However, the data used in the fitting were acquired through Airbus Performance Engineer’s Programs software, which was also obtained under ideal circumstances; thus, errors existed while comparing the fuel consumption calculated with their model and that from true quick access recorder (QAR) data. Senzig et al. [
15] used the BADA performance model to calculate fuel consumption and conducted a comparative analysis with data from a flight data recorder. The result indicated that certain calculation errors would exist if the BADA performance model was used directly.
Modeling fuel consumption based on the principle of the conservation of energy. Collins [
16] proposed an estimation model of fuel consumption on the basis of the principle of the conservation of energy. This study established an equation of motion for an aircraft according to flight trajectory and performance parameters in the longitudinal section in the climbing phase and calculated the mechanical energy of the aircraft in the flight trajectory—that is, the sum of kinetic and potential energies. Given aircraft performance parameters, the fuel consumed by an aircraft to keep the motion status in the flight trajectory can be calculated, and the balance between aircraft mechanical energy and the energy provided by fuel consumption can be maintained. Therefore, aircraft fuel consumption can be calculated by establishing an energy balance equation. This model did not consider the influences of meteorological conditions, such as wind speed and aircraft performance degradation, on fuel consumption.
Prediction model of fuel consumption based on a neural network. Trani et al. [
17] trained a neural network and obtained fuel consumption values based on an aircraft performance manual; however, the proposed neural network structure had low convergence. Moreover, the influence of crosswind on fuel consumption was not considered in the model. QAR is mainly used by airlines for routine aircraft maintenance, flight inspection, and aircraft performance monitoring. With the extensive application of QAR data in aircraft performance calculation, some scholars have used neural networks to analyze fuel consumption during the aircraft operation process. For example, Baklacioglu [
18] optimized a neural network model for the fuel consumption of a transport aircraft operation based on a genetic algorithm. The study used historical QAR flight data to establish the neural network model and incorporated the flight altitude and true airspeed into the model; however, it disregarded the influences of meteorological factors and aircraft performance on fuel consumption.
Prediction of fuel consumption based on regression analysis. Turgut et al. [
8] determined the influences of dynamic flight parameters on fuel consumption to reach the optimal balance between economic and environmental indices. They applied multiple linear regression analysis taking cruising altitude, aircraft mass, and speed parameters as explanatory variables and worked out an empirical formula of fuel flow in the cruising phase. Yanto and Liem [
19] derived a two-dimensional regression model to approximate fuel burn for each aircraft type, using the mission payload and range as input variables for obtaining a result of fuel consumption; however, their method has high requirements for historical data and is not easy to implement.
Continuous Climb Operations (CCO) is a new climb operation mode allowing flights to follow an optimized climbing profile based on the performance of the aircraft. Conforming to ATC clearance, the aircraft can climb to an initial cruising altitude under optimal airspeed and engine thrust during the climbing process. The basic precondition for continuous climbing and departure procedure design is that the climbing rates of all aircraft are not restricted, thereby requiring sufficient vertical airspace to ensure no interference with CCO. If the precondition is satisfied, the aircraft continuously climbs to the initial cruising altitude according to a certain inclination and climbing gradient without any leveling-off during the climbing. In comparison with the conventional climb operation mode, CCO has the advantages of saving jet fuel, improving passenger comfort, abating airport noise, and reducing exhaust emissions and the workload of air traffic controllers and flight crews [
20]. Some scholars [
21,
22,
23,
24,
25] have studied the aircraft fuel cost and flight safety under CCO. For example, the trajectory optimization and operation efficiency of CCO were studied by Owen et al. [
26], Betts and Cramer [
27], and Soler et al. [
28]. Rosenow et al. [
22] presented the optimum climb profiles of four different aircraft types by modeling trajectories with an aircraft performance model. However, the proposed fuel consumption model did not consider the influence of crosswind, and it also used ideal data to fit the relationships between aerodynamic parameters; thus, the computation result was inaccurate.
In summary, all estimation methods for fuel consumption in the existing literature have caveats. Specifically, the modeling method based on the principle of energy conservation does not consider the effect of aircraft performance degradation on fuel consumption and the influence of meteorological factors such as crosswind. The training model based on a neural network presents an obvious fluctuation in the estimated result, a certain error exists between the estimated total fuel consumption and true QAR value, and the influences of performance parameters on fuel consumption are not analyzed. The regression analysis method has high requirements for historical data, and the present literature does not involve meteorological factors or performance parameters; consequently, the prediction accuracy is degraded. Most existing studies on fuel consumption in the climbing phase consider conventional climbing operation, only a few have looked into the impact of CCO on fuel consumption, and the outcomes from the conventional and CCO are not compared.
Observing the gaps in the existing literature, this study focuses on the climbing phase of aircraft operation, uses true QAR operation data to reveal the relationships between aerodynamic parameters, and applies the outcomes to a fuel consumption model. A crosswind kinetic model is introduced to refine the model and improve the accuracy. True QAR data from two airports in China were acquired for numerical experiments, which demonstrate the effectiveness of the proposed fuel consumption model; transferability of the model from one airport to another; and the impact of aircraft mass, climbing angle, and aircraft types on fuel consumption. The main contributions and innovations of this study are summarized as follows:
In previous studies, the relationships between aerodynamic parameters were obtained by referring to a static diagram acquired through wind tunnel experiments. Therefore, additional fuel consumption caused by aircraft performance degradation could not be estimated, which resulted in errors in the computed results. In this study, the relationship between lift and drag coefficients in the BADA fuel consumption model was obtained from fitting QAR data, and the fuel consumption model under wind-free conditions was obtained;
Few previous studies of fuel consumption models have involved the influence of crosswind on fuel consumption; thus, the computed results have been inaccurate. In this study, the crosswind parameter is added to the fuel consumption model under wind-free conditions through a flight kinetic analysis. The refined model improves the computing accuracy of fuel consumption;
Based on the above theoretical modeling, a fuel consumption model of a representative aircraft type at one airport in China was developed. The same model was then used for calculating the fuel consumption of aircraft operations at another airport. The comparison of the results with actual QAR data shows that the model is transferrable with a high accuracy;
A comparative analysis of fuel consumption using the conventional climbing operation or CCO was performed, and the benefit of CCO was quantified. Finally, this study investigated the influences of aircraft mass, climbing angle, and aircraft type on fuel consumption under different circumstances.
The remainder of this paper is organized as follows.
Section 2 introduces an aircraft fuel consumption model and aerodynamic and thrust models, and describes the process of acquiring meteorological parameters.
Section 3 introduces the method of obtaining the relationships between aerodynamic parameters and the analysis of the influence of crosswind on flight airspeed. The fuel consumption model considering crosswind was realized through a flight kinetic analysis, which is described in
Section 4. The solution methodology is presented in
Section 5. Five comparative experiments are described in
Section 6, and
Section 7 concludes the study and discusses future research directions.
2. BADA-Based Fuel Consumption Model
The BADA aircraft performance database model [
6,
29], developed by EUROCONTROL for flight kinematic analysis, is mainly applied to flight simulation, flight trajectory prediction, fuel consumption calculation, and emission estimation. The model exhibits great advantages in the aspects of flight simulation degree, complexity, and accuracy. The aircraft fuel consumption model in the climbing phase is expressed as follows:
Parameters:
| thrust-specific fuel flow, kg/(min·kN); |
| VTAS | true airspeed, knots; |
| Cf1 | first thrust-specific fuel consumption coefficient, kg/(min·kN); |
| Cf2 | second thrust-specific fuel consumption coefficient, knots; |
| fclimb | fuel consumption within unit time, kg/min; |
| T | thrust acting parallel to the aircraft speed vector in the climbing phase, Kn; |
| D | aerodynamic drag in the climbing phase, kN; |
| L | lift in the climbing phase, kN; |
| m | aircraft mass, kg; |
| g | gravitational acceleration, kg/s2; |
| VTAS’ | true airspeed in the body coordinate system, knots; |
| CL | lift coefficient; |
| CD | drag coefficient; |
| S | wing reference area, m2; |
| F | fuel consumption in the entire climbing phase, kg; |
| N | number of engines; |
| T1 | atmospheric temperature, T0 = 25 °C; |
| atmospheric pressure, MPa; |
| standard atmospheric pressure at MSL, = 0.1013 MPa; |
| H | altitude, m; |
| atmospheric density, kg/m3; |
| wind speed, knots; |
| wind direction; |
| Lbg | coordinate transformation matrix from the ground coordinate system to body coordinate system; |
| track angle in the entire climbing phase; |
| yaw angle in the entire climbing phase; |
| roll angle in the entire climbing phase; |
| angle of pitch in the entire climbing phase. |
(1) The fuel consumption model in the climbing phase—the fuel consumption of the unit thrust of a turbo jet aircraft within unit time is
where
η is the thrust-specific fuel flow, kg/(min·kN);
VTAS is the true airspeed in knots; and
Cf1 and
Cf2 are coefficients. Through a combination with the thrust in the nominal flight section in the aircraft-climbing phase, the fuel consumption within unit time can be derived as follows:
where
T is the thrust acting parallel to the aircraft speed vector in the climbing phase, kN, and
fclimb is the fuel consumption within unit time, kg/min;
(2) Aerodynamic and thrust models—the aircraft bears the effects of lifting force, gravity, drag, and thrust in the flight, which directly affect its flight speed. On the basis of aerodynamic performance data in the climbing phase, drag and thrust models can be obtained as follows:
where γ is the track angle in the entire climbing phase;
D is the aerodynamic drag in the climbing phase, kN;
L is the lift in the climbing phase, kN;
CL is the lift coefficient; and
CD is the drag coefficient.
Fuel consumptions at different times in the climbing phase can be obtained through the above two groups of models. If the time interval of climbing can be equally divided into
k time windows, fuel consumption in the entire climbing phase can be obtained through superposition, as shown in the follow equation:
where
F is the fuel consumption in the entire climbing phase, kg, and
N is the number of engines;
(3) Meteorological parameters—atmosphere is a layer of gas mixture surrounding the Earth, and its main parameters are pressure, temperature, and density. The values of these parameters change greatly in the vertical direction and are uniform in the horizontal layer. With an increase in altitude, air temperature and density reduce, and the air becomes easier to be compressed, which can improve the utilization of thermal energy and reduce the fuel consumption rate. The relationships between altitude and air temperature, pressure, and density are as follows:
where
T1 is the atmospheric temperature,
T0 = 25 °C;
H is the altitude, m;
is the atmospheric pressure, MPa;
is the standard atmospheric pressure at MSL,
= 0.1013 MPa; and
ρ is the atmospheric density, kg/m
3.
The corresponding air temperature, pressure, and density at each altitude can be calculated according to Equations (7)–(9).
3. Fuel Consumption Modeling
We propose modeling fuel consumption by extracting aerodynamic parameters from data-fitting of QAR data and also considering crosswind influence.
3.1. Data-Fitting Method for Obtaining Aerodynamic Parameters
Given actual QAR operation data, the functional fitting method is used to obtain the relationship between the drag coefficient and lifting force. Multigroup QAR data of different aircraft models are acquired, and the corresponding multigroup drag coefficients and lifting force data under the same Mach number are then extracted. Common curves, such as the power function, exponential function, and polynomial function, will be tested. The goodness of fit (R2) and the sum of squared errors of prediction (SSE) will be calculated and compared. Usually, the closer the R2 value is to 1, the better the fitting of the curve. The residual sum of squares reflects the closeness degree of relationships among variables; thus, the smaller the value is, the more accurate the fitting result is.
3.2. Modeling Crosswind Influence
In the fuel consumption model in
Section 2, the crosswind influence on fuel consumption is not considered, which does not reflect the actual operation environment. Consequently, the computed result is inaccurate. The influence of 3D wind on flight airspeed is modeled in this section to develop a comprehensive model of fuel consumption taking the influence of 3D wind into consideration. Wind data at different altitudes in different areas, including wind speed
and direction
, can be acquired through an inquiry of meteorological data.
Given these two variables, the projection vector
of wind speed in the ground coordinate system can be calculated according to the following equations:
Therefore, the projection vector
of airspeed
in the body coordinate system under the crosswind condition is
where
is respectively calculated as follows:
where
φ is the yaw angle in the entire climbing phase,
is the roll angle in the entire climbing phase, and
is the angle of pitch in the entire climbing phase.
Once
is calculated according to Equations (10)–(12), the airspeed can be obtained with the following equation:
Given Equation (15), Equation (3) can be updated into Equation (16) (see below), and the
T in Equation (4) is now expressed in Equation (17):
where
γ is the track angle in the entire climbing phase. Fuel consumption under the crosswind condition can be calculated according to Equations (1), (2), and (6), as shown below:
4. Kinematic Models of Departure Operation
Two kinematic models are used together to indicate conventional aircraft departure operations—one for the ascending phase and the other for the leveling-off phase. The aircraft initially climbs to a designated altitude based on a certain angle of inclination and climbing rate, then levels off at this altitude and climbs again after leveling off for a certain distance, and finally climbs to an initial cruising altitude. The kinematic models in the ascending phase are as follows:
The kinematic models in the leveling-off phase are as follows:
where
D and
T are the computed results of Equations (16) and (17);
H is the flight altitude;
α is the flight angle of incidence; and
γ is the track angle. The original point O is located at centroids of the aircraft; the OX axis directs at a horizontal projection of the aircraft's heading; the OY axis is horizontally perpendicular to the OX axis; the OZ axis represents the flight altitude; and
,
, and
are the projection of
on the OX axis, OY axis, and OZ axis, respectively.
For CCO operations, as described earlier, the aircraft can continuously climb without leveling off if the precondition is met. Therefore, for CCO analysis in the later section, only kinematic models in the ascending phase are used.
5. Solution Methodology
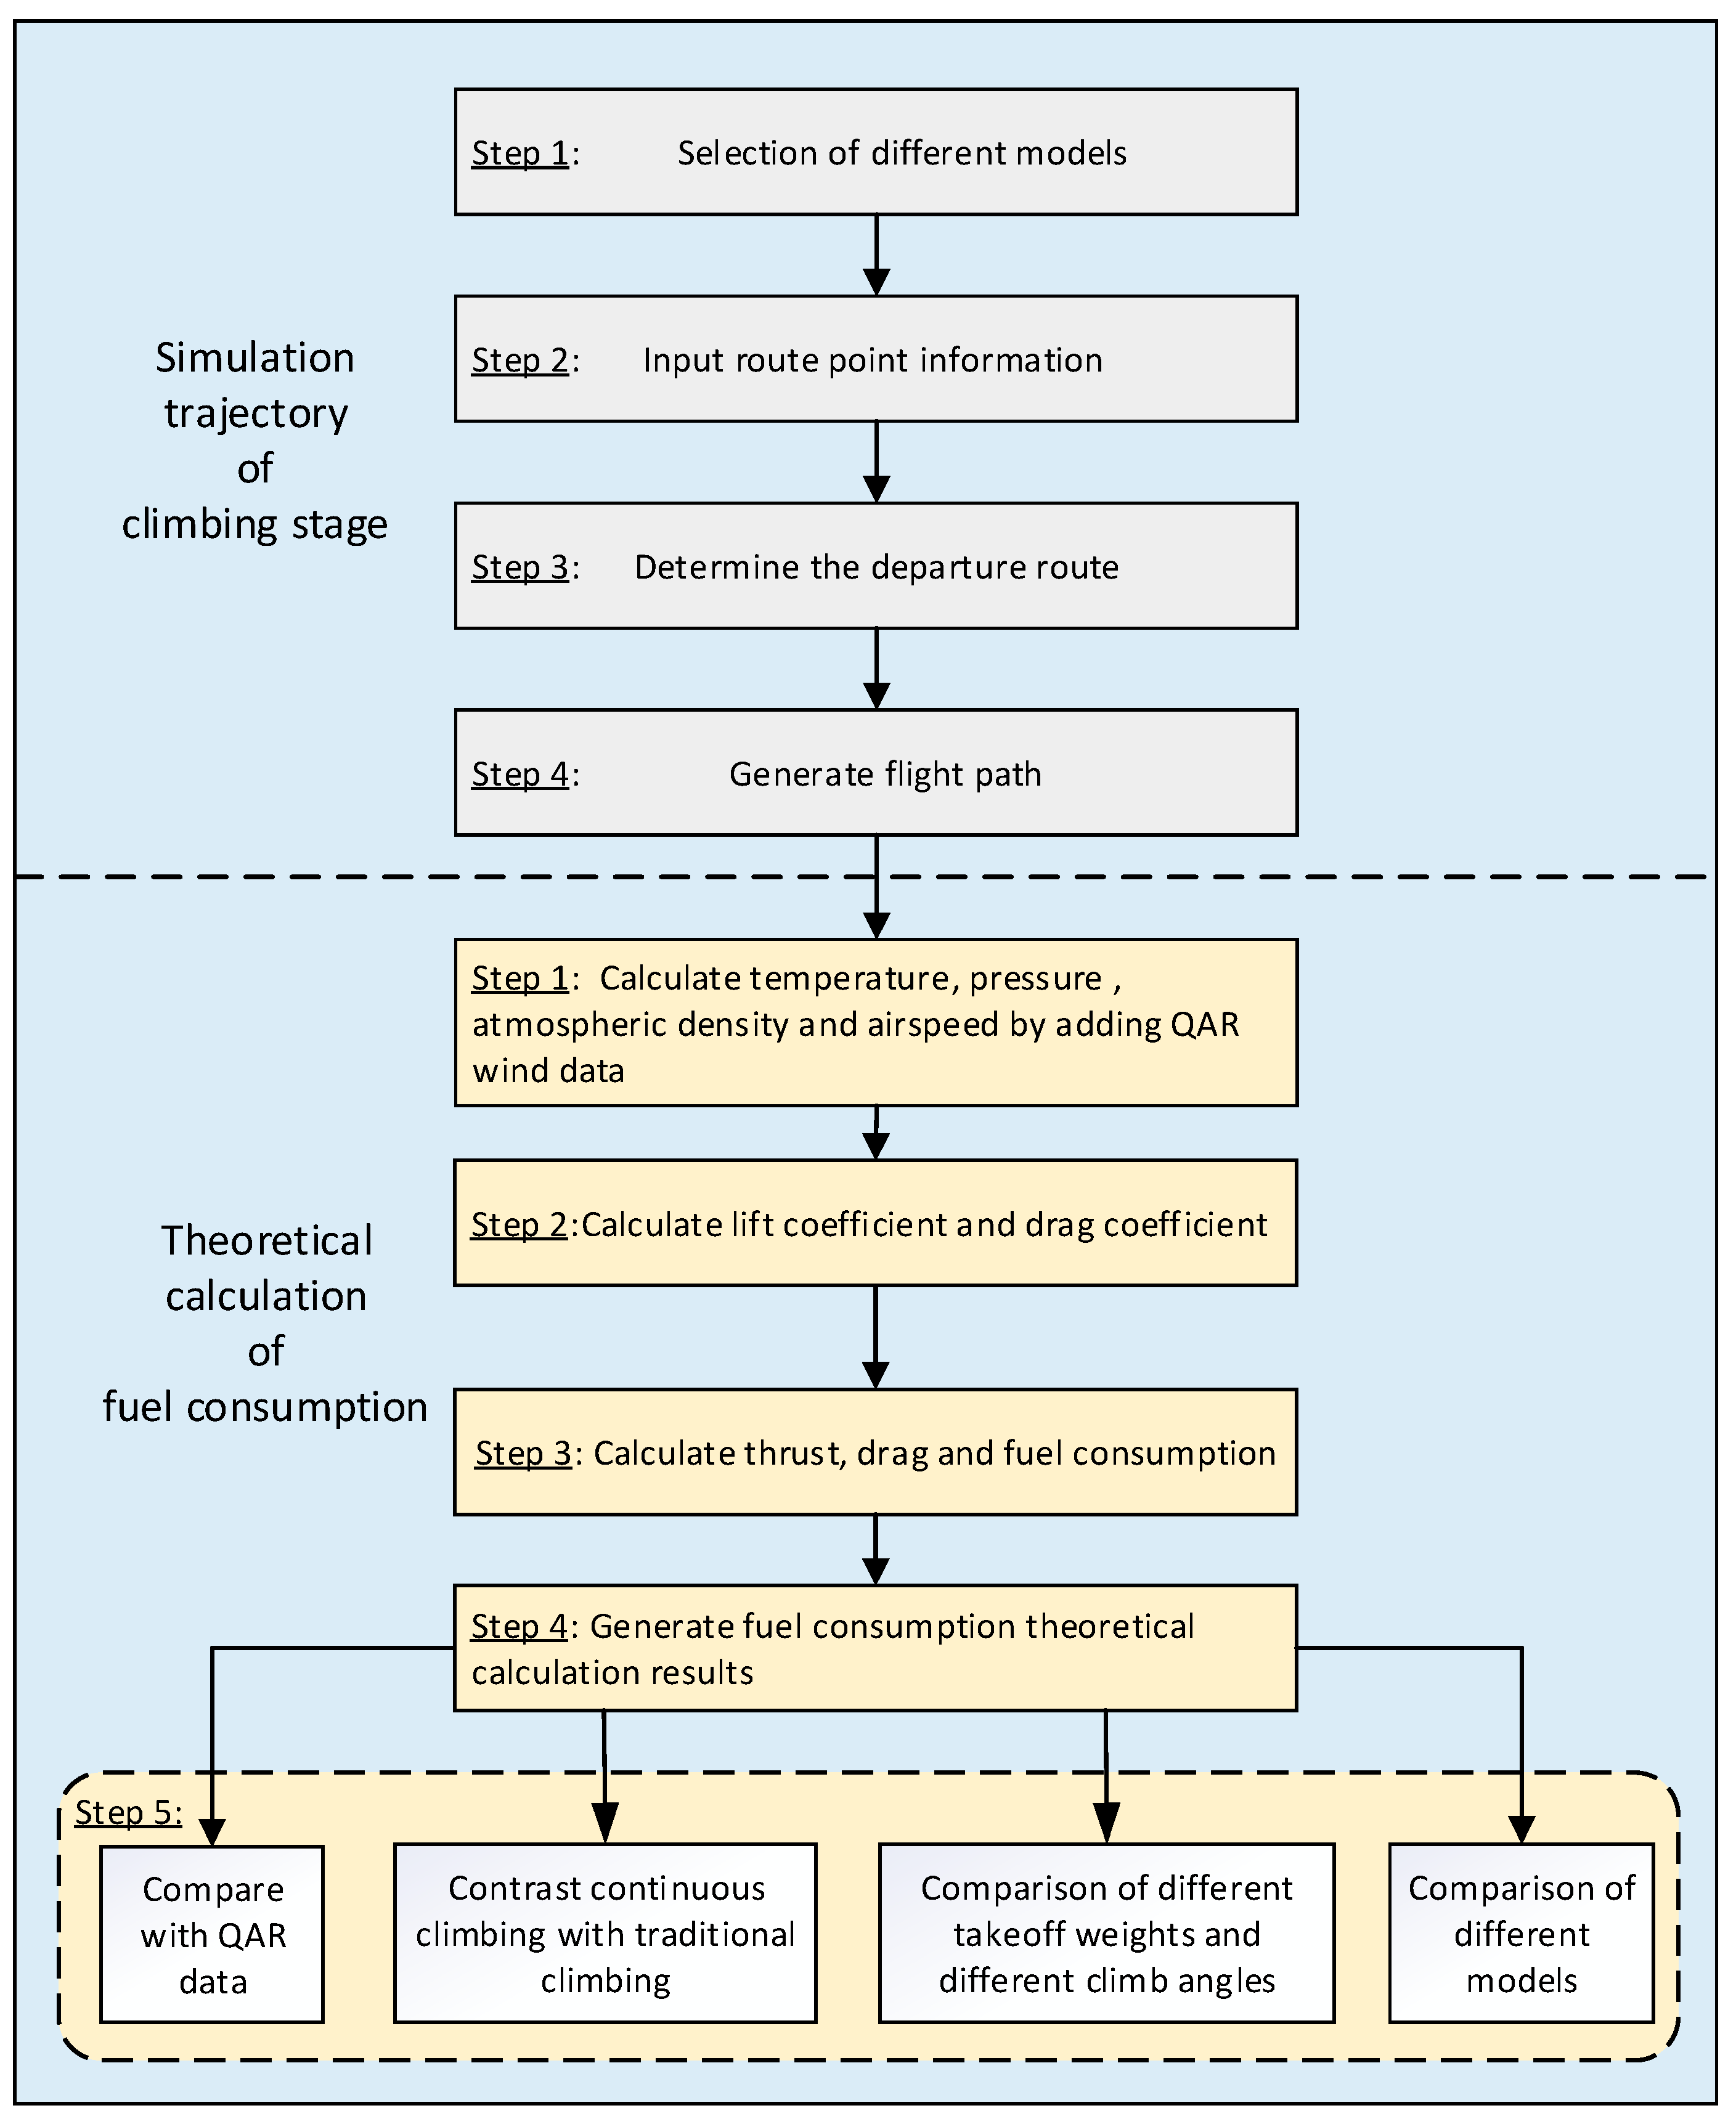
A computer-based tool was developed to realize the theoretical calculation of fuel consumption. The flow chart of the solution method is shown in
Figure 1. It is mainly divided into two parts—the trajectory simulation of the climbing phase and the calculation of fuel consumption.
The climb trajectory simulation includes the following steps:
Step 1: Choose the model. Since this study considers the Airbus A320, A321, and A343 (shorthand for A340-300) models and the Boeing B744 and B773 (shorthand for B747-400 and B777-300, respectively) models, and the performance parameters of the five models are built into the program, including the wing area S, the first and second thrust fuel consumption factors Cf1 and Cf2, and the takeoff weight m, the first step is to match the corresponding performance parameters according to a selected model;
Step 2: Enter the waypoint information. According to the QAR trajectory data, the latitude and longitude coordinates of n waypoints in the climbing phase are selected, and the selected waypoint coordinates are used as part of the trajectory in the simulated trajectory. This process requires converting the latitude and longitude coordinates to the Cartesian coordinates that the simulation program can recognize;
Step 3: Determine the departure route. Given the n waypoints, the entire climb phase can be divided into n-1 segments, and each segment is set with acceleration, starting and ending speed, and starting and ending height. The climb angle of each segment is set to 5°, and each time a waypoint is passed, the heading is adjusted to reach the initial cruise altitude waypoint;
Step 4: According to the previous three steps, the flight path of the entire climbing phase can be simulated, including coordinate points, flight altitude, flight airspeed, heading, and flight distance. The simulated data update rate is 1 s.
The calculation of fuel consumption is divided into the following steps:
Step 1: Calculate temperature T1, pressure pa, and atmospheric density ρ. Based on the simulated flight altitudes information H and Equations (7)–(9), T1, pa, and ρ at different flight altitudes can be calculated. The International Standard Atmospheric Data Sheet can be checked for sound velocity values C at different flight altitudes H. The data of wind ( and ), elevation angle θ, and yaw angle of the climbing stage φ in the QAR data are selected, and the airspeed after adding the wind is then calculated according to Equation (13);
Step 2: Calculate the lift coefficient CL and drag coefficient CD. First, according to the wing area S of each aircraft model, the takeoff weight m, the climb angle γ of each climbing segment, ρ corresponding to each flight altitude, and from Equation (5) can be used to calculate CL of each climb segment. Since the true airspeed and sound velocity C of each climbing segment have been previously simulated, the Mach number = /C, CL at different Mach numbers can be obtained. The relationships between CL and CD under different Mach numbers are fitted with QAR data. Finally, given CL obtained previously and the Mach numbers, CD is obtained;
Step 3: Calculate thrust T, drag D, and thrust-specific fuel flow η. First, D at each flight time can be obtained from CD obtained in Step 2 and Equation (4). Second, the thrust at each flight time can be obtained by Equation (3). Then, based on the matched thrust-specific fuel flow η of each model, the previously-obtained , and Equation (1), η can be calculated. Finally, the fuel consumption per second is obtained by Equation (2);
Step 4: Acquire the theoretical calculation result of the fuel consumption. The fuel consumption per second is superimposed to finally obtain the fuel consumption F of the entire climbing phase. The theoretical calculation results are based on the optimized fuel consumption model (adding the effect of wind and the fitting method to obtain the aerodynamic parameters);
Step 5: Conduct comparative analysis. The theoretical calculation results of fuel consumption are compared with the fuel consumption values in the QAR data to verify whether the optimized model is feasible. In addition, the fuel consumption of the traditional climbing and continuous climbing modes is compared and analyzed. The fuel consumption of different takeoff weights and different climb angles for different aircraft models is compared.
6. Numerical Experiments
6.1. Data Acquisition and Preparation
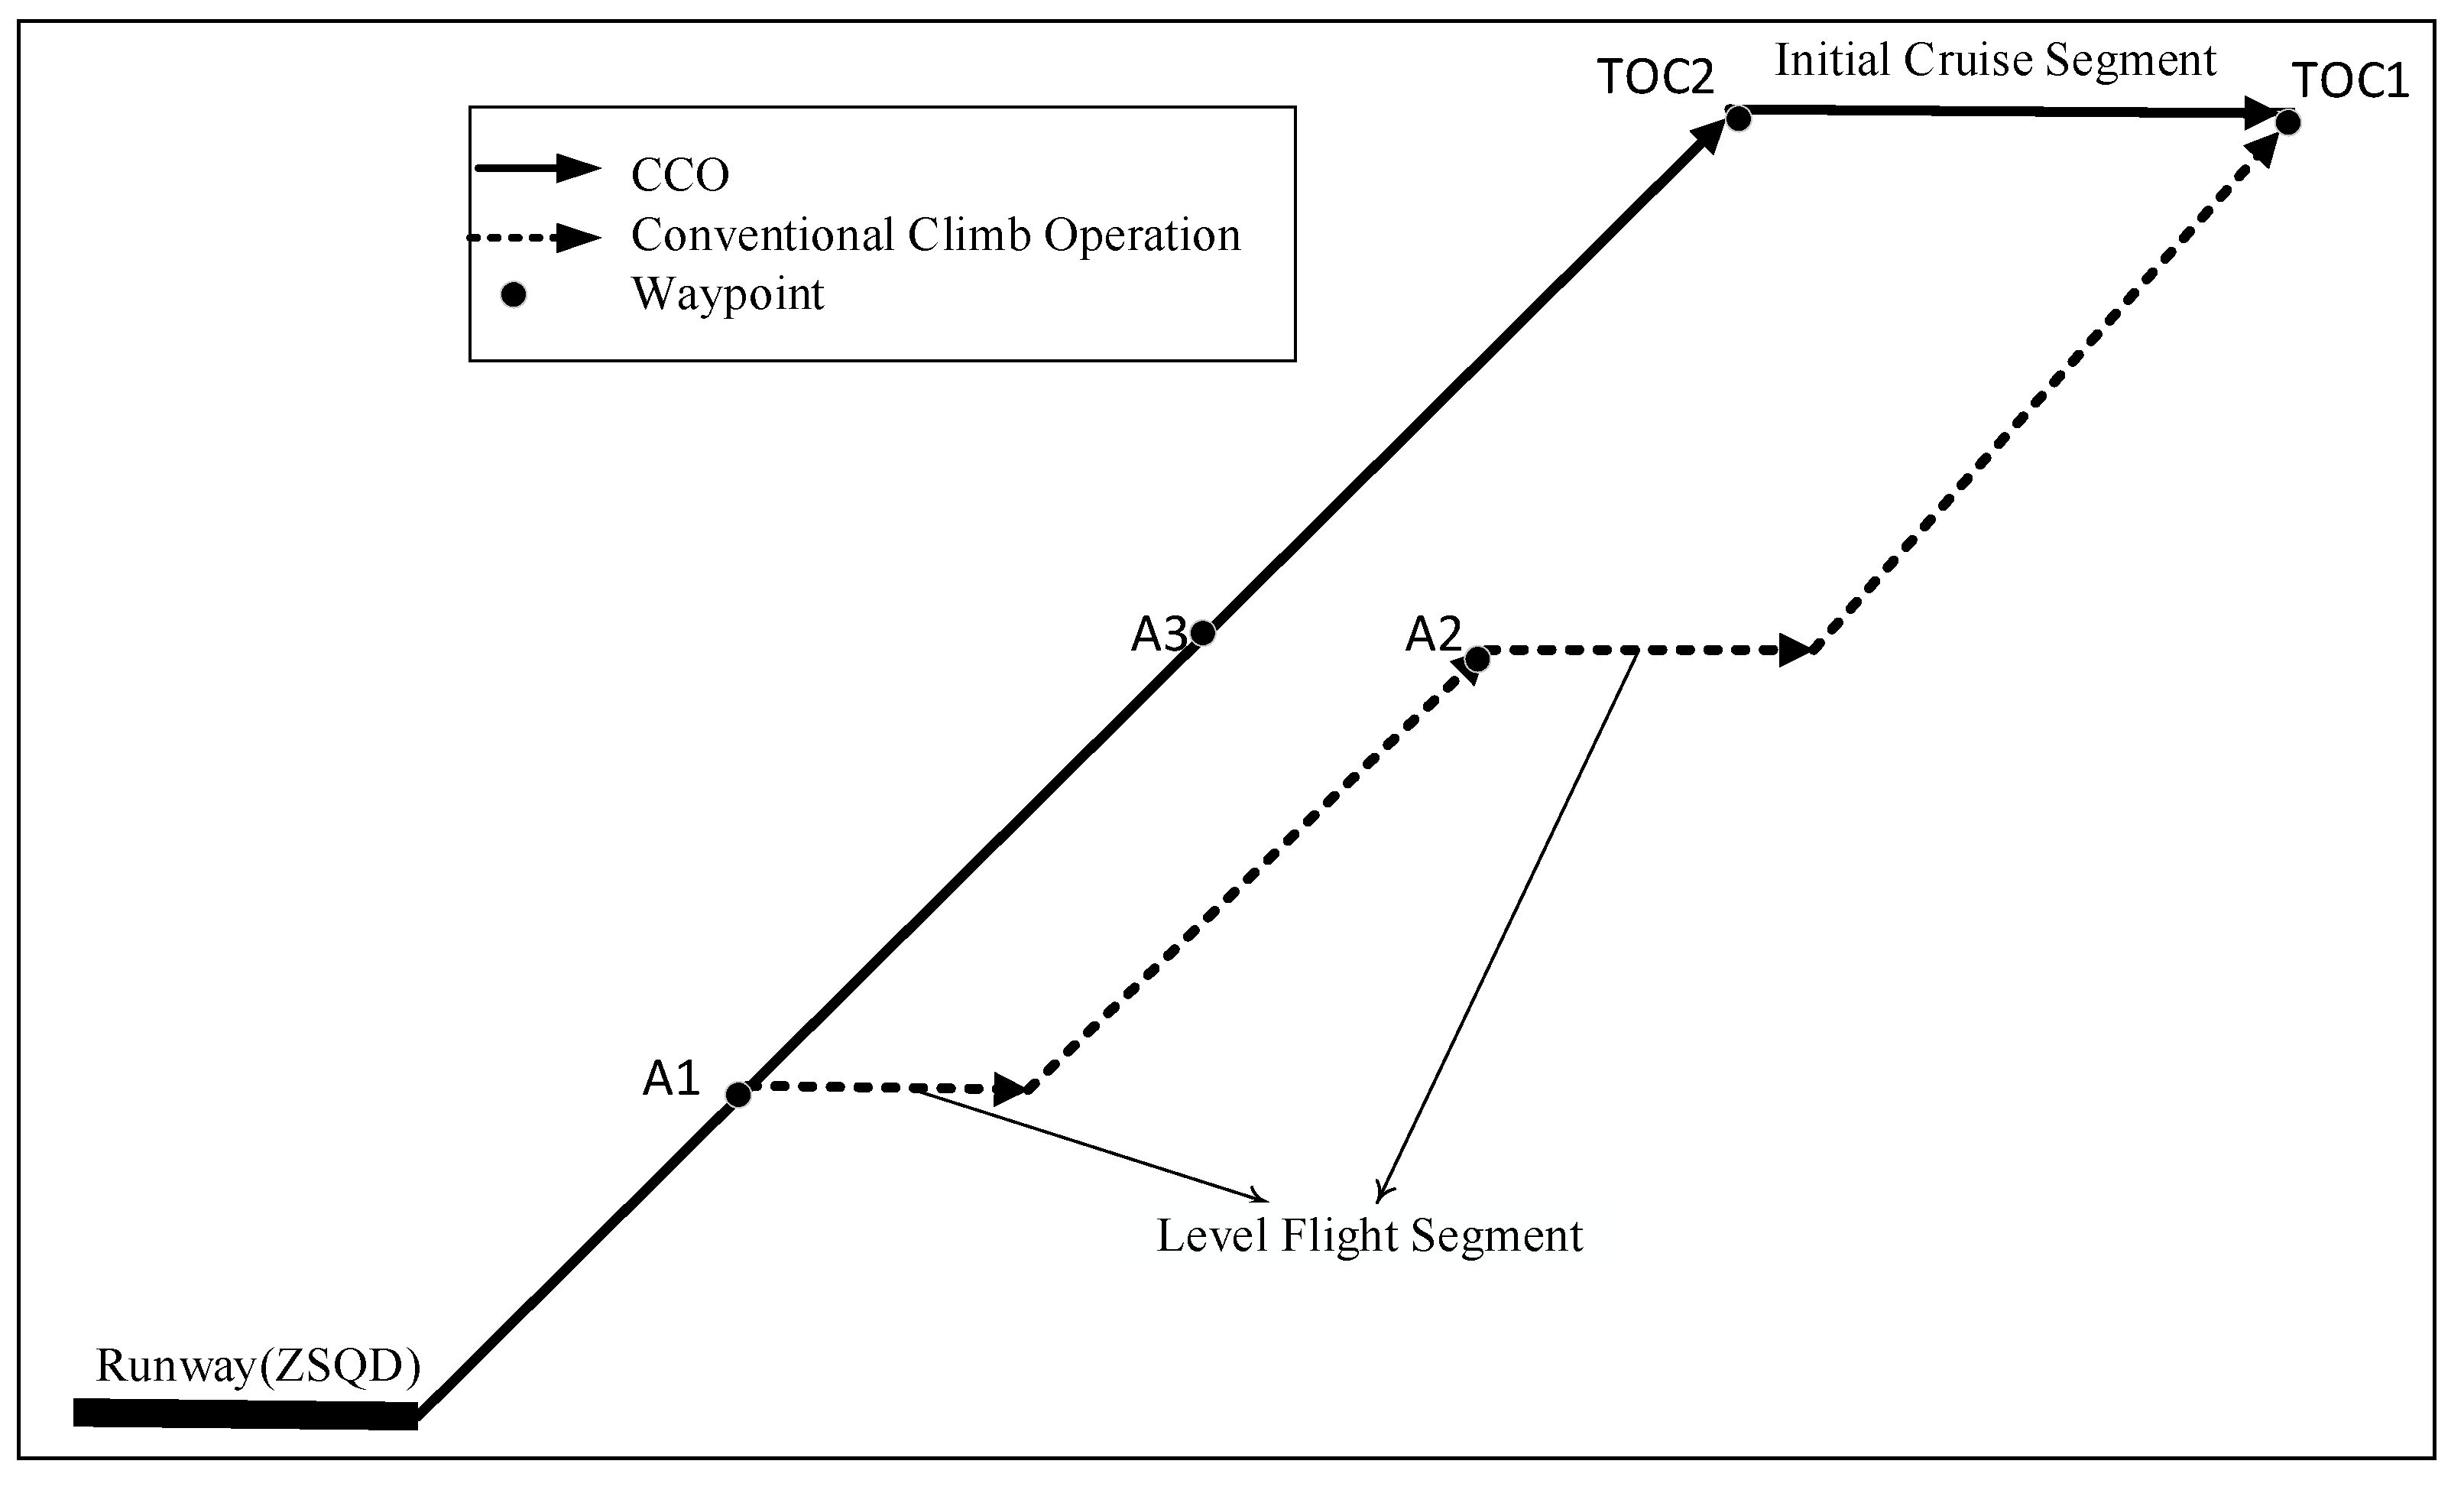
Departures at Qingdao Liuting International Airport (ICAO: ZSQD) were taken as the study object, and departures at Taiyuan Wusu International Airport (ICAO: ZBYN) were used for model verification. The acquired QAR data are the operational data of 431 flights of China Eastern Airlines on Qingdao–Hongqiao air routes and include the wind speed, wind direction, true airspeed, location information, altitude, fuel flow, track angle, yaw angle, angle of pitch, lift coefficient, drag coefficient, air temperature, air pressure, and atmospheric density. Waypoint information of the departure climbing phase in ZSQD was extracted from Qingdao–Hongqiao flight plans, and simulated flight speed and climbing rates were approximated according to QAR data. Two operation modes—CCO and the conventional climb operation, as shown in
Figure 2—were studied. The information of relevant nodes in route segments under two operation modes is summarized in
Table 1 and
Table 2. Aircraft model A320 was selected to demonstrate the simulated climbing phase in this subsection, the aircraft mass was 63 tons, the climbing angle was 5°, and the wing area was 122.6 m
2. Similar analyses have been performed for other aircraft models and are discussed in later sections.
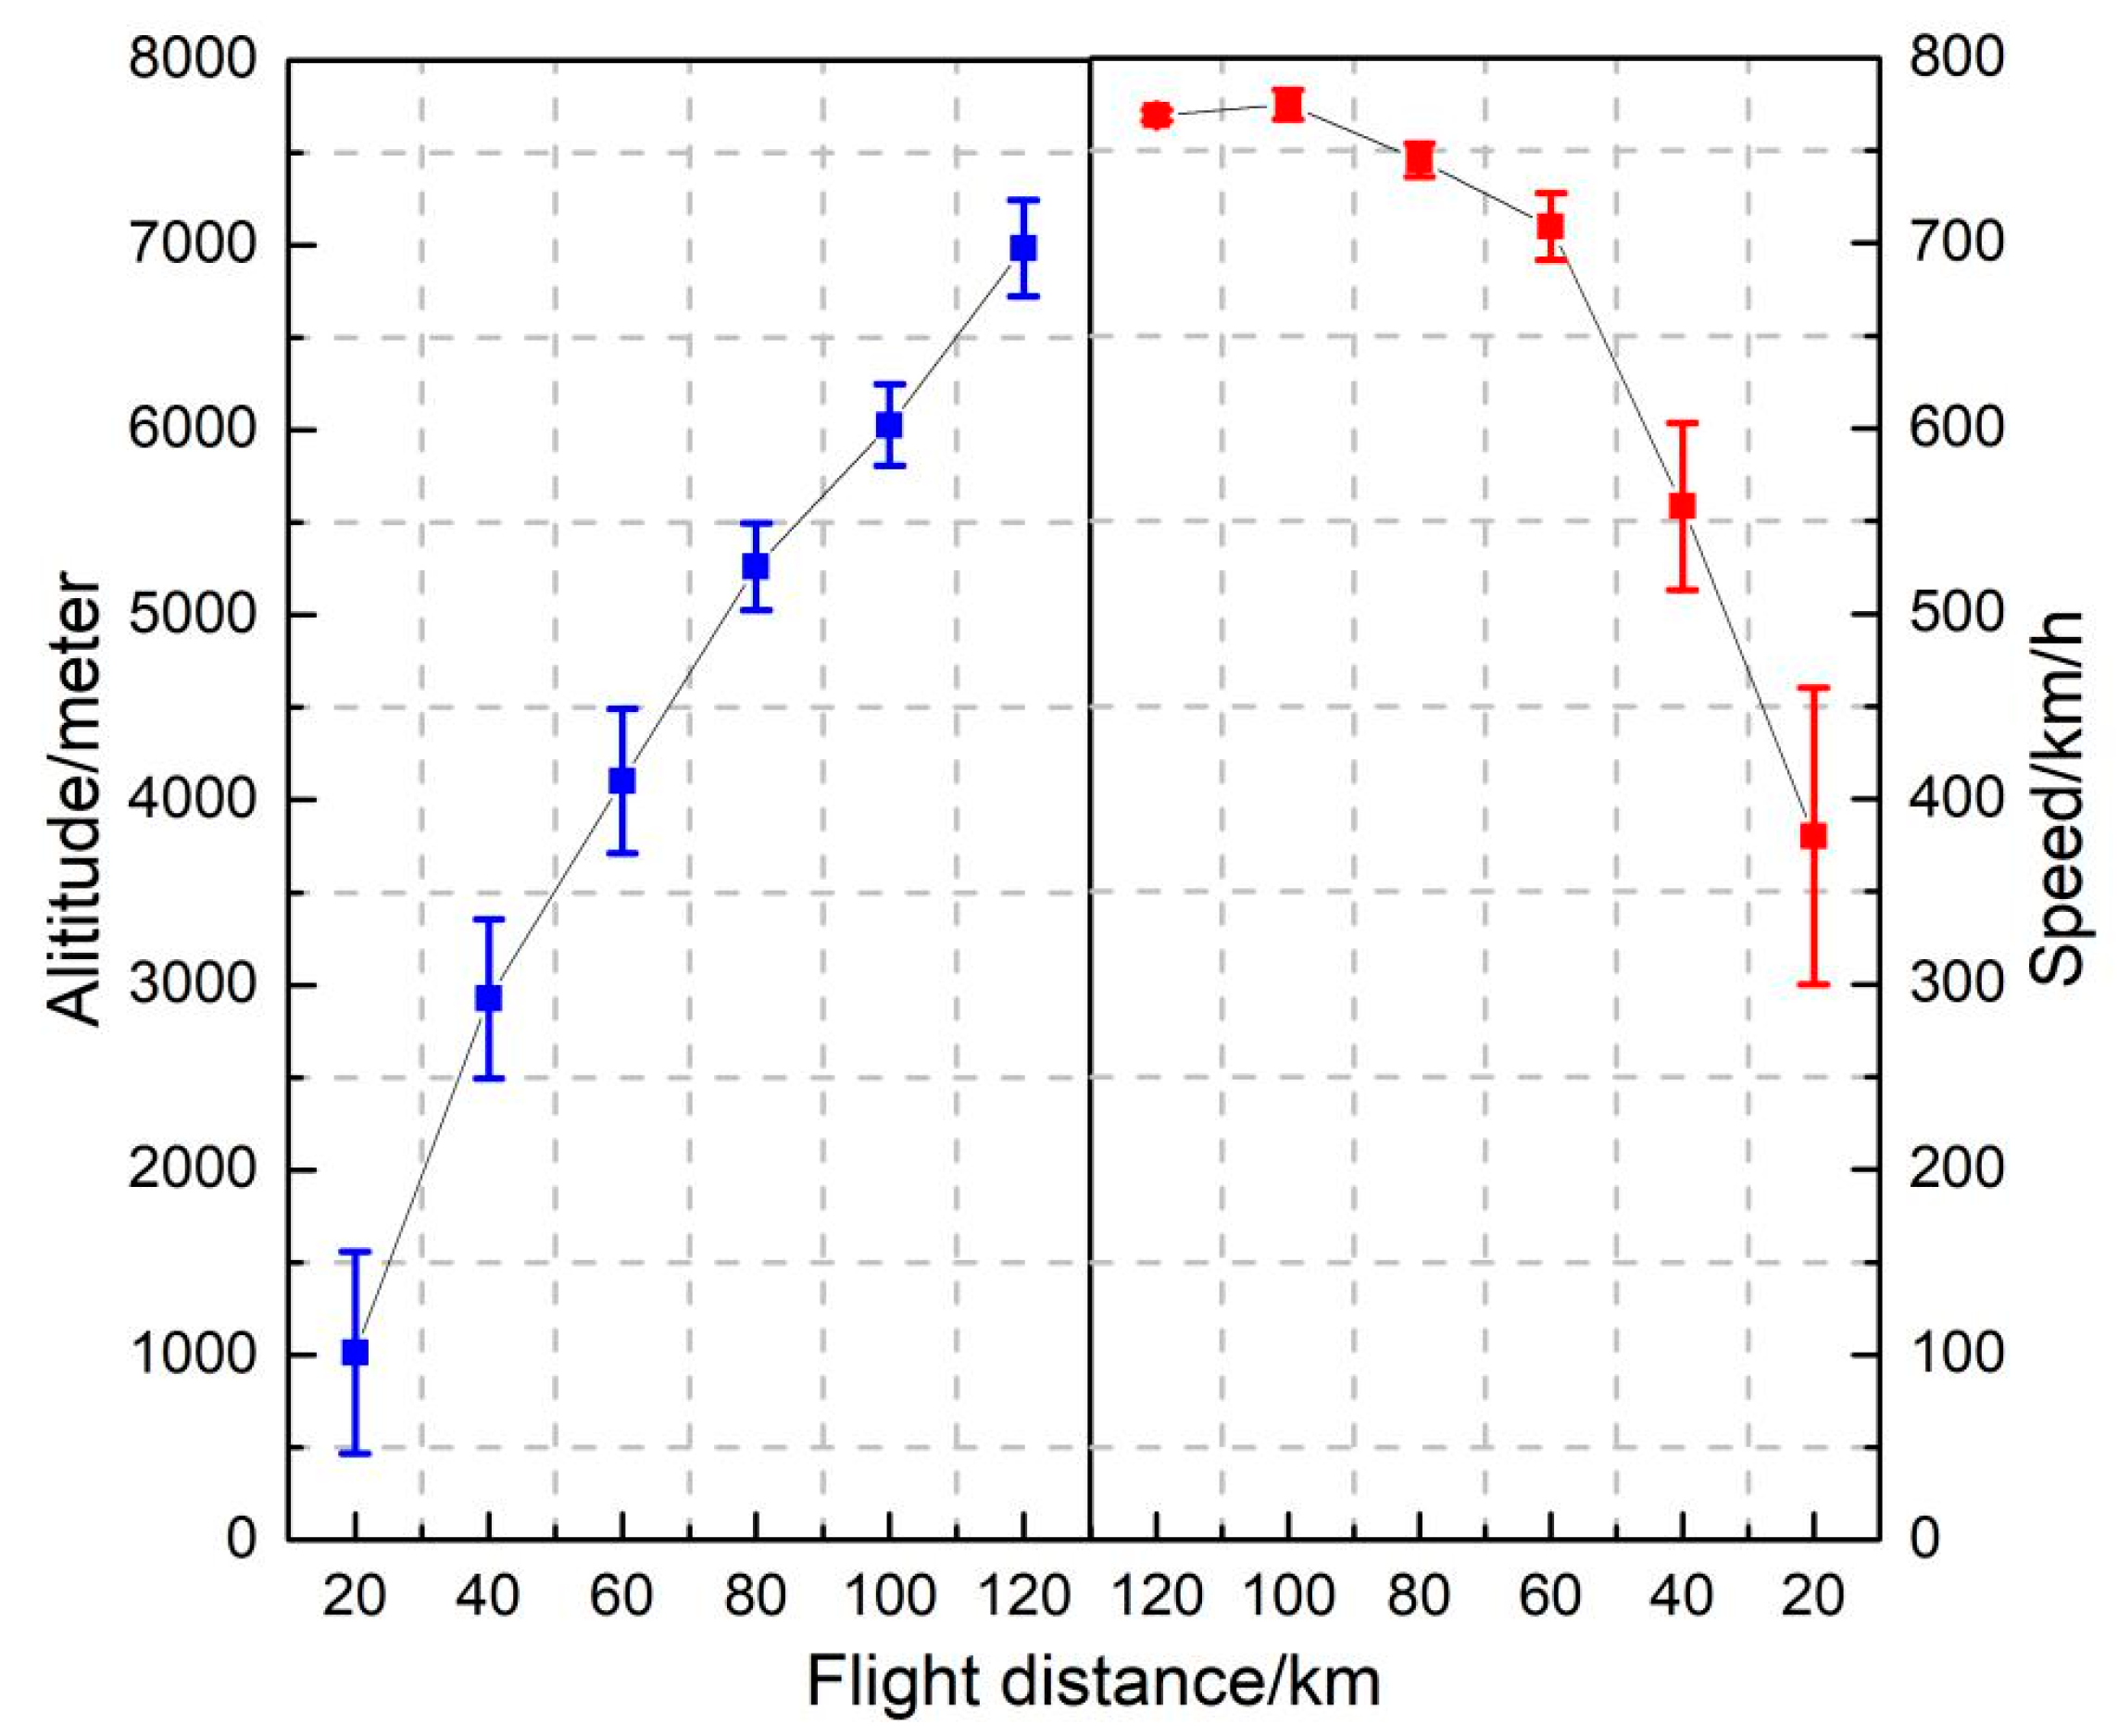
In
Table 1, the A320 aircraft took off from ZSQD with an airspeed of 300 km/h and then climbed to the flight altitude of 1000 m at a certain climbing rate along the A1 direction, in which the flight airspeed was kept at 300 km/h and then reached the A1 waypoint for level flight and acceleration. The flight airspeed was increased to 560 km/h, and the aircraft started to climb along the A2 direction and reached the A2 waypoint to enter level flight and accelerate again. Finally, the aircraft climbed to the initial cruising altitude of 7200 m, at which point the flight airspeed reached 780 km/h, and the climbing phase ended. The changes in altitude and airspeed during the climbing sections were obtained from QAR data (see
Figure 3). Through a comparison of
Table 1 and
Table 2, the major difference is the flight state of the A320 aircraft which have level fight in
Table 1.
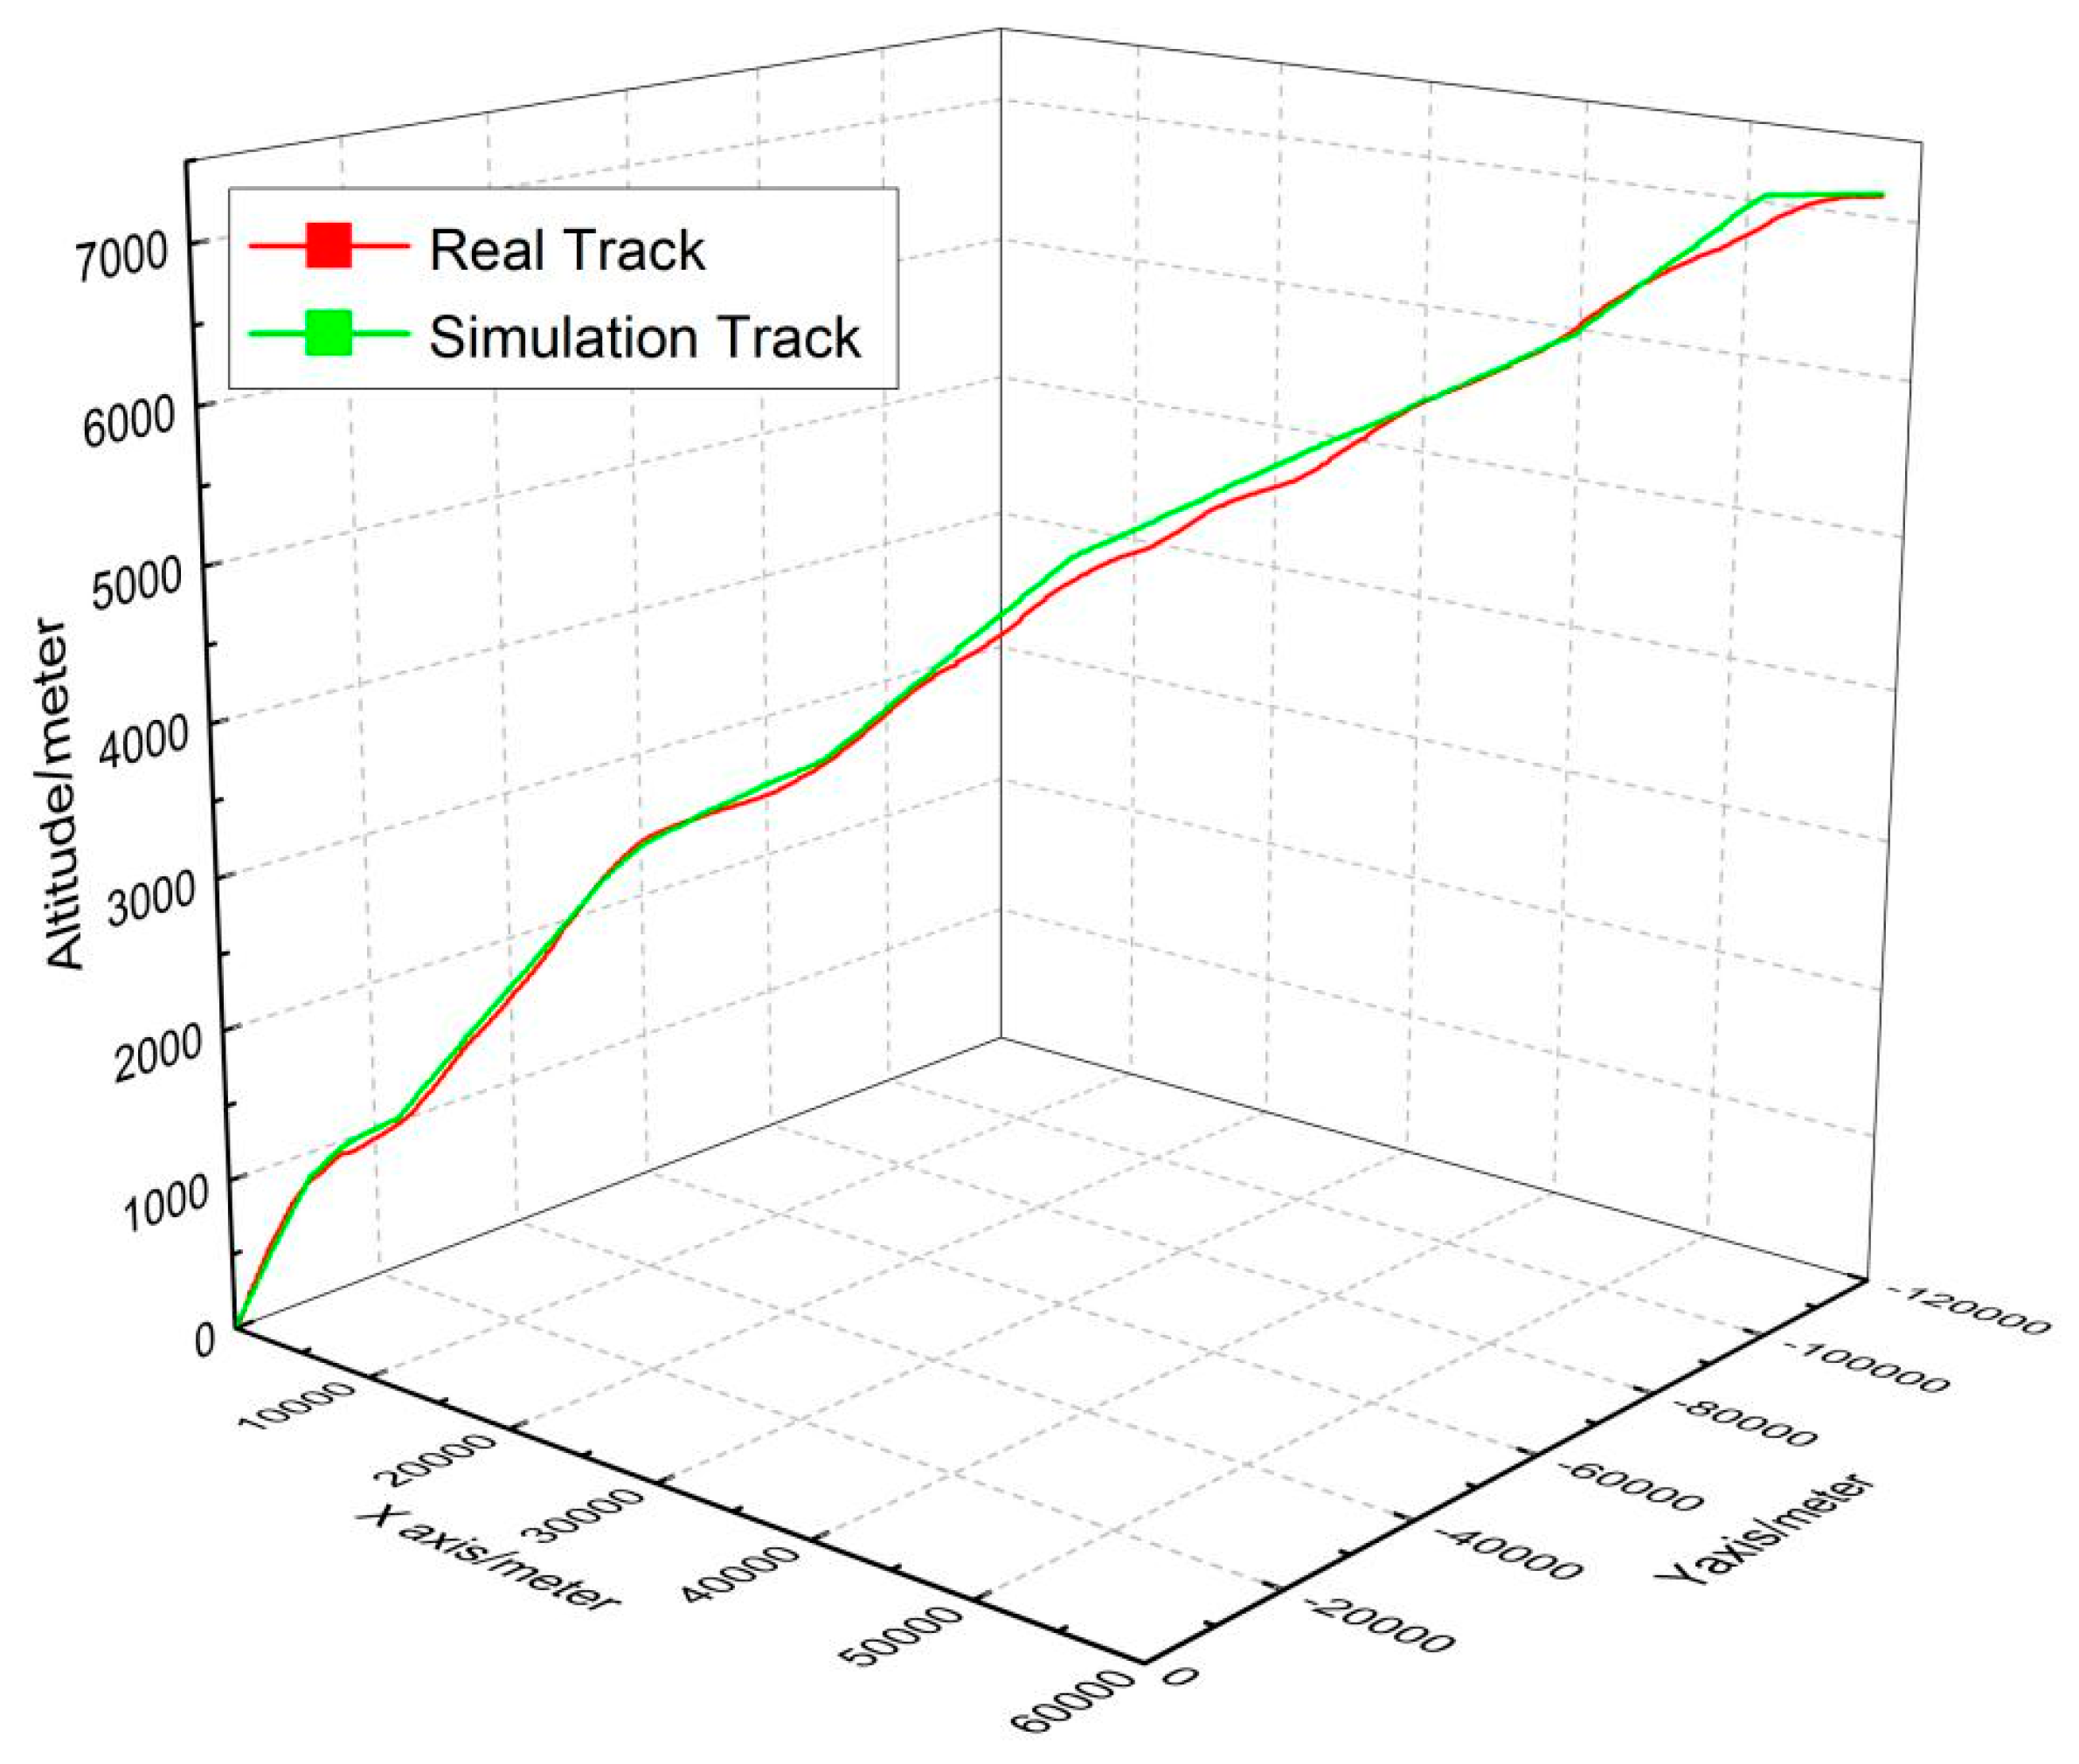
Given the waypoints and the airspeed information, the airport reference point of ZSQD was taken as the origin of the rectangular coordinate system to simulate the flight trajectory in the departure climbing phase. The flight trajectory information included the simulation time, coordinate point, flight altitude, flight direction, and flight airspeed, as shown in
Table 3. The comparison of the simulated A320 trajectory and the actual QAR flight trajectory is shown in
Figure 4.
The simulated flight trajectory information and Equation (5) can be combined to solve the lift coefficients of all points in the flight trajectory. The drag coefficient of each point can be solved through the relationship between lift and drag coefficients. The drag can be solved according to Equation (4), where the air density
ρ, temperature
T1, and air pressure intensity
pa are all obtained through the equations that show changes in meteorological parameters with flight altitude in
Section 2. The thrust value was solved according to Equation (3). The fuel consumption at each point in the flight trajectory was solved by combining Equations (1) and (2).
6.2. Five Comparative Experiments
Five comparative experiments were performed as follows: (1) for the Airbus A320 aircraft model, relationships between aerodynamic parameters were obtained from the static diagram [
30] relation acquired through a wind tunnel experiment and from a fitting method of true QAR data. Given the different sets of aerodynamic parameters, the fuel consumption values of climbing phases of A320 aircraft were calculated and compared; (2) the crosswind effect was added into the fuel consumption model and the calculation outcomes were compared with those in Experiment 1, which did not consider the crosswind effect. The model developed at one airport was used to calculate the fuel consumption of the same type of aircraft at another airport to verify the accuracy of the method; (3) the theoretical value of fuel consumption in the continuous climbing phase was calculated and compared with the theoretical value in the conventional climbing phase; (4) the impact of climbing angle and aircraft mass on fuel consumption was analyzed; and (5) fuel consumptions of different aircraft models—Airbus A320, Airbus A321, Airbus A343, Boeing B744, and Boeing B733—were investigated.
6.2.1. Experiment 1: Optimization Experiment of Aerodynamic Parameters
In fuel consumption models proposed by relevant scholars [
7,
15], aerodynamic parameters are obtained by referring to the static diagram relation acquired through a wind tunnel experiment. The static diagram relationship in
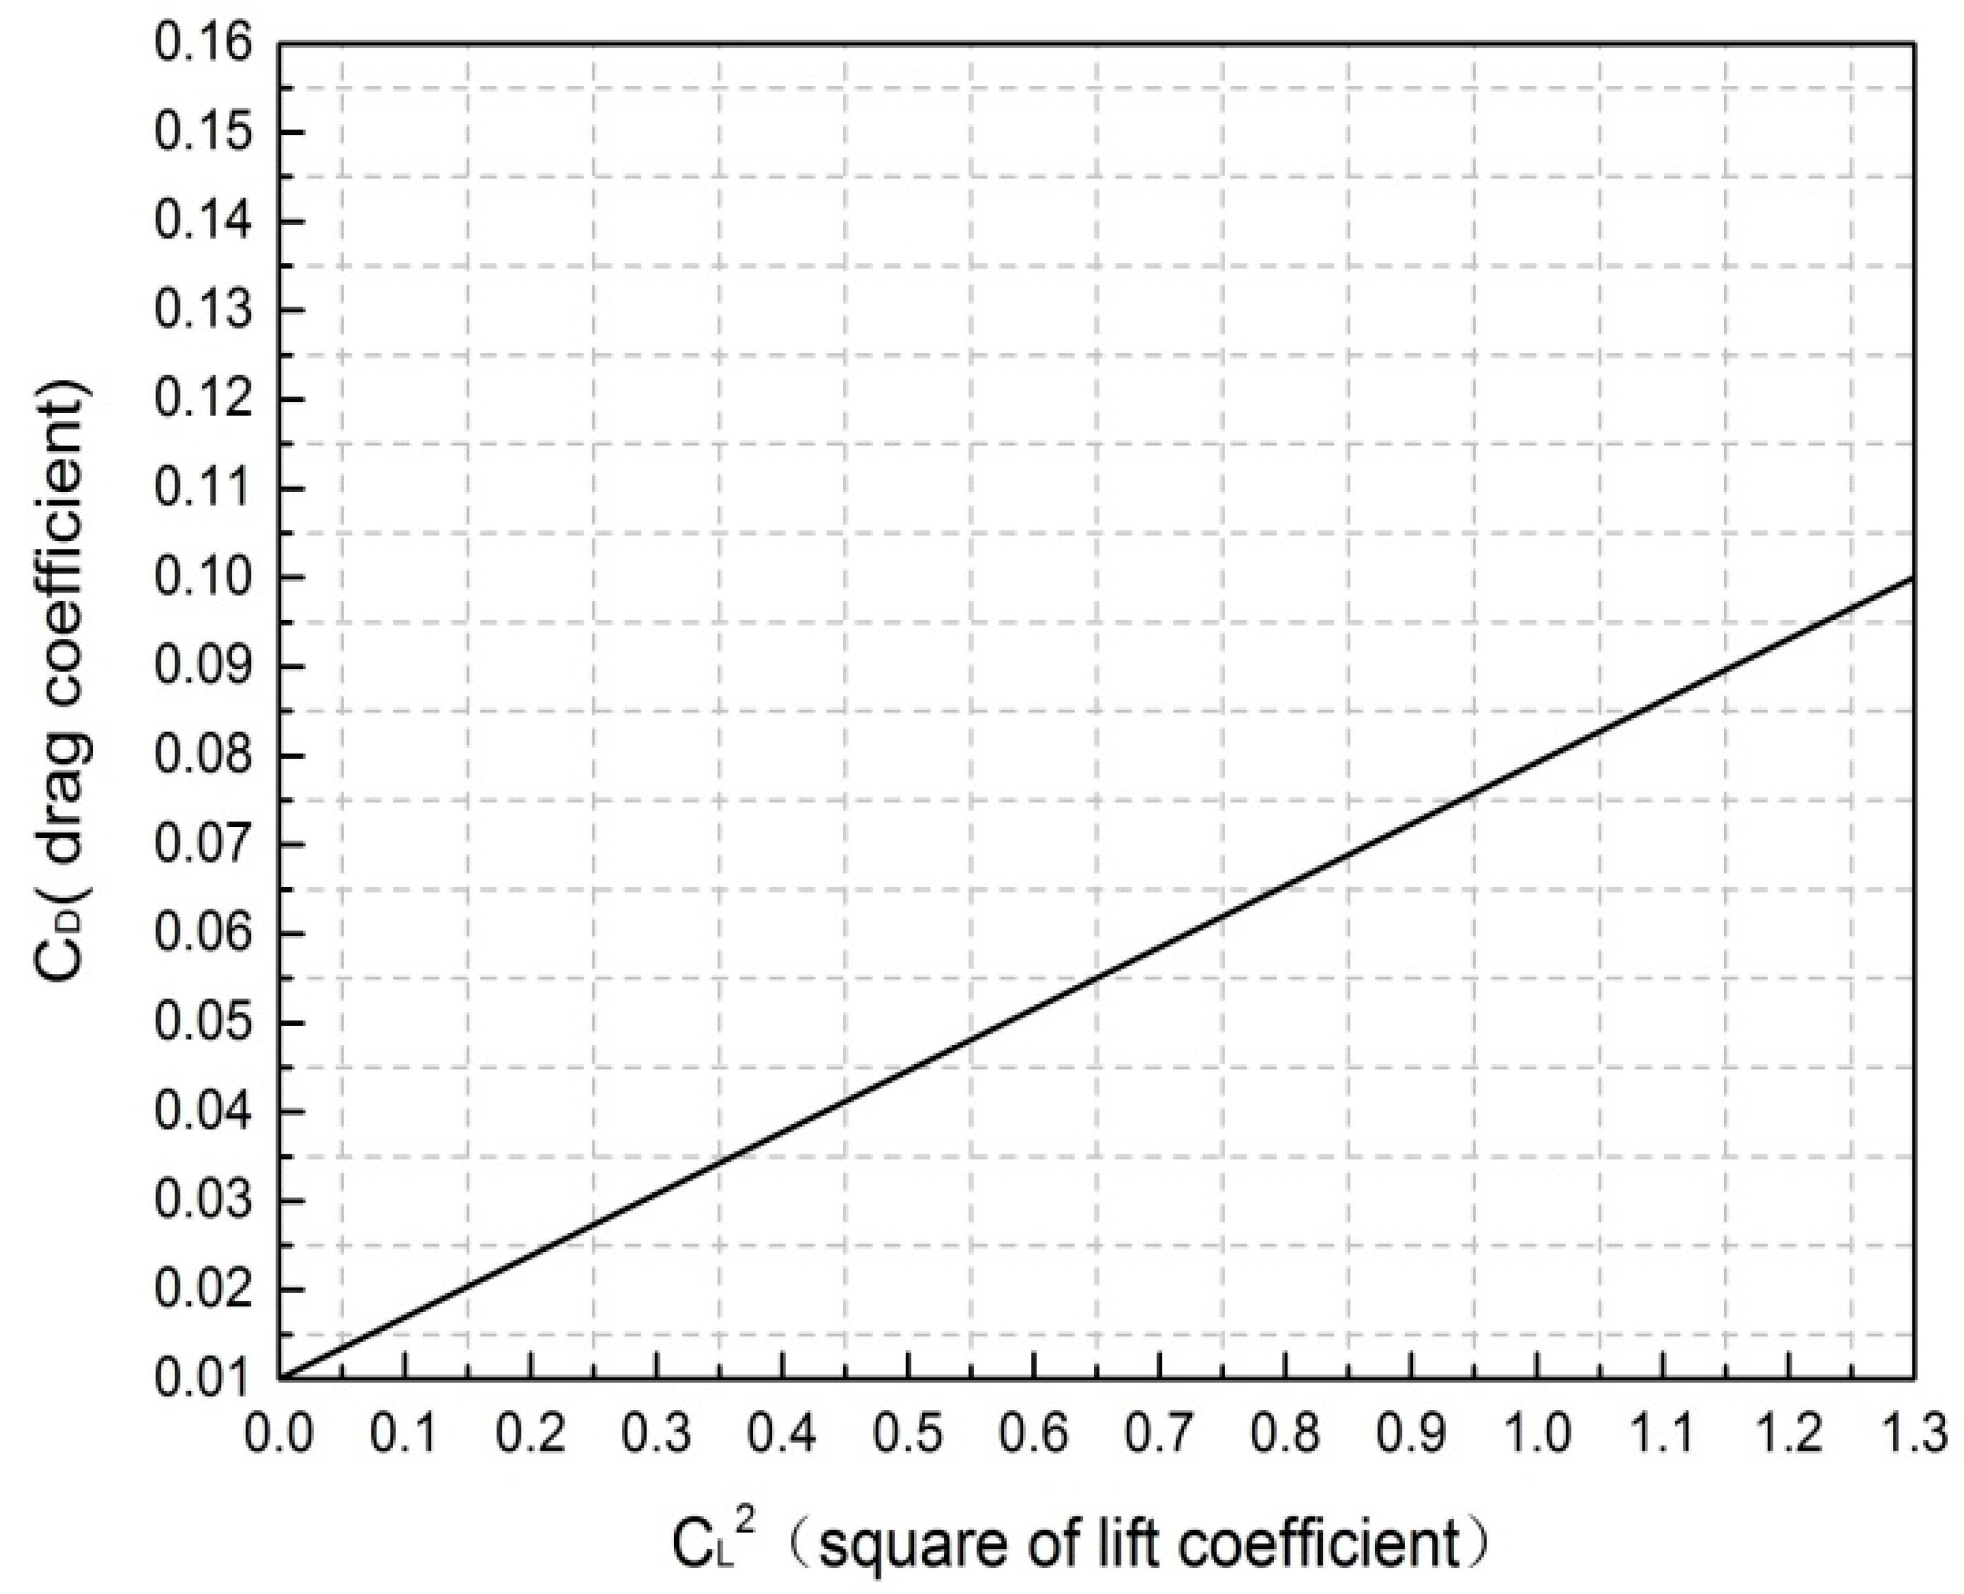
Figure 5 was acquired from the Airbus A320 performance manual.
The following experiment was designed to conduct a comparative analysis of past methods with the fitting method of actual QAR data proposed in this study: (1) on the basis of the BADA-based fuel consumption model in the climbing phase, drag and lift coefficients among aerodynamic parameters were acquired through the static diagram relation obtained by a wind tunnel experiment (
Figure 6). Different combinations of drag and lift coefficients (indicated by points on the line in
Figure 5) were taken and used in the model to calculate fuel consumption; (2) drag and lift coefficients were obtained through data fitting of QAR data and used in the model to calculate fuel consumption.
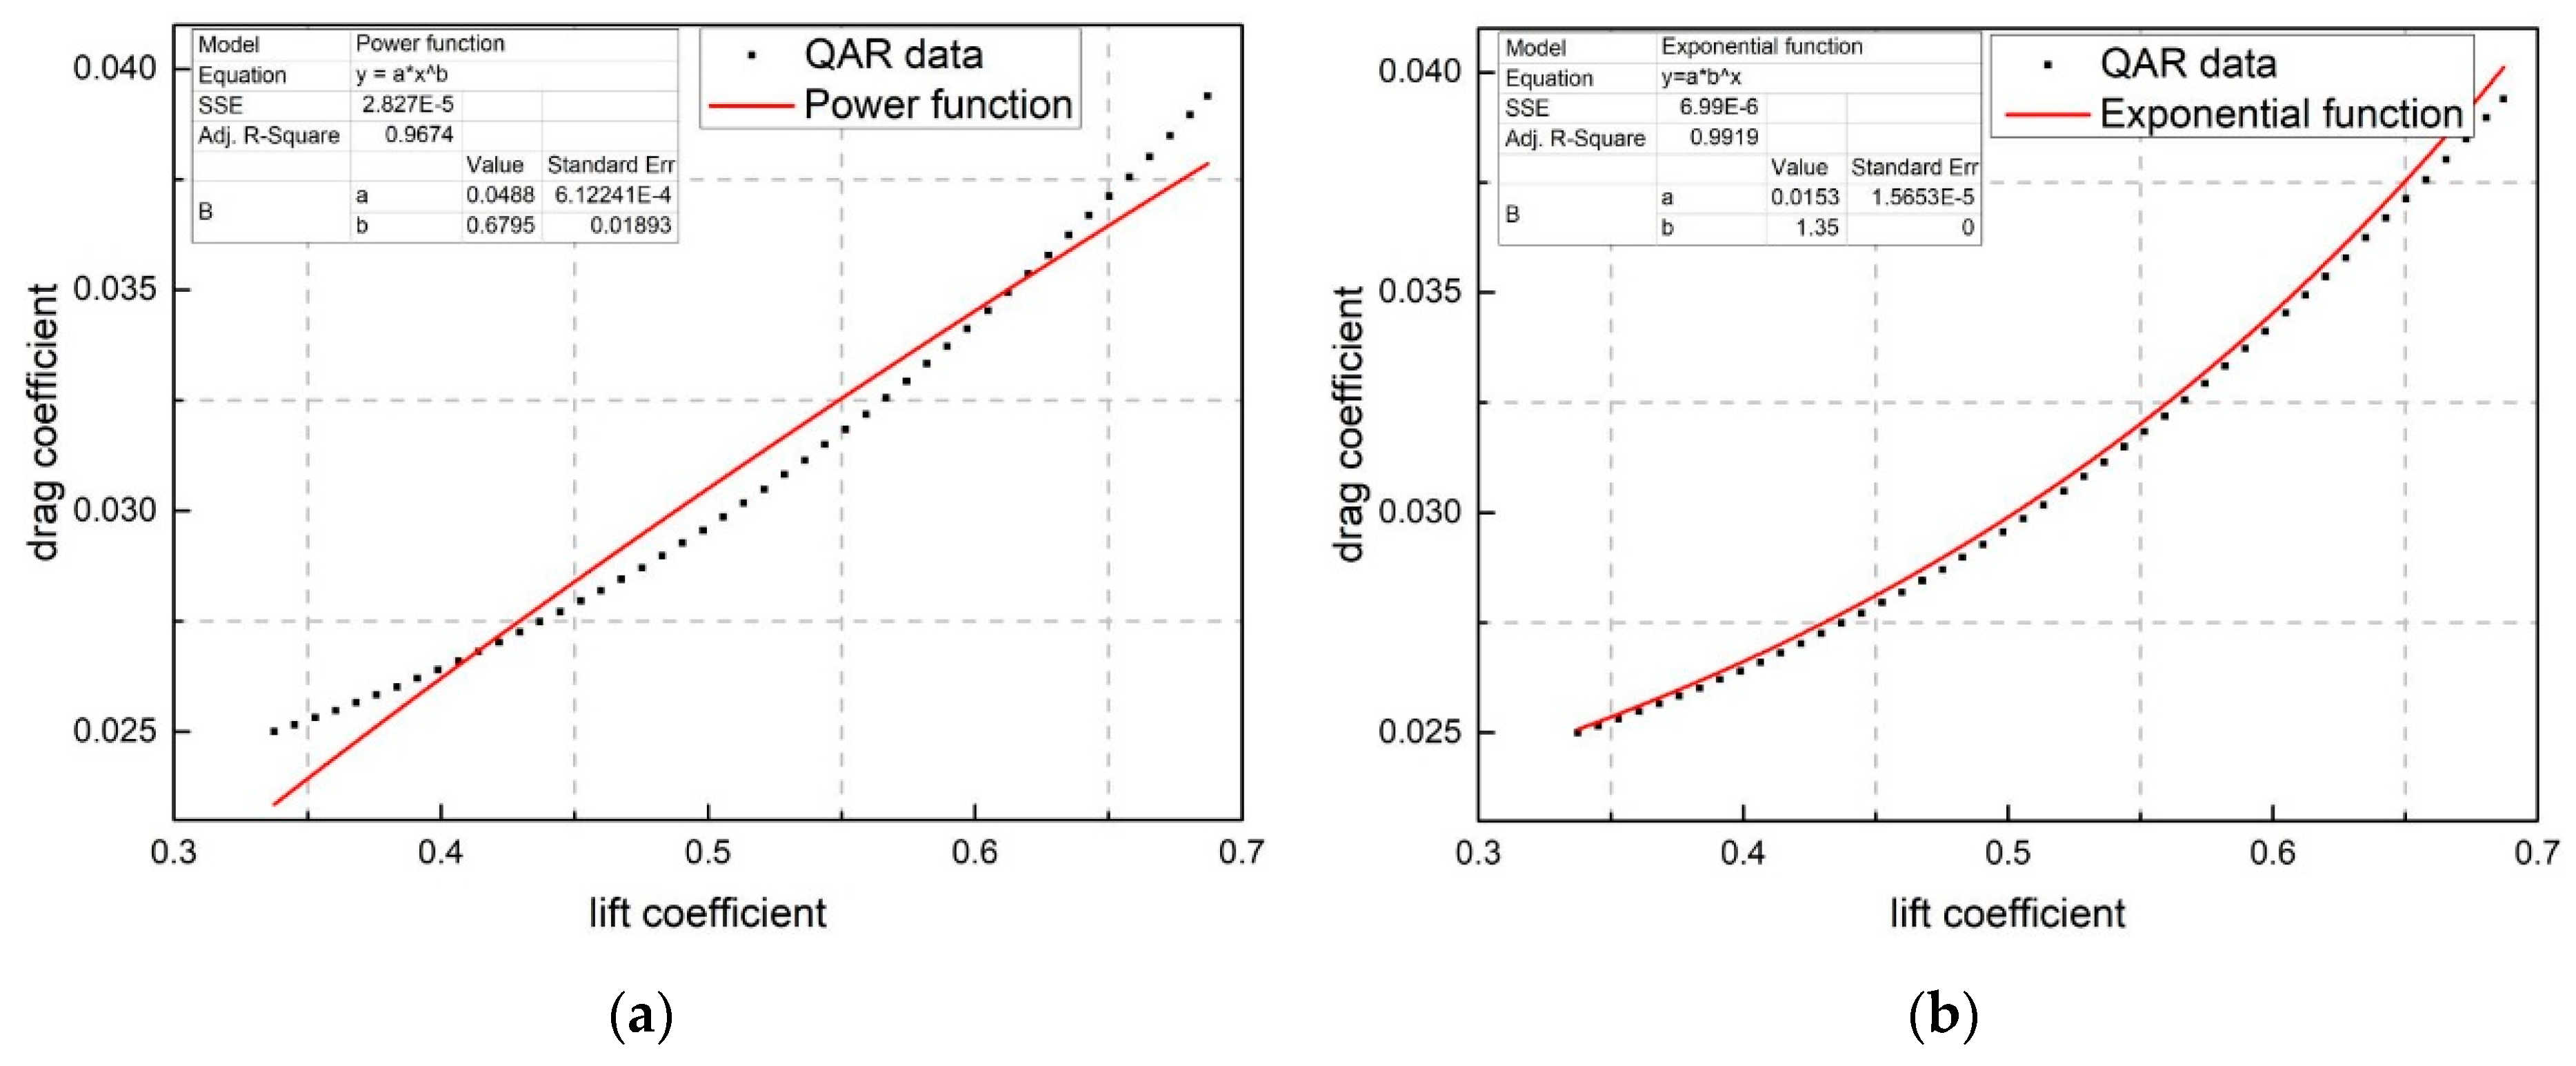
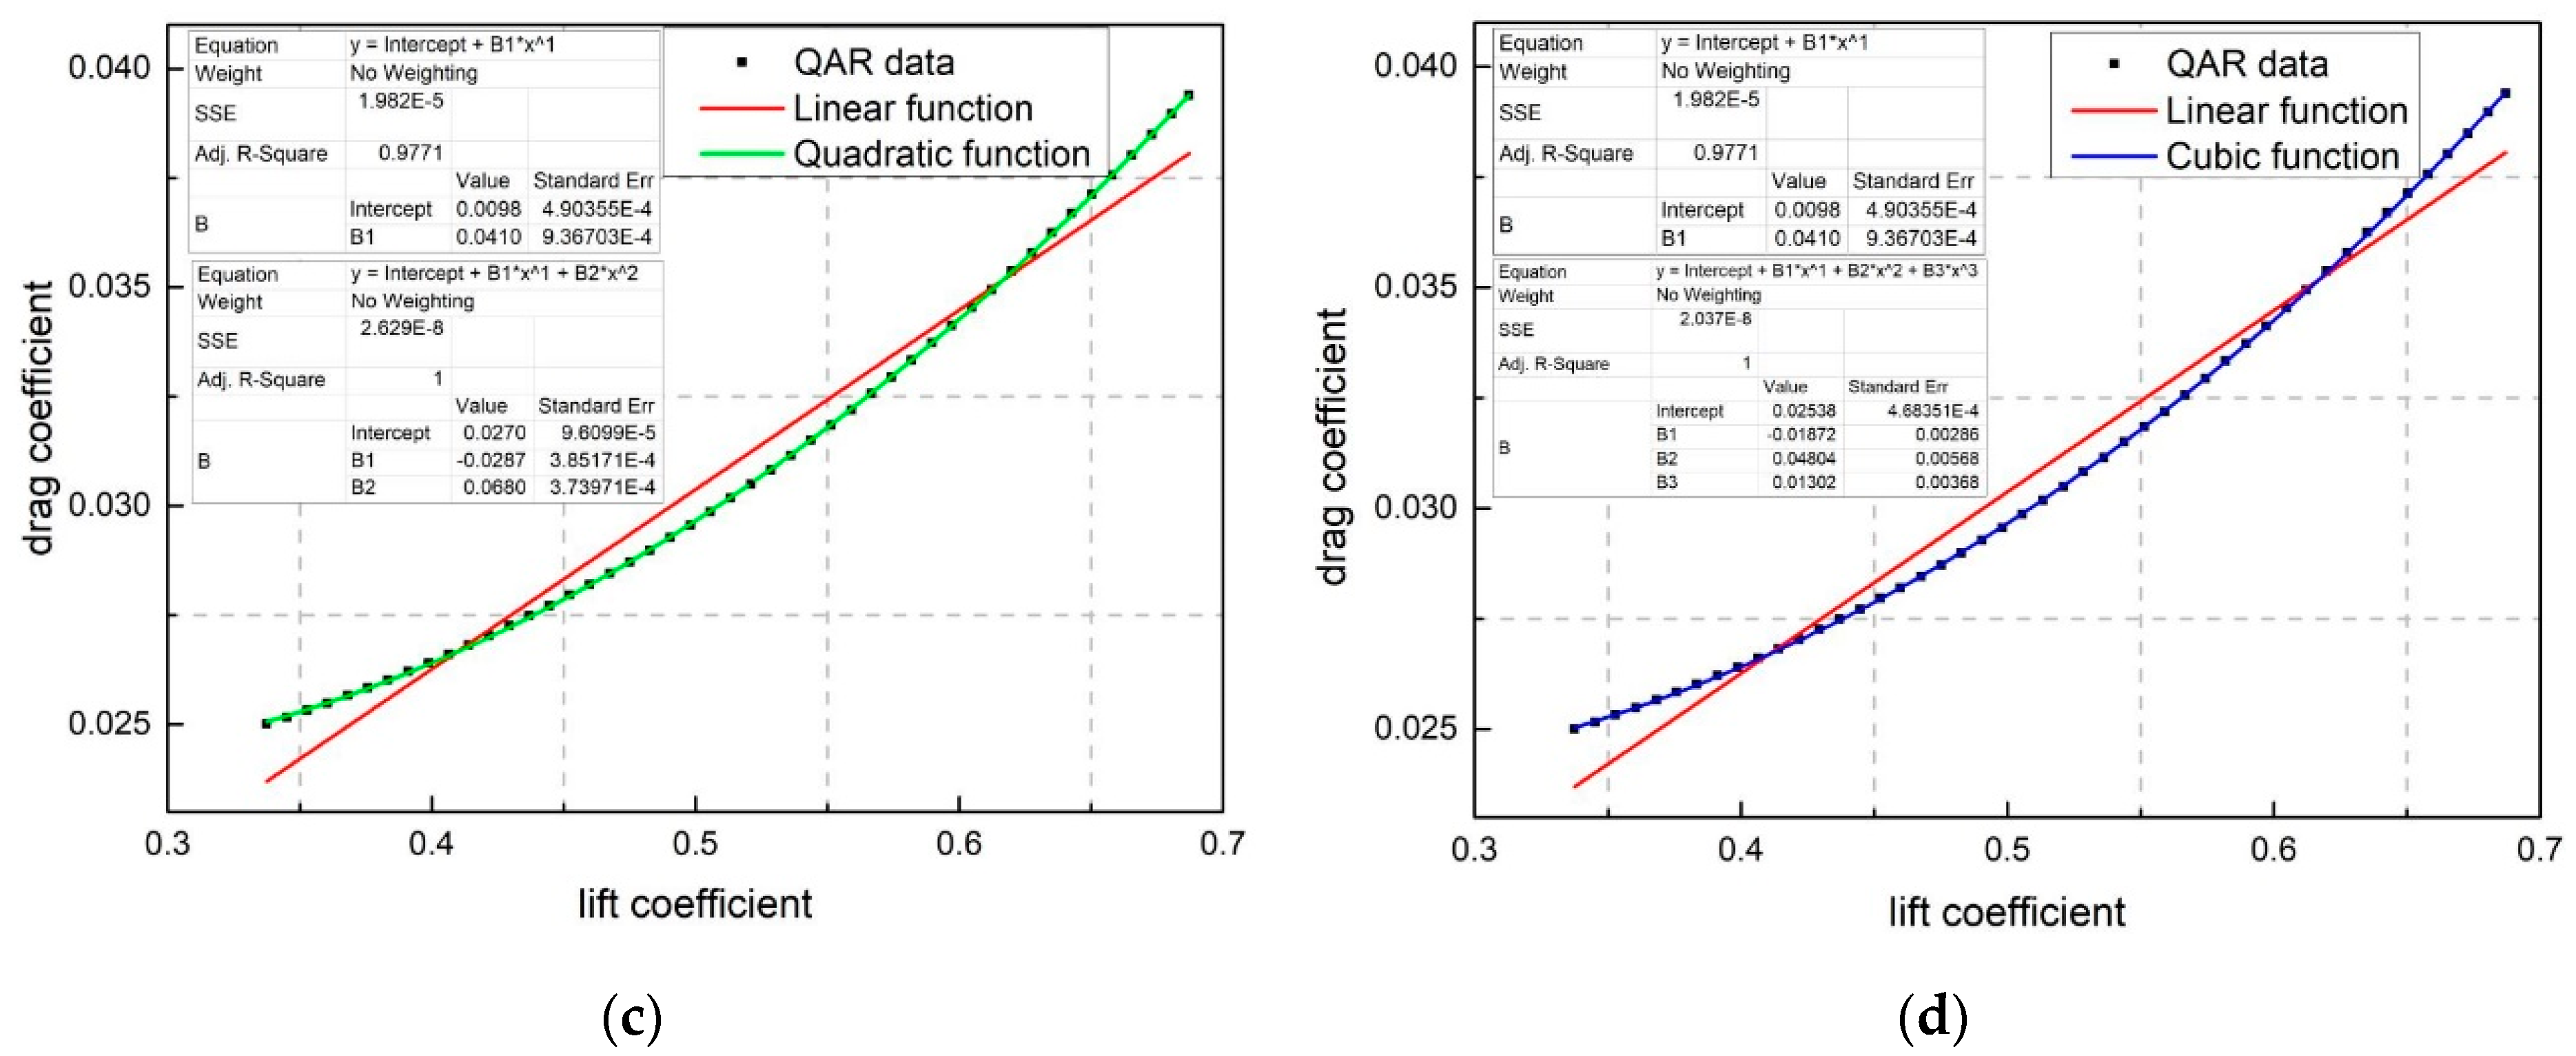
Origin, data analysis, and graphing software were used for the data fitting of QAR data. The least squares method was used, and functions were considered, including the power function (
Figure 6a), exponential function (
Figure 6b), linear function and quadratic Function (
Figure 6c), and linear function and cubic function (
Figure 6d). Note that the sample shown in
Figure 6 is the relationship between lift and drag coefficients of A320 aircraft that correspond to the 0.7 Mach number.
The fitting results, expression of fitting functions, goodness of fit, and residual sum of squares are summarized in
Table 4.
As stated in
Section 3, SSE and R
2 are statistical indexes that reflect the closeness degree of relationships among variables; the smaller the SSE value is and the closer the goodness-of-fit value is to 1, the more accurate the fitting result is. According to the results in
Table 4, quadratic and cubic functions are better than other functions and could be taken as relational expressions of data points.
Fitting of polynomials with degrees greater than 3 was also studied (not shown in
Table 4). Goodness-of-fit values are all equal to 1, and their SSE values are close and slightly smaller than those of quadratic and cubic polynomials. However, if the degree is too high, the curve will be forced to pass through the sample point and truthfulness will be lost, which can easily generate Runge’s phenomenon and high-frequency vibration. Therefore, high-degree polynomial functions were neglected in this study, whereas the quadratic function was used as a fitting relational expression of data points. Therefore, the fitting relational expression that corresponds to the 0.7 Mach number is
The relational expressions between drag and lift coefficients under different Mach numbers can be fitted via the same method, and the outcomes are shown in
Table 5.
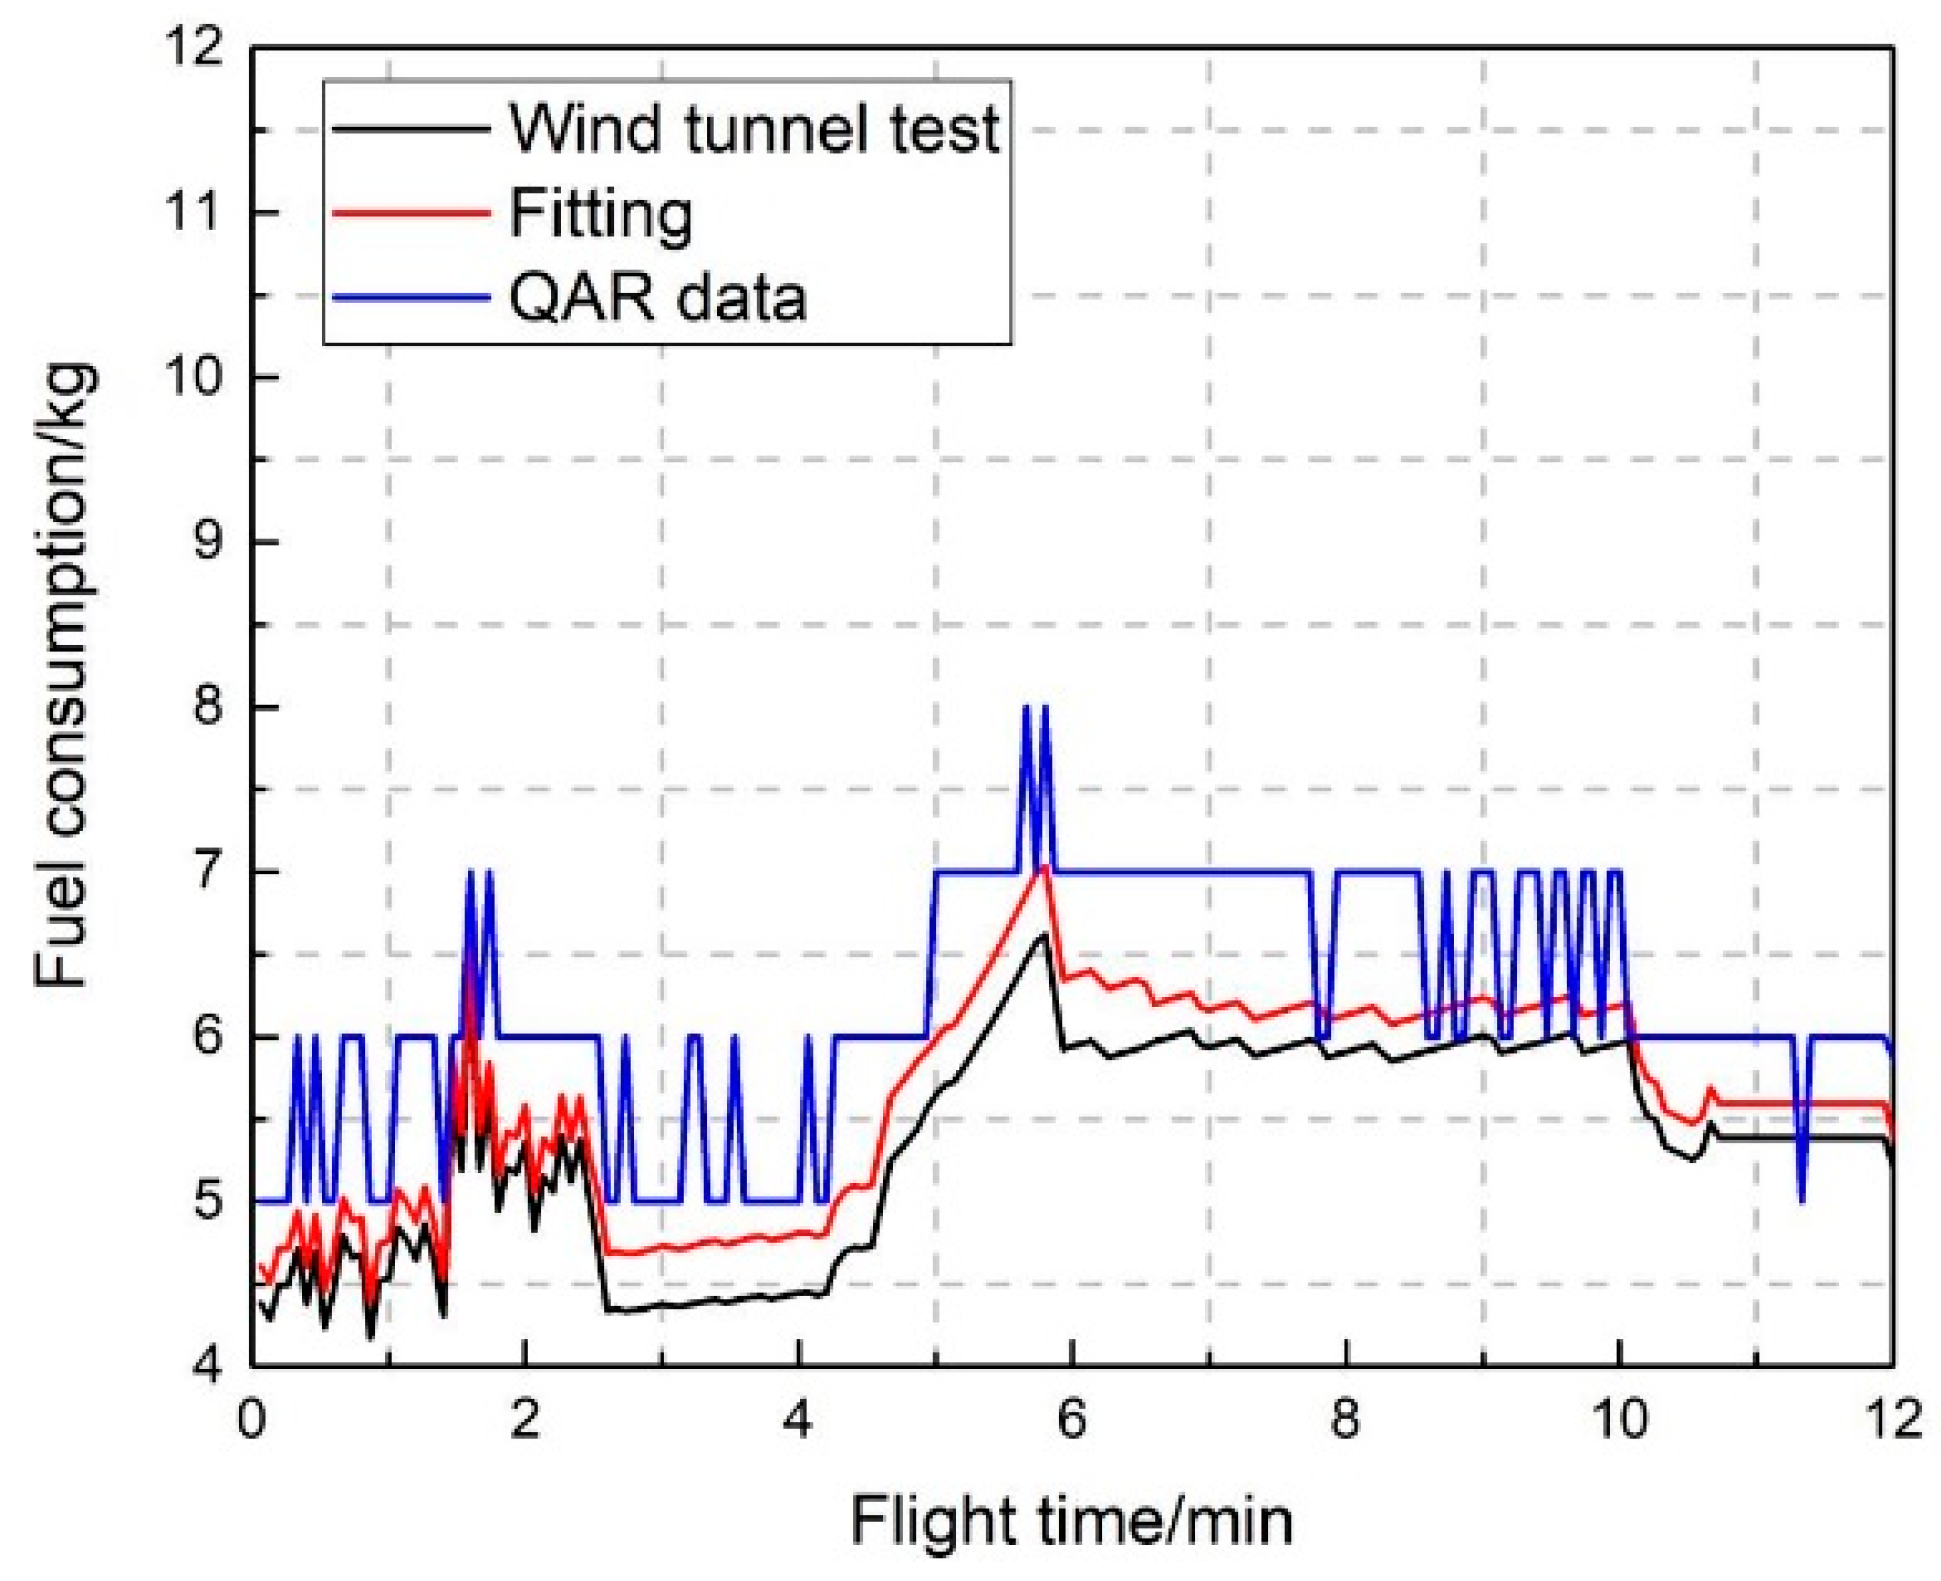
The drag and lift coefficients acquired through the fitting result and the wind tunnel experiment were used respectively for calculating the fuel consumption. The calculation results of fuel consumption at each point obtained by the two methods are shown in
Figure 7.
This process was repeated by using the 278 group QAR data of A320. The lift coefficient
CL and drag coefficient
CD of different Mach numbers for A320 can be obtained using the statistics method (Please see
Appendix A). Fuel consumption calculated using two different methods can be acquired.
Figure 8 shows the fuel consumption of every 4 s during the climbing phase. The black curve is the fuel consumption calculated by using aerodynamics relationships from the static diagram acquired through a wind tunnel experiment (Method 1); the red curve is the fuel consumption calculated by substituting the aerodynamics relationship with the results from data fitting of QAR data (Method 2); and the blue curve shows the fuel consumption from QAR data (baseline). The total fuel consumption was calculated following different methods and the baseline: the total fuel consumption of Method 1 is 965.2 kg and of Method 2 is 1014.5 kg, and the baseline is 1116.0 kg. The calculation accuracy of fuel consumption of Method 1 is 86.5%, and the calculation accuracy of Method 2 is 90.9%. A comparison of the calculation accuracies of fuel consumption shows that the relational expressions of aerodynamic parameters obtained through polynomial fitting using the QAR data-based least squares method are more accurate than those given by the wind tunnel experiment; hence, the fuel consumption model with aerodynamic relationships from Method 2 was adopted and refined with Experiment 2 considering the crosswind effect.
6.2.2. Experiment 2: Analysis of Fuel Consumptions under a Crosswind Condition
In an actual operation, crosswind can exert a major influence on the aircraft flight trajectory [
31,
32] and directly affects the departure fuel consumption. Therefore, crosswind data in QAR data were integrated into the model for theoretical calculation and compared with fuel consumption in QAR. The pitch angle
θ, yaw angle
φ, wind speed
, and wind direction
from QAR data are inputs of Equation (13) for calculating
under a 3D wind condition. Then, the speed was added to the fuel consumption model to obtain the fuel consumption (every 4 s) along the climbing phase, as shown in
Figure 8.
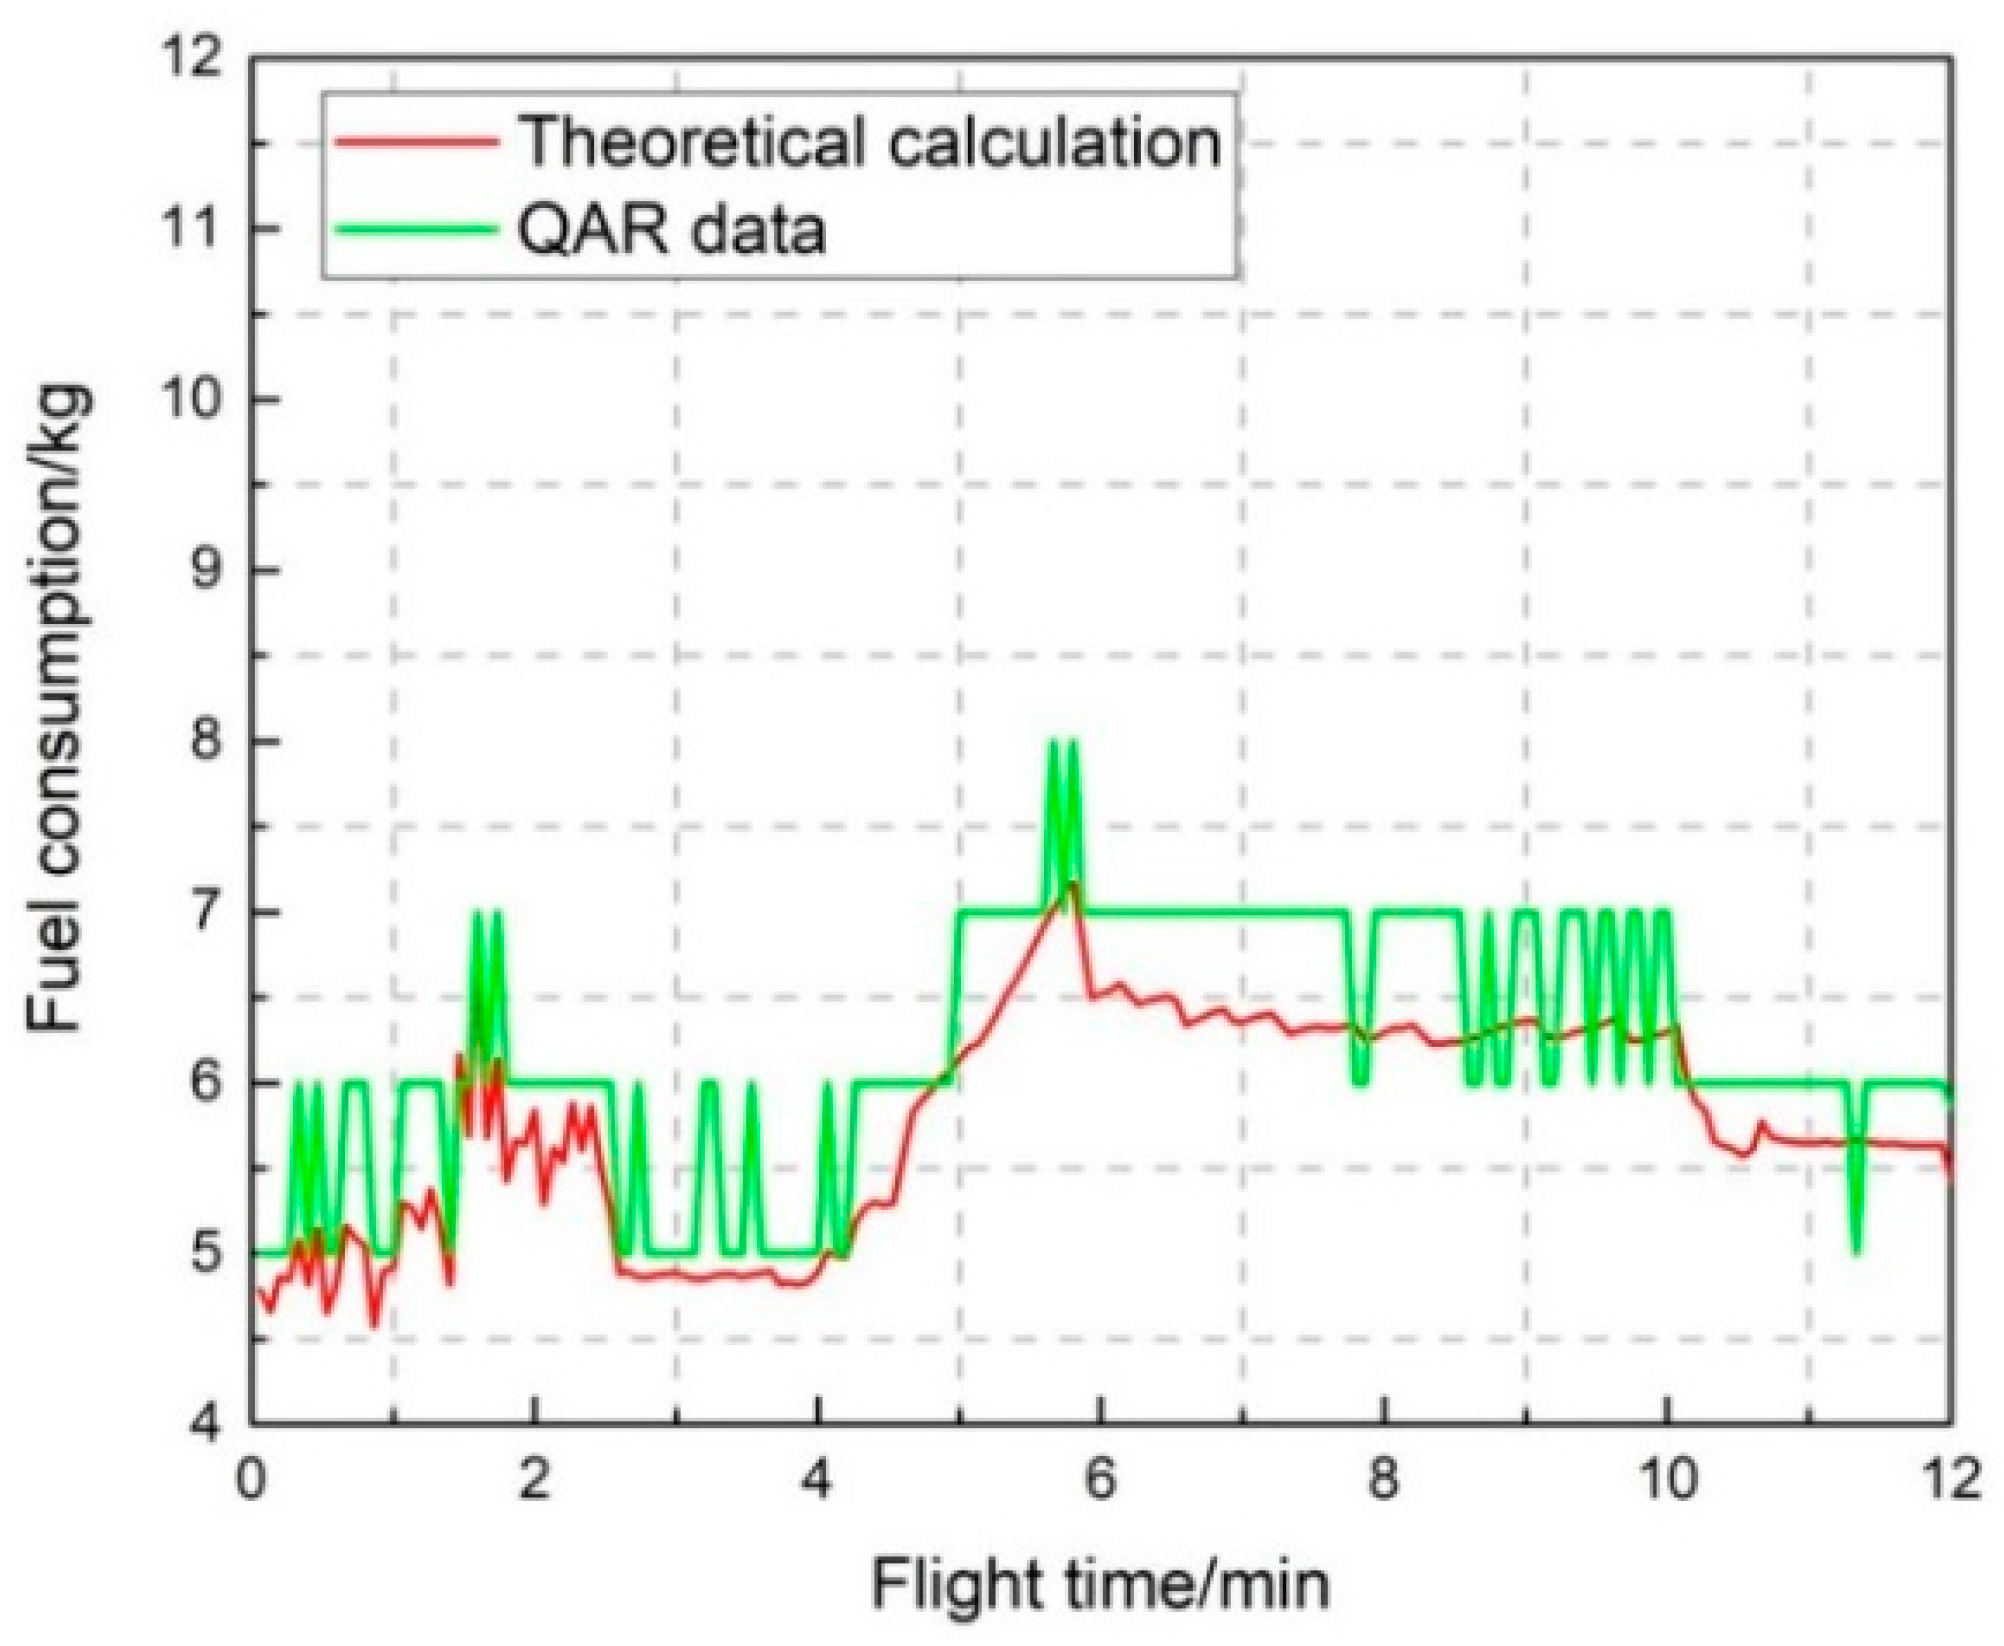
Given 12 min (720 s) of climbing time, the entire climb phase was divided into 10 segments (each segment for 72 s), and the fuel consumption of each segment was calculated, as shown in
Table 6. The theoretically calculated values were compared with the QAR baseline to obtain the accuracy of each flight segment. The accuracies fell into a range of 91%~95.5%, with an average of 93.3%, which is higher than the accuracy rate of Method 2 (before refinement) in Experiment 1 (90.9%).
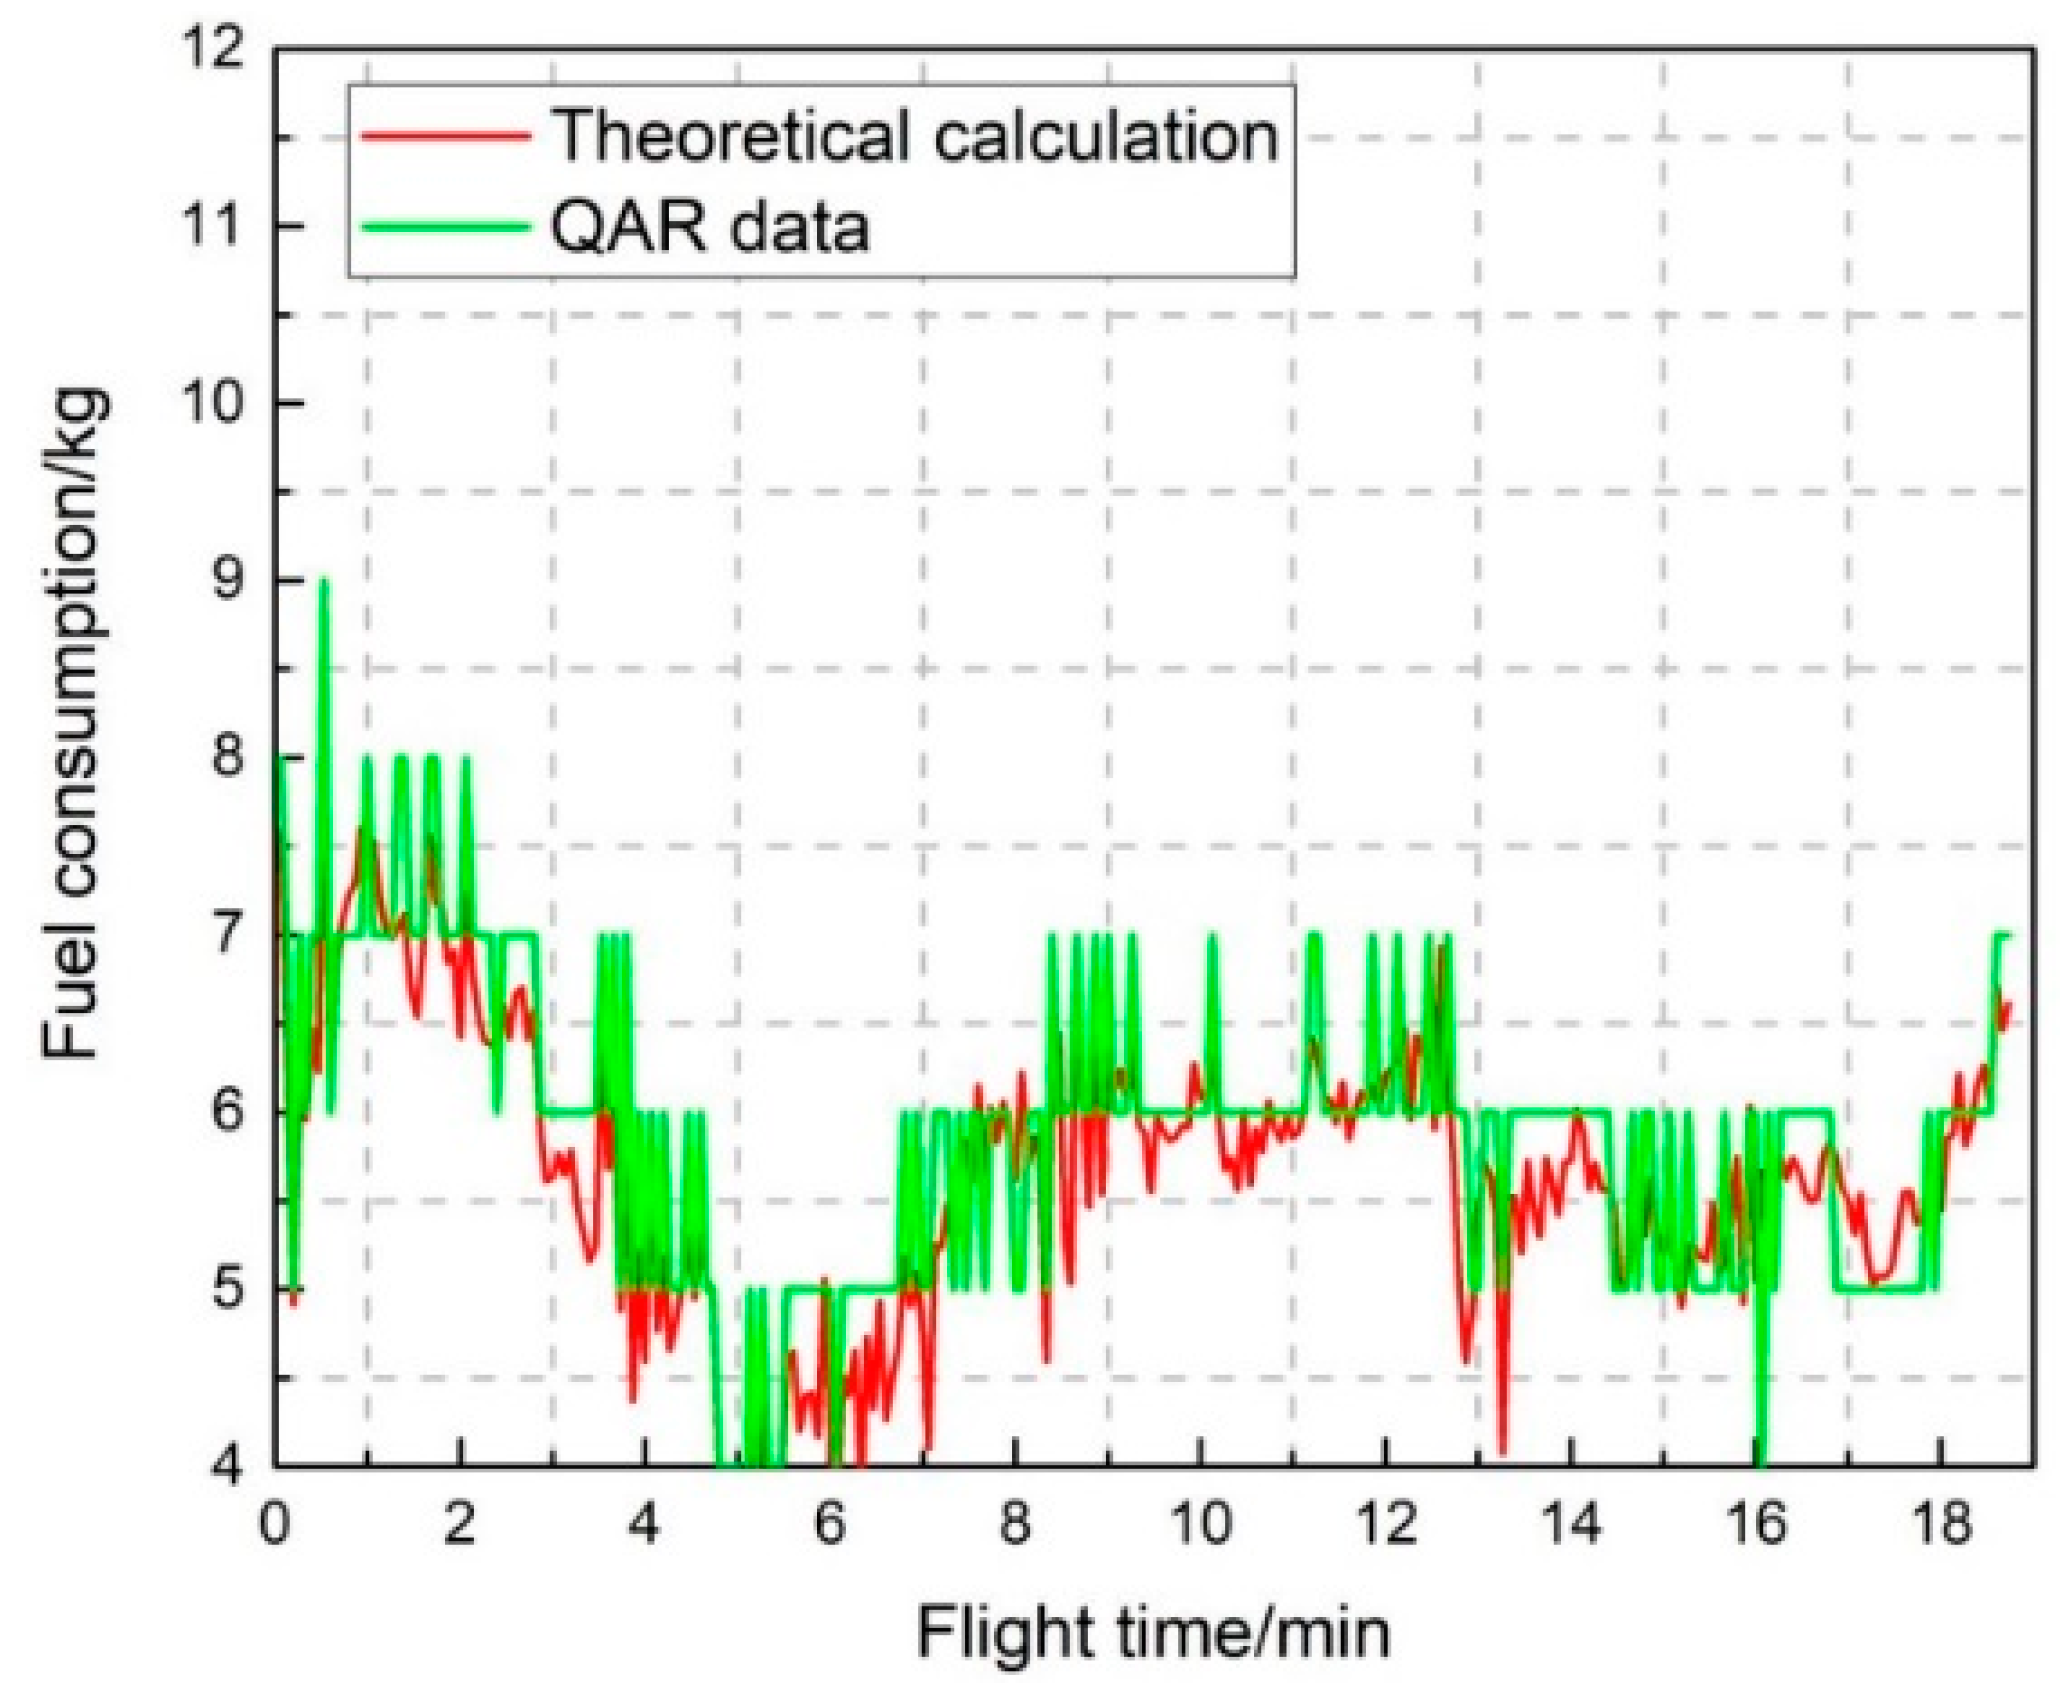
The refined fuel consumption model based on the QAR data of ZSQD was used to calculate the fuel consumption of A320 aircraft at ZBYN airport. The calculated results were compared with the QAR historical data (every 4 s) and are shown in
Figure 9.
Similarly, the fuel consumption was calculated for every 72 s of the climbing phase, and the results are shown in
Table 7. The comparison with historical QAR shows that the predicted fuel consumption reached a total accuracy level of 96%. This experiment demonstrated that the fuel consumption model could be refined by considering crosswind information in QAR data, and the model developed with one set of QAR data could be used by estimating the fuel consumption of the same type of aircraft at other airports.
6.2.3. Experiment 3: Comparative Analysis of Fuel Consumptions under Two Operation Modes
The CCO manual issued by ICAO [
33] states that the climbing gradient under CCO is 60~300 m/nm, that is, 3.24%~16.2%. In this study, the departure continuous climbing gradient was selected as 10%. The climbing gradient under the conventional climb operation mode does not exceed 4% according to the standard departure procedures of Qingdao Airport. On the basis of the trajectory data in QAR, conventional climbing gradients approximate to QAR data were selected in different flight segments of the climbing phase. Flight velocities under both climbing operation modes should satisfy the ATC constraint—that is, the flight airspeed below a FL100 altitude should not exceed 250 kt.
The flight trajectory of a continuous departure route was simulated through Visual Basic programming on the basis of the waypoint information in
Table 2, including flight altitude, airspeed, and direction. Based on the trajectory, the established fuel consumption model was used to calculate the fuel consumption value of a continuous departure route.
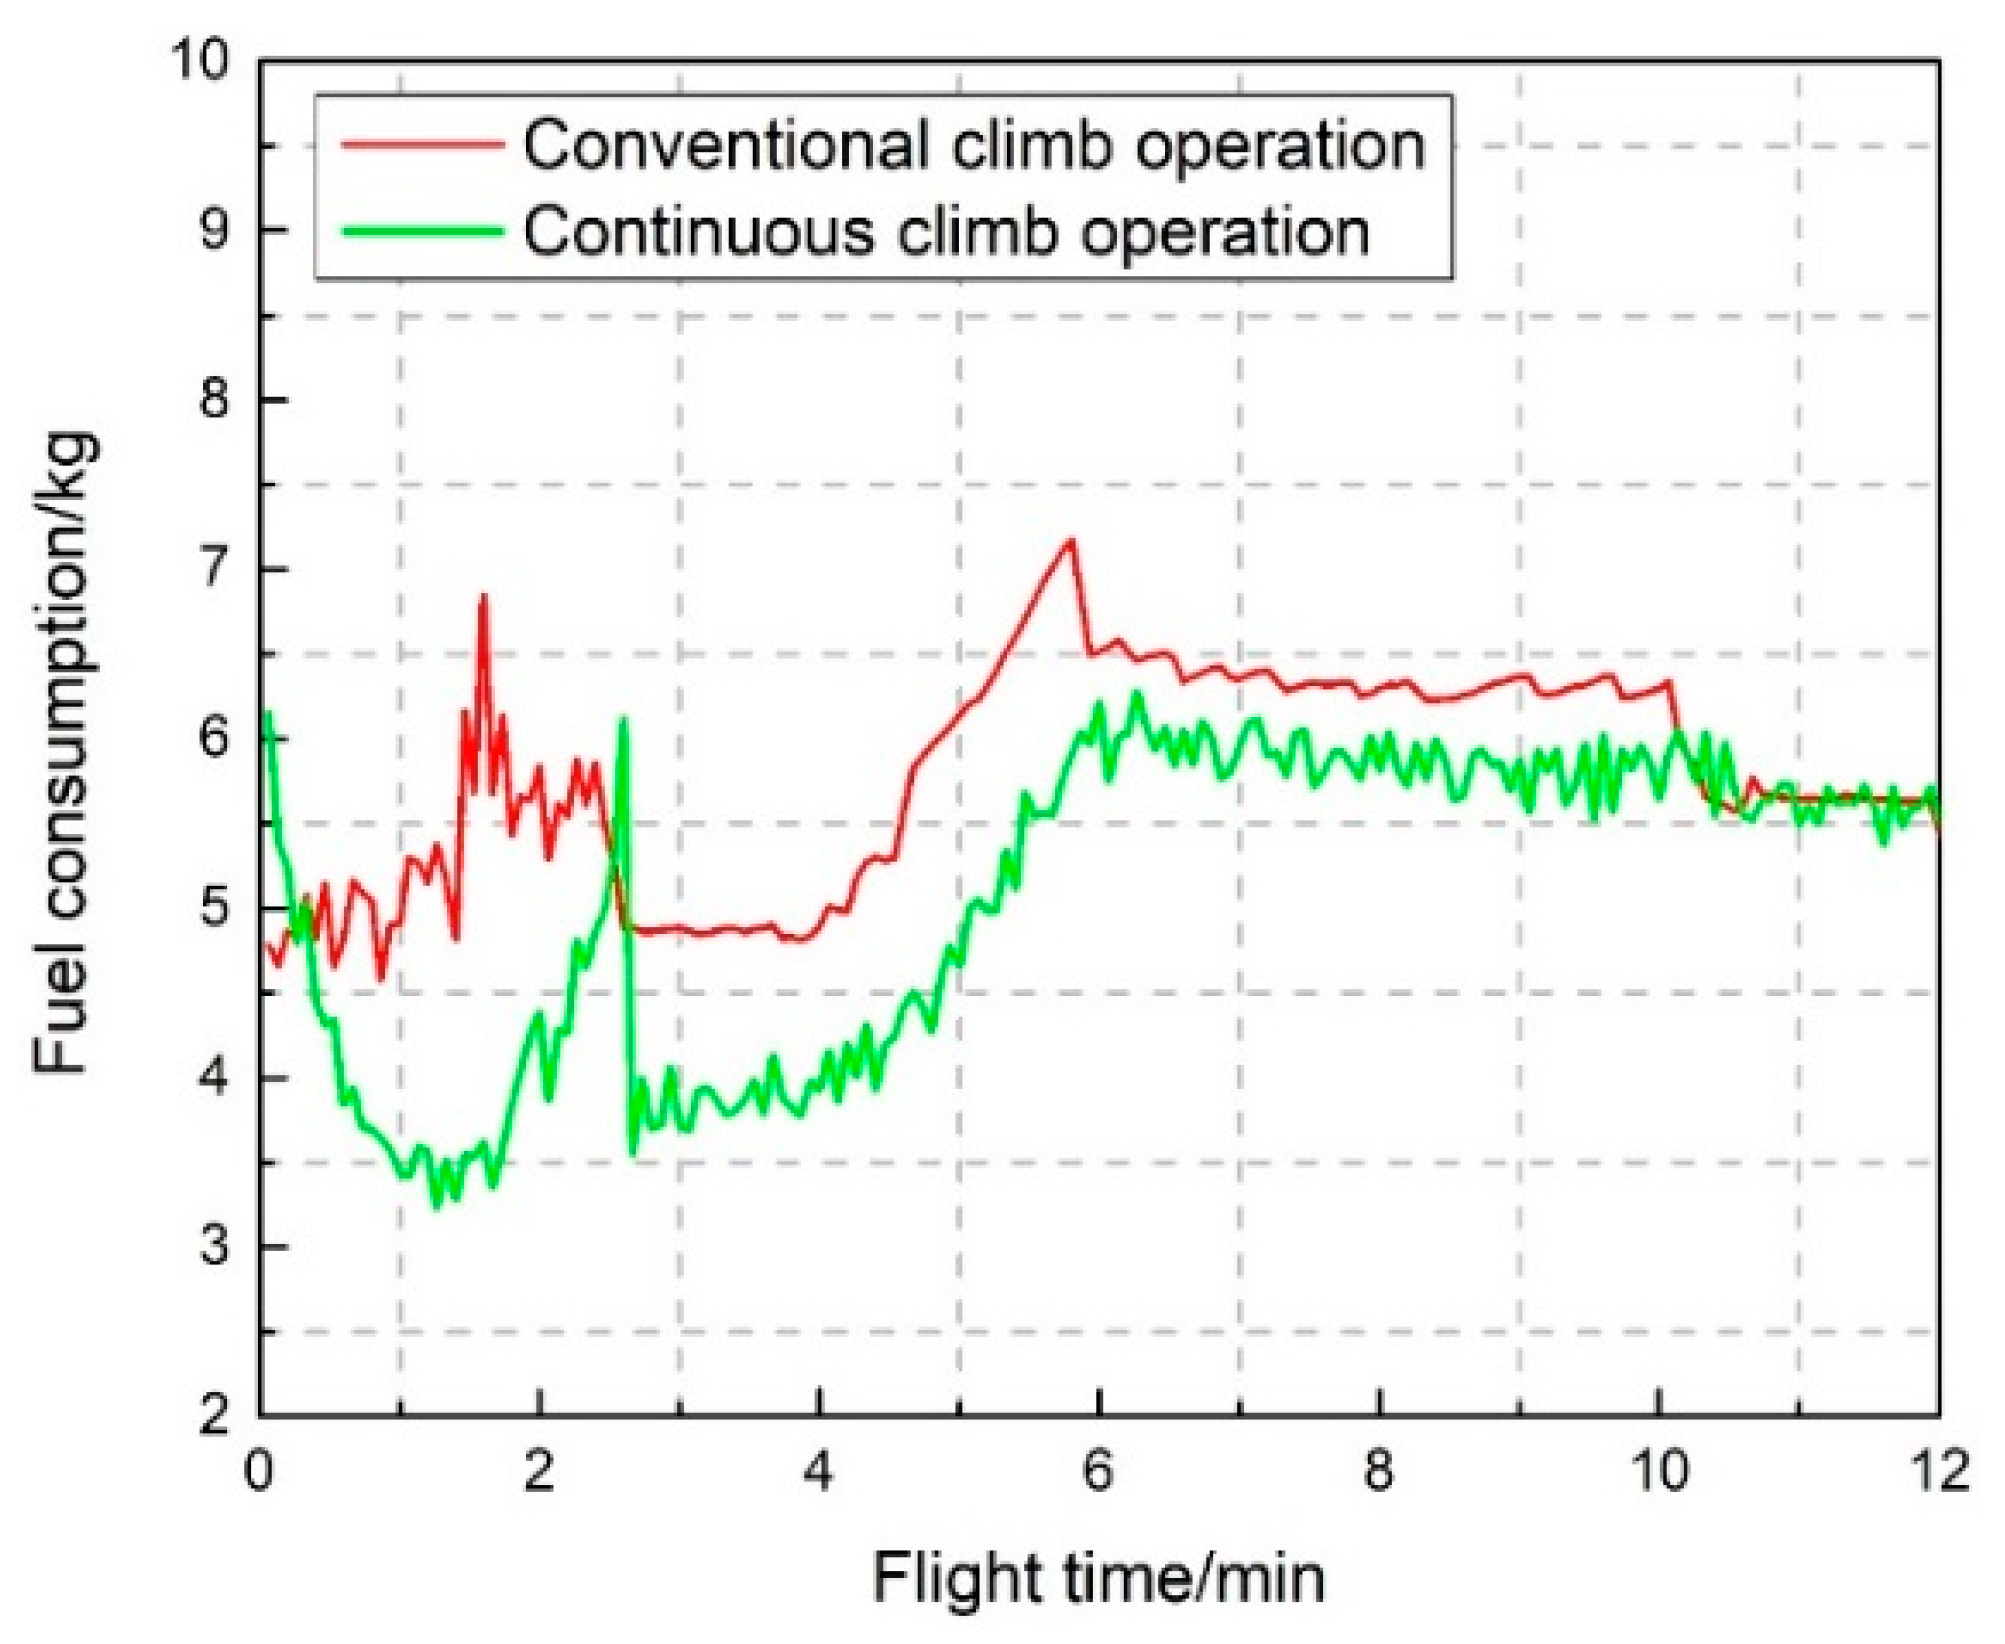
Figure 10 shows the comparison of the fuel consumption of CCO and conventional climb operation.
In
Figure 10, the green curve displays a decreasing trend at the beginning of the continuous climb. As the initial climbing speed increases, the lift coefficient decreases gradually according to Equation (5), and then the drag coefficient decreases according to the fitting formula, which leads to a reduction of thrust through Equation (3). Although the increase of speed will directly lead to the increase of thrust, the influence of the drag coefficient on thrust is greater than the change of the initial climbing speed, which makes the total thrust decrease. Therefore, fuel consumption decreases gradually through Equations (2) and (6), which is why the green curve goes downward first. When the flight speed further increases, the influence of climb speed on the thrust is greater than the drag coefficient (namely, overstepping the nadir of the fuel consumption), which leads to an increase in fuel consumption. Therefore, the green curve starts to go upward. With the increase of the Mach number, the relationship between the drag and lift coefficients changes, which makes the drag coefficient play a dominant role in fuel consumption, and the drag coefficient decreases, so fuel consumption decreases in
Figure 10. Finally, the climbing speed increases to the maximum and then climbs uniformly until the initial cruise altitude—that is, the final stable stage in
Figure 10.
Fuel consumption of a conventional climb operation is quite different from that of CCO, as depicted by the red curve in
Figure 10. This is due to uniform climbing in the initial stage of a conventional climb operation, where the lift and drag coefficients do not change when the speed increases. As a result, thrust and fuel consumption do not change, so the fuel consumption value in the initial stage of the conventional climb operation is relatively stable. When the aircraft starts to accelerate, with the increase of speed and the adoption of a larger rate of speed change, the thrust gradually increases according to Equation (3), which leads to a gradual increase in fuel consumption.
The total fuel consumption values under two operation modes were compared. The fuel consumptions of all points under CCO were added as 913 kg, which reduced by 128.6 kg compared with the total fuel consumption (1041.6 kg) under the conventional climb operation, as calculated previously. The CCO saves fuel because the climbing gradient under CCO is greater than that under the conventional climb operation; i.e., the total climbing time under the former mode is shorter than that under the latter mode. Additionally, COO does not involve a leveling-off phase if the precondition is met; thus, fuel consumption under CCO is less than that under the conventional climb operation.
6.2.4. Experiment 4: Analysis of Aircraft Mass and Climbing Angle on Fuel Consumption
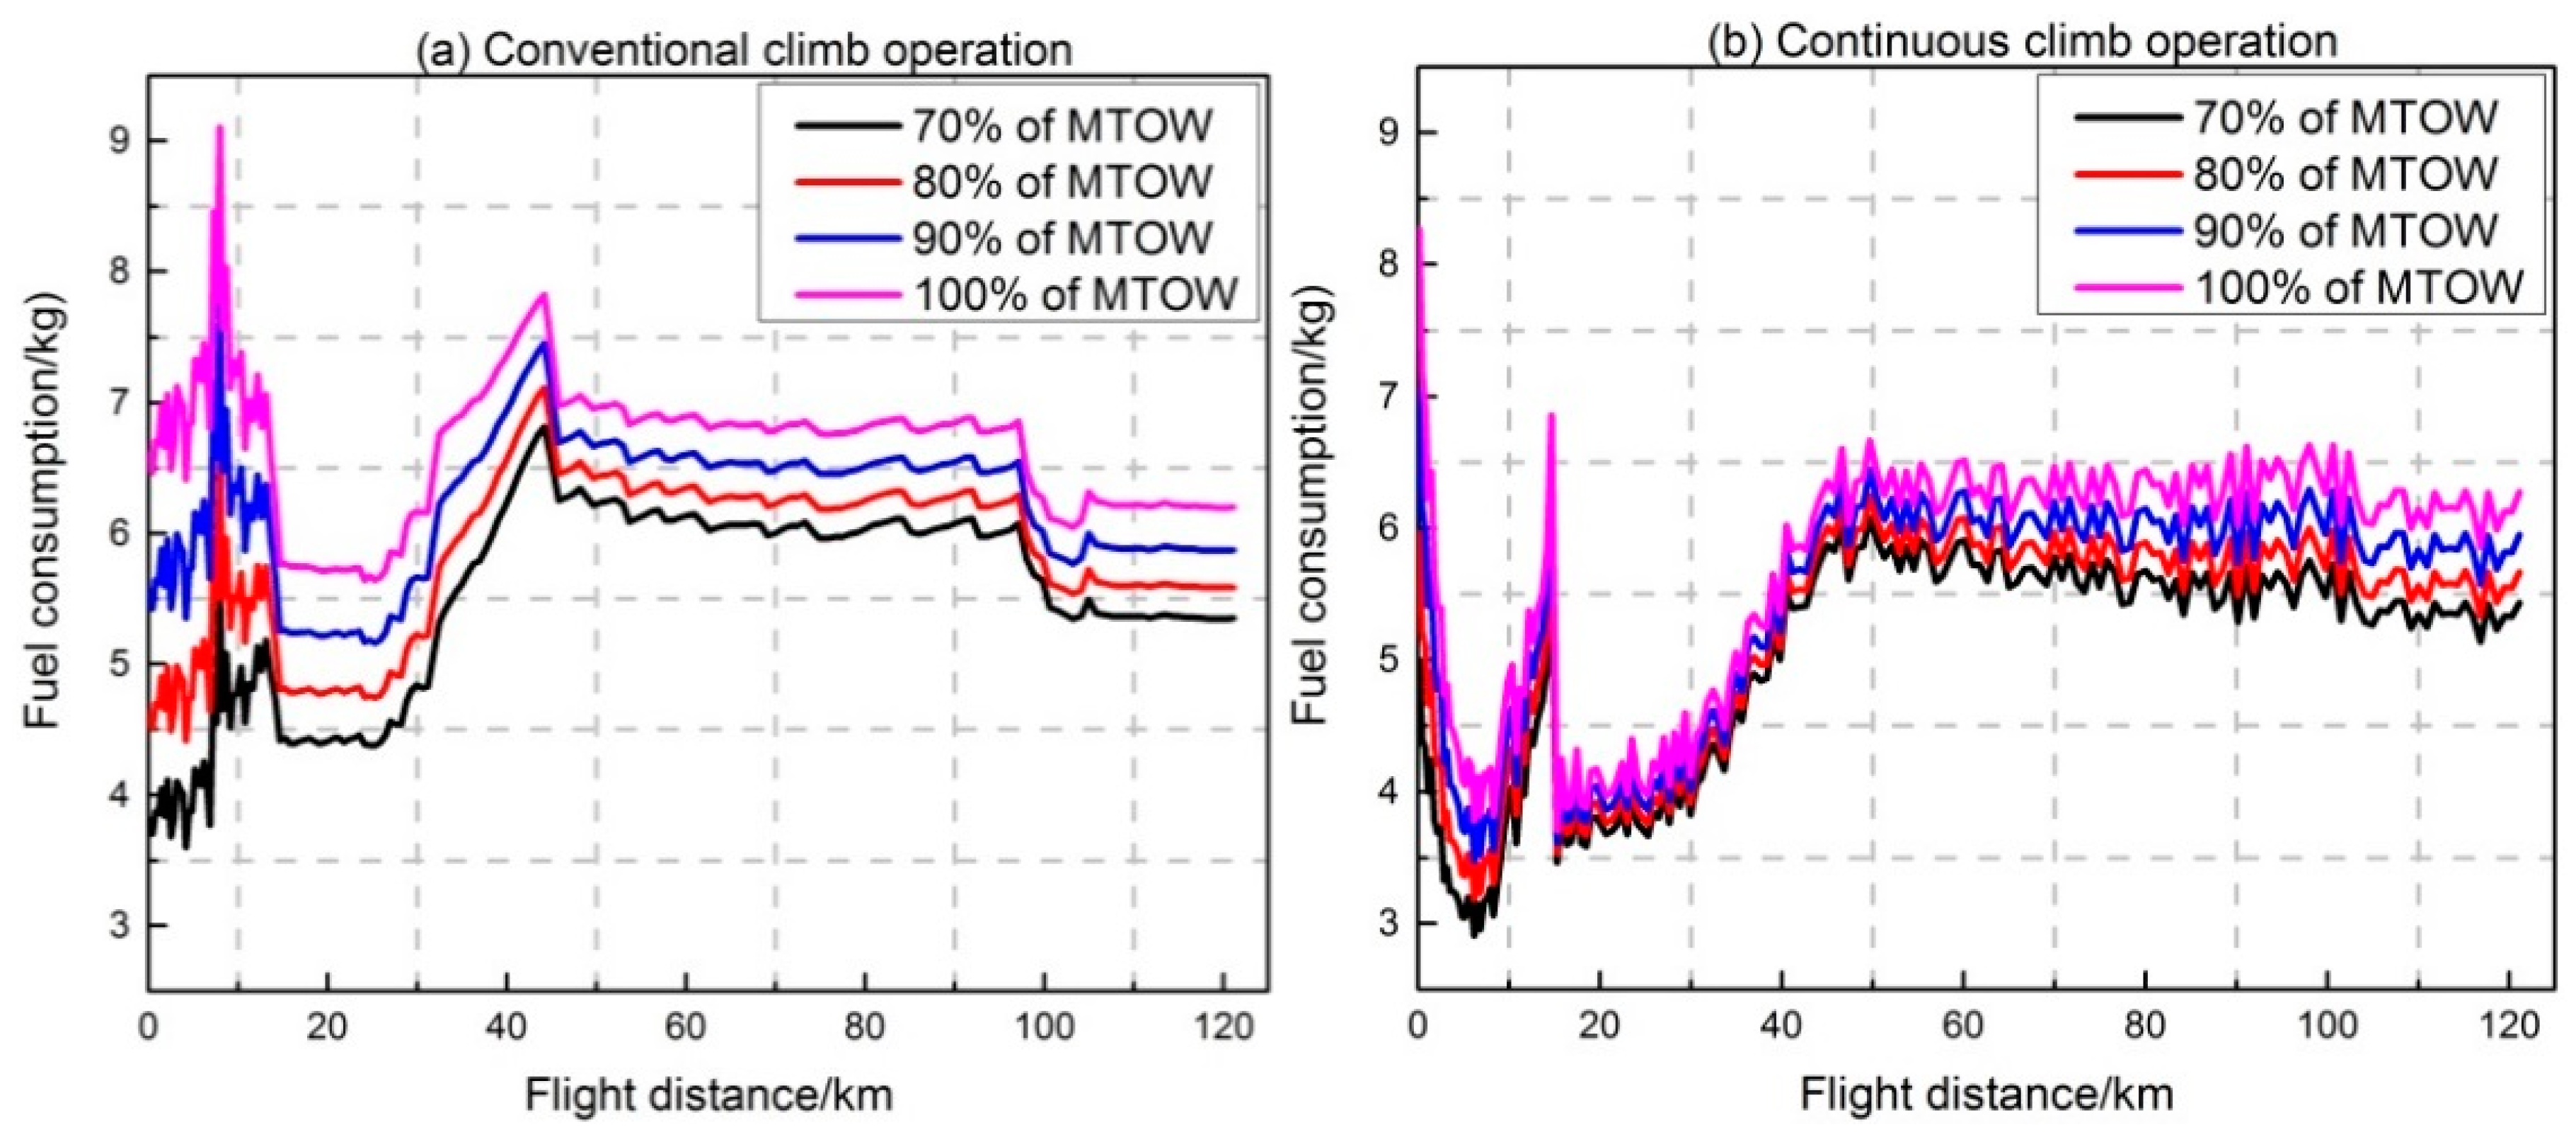
With reference to the BADA database, the maximum takeoff weight (MTOW) of Airbus A320 is 77,000 kg, and the operating empty weight is 42,400 kg. Accordingly, MTOWs of 70%, 80%, 90%, and 100% (that is, 53,900, 61,600, 69,300, and 77,000 kg, respectively) were selected for the calculation of fuel consumption for the quantitative analysis. During this calculation process, the change in aircraft mass due to fuel consumption was considered, which accords with the actual operation status. The theoretical calculation result of fuel consumption is shown in
Figure 11.
In
Figure 11, the curves of high aircraft masses are all above the curves with low aircraft masses; as the aircraft mass increases, the lift coefficient increases according to Equation (5), which results in a change in the drag coefficient. Equation (3) indicates that as the thrust increases, the fuel consumption increases. Therefore, predicting accurate fuel consumption before the aircraft takes off can prevent the aircraft from carrying redundant fuel, thereby avoiding an unnecessary aircraft mass and generation of fuel consumption.
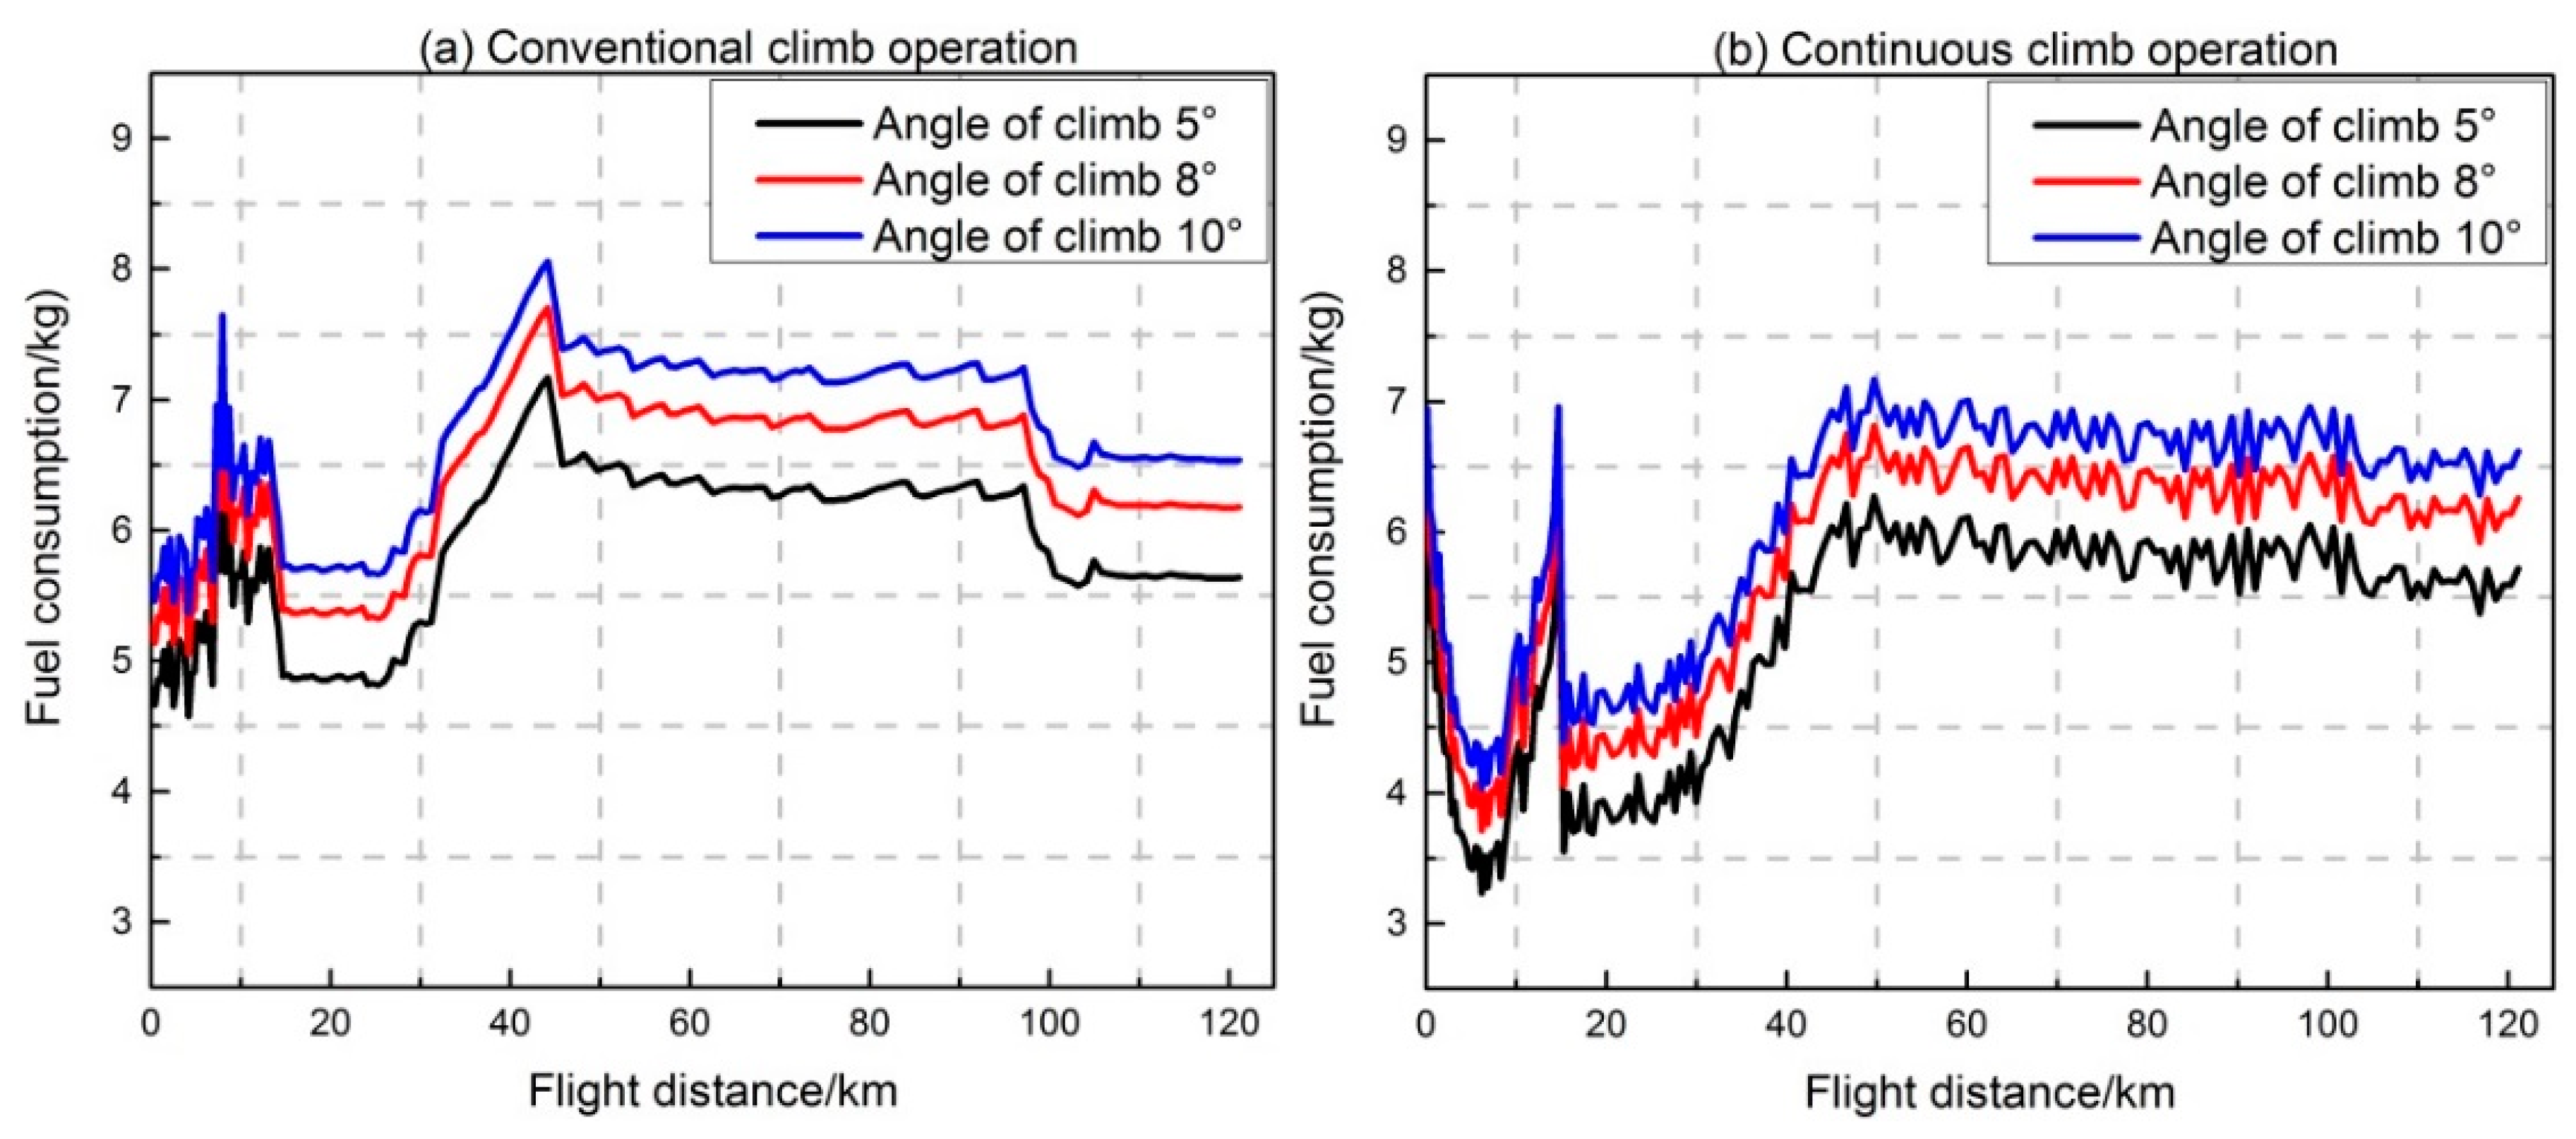
The influence of the aircraft climbing angle on fuel consumption was also evaluated. The climbing angle used in the previous trajectory simulation was 5°. On this basis, climbing angles of 8° and 10° were selected for the analysis of the influence of the climbing angle on fuel consumption (in BADA database [
6,
29], climbing altitude cannot exceed 18° under low weight and 15° under high weight). Fuel consumption values simulated under different climbing angles are shown in
Figure 12. As shown, a larger climbing angle resulted in higher fuel consumption because the thrust, and, consequently, fuel consumption, increase with the climbing angle according to Equations (3) and (5). The air traffic controller’s command is the main factor that causes changes of climbing angles. Such a command is usually used to avoid the violation of required separations in airspace.
6.2.5. Experiment 5: Analysis of Different Aircraft Models on Fuel Consumption
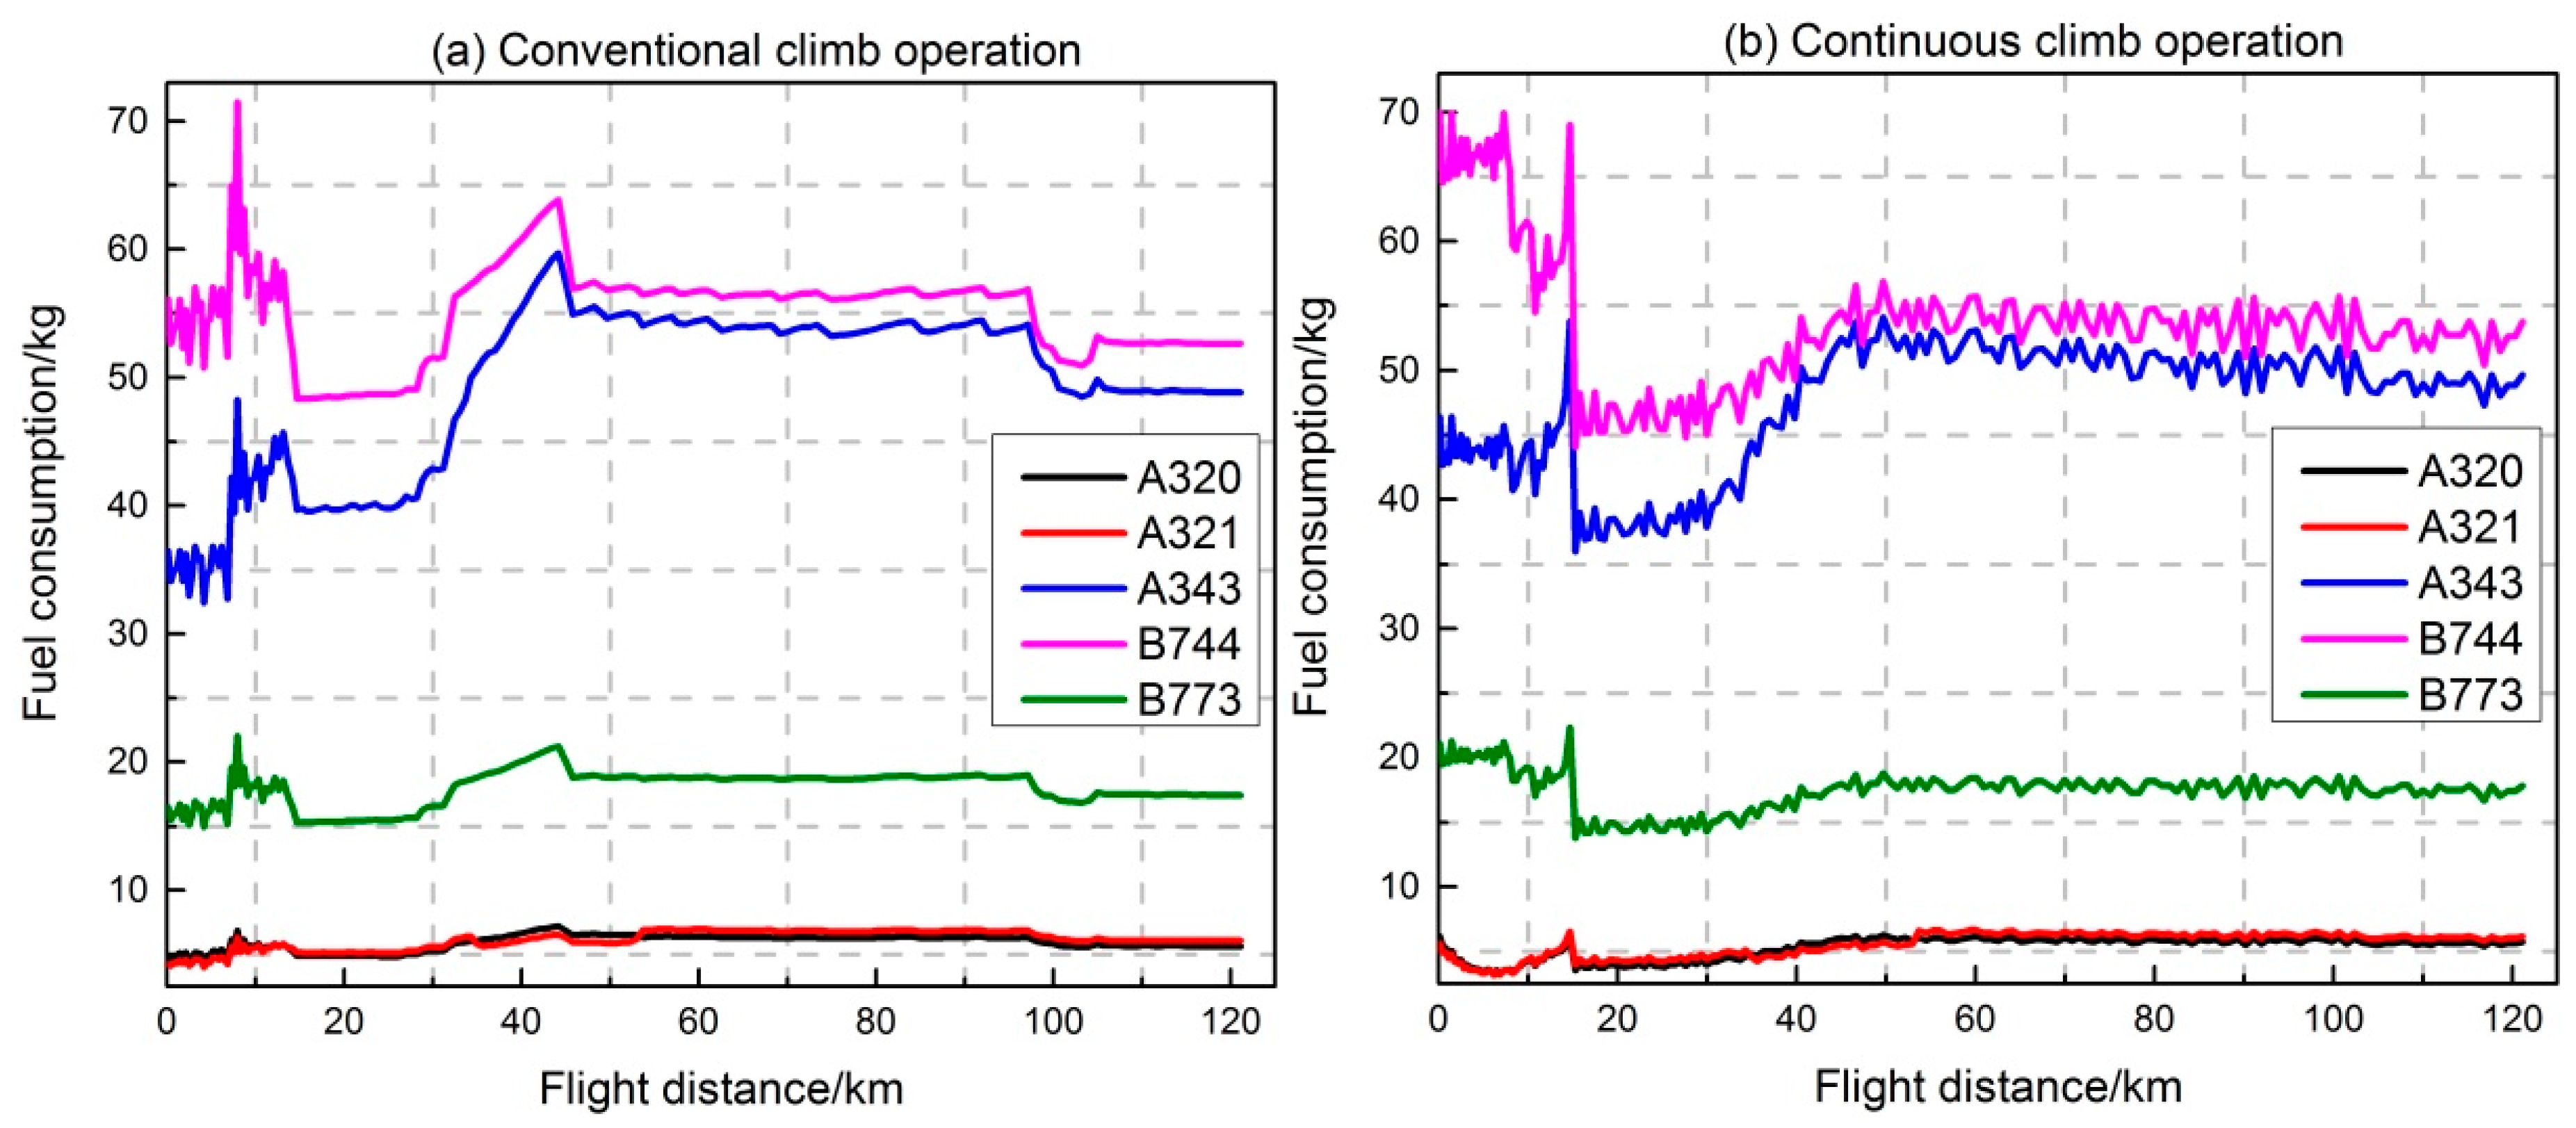
In this experiment, Airbus A321 and A343 and Boeing B744 and B773 models, with MTOWs of 83, 275, 396.8, and 299.3 tons, respectively, were selected for the analysis. The 82% MTOW of each model was selected as the flight weight—68 t for A321, 225 t for A343, 324 t for B744, and 245 t for B773. Fuel consumption (every 72 s) of different models in the climbing phase under the same flight conditions and with the same flight trajectories was calculated. Comparison charts of fuel consumption of different models under two operation modes are shown in
Figure 13.
Figure 13 presents a minimal difference in fuel consumption between Airbus A320 and A321, which was due to the approximation of performance parameters, such as the mass, wing area, drag coefficient, and fuel consumption coefficient at each flight stage during the climbing phase.
In comparison with the fuel consumption of Airbus A343, that of Airbus A320 varied greatly during the climbing phase. First, the aircraft mass and wing area varied greatly because Airbus A320 is a narrow-body aircraft, whereas Airbus A343 is a wide-body aircraft. Second, Airbus A320 has two engines, whereas Airbus A343 has four. Therefore, the drag coefficient and fuel consumption of A343 for each flight phase were higher than those of A320 during the climb.
Boeing B744, similar to Airbus A343, is a four-engine aircraft with a larger mass and wing area. The drag coefficient of B744 is higher than that of Airbus A343 in the climbing phase, and the mass and wing area of B744 is also larger than those of A343. Therefore, although the fuel consumption coefficient of B744 is lower than that of Airbus A343, the fuel consumption of B744 is higher than that of A343 in all flight phases.
Although Boeing B773 and Airbus A320 models are twin-engine aircraft, the mass and wing area of B773 are larger than those of Airbus A320, and the drag coefficient during the climbing phase is also greater than that of the Airbus A320.
In conclusion, during the entire climbing stage, the order of fuel consumption of the five models is B744 > A343 > B773 > A321 > A320, and fuel consumption varies greatly. Taking a typical seat capacity into consideration and assuming the same load factor, the order of fuel consumption per passenger of the five models is A343 > B744 > B773 > A320 > A321.
7. Conclusions
This study proposes a fuel consumption model for the aircraft climbing phase by introducing aerodynamic parameters from the data fitting of QAR data and considering the crosswind effect. The data fitting method based on QAR data can accurately obtain the quantitative relationships among aerodynamic parameters. The crosswind kinematical model is then added to correct the fuel consumption model. Five numerical experiments were designed to demonstrate the feasibility and performance of the proposed fuel consumption model and also to quantify the fuel savings of a continuous climbing operation. For a sample aircraft type, Airbus A320, the analysis shows that the accuracy of the fuel consumption model proposed is improved by 2.4% compared with that of the traditional fuel consumption model, taking fuel consumption from QAR data as the baseline. The fuel consumption model developed from the QAR data of one airport was used to calculate the fuel consumption of the same type of aircraft at another airport. The results show a high accuracy, which proves the transferability of the proposed model. The last two experiments investigated the influences of aircraft mass, climbing angle, and aircraft model on the fuel consumption of the climbing phase. Through comparative experiments, several important conclusions about the fuel consumption model of the climbing phase can be summed up:
(1) QAR data were fitted to reveal the relationships between aerodynamic parameters for different Mach numbers. Based on two measurements, namely, the goodness of fit (R
2) and SSE, a quadratic function (Equation [
29]) was found to be the best fitting function. The fitting result was used in the fuel consumption model. Relationships between aerodynamic parameters from the static diagram relationship acquired through the wind tunnel experiment were also used in the fuel consumption model. For Airbus A320, the climbing trajectory was simulated, and fuel consumption values given the relationships of aerodynamics parameters from two different sources were calculated. The outcomes demonstrated that the fitting method is more accurate than the wind tunnel experimental method in obtaining the relationships between aerodynamic parameters;
(2) The fuel consumption model is further improved by considering crosswind influence. Wind information from QAR data was integrated into the fuel consumption model. The calculation results show that adding crosswind influence increased the accuracy (theoretical calculated amount divided by baseline amount from QAR data) by 2.4%. The fuel consumption model developed from QAR data of one airport’s departure flights was used to calculate the fuel consumption of the same model of aircraft at another airport. The accuracy of verification reached 96%, which demonstrates the transferability of the fuel consumption model;
(3) Comparison of fuel consumption in a conventional climbing mode versus continuous climbing mode shows that CCO saves fuel during the climbing process. For Airbus A320, the saving is slightly more than 12%;
(4) The influences of aircraft mass, climbing angle, and different aircraft models on fuel consumption were also analyzed. The calculation results show that fuel consumption increases with aircraft mass and climbing angle. For different aircraft models, the typical seat capacity and calculated fuel consumption per seat during the climbing phase were obtained. The results show that the order of the fuel consumption per seat during the climbing phase is A343 > B744 > B773 > A320 > A321.
To the best knowledge of the authors, the proposed model fills the gap in the existing literature. Accurately estimating the fuel consumption of the climbing phase using the proposed model contributes to controlling fuel loading to avoid the “oil flying oil” phenomenon caused by excessive fuel loading, reduces the operating cost, and mitigates consequent excessive emissions.
Note that in this research, regarding meteorological factors, only the influence of crosswind on fuel consumption was studied. Severe weather conditions, such as low-altitude wind shear, thunderstorm-caused heavy rainfall, atmospheric turbulence, and aircraft ice accretion, could also affect fuel consumption during the climbing phase. Further study may consider obtaining information of these meteorological factors and include them in the fuel consumption modeling.


