Article

An Evaluation of the Effect on the Expansion of Photovoltaic Power Generation According to Renewable Energy Certificates on Energy Storage Systems: A Case Study of the Korean Renewable Energy Market

1
School of Electrical Engineering, Korea University, Anam Campus, 145 Anam-ro, Seongbuk-gu, Seoul 02841, Korea
2
Regional Strategy Division, Korea Energy Agency, 323 Jongga-ro, Jung-gu, Ulsan 44538, Korea
*
Author to whom correspondence should be addressed.
Sustainability 2019, 11(16), 4337; https://doi.org/10.3390/su11164337
Submission received: 13 July 2019 / Revised: 6 August 2019 / Accepted: 7 August 2019 / Published: 11 August 2019
(This article belongs to the Section Energy Sustainability)

Abstract

:
As part of efforts to cope with climate change, countries around the world have decided to supply photovoltaic (PV) power. However, since the integration of PV affects the reliability and stability of a power system, increasing the penetration of PV generation requires better system flexibility. For this reason, many countries have recently established policies to disseminate energy storage systems (ESS). In this paper, we aim to evaluate the effectiveness of policies regarding ESS as a way to increase PV integration. We analyzed whether the policies were effective in spreading ESS to eventually increase PV integration. To do this, we first described the Korean government’s policy of establishing a profit structure for ESS through the Renewable Energy Certificate (REC) market and analyzed its effects on economic feasibility. We also analyzed how much the investment in ESS for PV integration has risen and assessed the contribution of spreading ESS to disseminate PV power. We found that ESS for the integration of PV have grown to a 41.0% share of Korea’s ESS market in kW, and 32.8% in kWh, while expanding the PV market by 13.7%.

1. Introduction

1.1. Global Overview on PV Generation

The Paris Agreement was adopted with the consent of 195 nations through the 21st annual Conference of Parties (COP21) held on 12 December 2015 in Paris, France [1]. In addition, countries participating in the Paris Agreement are pursuing a bold reduction policy in the energy sector, which has a high greenhouse gas (GHG) emission level, in order to achieve the GHG reduction target contained in the Intended Nationally Determined Contributions (INDC) submitted to the United Nations (UN) [2].
These efforts are bringing changes in investment in the energy market and are leading energy transition. In 2018, power sector investment was over USD775 billion and this was the largest investment among energy sectors [3]. In particular, the investment in the renewable energy sector increased 55% from 2010 to 2018, led by PV and wind power. In 2018, 181 GW of renewable energy was newly installed, of which PV power was 100 GW and wind power was 51 GW [4]. With the exception of power distribution facilities, PV and wind power areas drew the largest investment in the power sector for the three years of 2016–2018. Improved benefits of renewable energy from capital cost decrease and strong governmental dissemination policies led this trend [3]. For example, the capital cost of utility scale PV for 2018 fell to about 25% compared to 2010. On the other hand, during the same period, the capital cost of coal fired power, gas power, and nuclear power, have changed little or even increased.
In addition, developed countries such as the United States and European countries are endeavoring to cope with climate change and to lead energy transition with the expansion of renewable energy. The United States has decided to cut its GHG emissions by 26–28% from 2005 levels by 2025, according to the INDC submitted to the UN on 31 March 2015 [5]. It plans to cut about five billion tons by 2020, which is a 17% reduction compared to 2005, and 4.3 billion tons, which is a 26–28% reduction, by 2025. To that end, the Environmental Protection Agency (EPA) announced a Clean Power plan for carbon-dioxide reduction on 23 October 2015 [6]. This guideline aims to reduce GHG emissions in power generation by expanding natural and renewable energy and reducing the use of fossil fuels. On 10 October 2017, the abolition plan containing the review result based on the reconsideration request was submitted, and the Affordable Clean Energy Rule was proposed on 21 August 2018 [7,8]. As a result, the proportion of coal-fired power decreased from 50% in 2005 to 30% in 2017, natural gas power increased from 19% to 32%, and non-hydro renewable energy, such as wind and solar, increased from 2% to 10%, and CO2 emissions decreased by 27% [9].
In Japan, which has decided to reduce GHG by 26% by 2030 compared to 2013, the nation’s total GHG emissions decreased by 3.0% year-on-year in 2014 [10]. Despite the decrease in the proportion of nuclear-power generation, carbon-dioxide emissions decreased because of the decrease of petroleum thermal power, the increase of renewable energy, and the improvement of power generation facilities. Japan submitted its INDC with a detailed generation mix plan for 2030. According to the plan, the 2030 generation mix consists of 26% coal-fired power, 27% LNG, 22–24% renewable energy, 20–22% nuclear power, and 3% petroleum. Among them, renewable energy is planned to be 7% solar PV energy, 1.7% wind, 1.0–1.1% geothermal, 8.8% to 9.2% hydro power, and 3.7–4.6% biomass.
In fact, Japan installed 7 GW of solar energy in 2017, and its cumulative installed capacity reached 42.8 GW as of the end of 2017 [11]. Meanwhile, the feed-in tariffs (FIT) deadline, which was on 31 March 2019, was extended by six months, until 30 September 2019, and the installed capacity of solar power in Japan is expected to be increased to 65.6 GW by 2018–2020 by adding about 17 GW [12,13].
China, the world’s top GHG emission country, plans to reduce carbon-dioxide emissions per unit of gross domestic product (GDP) by 60–65% by 2030 compared to 2005 [14,15]. To this end, China plans to achieve 20% of total non-fossil fuels by constructing 100 GW of solar power and 200 GW of wind power by 2020, constructing low-carbon coal plants of 300 g/kWh, and expanding the proportion of primary energy consumption of natural gas to 10% [14].
European Union (EU) member states are considering setting carbon-neutral targets by 2050 in accordance with the European Parliament’s recommendation to implement the Paris Agreement [16]. A total of nine countries, including Britain and Germany, are considering setting goals related to carbon neutrality in the form of policy or legislation.
In addition, European countries, which are leading the expansion of renewable energy, expanded 338 GW renewable energy facilities, excluding hydro power [4]. Among the European countries, Germany, which leads the energy transition, has a total 113 GW renewable energy, including wind power reaching nearly 60 GW, and has the world’s largest PV power, considering its overall system capacity.
As a result, European CO2 emissions related to electricity production fell 5% in 2018 due to renewable energy, although global energy-related CO2 emissions increased for the second consecutive year [4].
In June 2015, South Korea decided to reduce its GHG emissions by 37% compared to Business as Usual (BAU) in 2030 [14]. This reflects the government’s willingness to make the new industry an innovation and growth opportunity for the Korean market. The Korean government adopted a 25.7% reduction scenario, but decided to further reduce by 37%, adding 11.3% of the GHG reduction using the international market mechanism.
In addition, the Korean government announced the 2030 Renewable Energy Implementation Plan on 20 December 2017, to achieve a 20% share of renewable energy generation by 2030 [17,18,19]. This plan includes not only raising the proportion of renewable energy generation to 20% by 2030, but also introducing more than 95% of new facilities as renewable energy sources, such as PV and wind power, for a total of 48.7 GW from 2018 to 2030, and plans to expand to 63.8 GW of renewable energy by 2030. In particular, the target for supplying PV generation facilities during this period is 30.8 GW, which is 63% of the total renewable energy supply. As a result, it is expected that the PV power capacity of 5.7 GW as of 2017 will be expanded to 36.5 GW by 2030. This would be about 57% of the total renewable energy in 2030.
Furthermore, through the announcement of the 3rd Basic Energy Plan on 4 June 2019, the Korean government will raise the portion of renewable energy generation, excluding hydro power, to 30–35% by 2040. The 30% is above the average of the OECD countries’ target of 28% for renewable energy generation in 2040, and the 35% is the limit on renewable energy penetration, considering the characteristics of Korea’s isolated power system. If renewable energy exceeds 35% of Korea’s power generation, the cost of backup facilities, such as ESS, needed to follow the sudden fluctuations in the output of renewable energy is expected to surge sharply.

1.2. Challenges with Increase of PV Penetration

Since renewable energy sources, including PV power, are inherently intermittent and uncontrollable, they are commonly known to have negative effects on the power system when they are connected to the grid [20,21].
First, PV generation, which is intermittent by nature and fluctuates within a short time, makes the operation of a power system difficult and requires a lot of reserve power.
Second, distributed PV power resources generate reverse flow and voltage fluctuation in the distribution network [22,23]. The system operator should be reminded of problems caused by the reverse flow, such as local voltage rise and the need for relay settings for fault-current detection.
In addition, where the generated PV power is more than is needed to supply electricity to the loads, the over-generation risk becomes high [24,25,26]. Lower net load than must-run generation for spinning reserve leads to inefficiency in system operation, because it entails the curtailment of PV power generation and can even lead to a system collapse because of the deviance of the generators.
On the other hand, the transient response of the grid depends primarily on the synchronous inertia of the thermal power plants using the rotating synchronous machine [27]. However, the increasing proportion of renewable energy, including PV, reduces system inertia more than total power generation does, making it difficult to maintain the stability of the system. The difficulty of system operation caused by the decrease of system inertia that results from the increase of renewable energy integration can be further exacerbated in isolated systems with low system inertia, because there is no link to external systems, such as in Korea [21,28].
However, the problem caused by the systematic linkage of renewable energy is a problem that can be solved, and a technical solution has already been greatly studied [26]. A study by Sovacool et al. [26] shows that the disturbance to the spread of renewable energy results from social inertia. In contrast, renewable energy has many advantages of managing investment fund and risk because it can be built on a small scale in various areas adjacent to the load, the construction period is short, the initial investment cost is low, and it is not affected by changes in fuel prices. In addition, PV power has no noise and no toxicity [29].

1.3. Roles of ESS to Integrate PV Energy

Recent studies are sending a message not only to spread PV generation but also to prepare for it to be integrated into power systems in a stable manner in order to cope with the possible situations caused by the increase in PV system penetration.
The International Energy Agency (IEA) emphasizes that when the proportion of renewable energy generation reaches 25%, most of the demand at low load times, such as weekends, will be covered by renewable energy, so it is necessary to have the capacity to recover system stability immediately in the case of supply instability [30]. The IEA also stresses that ultimately it is important to have flexibility in the system.
According to the NREL report, more than 30% of renewable-energy integration is inconsistent in supplying demand, and for systems without external links, such as islands, this problem can occur with a lower proportion of renewable energy [21]. In another recent report, NREL says that for PV generation to be 15–20% of the total, particular attention should be paid to system operation; especially considering the retirement of aging coal power, cost-competitive ESS are a good option that can increase the rate of PV penetration [31]. The need for ESS is higher for systems with lower system flexibility that can be achieved through demand response, external system linkage, and EV charge management. Also, in systems with 50% PV generation, ESS should be considered even for highly flexible systems.
Several studies suggest that solutions for PV penetration using ESS will enhance the value of PV power and contribute to PV diffusion. Dvorkin et al. [32] have shown that the value of variable renewable energy can be improved through the ESS. They also proposed profitable uses of ESS with arbitrage transactions of surplus energy from the variation of renewable generation through the decision making of the size and location of ESS.
Shivashankar et al. [22] propose a way to control battery ESS by introducing ESS as a method for smoothing fluctuations of PV output caused by solar intermittency. In addition, the authors found that voltage fluctuation, reverse flow, and frequency fluctuation can be reduced by such ESS as batteries, super-capacitors, and hydrogen fuel cells. Among these, battery ESS are the most suitable for MW-size PV generation. They finally argue that, despite the challenges of integrating PV power into power systems, efforts to expand PV generation should continue.
According to Hill et al. [33], the ESS can control both real and reactive power, allowing both var control for voltage support and frequency droop control, reducing the requirements of traditional fossil-fuel generation assets for PV expansion, and improving the economic value of PV.
The study conducted by Rudolf and Papastergiou [34] defines the profit-maximization problem that determines the storage and sale of PV power generation combined with ESS, and argues that shifting PV generation using ESS can increase the revenue from solar-power generation based on the economic evaluation results. It also emphasizes that, although there are many advantages of ESS in PV generation, it is necessary to encourage investment in ESS in order to expand ESS in PV generation. Recently, the trend of PV generation has shifted from rooftop to utility scale, in which the ESS’s role becomes more necessary.
Denholm and Margolis [35] proposed three options to deal with the surplus generation of PV power in order to increase PV penetration beyond 20% of a power system’s energy: Increased flexibility by improving the ramping capability and reducing minimum load constraint, load shifting that concentrates load during daytime with high PV generation, and energy storage of PV power that can be released when not enough PV power is generated. High PV penetration, which is 10% to 20% of the total energy of the system, requires additional PV integration solutions despite increased system flexibility. Load shifting requires having a real-time price system that responds to PV output. Energy storage, on the other hand, is a solution that relieves the problem of PV output being intermittent and overcomes the must-run constraint of base generation. They suggest that the ESS’s capacity to store much less than the average daily demand can allow PV to supply 50% of the total system energy.
Moore and Shabani [36] stated that a 10–20% ESS capacity is generally needed, depending on the specific conditions of each grid, in order for the intermittent renewable energy sources such as wind and solar PV power, to be effectively integrated into power systems. In addition, the results of analysis conducted by Norwood et al. [37] indicate that solar thermal, PV, and battery ESS will play an important role in meeting Europe’s targets for renewable energy supply.
The results of the studies above have shown that ESS relieves the burden of the power system due to increased variable renewable energy integration by mitigating the volatility of the power generation output of renewable energy, including PV, and by providing the primary and secondary reserves for frequency regulation service [21,22,23,30,31,33,35,36,37,38,39]. The studies also have verified that ESS increases the economic value of variable renewable energy by storing surplus power to participate in the energy trading market, and by bringing new investment opportunities through the substitution of a need to upgrade old distribution and substation facilities [32,34,39,40].

1.4. Efforts to Promote ESS for Increase PV Generation

ESS, especially battery storage, accounted for only a small portion of the whole power sector. However, it has shown a rapid growth of 45% in 2018. Over USD 4 billion was invested in ESS in 2018, and the capital cost has dropped to half of the level compared to in 2010 [3].
Countries such as the U.S., Korea, Japan, and Germany, which are striving to expand PV energy, are implementing policies to expand ESS simultaneously [36,41]. In particular, the grid-scale ESS is led by Europe, China, and U.S. while behind-the-meter ESS is led by South Korea, Europe, and China [3]. In early 2019, the installed capacity of ESS is over 3 GW worldwide, with nearly 80% of them concentrated in five countries [4].
States in the U.S., namely, California and Puerto Rico, have implemented a mandatory supply of ESS [42]. ESS is not as part of RPS; however, stored energy could contribute to comply with RPS in California. Other states in the U.S. such as New Jersey and Hawaii give economic incentives to ESS.
Germany aims to raise the proportion of renewable energy to 80% by 2050, and is expected to need 16 GWh of hourly energy storage capacity by 2030 [36]. Germany has supported the market with subsidies and low-interest loans through the government-owned development bank, KfW.
The UK plans to replace old coal power plants with renewable energy, highly concentrated in wind power, over the next decade [36]. To do this, the UK aims to reduce over GBP 6 million in costs for system upgrades by evaluating the economic effectiveness of ESS in renewable energy integration, alleviation of network congestion, and ancillary services while pursuing many large-scale projects around the lithium-ion battery ESS. Also, the UK government has focused its ESS investment in the transmission and distribution sector with the Low Carbon Network Fund (LCNF) of GBP 500 million to drive forward technical innovation of grid modernization.
Korea has also been making mandatory and incentive policies on ESS. In addition to making ESS mandatory in public buildings, the government implemented an incentive policy for electricity charges on the demand side. In the renewable energy sector, ESS was recognized as an RPS resource to give RECs to ESS that are linked to wind or PV power and to provide incentives for wind and PV power investors to invest in ESS together [43].
Korea has decided to grant RECs for PV-linked ESS. This is aimed at strengthening the profit structure of ESS through the REC market, thereby attracting investment in PV-linked ESS and ultimately increasing the dissemination of PV generation. The aim is to increase the dissemination of PV generation by attracting investment in PV-linked ESS by strengthening the profit structure of ESS with the REC market mechanism.
Our aim here is to analyze the effectiveness of the incentive policy for the expansion of PV-linked ESS which the Korean government has pursued to expand PV power continuously. We analyzed the effect of the policy on issuing RECs to the PV-linked ESS, which was promoted by the Korean government to expand PV-linked ESS, in terms of the economic feasibility of the PV-linked ESS. Also, we analyzed how this policy contributed to the expansion of PV generation, which is the ultimate objective of this policy.
Section 2 describes how the Korean government provides economic incentives for ESS to be integrated through the REC market. In Section 3, we numerically analyze the value of the PV-linked ESS. We evaluated the economic feasibility of PV projects with and without ESS linkage, and demonstrated that PV power generation can be increased by the ESS linkage by analyzing the effect of generation shifting. The effect of public policy on the expansion of PV power generation by incentivizing PV-linked ESS is reviewed and discussed in Section 4. We provide government policymakers with a reference to what role ESS can play in expanding PV power.

2. Renewable Energy Certificates

2.1. Renewable Portfolio Standard for Energy Stoarge System

Korea’s PV market began in 2006 with the initiation of the FIT. Since 2012, the RPS system led the PV energy market with termination of the FIT. The PV energy market has been expanding in line with the increase in the mandatory rate of RPS by year and, since 2017, the PV market has also achieved excess growth because of the inflow of ESS into the REC market through PV linkage.
ESS support the grid integration of PV power generation according to the following procedure. First, ESS absorbs the surplus power generated by PV systems. Second, it copes with sudden power decreases caused by cloud cover. Third, it contributes to balancing the supply and demand of the system [44]. In addition, ESS mitigates the distribution and substation facility capacity constraints and reduces the initial cost of renewable-energy power-plant construction projects because of facility expansion. For these reasons, ESS is commonly known to be a major solution to the problems that arise from the increase of PV power integration, as several studies have proved and supported. However, the issue of who will install the ESS, who will pay for them, and whose money will be paid, still remains a policy challenge to be solved.
Governments can institutionally force market participants, such as utility and power companies, to install the ESS and pay for them in order achieve a public interest in the reliability and sustainability of power systems. In another way, governments can expand ESS participation in the system by means of market mechanisms that attract ESS investments.
The RPS is a policy mechanism that requires power companies to allocate a portion of renewable energy, but also to make power companies work through the REC market and attract private investment. RPS is a system in which power producers are obliged to supply a certain proportion of their generation by means of renewable energy sources. Also, it attracts private investment in renewable energy development through REC transactions, which are a certification for renewable energy supplies. Among the policies such as tax credits and net metering, RPS is the most effective policy to supply renewable energy [44]. Based on this, Johnston [44] argues that ESS should be incorporated into the RPS system to expand renewable energy.
In 2016, the Korean government decided to give the ESS business an additional economic option by opening up the RPS system for ESS to participate in. Through this, the Korean government has formed a structure that makes PV-linked ESS profitable in the renewable-energy market and has attracted investors to invest in ESS to solve the problems caused by the integration of large-scale PV power generation. ESS has been incorporated into the REC market, enabling ESS installation to obtain REC, which enables the power producers to fulfill the RPS mandatory ratio. This is an incentive for private investors as well as power producers to invest in PV-linked ESS.

2.2. Reneable Energy Certificates on Energy Stoarge System

A Renewable Energy Certificate (REC) certifies that a power-generation company has produced and supplied electricity through renewable energy sources. One REC is issued based on 1 MWh by weighting the amount of renewable energy generated. These issued RECs are traded through the REC market. The purchasers are power suppliers that have to meet the RPS mandatory ratio. If they cannot meet the RPS ratio on their own renewable energy generation, they can meet the obligation through REC transactions. The RPS mandatory ratio, which is increased yearly, causes REC demand to persist in the REC market, which is a driver for power producers to invest in renewable energy sources.
On 16 September 2016, the Korean government initiated a plan to issue RECs with a weight of 5.0 for PV-linked ESS. This weight for ESS is significantly high, considering that the weight given to PV power generation is 0.7 to 1.5, and the REC weight for offshore wind power is around 2.0.
Table 1 summarizes the REC weight currently issued to PV-linked ESS in Korea. This REC weight is applied based on the date of facility completion and is maintained without change. This policy attracts investors by encouraging investments.
The ESS for which the REC is issued should be connected in parallel with the PV power generation facilities as a battery ESS consisting of a power-conditioning system (PCS), power-management system (PMS), and lithium-ion battery. RECs that are applied to ESS’s weight are issued only for systems that store PV power between 10:00 h and 16:00 h and that transmit energy to the grid in other time zones. For PV power transmitted to the grid without going through the ESS, the REC weight for PV generation is applied. The REC issued for PV-linked ESS is calculated in Equation (1) and REC for PV is represented by Equation (2).
γ ESS = ω ESS × ( t = 1 10 ( E t ED E t EC ) + t = 17 24 ( E t ED E t EC ) )
γ PV = ω PV × t = 1 24 ( E t PV E t EC )

3. Numerical Study

In this section, we quantitatively analyzed the contribution of PV-linked ESS to PV power generation in terms of economics, to provide a basis for assessing the effect of ESS profit structure formation policy on PV power diffusion through the REC market mechanism. We also evaluated the PV generation shifting effect of ESS.

3.1. Problem Definition and Formulation

First, we mathematically modeled the profit structure of PV generation, including the ESS. PV and ESS generation profits come from system marginal price (SMP) settlement for power sales through PV generation and ESS discharge, and REC transactions in the REC market.
The mathematical definition of profit, π, and the optimal formula for profit maximization are represented as Equation (3). Considering that PV power generation is dependent on solar radiation energy and cannot be controlled, the decision variable that maximizes operating profit is the ESS’s charging and discharging schedule.
max .   π = t = 1 24 ( ( E t PV E t EC + E t ED ) × ρ t SMP ) + ( γ PV + γ ESS ) × ρ REC = t = 1 24 ( ( E t PV E t EC + E t ED ) × ρ t SMP ) + ( ω PV × t = 1 24 ( E t PV E t EC ) + ω ESS × ( t = 1 10 ( E t ED E t EC ) + t = 17 24 ( E t ED E t EC ) ) ) × ρ REC
subject to
t = i i + 1 ( E t EC ) P E ,   i
t = i i + 1 ( E t ED ) P E ,   i
t = i i + n ( E t EC E t ED ) S ,   i ,   n
t = i i + 1 ( E t ED E t EC ) t = i n i ( E t EC E t ED ) ,   i ,   n
For the operation of the ESS to maximize revenue, the ESS should not charge from 16:00 h to 10:00 h of the next day, and not discharge during 10:00 h to 16:00 h. Therefore ESS operation should be under the following additional constraint:
t = 1 10 ( E t EC ) = t = 17 24 ( E t EC ) = t = 11 16 ( E t ED ) = 0

3.2. Case Modeling and Market Analysis

In order to model the PV and ESS power generation cases for an economic feasibility evaluation, we analyzed the status of PV-linked ESS installation in Korea.
Figure 1 is the distribution of the PV-linked ESS installations in Korea. Based on rated power output in kW, about 38.0% of PV-linked ESS is 100 kW or less. Also, based on storage capacity in kWh, about 38.5% of PV-linked ESS is 500 kWh or less. In the Korean domestic market, most PV-linked ESS projects take place on a small scale of less than 1 MW and several MWh, and are occasionally installed on a scale of several MW and tens of MWh.
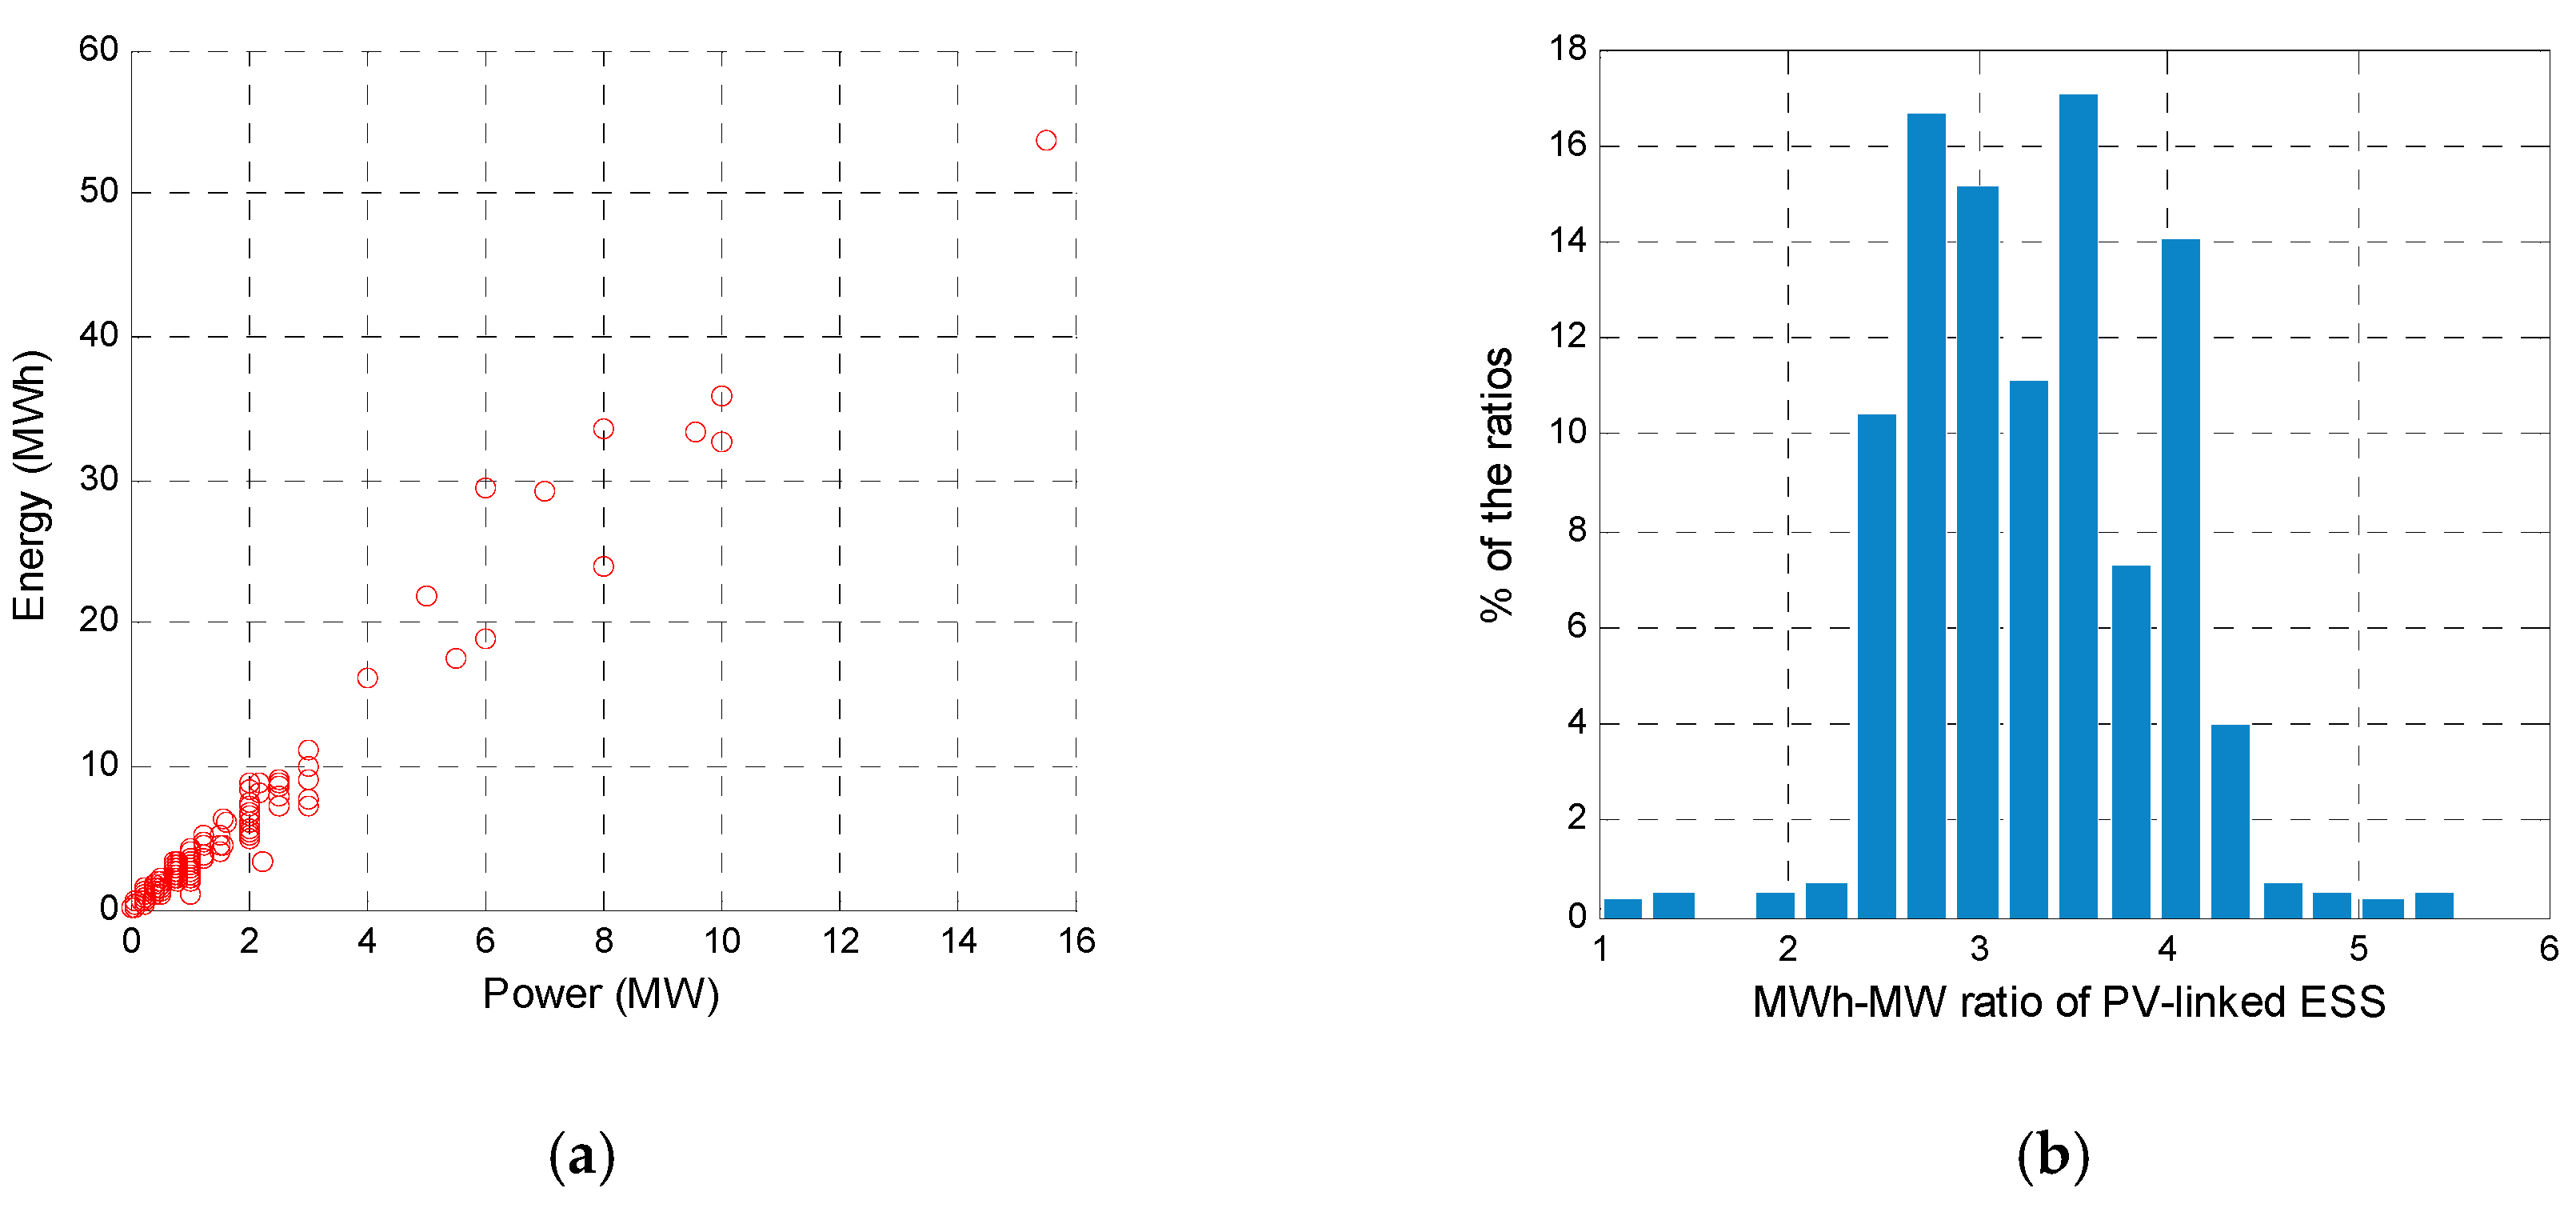
Figure 2 shows the ratio distribution of MW power and MWh storage capacity of PV-linked ESS. The mean of the storage capacity and power ratio of the PV-linked ESS is 3.3 and 49.6% of total is in the range from 2.7 to 3.5.
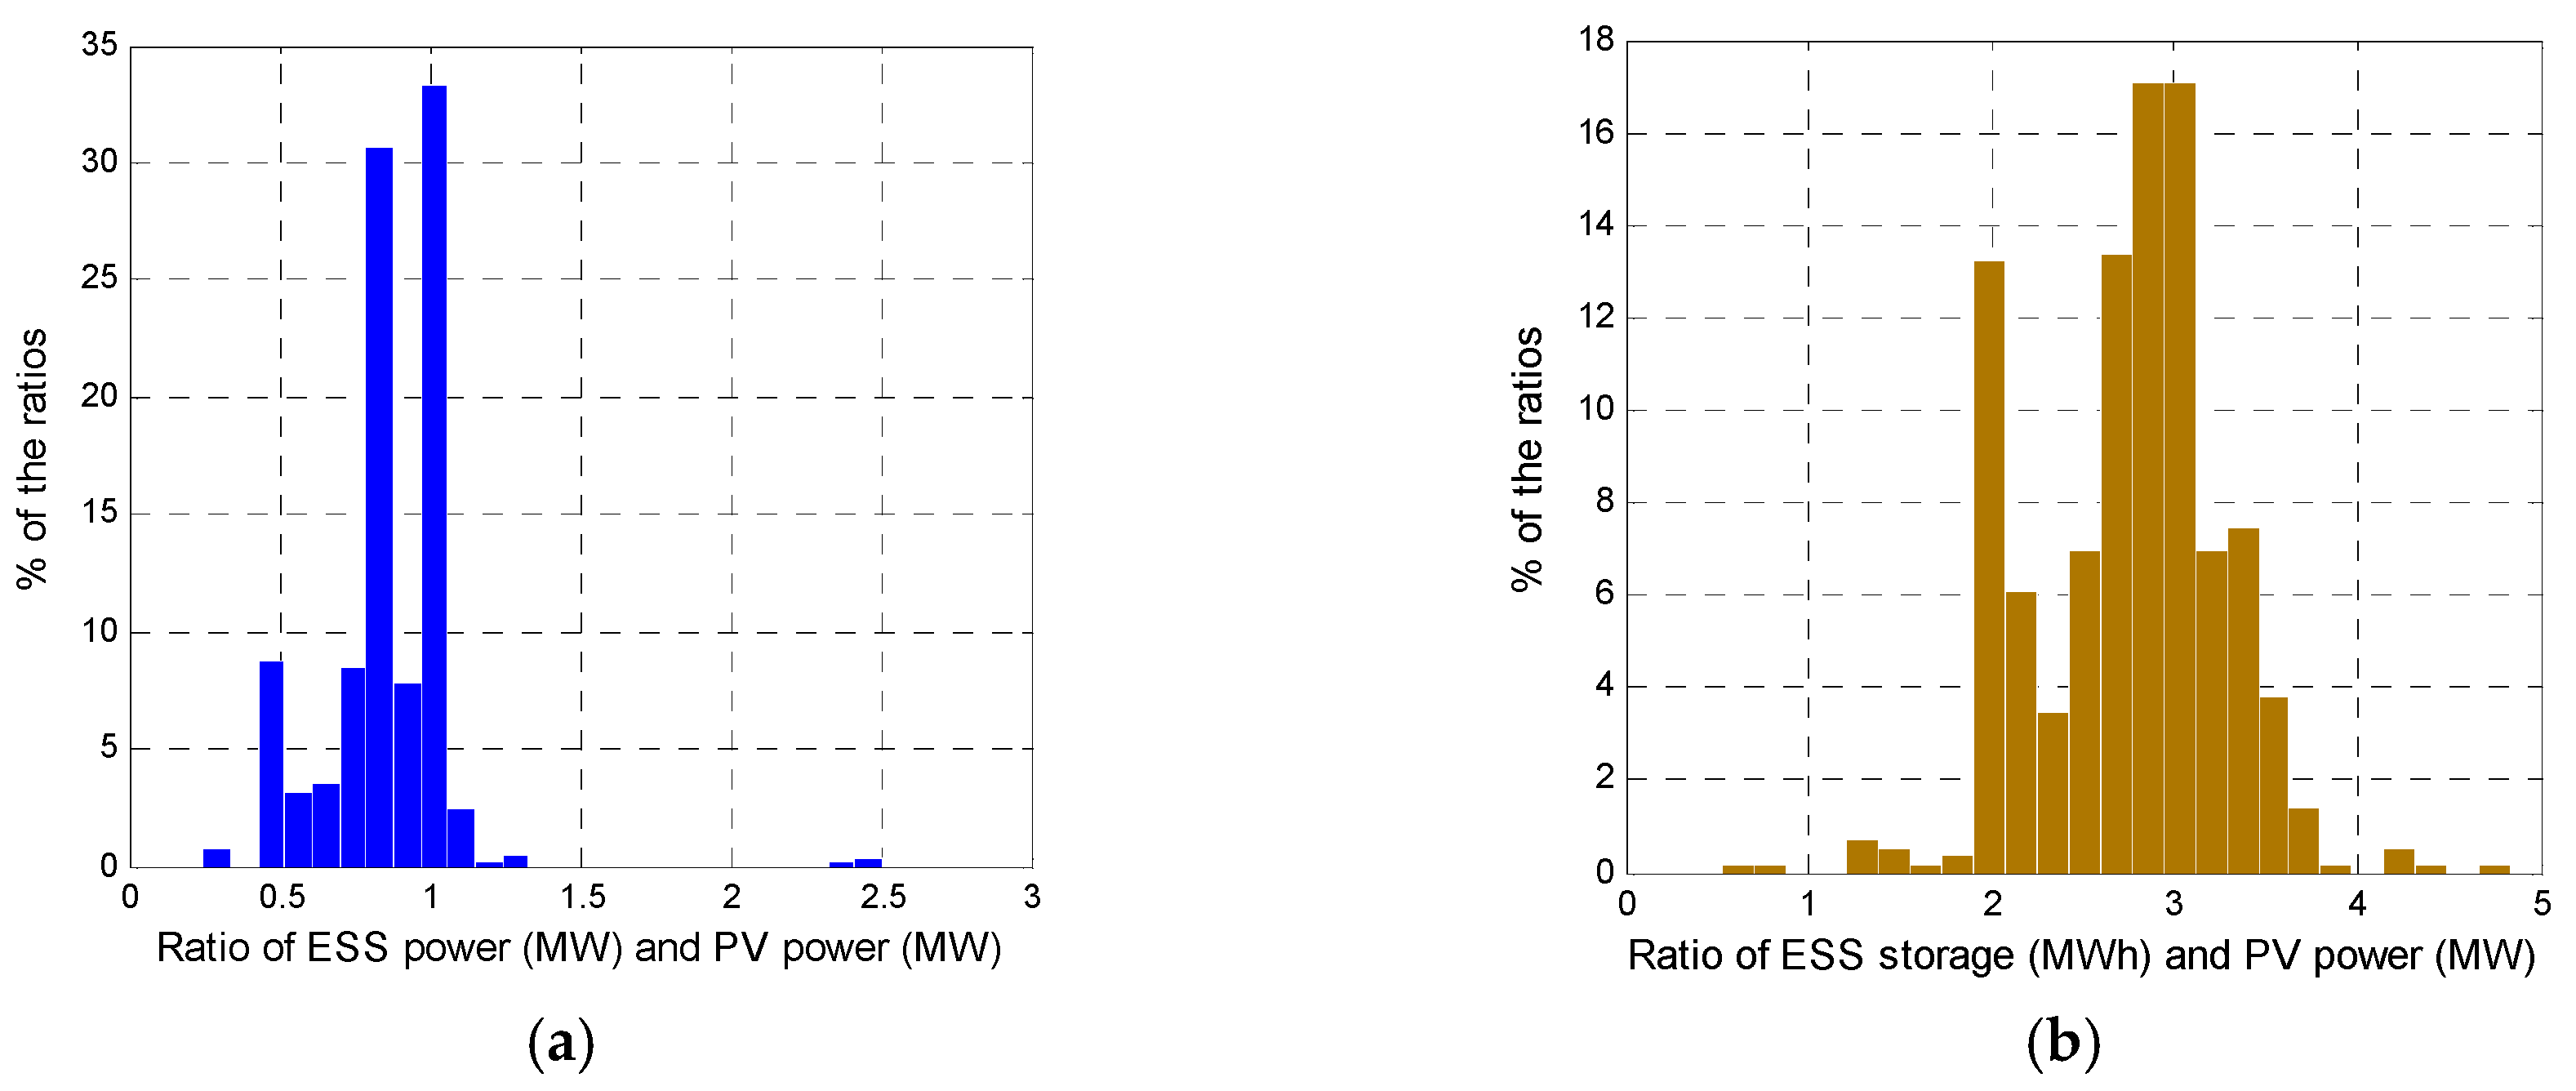
Figure 3 shows the distribution of the capacity ratio between PV and linked ESS; 67.7% of PV-linked ESSs are in the range of 0.85 to 1.05 in kW–kW ratio. Also, 50.8% are in the range of 2.8 to 3.2 at a rate of kWh–kW.
The PV-linked ESS are designed to have a rated kW output similar to that of PV power, with an average of 3.3 h of storage capacity, even though an REC for PV-linked ESS is issued for six hours from 10:00 h to 16:00 h, because the PV power generation cannot sustain its rated output power during the six hours. The storage capacity and output power ratio could be higher if the amount of solar radiation is better.

3.3. Economic Feasibility Evaluation

We evaluated economic feasibility in order to assess the contribution of the policy effort of the Korean government in creating a profit structure of ESS in the renewable energy market. We carried out the analysis by calculating the payback period, benefit–cost (B/C) rate, internal rate of return (IRR), and net present value (NPV).
In Korea, 20-year fixed-price contracts are provided for REC transactions. Based on this, the specifications of PV and ESS to be applied to this study are set out in Table 2, and the specific contract conditions are summarized in Table 3.
In order to conduct the calculation, we consider the actual conditions of PV power generation in Korea. We supposed that the cash discount rate is 3% and the usage rate of the PV facility is 15.57% which is average of all Korea’s cases [45]. Also, we assumed that the power of PV and ESS facilities are reduced at an annual rate of 0.5%, taking into account the extent of the aging of the facilities and that the facilities have to be shut down for a few weeks to maintain the facilities.
The results of economic feasibility evaluation for PV power generation, with and without ESS, are summarized in Table 4. As a result, despite increase of the initial cost through ESS linkage, the profitability of PV project is improved.
This section shows that the Korean government’s policy of attempting to create a profit structure for PV-linked ESS and to improve the economic feasibility of PV generation to attract investment in ESS in the PV energy market has enabled more revenue and higher returns through ESS in PV power-generation projects.
The assessment of whether the outcome of this economic improvement actually led to investments in PV-linked ESS is discussed in Section 4.

3.4. Generation Shifting Effect

It is generally known that the generation shifting effect of ESS gives more room to operate PV power while using the existing power substations and distribution facilities [40]. Our analysis showed how PV generation can be increased by ESS linkage under the same substation and distribution conditions.
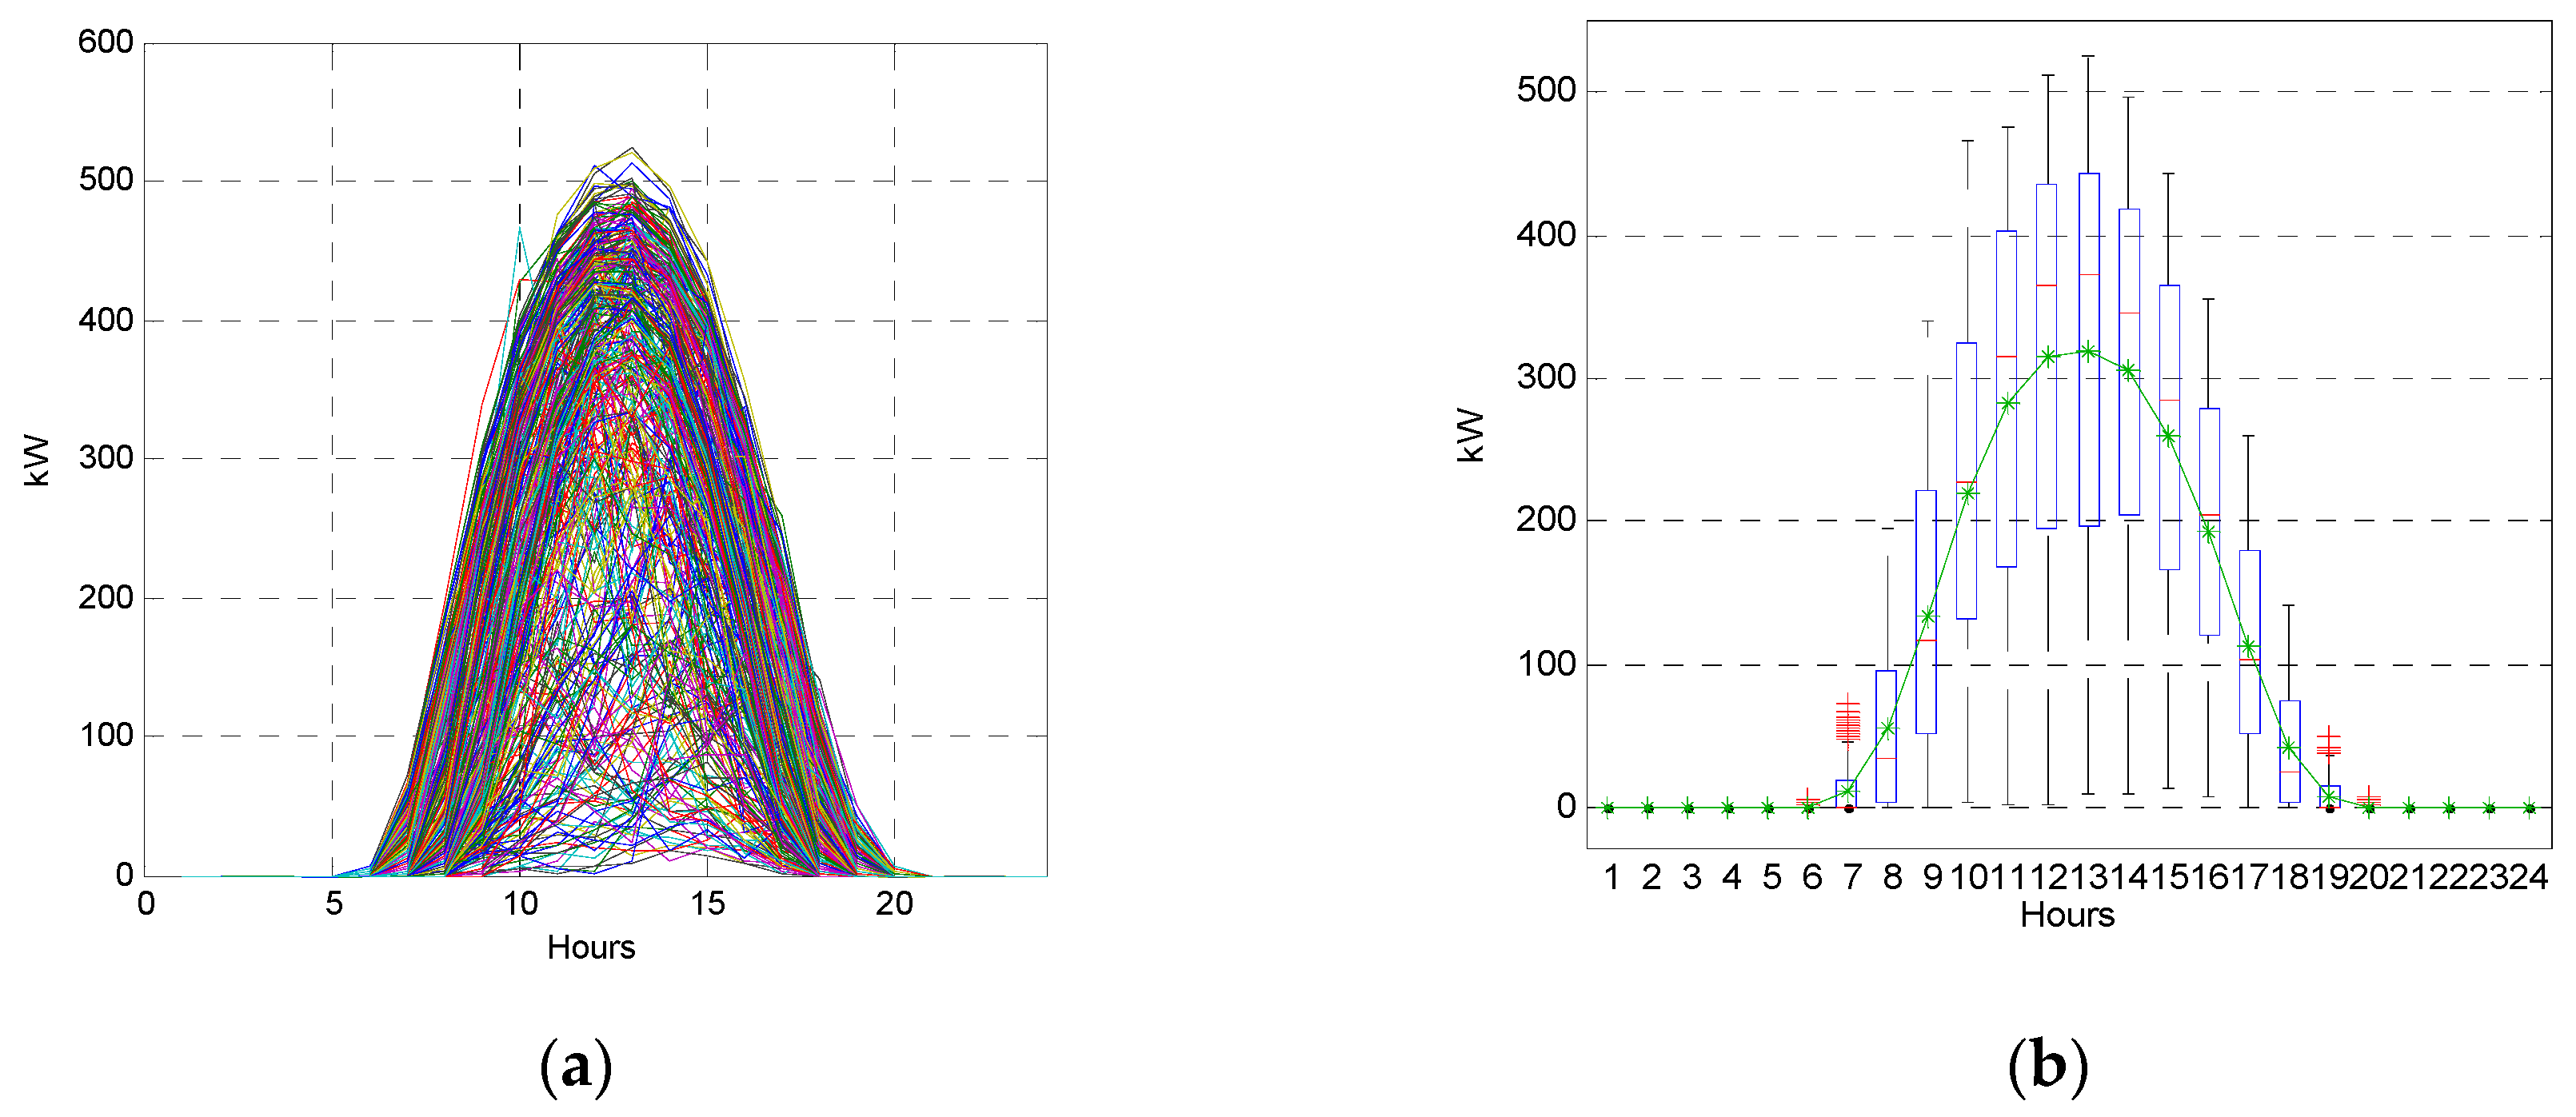
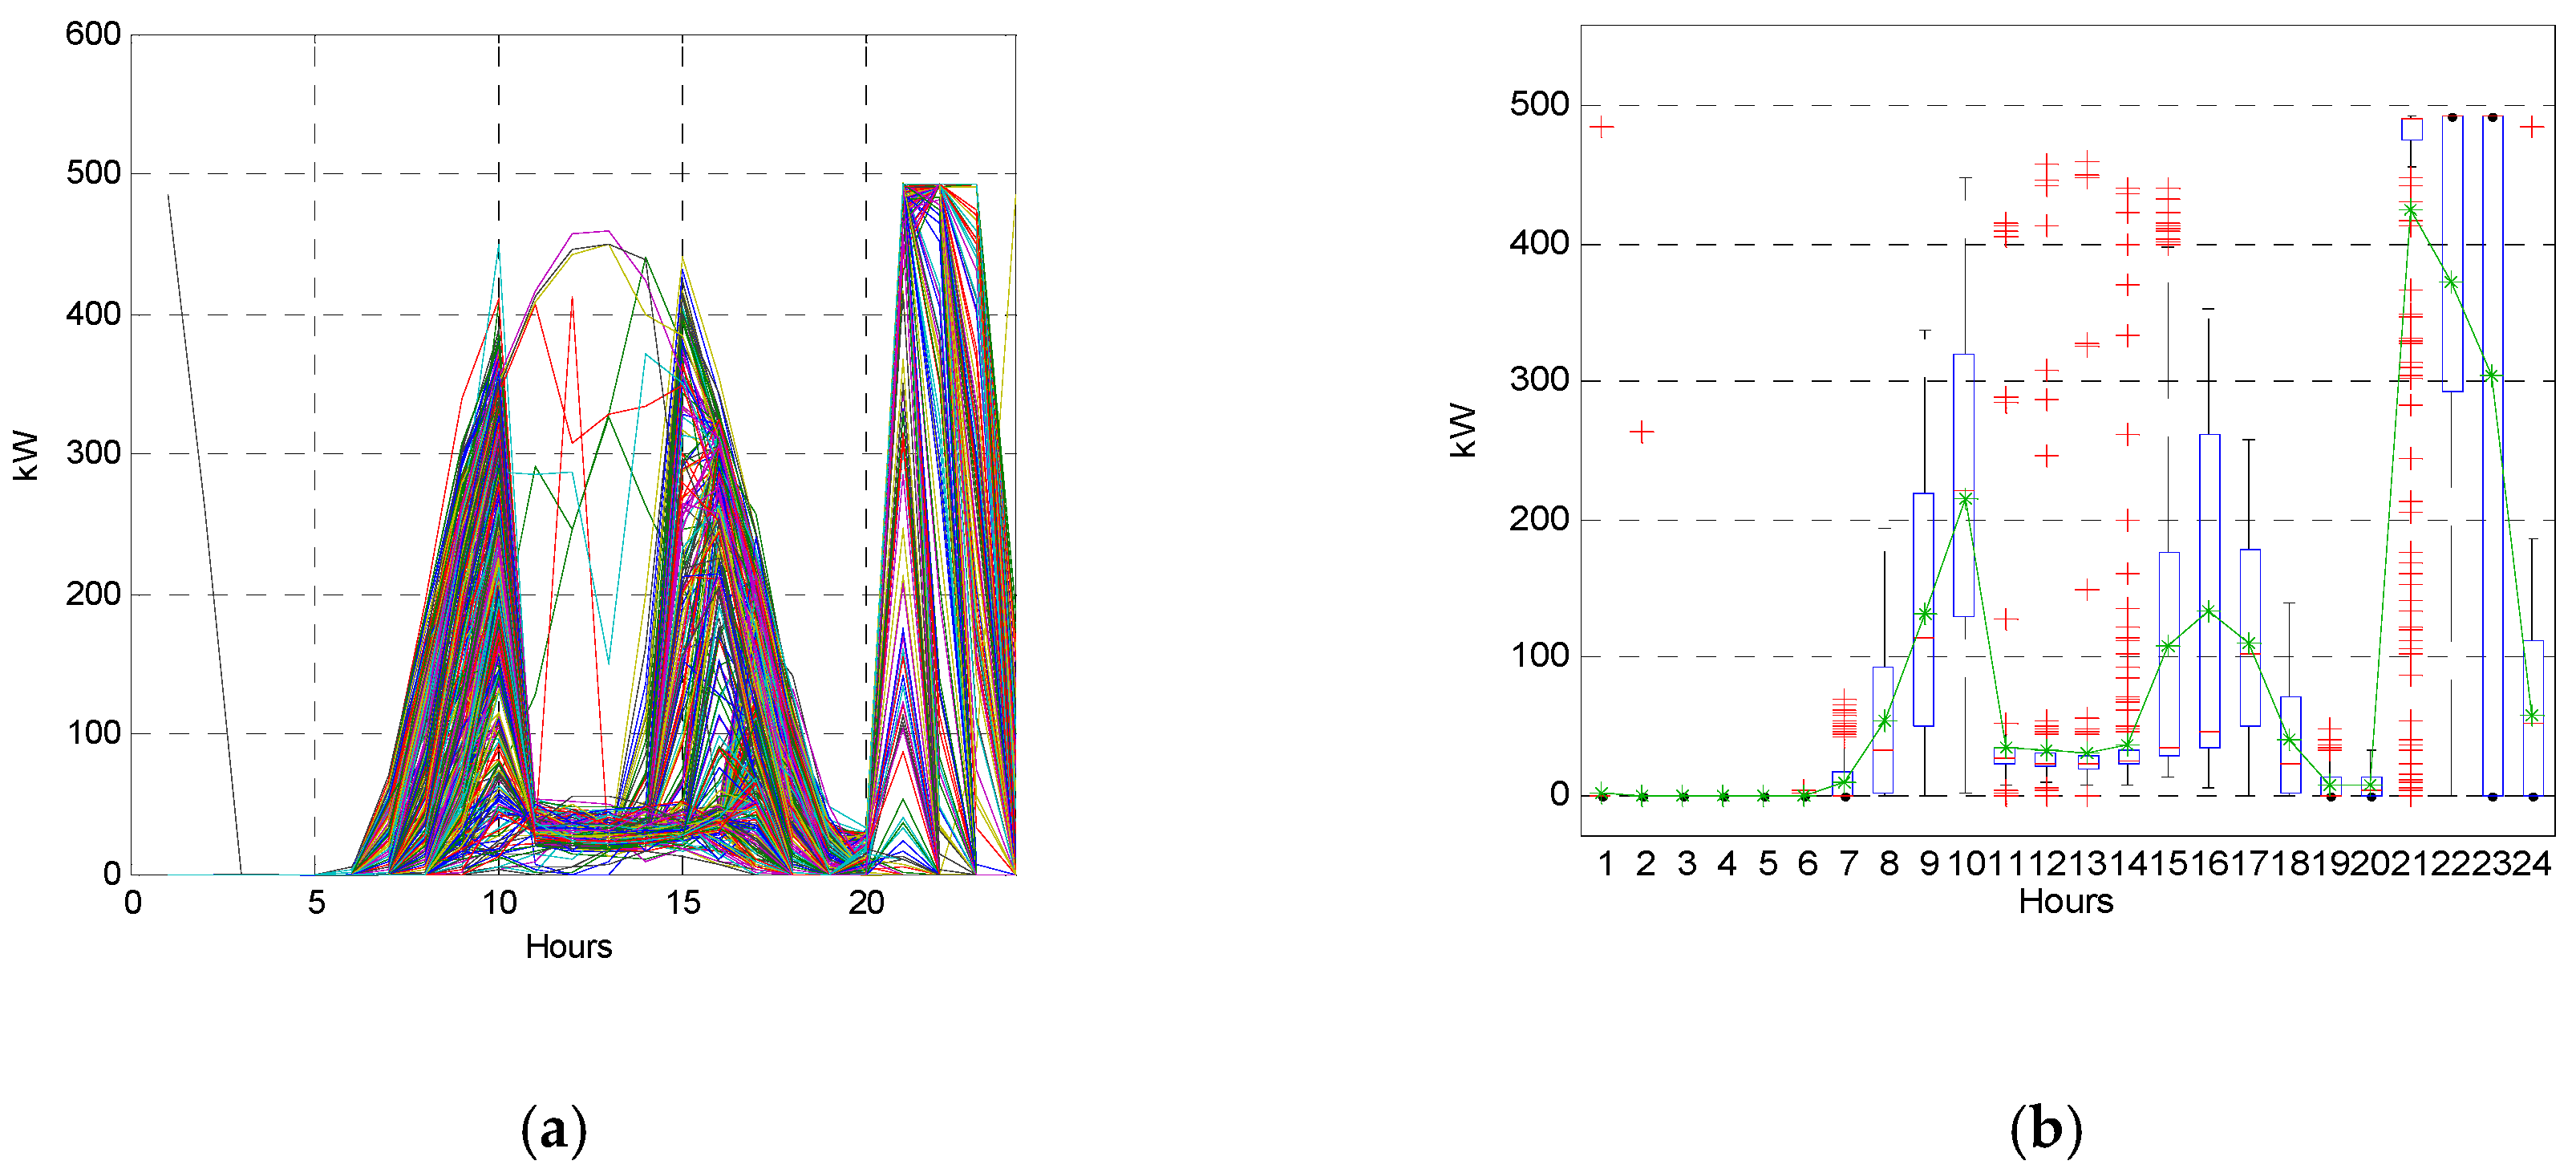
Figure 4 and Figure 5 shows one-year daily generation patterns of a 600 kW PV power plant and 600 kW PV with 500 kW and 1800 kWh ESS, respectively. Figure 4a and Figure 5a show all the 24 h generation patterns of 365 days per year, and Figure 4b and Figure 5b show the distribution by one-hour time zones. For the distribution in Figure 4b and Figure 5b, the middle red lines in the blue bars are the median, and the bottom and top of the blue boxes are 25% and 75% points, respectively. The top and bottom ends of the vertical dotted lines indicate maximum and minimum. The red-crosses are outliers beyond the distribution range. Also, the green lines with star markers represent the averages.
For PV generation without ESS, the annual peak is 525 kW, which is 87.5% of the facility’s capacity. However, for PV power generation with ESS, the annual peak is 460 kW, which is 76.7% of PV capacity, 12.4% lower than the case without ESS, which indicates that as much additional PV power can be earned as the corresponding margin above.
By storing PV generation peaks of daytime hours in ESS and transmitting the stored power to the grid at nighttime when PV generation is not possible, PV power can avoid the constraints from the capacity limits of distribution and substation facilities. PV power generation facilities should be designed considering the capacity of distribution and substation facilities. By installing ESS in parallel, however, PV power-generation facilities that exceed the existing constraints of facilities’ capacity can be installed. This contributes not only to a greater PV power supply, but also to an increased usage rate of PV power.
Furthermore, the process of storing and transmitting PV generation in the ESS allows control of PV generation transmission and alleviates the variability of PV power output. Several studies have been conducted on how ESS solves the problem of PV power fluctuation. The ESS operating strategy of storing PV generation peaks during daytime and transmitting stored power at nighttime is more advantageous in terms of extending the life cycle of ESS, compared to the ESS control methods that continuously repeat charging and discharging in a short time while continuing to follow short-term PV power fluctuations. Whereas the lifespan of PV power facilities is about 20 years, the lifespan of the battery ESS is three or four thousand cycles, which is about 10 to 15 years. Therefore, an operational strategy that extends the life of ESS is an essential consideration in the engineering of PV-linked ESS.

4. Discussion

In this section, we discuss how much PV-linked ESS has been increased in accordance with the REC policy for PV-linked ESS in Korea, and how much has been contributed to the policy’s ultimate goal of expanding PV power generation.

4.1. Dissemination of ESS for PV Integration

The Korean government has pursued policies of ESS diffusion throughout the power system: Frequency regulation and distribution network reinforcement, renewable energy integration, peak management, and electricity bill reduction. These policies are commonly aimed at improving the system’s flexibility and increasing its capability [41]. The policies have also contributed to the expansion of ESS in Korea. Figure 6 shows the ESS capacity installed in each sector in Korea annually. As shown in Figure 6, the ESS market in Korea is growing every year. In particular, the PV-linked ESS market expanded explosively from the REC policy announced in September 2016, showing a greater growth rate than that of all other sectors.
The incentive policy for PV-linked ESS was announced in September 2016, and the first PV-linked ESS project started commercial operation in early 2017. Since then, the PV-linked ESS market has increased not only quantitatively but also in the share of the entire ESS market in Korea. Figure 7 shows the market share by sector in Korea’s ESS market by year. Whereas the ESS market for frequency regulation has being saturated, and economic feasibility for new ESS projects on the demand side is on the decline because of the incentive program’s deadline, this growth trend of the PV-linked ESS market is expected to continue for some time as the high REC weight is maintained until 2020.
In conclusion, PV-linked ESS in Korea exceeds 24.1% of the total market in kW and 27.4% in kWh. In 2018, PV-connected ESS accounted for 41.0% share of the kW market and 32.8% share of the kWh market.

4.2. Dissemination of PV Power

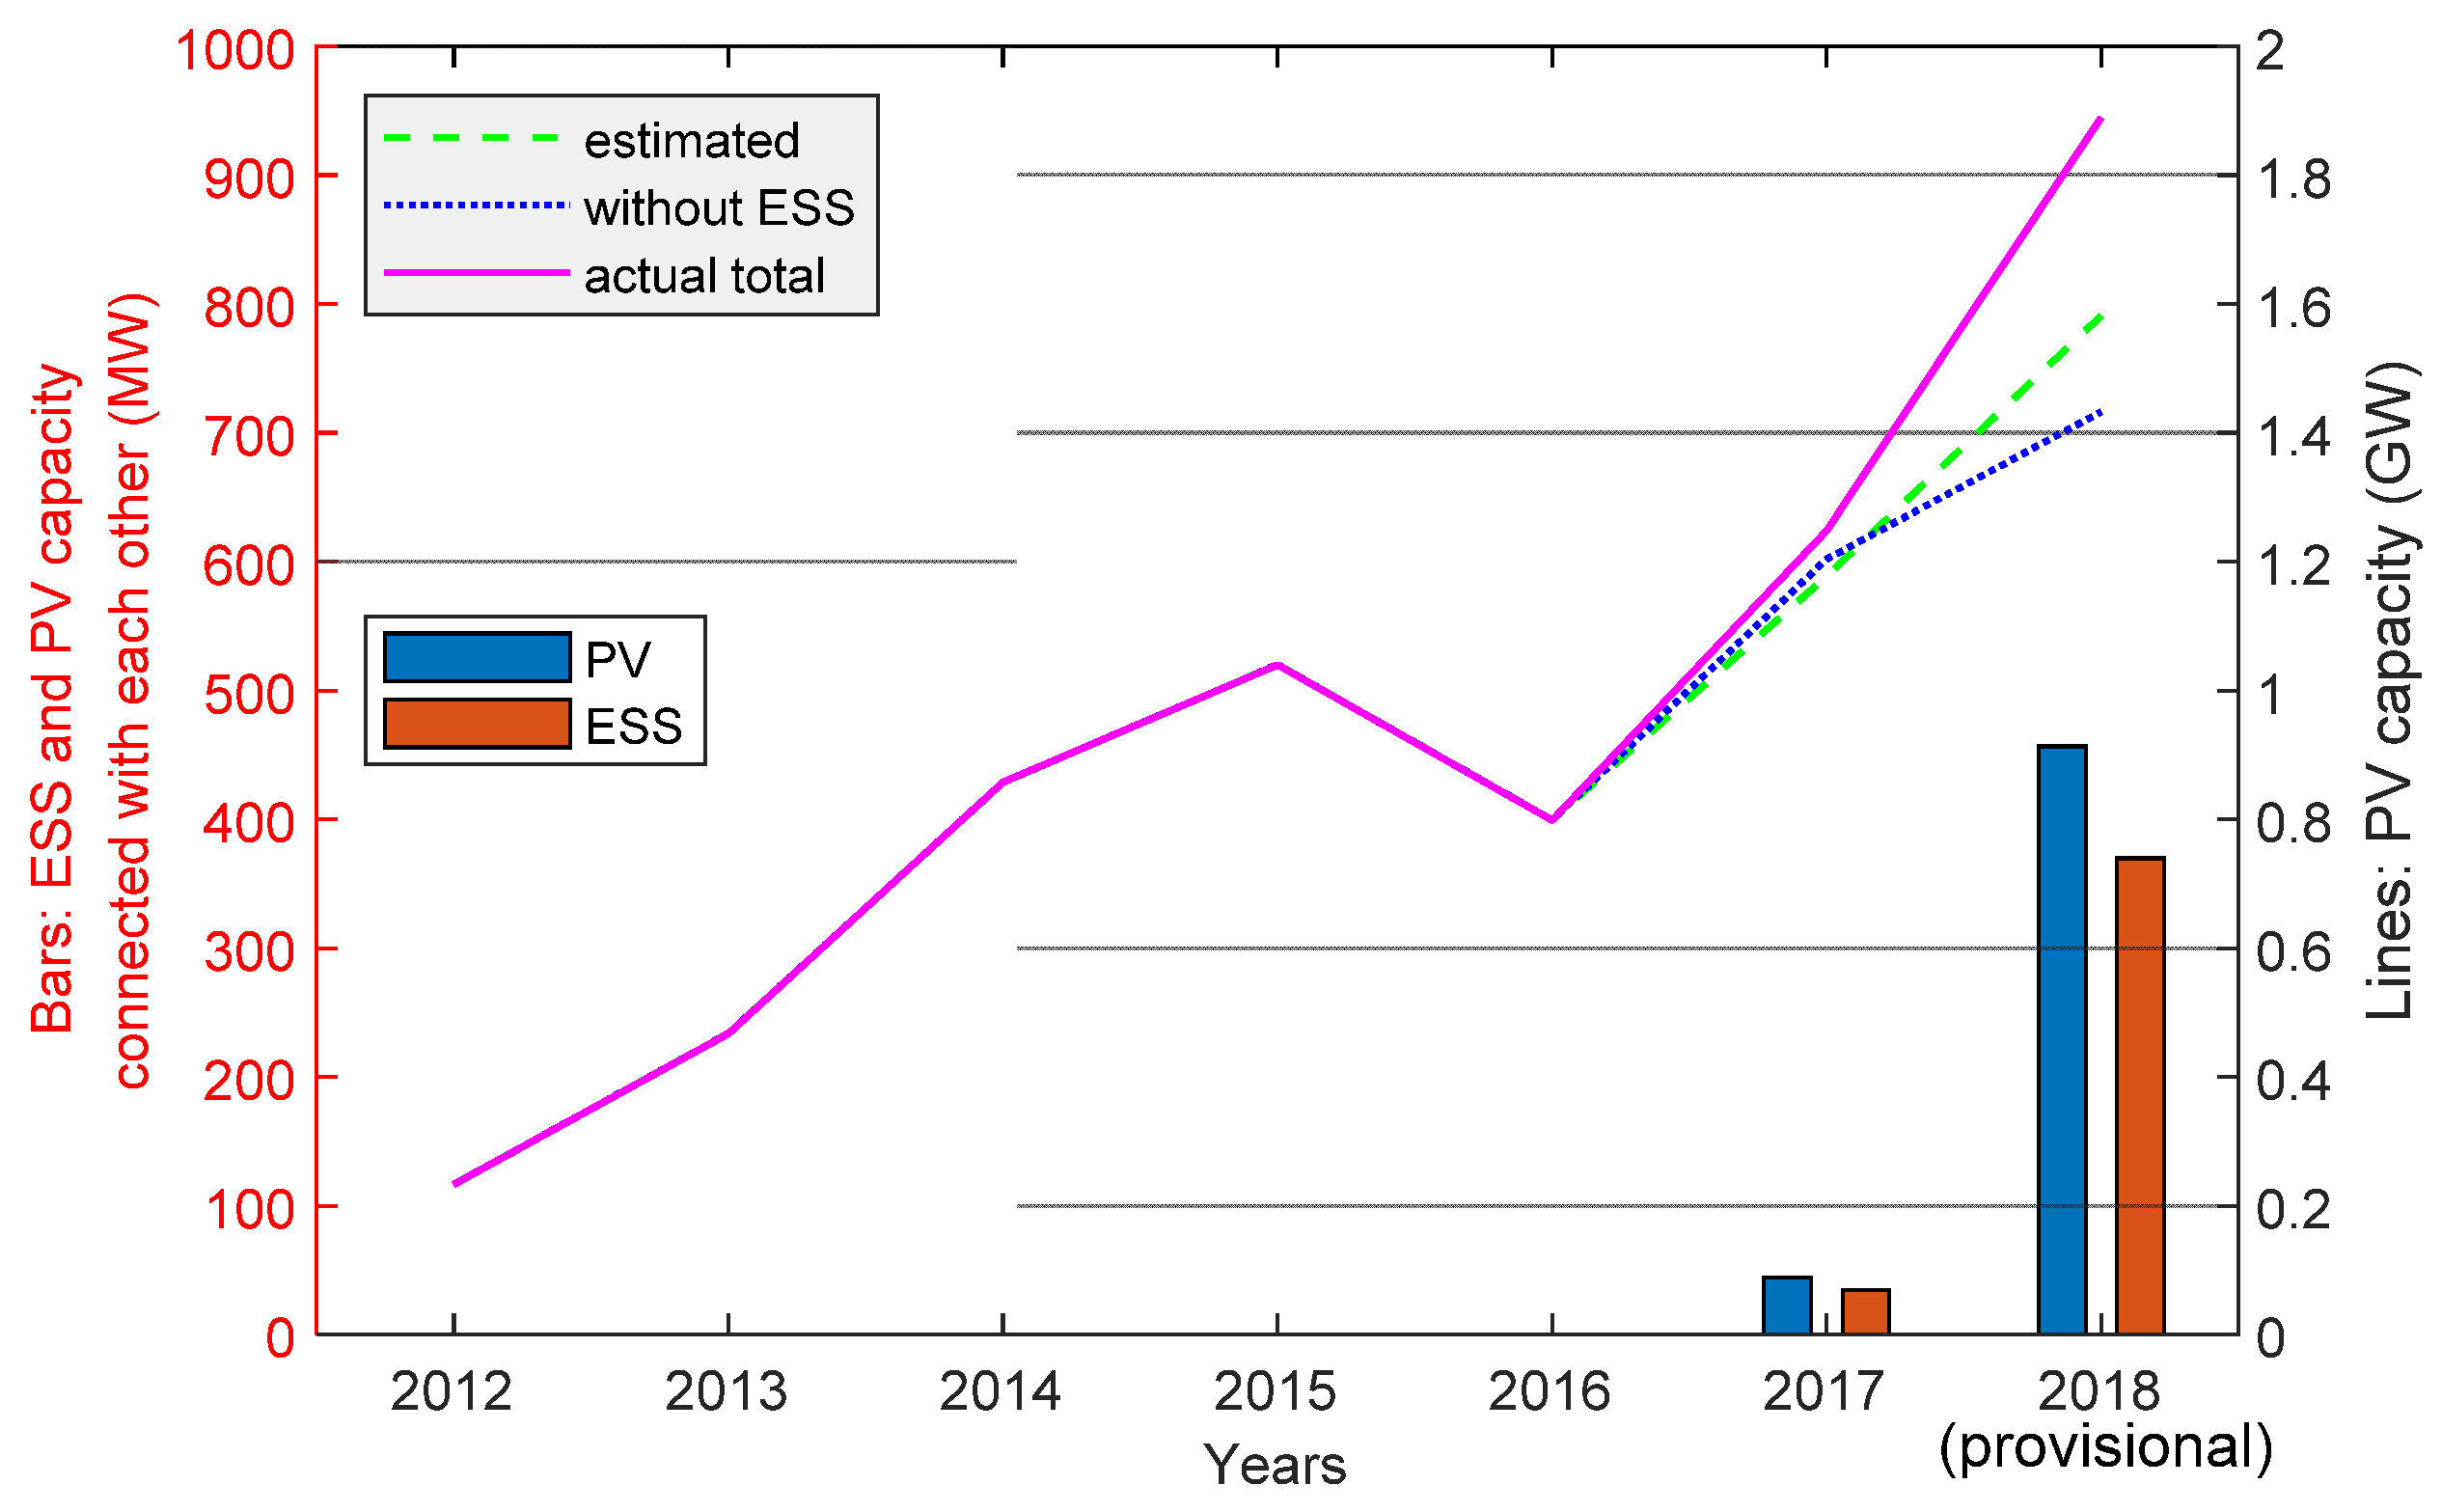
The purpose of the REC issuance policy for PV-linked ESS was to ultimately increase the grid integration of PV. Thus, we quantitatively analyzed the contribution of PV-linked ESS to the PV expansion by comparing the actual PV increase with trends from the past when there was no REC on ESS for two years of 2107 and 2018, and the results are summarized in Figure 8.
The purple line in Figure 8 represents the actual total PV installation capacity per year since 2012 when PV began to be included in the RPS system. The green broken line shows the trend toward 2017 and 2018 derived by linear regression assuming growth without considering ESS, and the blue dotted line means the real PV capacity without ESS linkage.
About 3 GW of PV was newly installed during the two years of 2017 and 2018, of which 0.5 GW, which accounts for 16.0% of the total, is linked to the total 0.4 GW and 1.3 GWh ESS. Past trends predicted that 2759 MW of PV would be installed during the same period, however, actually 379 MW more PV was installed. This indicates that the PV-linked ESS stimulated the additional momentum of PV’s growth potential, resulting in an additional growth of 13.7%: 6.0% in 2017 and 19.4% in 2018.
Meanwhile, 404 MW PV was newly installed with ESS linkage for the two years of 2017 and 2018, and this exceed the 379 MW PV, which was installed in excess of the past. This means that even PV, which seems to have been able to increase without ESS, was installed with ESS linkage, and shows that the Korean government’s policy goal of expanding PV-linked ESS and empowering PV growth engines is working. Also, the intersection of the green and blue lines between 2017 and 2018 at Figure 8 suggests that future trend of PV projects in combination with ESS will be expanded. This suggests that as the share of renewable energy increases, the linkage of ESS to variable and intermittent renewable energy will also be advanced for stable grid integration.

5. Conclusions

We have shown that the economic incentive policy for PV-linked ESS ultimately led to the increase of the PV power supply. We first summarized the RPS system in Korea and described the creation of a new profit structure for PV-linked ESS through the REC market mechanism. We mathematically modeled the revenue of PV with ESS generation and analyzed the status of PV-linked ESS in the Korean market. Based on the actual case, we evaluated the contribution of ESS to PV power in terms of improving economic feasibility and the generation shifting effect. We found that the economic feasibility of PV power generation was further increased by the ESS linkage, and the verification of the generation shifting effects identified the room for improvement of the substation and distribution facility usage rate. Finally, we confirmed that the improved profitability of PV-linked ESS has led to new investment and has seen growth to a market share of 41% over the two years since the REC policy on ESS was implemented. In addition, the ESS’s linkage to PV has given the PV power supply itself an additional 13.7% growth.
This paper provides a reference for governmental decision makers aiming to cope with climate change by means of the increase of renewable energy penetration including PV power by assessing the actual effect that policy on ESS has contributed to increasing the PV power supply. Previous studies have proven that ESS is a suitable solution for stable system integration of renewable energy. Some studies have stated the need for policy support for the ESS solution to spread PV power, and have also provided specific policy proposals. We further analyzed the effect of policy actually implemented to diffuse PV power through ESS support, and thus broadened the scope of the research for decision making regarding the dissemination of renewable energy, which requires solutions for increasing power system flexibility for integration into the system.
The results of this study provide a concrete policy methodology with an effectiveness analysis of policy promoting ESS to integrate increasing renewable energy. In particular, the study corroborates that value of PV can be improved through ESS linkage, by providing analysis of the impact of ESS on improving profitability and the generation shifting effect which relieves congestion in the distribution network. Finally, our research expands the opportunity to spread renewable energy by demonstrating the effect of policy that enabled the ESS to contribute to improving the value of PV generation via the market mechanism.

Author Contributions

Conceptualization, B.-K.J. and G.J.; Methodology, B.-K.J.; Software, B.-K.J.; Validation, B.-K.J.; Formal Analysis, B.-K.J.; Investigation, B.-K.J.; Resources, B.-K.J.; Data Curation, B.-K.J.; Writing—Original Draft Preparation, B.-K.J.; Writing—Review and Editing, B.-K.J. and G.J.; Visualization, B.-K.J.; Supervision, G.J.; Project Administration, G.J.; Funding Acquisition, G.J.

Funding

This work was supported by “Human Resources program in Energy Technology” of the Korea Institute of Energy Technology Evaluation and Planning (KETEP) granted financial resource from the Ministry of Trade, Industry & Energy, Republic of Korea (No.20174030201820) and was supported in part by the National Research Foundation of Korea through the Framework of the International Cooperation Program, under Grant 2017K1A4A3013579.

Conflicts of Interest

The authors declare no conflict of interest.

Nomenclature

γ E S S REC granted on PV-linked ESS
ω E S S Weight of REC on PV-linked ESS
E t E D Discharged energy from ESS during time ‘t’
E t E C Charged energy of ESS during time ‘t’
γ P V REC granted on PV power
ω P V Weight of REC on PV
E t P V Generated energy of PV during time ‘t’
ρ t S M P SMP at time ‘t’
ρ R E C Contracted REC price
P E Rated power of ESS in kW
S Storage capacity of ESS in kWh

Abbreviation

RECRenewable Energy Certificate
RPSRenewable Portfolio Standard
ESSEnergy Storage System
PVPhotovoltaic
GHGGreenhouse Gas
INDCIntended Nationally Determined Contributions
FITFeed-in Tariffs
GDPGross Domestic Product
PCSPower-Conditioning System
PMSPower-Management System
SMPSystem Marginal Price

References

  1. United Nations (UN). Framework Convention on Climate Change. Adoption of the Paris Agreement. Available online: https://unfccc.int/resource/docs/2015/cop21/eng/l09r01.pdf (accessed on 12 December 2015).
  2. Zhai, Y.; Mo, L.; Rawlins, M. The Impact of Nationally Determined Contributions on the Energy Sector; Asian Development Bank: Mandaluyong City, Philippines, 2018; Available online: https://www.adb.org/sites/default/files/publication/437896/sdwp-054-nationally-determined-contributions-energy.pdf (accessed on 31 July 2018).
  3. World Energy Investment 2019; International Energy Agency: Paris, France, 2019; Available online: https://www.iea.org/wei2019/ (accessed on 14 May 2019).
  4. Renewables 2019 Global Status Report; Renewable Energy Policy Network for the 21st Century (REN21): Paris, France, 2019; ISBN 978-3-9818911-7-1. Available online: https://www.ren21.net/wp-content/uploads/2019/05/gsr_2019_full_report_en.pdf (accessed on 10 May 2019).
  5. Intended Nationally Determined Contribution (INDC); United Stated of America. Available online: https://www4.unfccc.int/sites/submissions/INDC/Published%20Documents/United%20States%20of%20America/1/U.S.%20Cover%20Note%20INDC%20and%20Accompanying%20Information.pdf (accessed on 31 March 2015).
  6. Carbon Pollution Emission Guidelines for Existing Stationary Sources: Electric Utility Generating Units. Available online: https://www.federalregister.gov/documents/2015/10/23/2015-22842/carbon-pollution-emission-guidelines-for-existing-stationary-sources-electric-utility-generating (accessed on 23 October 2015).
  7. Repeal of Carbon Pollution Emission Guidelines for Existing Stationary Sources: Electric Utility Generating Units. Available online: https://www.federalregister.gov/documents/2017/10/16/2017-22349/repeal-of-carbon-pollution-emission-guidelines-for-existing-stationary-sources-electric-utility (accessed on 16 October 2017).
  8. Proposal: Affordable Clean Energy Rule. Available online: https://www.epa.gov/stationary-sources-air-pollution/proposal-affordable-clean-energy-ace-rule (accessed on 10 May 2019).
  9. Ramseur, J.L. U.S. Carbon Dioxide Emissions in the Electricity Sector: Factors, Trends, and Projections; Congressional Research Service: Washington, DC, USA, 2019. Available online: https://fas.org/sgp/crs/misc/R45453.pdf (accessed on 1 January 2019).
  10. Submission of Japan’s Intended Nationally Determined Contribution (INDC). Japan. Available online: https://www4.unfccc.int/sites/submissions/INDC/Published%20Documents/Japan/1/20150717_Japan’s%20INDC.pdf (accessed on 17 July 2015).
  11. PV Magazine. Available online: https://www.pv-magazine.com/2018/02/15/japan-to-install-up-to-7-gw-in-2018-despite-cancellation-of-14-6-gw-of-approved-capacity-report/ (accessed on 15 February 2018).
  12. PV Magazine. Available online: https://www.pv-magazine.com/2018/12/06/japan-postpones-fit-cuts-by-six-months-for-projects-over-2-mw/ (accessed on 6 December 2018).
  13. PV Magazine. Available online: https://www.pv-magazine.com/2018/10/09/japan-to-add-17-gw-of-new-solar-by-the-end-of-2020-fitch/ (accessed on 9 October 2018).
  14. Intended Nationally Determined Contribution (INDC); China. Available online: https://www4.unfccc.int/sites/submissions/INDC/Published%20Documents/China/1/China’s%20INDC%20-%20on%2030%20June%202015.pdf (accessed on 30 June 2015).
  15. Explore the World’s Greenhouse Gas Emissions. Available online: https://www.wri.org/blog/2017/04/interactive-chart-explains-worlds-top-10-emitters-and-how-theyve-changed (accessed on 11 April 2017).
  16. World Energy Market Insight (19-23); Korea Energy Economics Institute: Ulsan, Korea, 2019; Available online: http://www.keei.re.kr/keei/download/WEMI1923.pdf (accessed on 1 July 2019).
  17. Intended Nationally Determined Contribution (INDC). Korea. Available online: http://www4.unfccc.int/Submissions/INDC/Published%20Documents/Republic%20of%20Korea/1/INDC%20Submission%20by%20the%20Republic%20of%20Korea%20on%20June%2030.pdf (accessed on 30 June 2015).
  18. Global Green Growth Institute. Available online: http://gggi.org/site/assets/uploads/2018/10/Presentation-by-Mr.-Kyung-ho-Lee-Director-of-the-New-and-Renewable-Energy-Policy-Division-MOTIE.pdf (accessed on 5 November 2018).
  19. Cornot-Grandolphe, S. South Korea’s New Electricity Plan: Cosmetic Changes or a Breakthrough for the Climate? Institut Francais des Relations Internationales (ifri): Paris, France, 2018; Available online: https://www.ifri.org/en/publications/editoriaux-de-lifri/edito-energie/south-koreas-new-electricity-plan-cosmetic-changes-or (accessed on 28 February 2018).
  20. Kato, T.; Suzuoki, Y. Large-Scale Penetration Impact of Photovoltaic Power Generation System on Utility Power Plants. In Proceedings of the 2009 Transmission & Distribution Conference & Exposition: Asia and Pacific, Seoul, Korea, 26–30 October 2009. [Google Scholar] [CrossRef]
  21. Denholm, P.; Ela, E.; Kirby, B.; Milligan, M. The Role of Energy Storage with Renewable Electricity Generation; National Renewable Energy Laboratory: Golden, CO, USA, 2010. Available online: https://www.nrel.gov/docs/fy10osti/47187.pdf (accessed on January 2010).
  22. Shivashankar, S.; Mekhilef, S.; Mokhlis, H.; Karimi, M. Mitigating methods of power fluctuation of photovoltaic (PV) sources—A review. Renew. Sustain. Energy Rev. 2016, 59, 1170–1184. [Google Scholar] [CrossRef]
  23. Zahedi, A. Maximizing solar PV energy penetration using energy storage technology. Renew. Sustain. Energy Rev. 2011, 15, 866–870. [Google Scholar] [CrossRef]
  24. What the Duck Curve Tells Us about Managing a Green Grid; California ISO: Folsom, CA, USA, 2016; Available online: https://www.caiso.com/Documents/FlexibleResourcesHelpRenewables_FastFacts.pdf (accessed on 10 August 2019).
  25. Denholm, P.; O’Connell, M.; Brinkman, G.; Jorgenson, J. Overgeneration from Solar Energy in California: A Field Guide to the Duck Chart; National Renewable Energy Laboratory: Golden, CO, USA, 2015. Available online: https://www.nrel.gov/docs/fy16osti/65023.pdf (accessed on 18 November 2015).
  26. Sovacool, B.K. The intermittency of wind, solar, and renewable electricity generators: Technical barrier or rhetorical excuse? Util. Policy 2009, 17, 288–296. [Google Scholar] [CrossRef]
  27. Jain, P. Energy Storage in Grids with High Penetration of Variable Generation; Asian Development Bank: Mandaluyong City, Philippines, 2017; Available online: https://www.adb.org/sites/default/files/publication/225731/energy-storage-grids.pdf (accessed on 28 February 2017).
  28. Ulbig, A.; Borsche, T.S.; Andersson, G. Impact of Low Rotational Inertia on Power System Stability and Operation. IFAC Proc. 2014, 47, 7290–7297. [Google Scholar] [CrossRef] [Green Version]
  29. Moosavian, S.M.; Rahim, N.A.; Selvaraj, J.; Solangi, K.H. Energy policy to promote photovoltaic generation. Renew. Sustain. Energy Rev. 2013, 25, 44–58. [Google Scholar] [CrossRef]
  30. Mueller, S.; Vithayasrichareon, P. Getting Wind and Sun onto the Grid; International Energy Agency (IEA): Paris, France, 2017; Available online: https://www.iea.org/publications/insights/insightpublications/Getting_Wind_and_Sun.pdf (accessed on 16 March 2017).
  31. Denholm, P.; Margolis, R. Energy Storage Requirements for Achieving 50% Solar Photovoltaic Energy Penetration in California; National Renewable Energy Laboratory: Golden, CO, USA, 2016. Available online: https://www.nrel.gov/docs/fy16osti/66595.pdf (accessed on 12 August 2016).
  32. Dvorkin, Y.; Fernandez-Blanco, R.; Kirschen, D.S.; Pandzic, H.; Watson, J.; Silva-Monroy, C.A. Ensuring Profitability of Energy Storage. IEEE Trans. Power Syst. 2017, 32, 611–623. [Google Scholar] [CrossRef]
  33. Hill, C.A.; Such, M.C.; Chen, D.; Gonzalez, J.; Grady, W.M. Battery Energy Storage for Enabling Integration of Distributed Solar Power Generation. IEEE Trans. Smart Grid 2012, 3. [Google Scholar] [CrossRef]
  34. Rudolf, T.; Papastergiou, K.D. Financial analysis of utility scale photovoltaic plants with battery energy storage. Energy Policy 2013, 63, 139–146. [Google Scholar] [CrossRef]
  35. Denholm, P.; Margolis, R.M. Evaluating the limits of solar photovoltaics (PV) in electric power systems utilizing energy storage and other enabling technologies. Energy Policy 2007, 35, 4424–4433. [Google Scholar] [CrossRef]
  36. Moore, J.; Shabani, B. A Critical Study of Stationary Energy Storage Policies in Australia in an International Context: The Role of Hydrogen and Battery Technologies. Energies 2016, 9, 674. [Google Scholar] [CrossRef]
  37. Norwood, Z.; Goop, J.; Odenberger, M. The Future of the European Electricity Grid Is Bright: Cost Minimizing Optimization Shows Solar with Storage as Dominant Technologies to Meet European Emissions Targets to 2050. Energies 2017, 10, 2080. [Google Scholar] [CrossRef]
  38. Beaudin, M.; Zareipour, H.; Schellenberglabe, A.; Rosehart, W. Energy storage for mitigating the variability of renewable electricity sources: An updated review. Energy Sustain. Dev. 2010, 14, 302–314. [Google Scholar] [CrossRef]
  39. Zsiborács, H.; Baranyai, N.H.; Vincze, A.; Zentkó, L.; Birkner, Z.; Máté, K.; Pintér, G. Intermittent Renewable Energy Sources: The Role of Energy Storage in the European Power System of 2040. Electronics 2019, 8, 729. [Google Scholar] [CrossRef]
  40. Eyer, J. Electric Utility Transmission and Distribution Upgrade Deferral Benefits from Modular Electricity Storage; Sandia National Laboratories: Albuquerque, NM, USA, 2009. Available online: https://prod-ng.sandia.gov/techlib-noauth/access-control.cgi/2009/094070.pdf (accessed on 30 June 2009).
  41. Jo, B.; Jung, S.; Jang, G. Feasibility Analysis of Behind-the-Meter Energy Storage System According to Public Policy on an Electricity Charge Discount Program. Sustainability 2019, 11, 186. [Google Scholar] [CrossRef]
  42. Holt, E.; Olinsky-Paul, T. Does Energy Storage Fit in an RPS? Clean Energy States Alliance: Montpelier, VT, USA, 2014; Available online: https://www.cesa.org/assets/2014-Files/CESA-Energy-Storage-and-RPS-Holt-June2014.pdf (accessed on 30 June 2014).
  43. Renewable Portfolio Standards (RPS). Available online: http://www.energy.or.kr/renew_eng/new/standards.aspx (accessed on 9 August 2019).
  44. Johnston, V. Storage Portfolio Standards: Incentivising Green Eenrgy Storage. J. Environ. Sustain. Law 2014, 20. Available online: http://scholarship.law.missouri.edu/jesl/vol20/iss2/3 (accessed on 16 June 2015).
  45. Analysis of Solar Photovoltaic and Wind Power Utilization Rate and Generation Cost by Region. Korea Power Exchange: 625, Bitgaram-ro, Naju-si, Jeollanam-do, Republic of Korea. 2018. Available online: https://onerec.kmos.kr/mobile/downloadBbsFile.do?atchmnflNo=22012 (accessed on 31 December 2018).
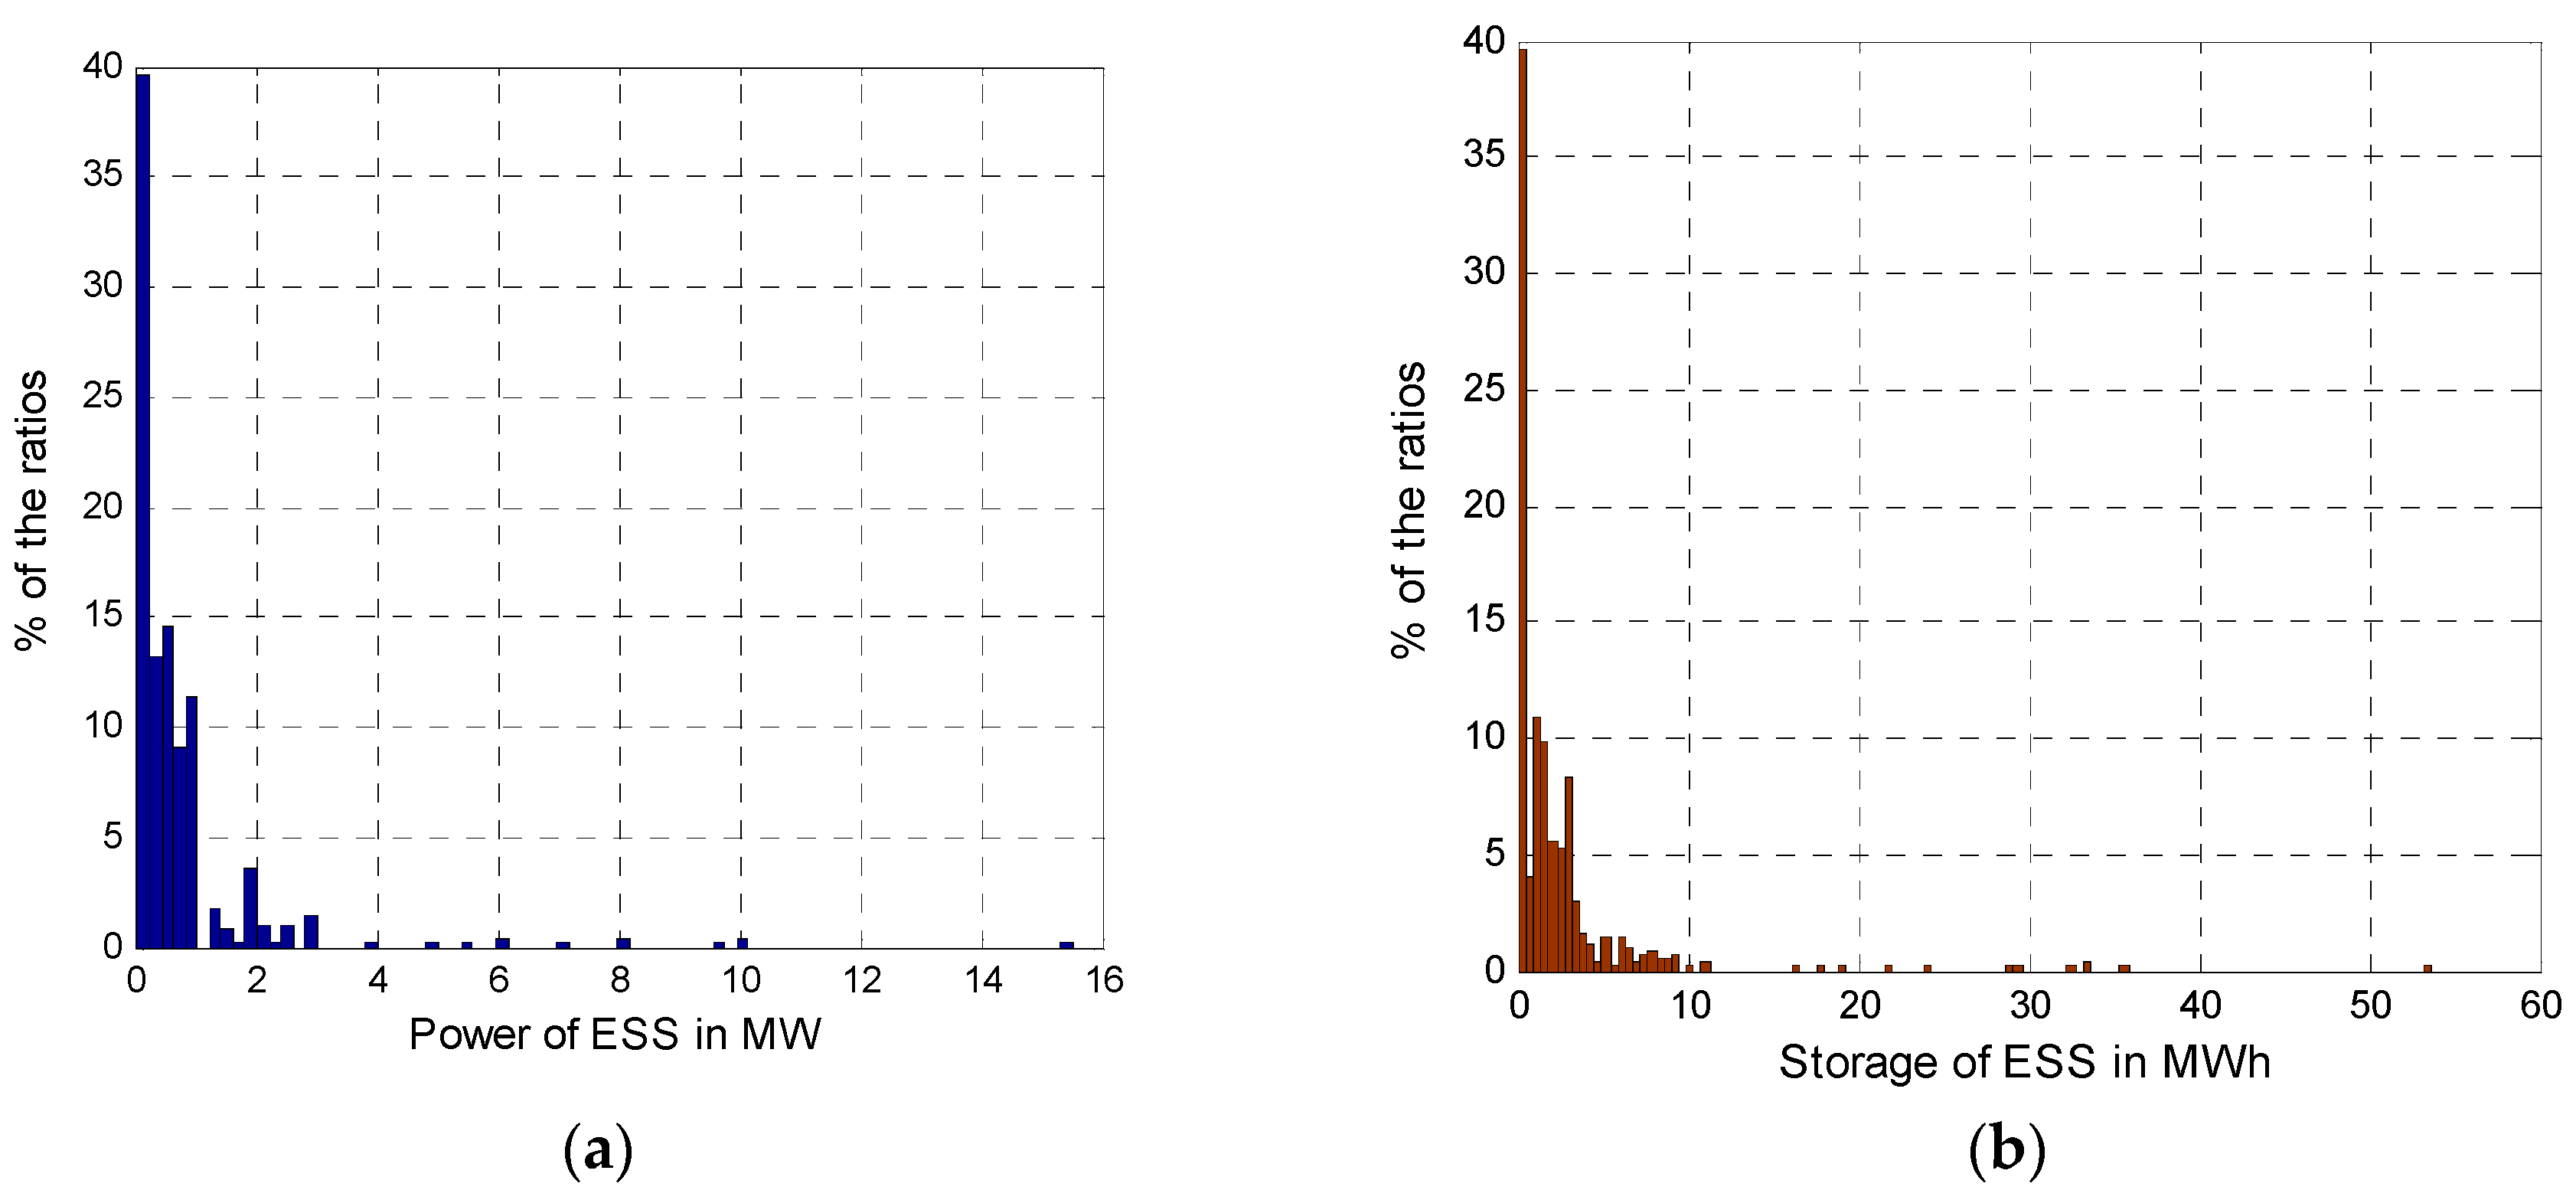
Figure 1. Distribution of PV-linked ESS’s capacity in (a) kW and (b) kWh.
Sustainability 11 04337 g001
Figure 2. (a) Scatterplot of PV-linked ESS in energy storage and power, and (b) distribution of ratios.
Sustainability 11 04337 g002
Figure 3. Distribution of ESS and PV’s capacity ratio: (a) kw/kw, (b) kwh/kw.
Sustainability 11 04337 g003
Figure 4. (a) Daily patterns of PV generation, (b) distribution of PV generation.
Sustainability 11 04337 g004
Figure 5. (a) Daily patterns of PV generation with ESS, (b) distribution of PV generation with ESS.
Sustainability 11 04337 g005
Figure 6. Annual ESS installation capacity in (a) MW and (b) MWh.
Sustainability 11 04337 g006
Figure 7. Annual ESS market share in (a) MW market and (b) MWh market.
Sustainability 11 04337 g007
Figure 8. Annual PV and ESS capacity.
Sustainability 11 04337 g008
Table 1. Renewable Energy Certificate (REC) weights on photovoltaic (PV)-linked energy storage systems (ESS).
Announced DateREC WeightApplicable Period 1
19 September 20165.02016, 2017
29 June 20185.02018, 2019
4.02020
1 The ESS installed during the applicable period will continue to have corresponding REC weight.
Table 2. Specifications of ESS and PV.
Rated power (PV)600 kW
Battery typeLithium-ion
Rated power (ESS)600 kW
Storage capacity1800 kWh
Round-trip efficiency89%
Depth of discharge80%
Maintenance cost0.2% of capital cost, annually
Table 3. Contract conditions for SMP and REC sales.
Contract term of PV20 years
Contract term of ESS15 years
SMP base price (USD)69.57
Upper limit price of SMP + one REC162.25
REC weight for PV1.0
REC weight for PV-linked ESS5.0
Table 4. Results of economic feasibility calculation for PV generation.
Initial CostPayback YearsB/C RatioIRR (%)NPV (USD)
Without ESS1,043,4789.151.395.65516,284
With ESS2,139,1307.451.569.281,513,093