Article

Forage Fish as Food: Consumer Perceptions on Baltic Herring

1
Faculty of Management and Business, University of Tampere, FI-33014 Tampere, Finland
2
Marine Risk Governance Research Group, Ecosystems and Environment Research Programme, Faculty of Biological and Environmental Sciences, University of Helsinki, P.O. Box 65, FI-00014 Helsinki, Finland
3
Department of Public Health Solutions, National Institute for Health and Welfare, P.O. Box 95, FI-70701 Kuopio, Finland
*
Author to whom correspondence should be addressed.
Sustainability 2019, 11(16), 4298; https://doi.org/10.3390/su11164298
Submission received: 12 June 2019 / Revised: 31 July 2019 / Accepted: 5 August 2019 / Published: 8 August 2019
(This article belongs to the Section Sustainable Agriculture)

Abstract

:
Using fish resources for food supply in a sustainable and efficient way requires an examination of the feasibility of prioritising the use of forage species. The present paper deals with the issue from the consumer perspective. Using Baltic herring as a case study, the role of sociodemographic determinants, the drivers and barriers of Baltic herring consumption are investigated in four Baltic Sea countries, based on an internet survey. The drivers and barriers of Baltic herring consumption are compared to those relating to Baltic salmon, to identify the main differences in consumer perceptions on species that are primarily used as feed and food. The present paper concludes that prioritising forage species primarily for human consumption calls for proactive catch use governance, which (1) acknowledges the species- and country-specific intricacies of forage fish consumption, (2) improves the availability of safe-to-eat fish on the market, and (3) provides consumers with sufficient information on the species (e.g., the type of herring and its origin), the sustainability of the fisheries, and the related health risks and benefits.

1. Introduction

Ensuring the nutrition of the growing world population in a sustainable and climate-friendly way is one of the greatest challenges in the 21st century [1,2]. Fish, a rich source of protein and beneficial fatty acids, minerals, and vitamins, is viewed as an important part of a sustainable diet and a possible substitute for livestock meat [3,4,5]. However, using fish resources for food supply in a sustainable and efficient way, involves their prioritisation for human consumption [6,7,8]. This calls for systematic catch use governance [9,10,11].
To date, the use of different fish species for human consumption (versus industrial uses, e.g., feed) has been largely determined by demand and supply [12,13]. As a result, some species are fully utilized, and others, especially small pelagic fish, are underutilized as food [8,14]. In the Baltic Sea region, the case study area of this paper, the consumer demand for Baltic salmon and cod is high, but the supply is limited by the poor state of the stocks [15,16]. This market niche is largely filled by imported and farmed fish [17]. In contrast, herring is one of the most abundant fish species in the Baltic Sea, but the consumer demand is low and the majority of the catch, (3650 t in 2017) is used to feed fur animals and farmed fish [16,18]. For example, only around 3% of the Finnish Baltic herring catch is used as domestic food [19].
Stakeholders across the fisheries, public health, and environmental sectors have a common interest in prioritising the use of Baltic herring for human consumption [11,20]. The producer price of Baltic herring sold for human consumption is higher than that of fish sold for feed [21]. A shift from feed- to food-directed fishing is also expected to create new jobs, e.g., by increasing the degree of processing [11,14,22]. Thus, increasing the consumption of Baltic herring would support the livelihoods dependent on the Baltic herring fishery and thereby the viability of coastal communities. From the public health perspective, the consumption of Baltic herring is beneficial, as it is a good source of omega-3 fatty acids and vitamin D, thus helping, e.g., to decrease the risk of cardiovascular diseases [23,24]. Furthermore, using local herring resources for food is a more environmentally sustainable option, compared to imported or farmed fish [25,26].
However, prioritising the use of Baltic herring for human consumption is challenging as structural and institutional barriers limit its availability for human consumption. Owing to the apparent low consumer demand, the current fisheries and public health policies and practices advocate for the reduction of the fish to fishmeal [11]. This practice contributes to food supply indirectly and is also supported by the stakeholders, who find it more acceptable than using the fish to feed fur animals [20]. Thus, due to the increased demand for Baltic herring in aquaculture, the fishers may not be willing to invest in the structural changes needed to shift from feed- to food-directed fishing without increased consumer demand [11,22]. In addition, the practice of using Baltic herring as feed in aquaculture is reinforced by a dioxin problem and the related food safety policies. Since 2001, the European Commission has restricted the use of large Baltic herring from certain parts of the sea for human consumption in the EU countries due to high dioxin levels [27,28]. The dioxins can be removed during the fishmeal production process and therefore the problem does not prevent the use of the fish in aquaculture. This implies that a proactive catch use governance is needed to increase the contribution of Baltic herring to food supply.
Recent studies have addressed the contribution potential of Baltic herring to food supply from the perspectives of the governance system, relevant stakeholder groups and key policy sectors [11,29,30]. These studies call for collaboration between the fisheries sector and the public health sector to jointly develop policies that address food security and safety issues at different governance levels. In addition, multiple governance actions to increase the use of Baltic herring for human consumption have been identified [11]. However, designing strategies and policies for the use of a fish resource also necessitates an understanding of the associated consumer perceptions, which is the premise of this study. Several studies have focused on the contribution potential of forage fisheries to food security [10,14,31,32,33] and on fish consumption attitudes in general [34,35,36,37]. Yet, consumer perceptions towards the consumption of healthy, abundant, and sustainably fished forage species that, like Baltic herring, are often underutilized as food, have not been explored. Although the low demand for Baltic herring is often explained by the consumers’ preference towards farmed salmonids [19,23], the role of other factors, including the dioxin problem and availability of the fish, is more uncertain.
Using Baltic herring as a case study, this paper explores the consumption of forage fish from the consumer perspective and discusses the implications of the results to catch use governance. More specifically, the results of an internet-based survey, which was conducted in four Baltic Sea countries (Denmark, Estonia, Finland and Sweden) in 2016, are examined. The main research questions are: (1) how sociodemographic determinants explain Baltic herring consumption, and (2) what are the drivers (enablers) and barriers (restrictions) of Baltic herring consumption? The examined drivers and barriers included in the survey were identified based on the literature [34,35,36,37,38,39] and the authors’ own research [40,41].
In this paper, drivers and barriers for the consumption of Baltic herring are compared to those relating to Baltic salmon, to examine the main differences in consumer perceptions towards underutilized and fully utilized species. A comparative analysis provides an interesting point of departure for three reasons. First, herring and salmon are among the most important fish species in the Baltic Sea: herring, in terms of catch volume [16], and salmon, as the “king of fishes” [41,42]. Second, both species are caught by the countries of this case study, albeit in different quantities: Finland and Sweden land over half of the total Baltic herring and salmon catches [15,16,18]. Third, the two species share the dioxin problem, but still, the whole Baltic salmon catch is used for human consumption.
The following section provides a short background on cultural differences in fish consumption and the management of the dioxin problem between the surveyed countries. The survey material and its analysis are described in Section 3. The results are presented in Section 4 and discussed in Section 5 from the perspectives of country-specific intricacies, drivers and barriers, and the implications of the results for catch use governance. The conclusions are provided in Section 6.

2. Baltic Herring and the Surveyed Countries

Fish consumption is a social phenomenon, which depends on its broader environment [43], and therefore fish consumption traditions vary between the countries of this case study. Denmark, Estonia, Finland, and Sweden (the surveyed countries) land together circa 70% of the total Baltic herring catch [16,18], but the use of the catch as domestic food is low [21,23,44,45] (Table 1). For example, in Finland, the per capita consumption is only 0.3 kg per year [22]. In Estonia, where fish consumption is the lowest, compared to the other countries surveyed, due to lower purchasing power, cheap species such as Baltic herring are most commonly consumed [46,47,48]. Despite this, the supply of food-directed Baltic herring exceeds the Estonian demand, and therefore, the majority of the herring catch is exported [45]. Fish consumption in Denmark, Finland and Sweden depends more on imported and farmed species [21,49,50], although in Denmark, the consumption of North Sea herring, their most important catch species, is also common [49]. These indicate that the domestic consumption of Baltic herring could be increased in all of the four countries in a sustainable way by using a larger share of the catch for domestic consumption.
The use of Baltic herring for human consumption could also be increased from the food safety perspective. Currently, all sizes of Baltic herring from the Western and Southern Baltic Proper are considered safe-to-eat, and only large over 21 cm herring from the Gulf of Riga and over 17 cm herring from other sea areas are suspected to exceed the maximum allowable dioxin levels [28]. The surveyed countries have adopted different strategies for dealing with dioxin regulation. In Denmark and Estonia, only safe-to-eat herring is placed on the food market. The Estonian herring fishery targets small (under 17 cm) Baltic herring [51,52], and the Danish fishery lands Baltic herring for human consumption only from a limited area [44]. In Finland and Sweden, large herring from the Bothnian Sea and the Northern Baltic Proper, where the dioxin levels are the highest, is traditionally used as food. These two countries have therefore applied for an exemption to place herring that does not meet the food safety criteria on their domestic markets. In these two countries, consumers are advised to limit the consumption of Baltic herring to a level that is considered safe [53,54], but in practice, the average consumption is far below it. In Sweden, the national health authority has found that people are not very familiar with the eating recommendations, despite the information campaigns [23]. This indicates that the dioxin problem is not the main reason restricting the consumption of Baltic herring.

3. Material and Methods

The data used were from an internet-based survey [55,56] that was conducted at the end of 2016. The survey focused on consumers’ eating habits relating to Baltic herring and salmon in the four Baltic Sea countries: Denmark, Estonia, Finland and Sweden. The questionnaire (Supplementary Materials S1) was designed, and the results were analysed by the authors, but the survey was administered by a professional market research company, called Taloustutkimus Oy, which established an internet panel in 1997. The survey company recruited over 500 consumers from each country (total 2117) to respond to the survey questionnaire, which is above the required sample size for generalising the results for each surveyed country (with a 95% confidence level and 5% margin of error) [56]. The survey targeted the adult population, i.e., 18 years or older.
The survey questionnaire comprised 32 questions, including sociodemographic questions and questions relating to fish consumption, in general, and to Baltic herring and salmon in particular. The questionnaire was translated into the national language of the countries surveyed (Finnish, Swedish, Estonian and Danish). The country and gender of the respondents were provided directly by the internet panel and were not included in the questionnaire.
Only those respondents who reported their general fish consumption were asked follow-up questions about their Baltic herring and salmon consumption and were included in the analysis presented in this paper. As the survey focused specifically on the consumption of herring and salmon originating from the Baltic Sea, a distinction had to be made in the questionnaire between Baltic herring and herring originating from elsewhere, e.g., the North Sea or North Atlantic, as well as between the salmonids (Baltic and Norwegian salmon, farmed salmon, and rainbow trout). Regarding herring consumption, the respondents that reported eating one type of herring were asked explicitly whether they consume Baltic herring. Concerning Baltic salmon, the respondents were asked to indicate which salmonids they consumed from a list. In addition to the analysis presented in this paper, the survey was conducted for the purpose of a risk–benefit analysis [57], and therefore only part of the survey results is included in the present paper.
The data analysis was conducted using the R-program (version 3.5.1, http://cran.r-project.org). As the survey was conducted using an internet panel, rather than a random sample from the general population, the respondents were not fully representative of the actual population distributions of the countries (Table 2). Therefore, the respondents were weighted based on the actual ages, genders, and region distributions of each country to produce representative population results. For the purpose of the analysis, the respondents were divided into two age groups: below and above 45 years. This division was determined in reference to the Finnish and Swedish national health authorities’ recommendations for risk groups relating to the limitation of Baltic herring consumption, which are, in their strictest form, targeted at children and women at the fertile age. As for purchasing power, qualitative categories were used instead of quantitative ones to facilitate a comparison of the countries.
The analysis comprised four main parts. First, descriptive statistics, namely, frequency analysis and cross-tabulation, were used to determine the share of the fish consumers that consume Baltic herring. The data for the analysis was drawn from three questions (Q) relating to whether the respondents eat, at least sometimes, (a) fish (Q7), (b) some type of herring (Q20), and (c) Baltic herring (Q21).
Second, logistic regression analysis was conducted to examine whether Baltic herring consumption can be predicted based on certain sociodemographic features (age, gender, country, education and purchasing power, Q2–Q4). The analysis compared the sociodemographic features of those who reported Baltic herring consumption (Q21) with the rest of the respondents. A regression analysis was conducted for the whole sample to determine the differences between the surveyed countries, specifically to determine the impact of the other sociodemographic factors in each country.
Third, the drivers and barriers of Baltic herring consumption were explored by asking the respondents to select up to three most important reasons for eating (Q27) or not eating (Q28) Baltic herring. The reasons related to taste, affordability, healthiness (vs risks), habit, cooking, traditions, environmental friendliness, and the way in which the fish were caught. Descriptive statistics were used to analyse the data. However, only those who reported that they eat some type of herring, but not Baltic herring (Q21), were directed to respond to the question on the reasons for not eating (Q28). Thus, the results do not include the perceptions of those who do not eat any type of herring. The rationale behind this was that unravelling the factors constraining specifically Baltic herring consumption, including, for example, the dioxin problem, requires that the analysis focuses exclusively on Baltic herring. This resulted in a low number of responses among the Danes and Estonians, and therefore, these two countries were omitted from this analysis. In addition, a logistic regression analysis was conducted to explore whether people from some of the surveyed countries were more likely to eat Baltic herring because of one of the four most common reasons (“it tastes good”, “it is healthy”, “it is inexpensive, or it is easy to cook”). Other reasons were not considered, because the responses were too few.
Fourth, factors affecting Baltic herring and salmon consumption were compared by analysing responses relating to whether the respondents eat salmonids (Q10), and specifically Baltic salmon (Q11), and the three most important reasons for eating or not eating Baltic salmon (Q17–Q18). Descriptive statistics were used to analyse the data. The results were compared to those relating to herring. In addition, a comparative analysis on how changes in certain determinants would influence the consumption of (a) Baltic herring (Q29) and (b) Baltic salmon (Q19) was conducted. The respondents to this question comprised those who reported that they eat Baltic herring and salmon, respectively. The reasons related to changes in price, availability, the state of the stocks, the chemicals in the fish, authorities’ recommendations, the availability of ready meals, cooking suggestions, and information on the products. Seven ordered response levels were used in the questionnaire, but for the analysis, the three levels on both sides of the neutral response were combined to simply indicate either an increase or decrease. The responses from the four countries were combined to focus the analysis on the comparison between the two species.

4. Results

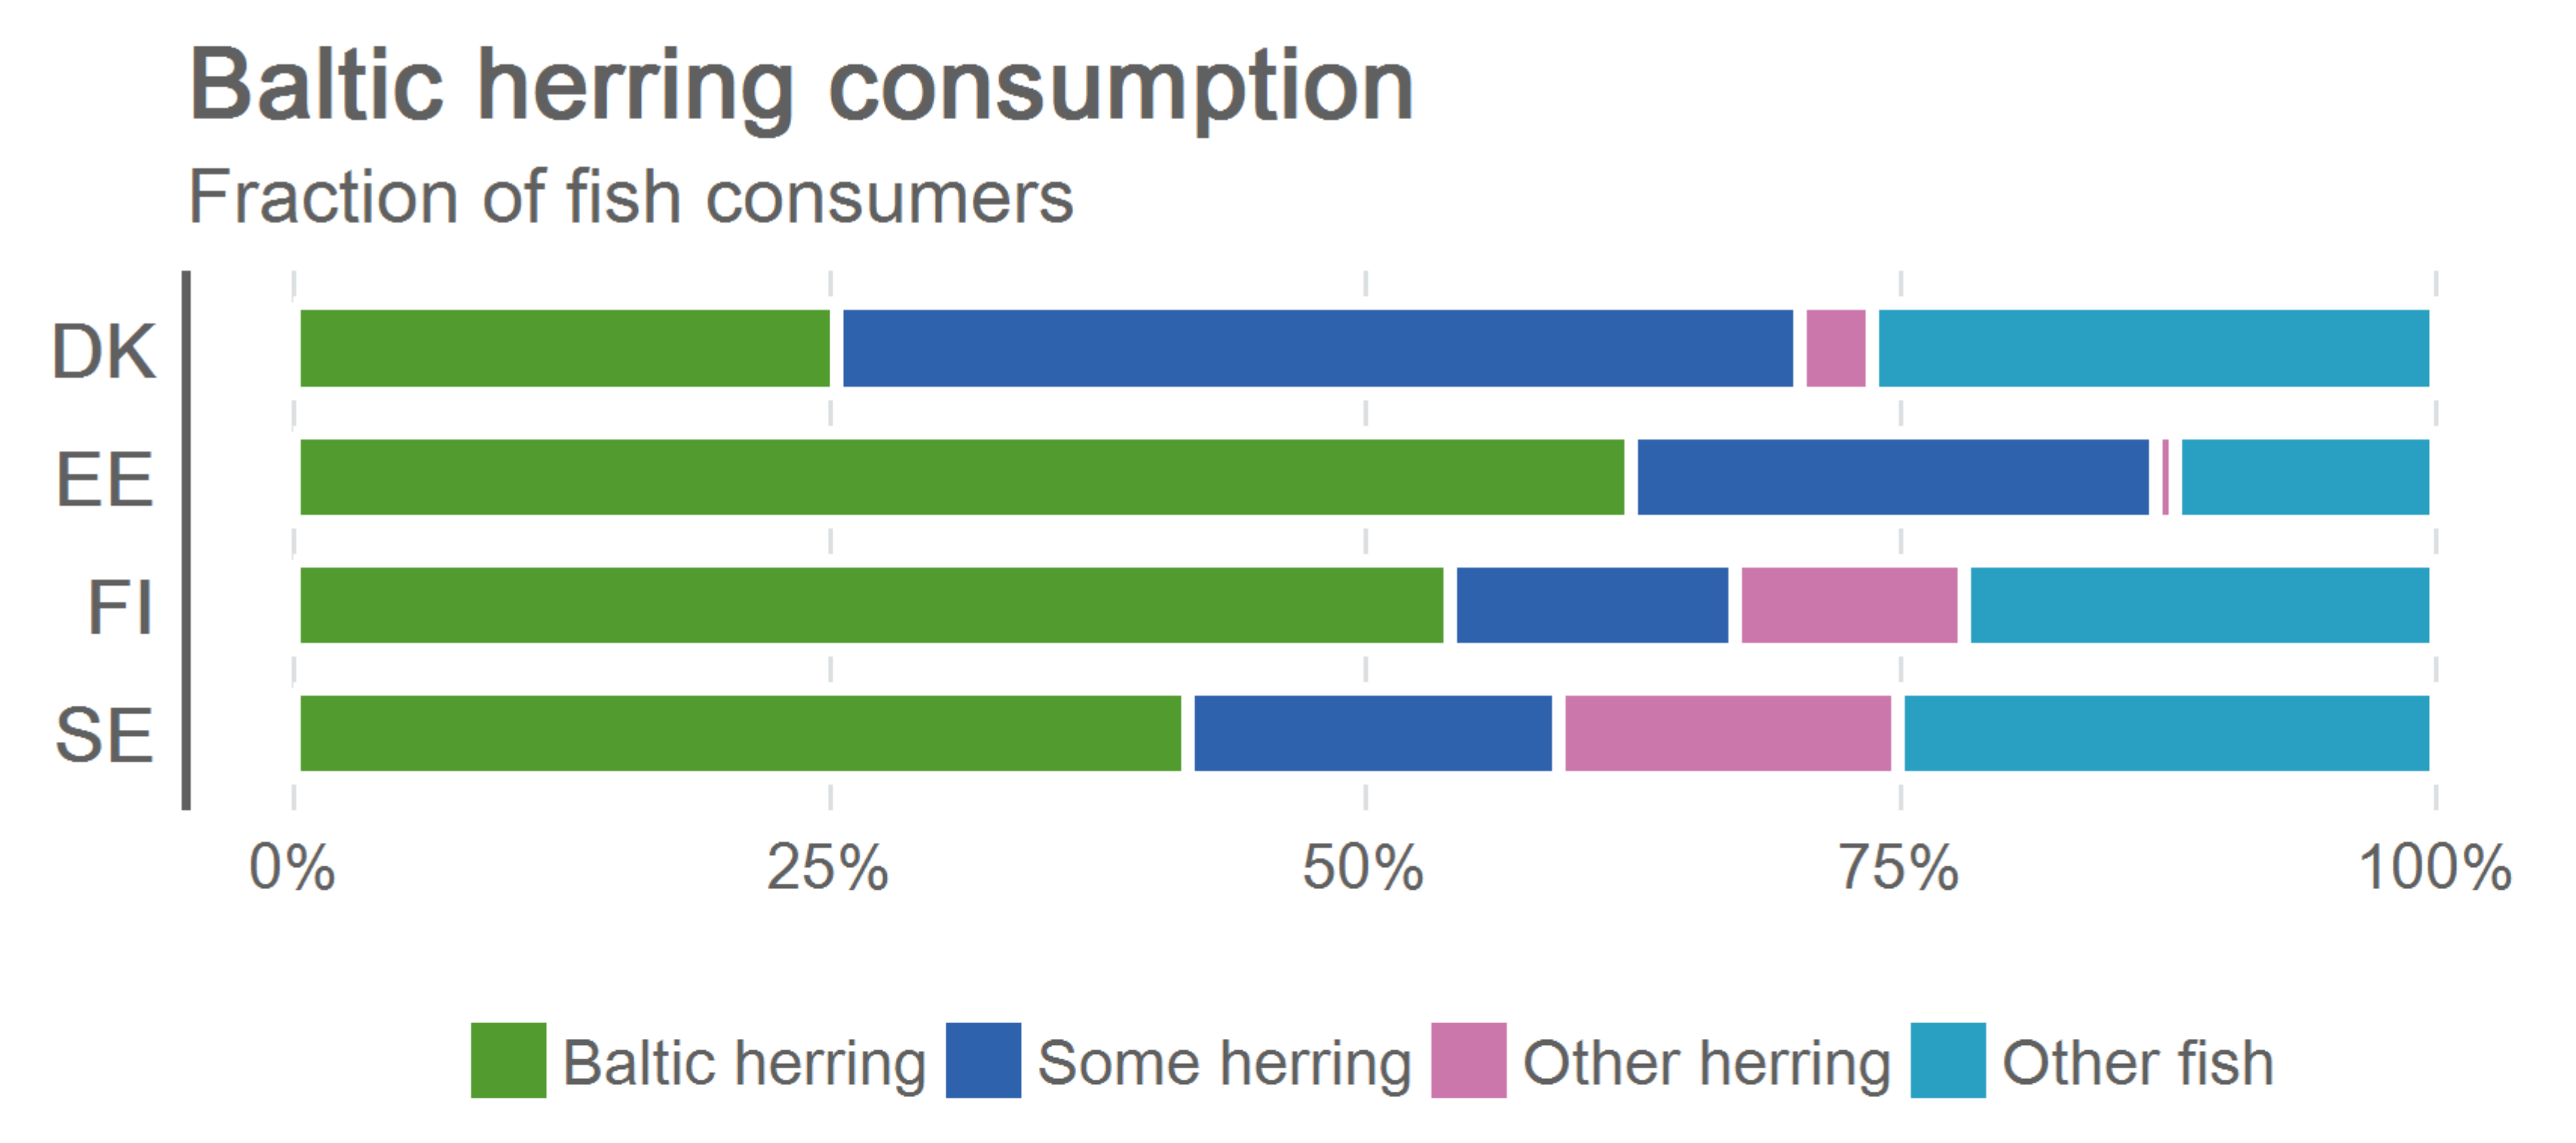
4.1. Baltic Herring Consumption in the Surveyed Countries

The majority of the population in all of the four countries consumed fish in general (Denmark 91%, Estonia 96%, Finland 90%, and Sweden 93%). The share of fish consumers in the surveyed countries who ate Baltic herring at least sometimes are shown in Figure 1. The share of the population that ate Baltic herring at least sometimes was the largest in Estonia (62%) and Finland (54%), and the smallest in Sweden (42%) and Denmark (25%). However, 45% of the Danish and 24% of the Estonian fish consumers did not know the origin of the herring they eat. In Sweden and Finland, the ignorance relating to where the herring that they eat comes from was the lowest: 17% and 13%, respectively. The fractions of fish consumers that eat some type of herring, but not Baltic herring, was the largest in Sweden (16%) and the smallest in Estonia (1%).

4.2. Sociodemographic Features of People Who Consume Baltic Herring

Compared to the Finns, the Estonians were statistically more likely, and the Swedes and the Danes less likely to eat Baltic herring (p < 0.001) (Table 3). In Denmark and Finland, consumers over 45 years of age were more likely to consume Baltic herring than consumers under 45 years of age. Consumers in the older age group were 1.86 times more likely to eat Baltic herring in Denmark (p < 0.05) and 2.46 times more likely in Finland (p < 0.01) than the younger age group. Education also predicted Baltic herring consumption in both of these countries. The probability of Baltic herring consumption increased by 1.50 times in Denmark and 1.54 times in Finland (p < 0.05) at each education level. Thus, the higher the education level, the more likely the consumers were to eat Baltic herring. Purchasing power predicted Baltic herring consumption only in Finland, where the probability of Baltic herring consumption increased by 1.33 times at each level of purchasing power (p < 0.05). In Estonia and Sweden, the impacts of the studied determinants on Baltic herring consumption were not statistically significant.

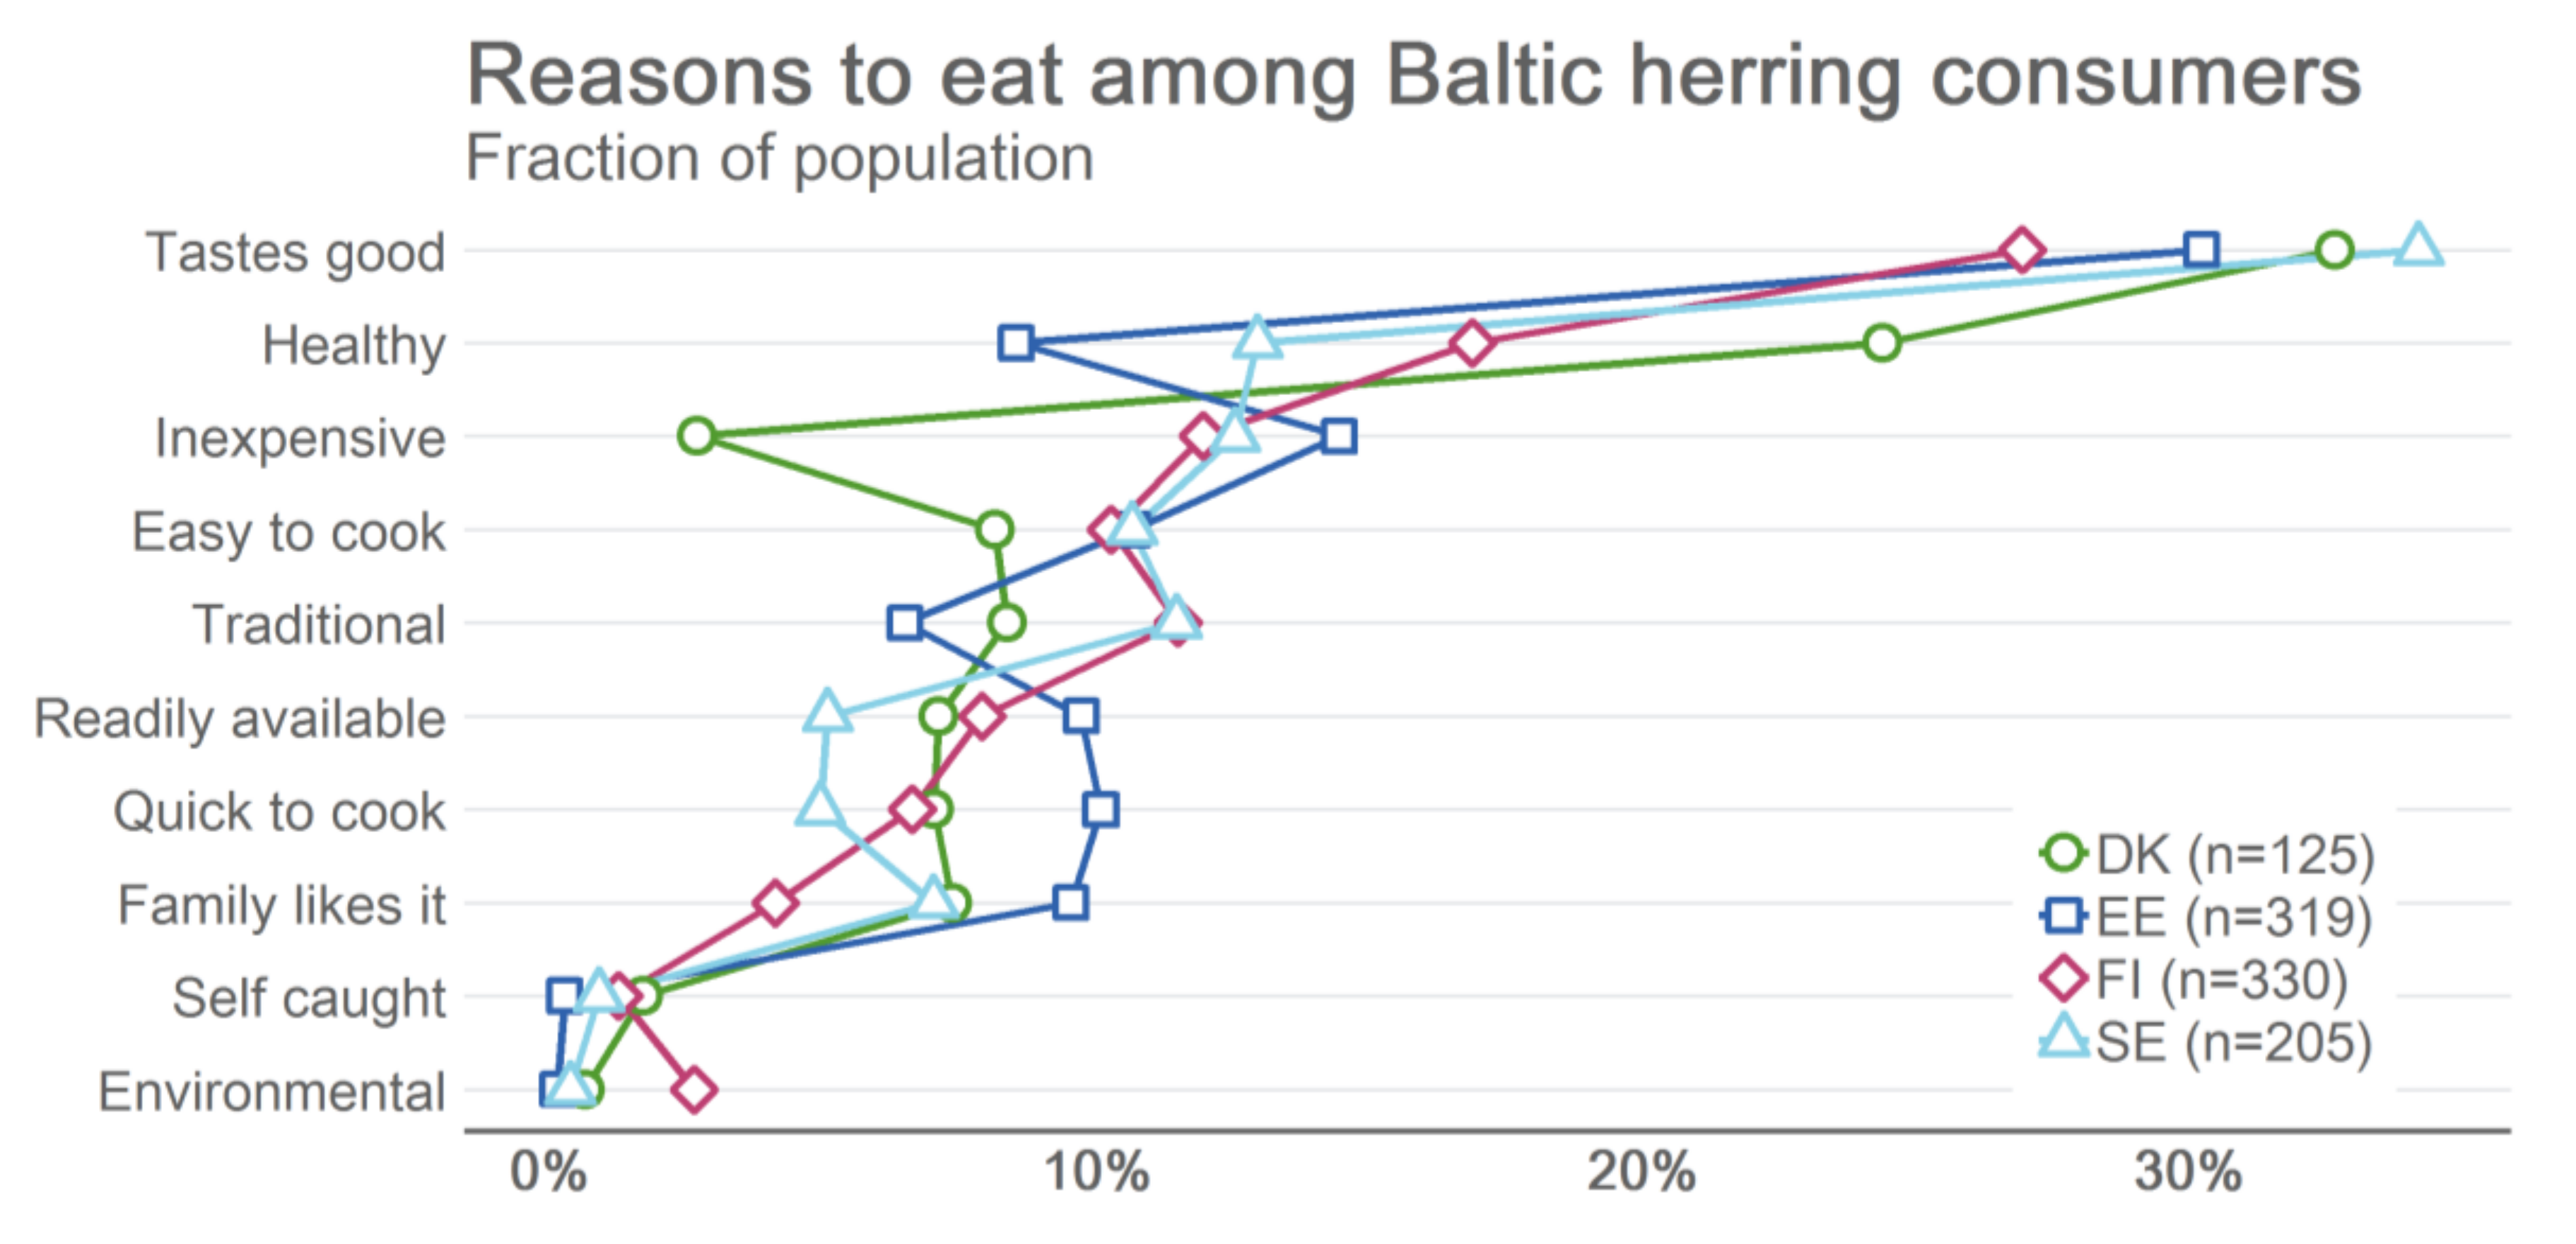
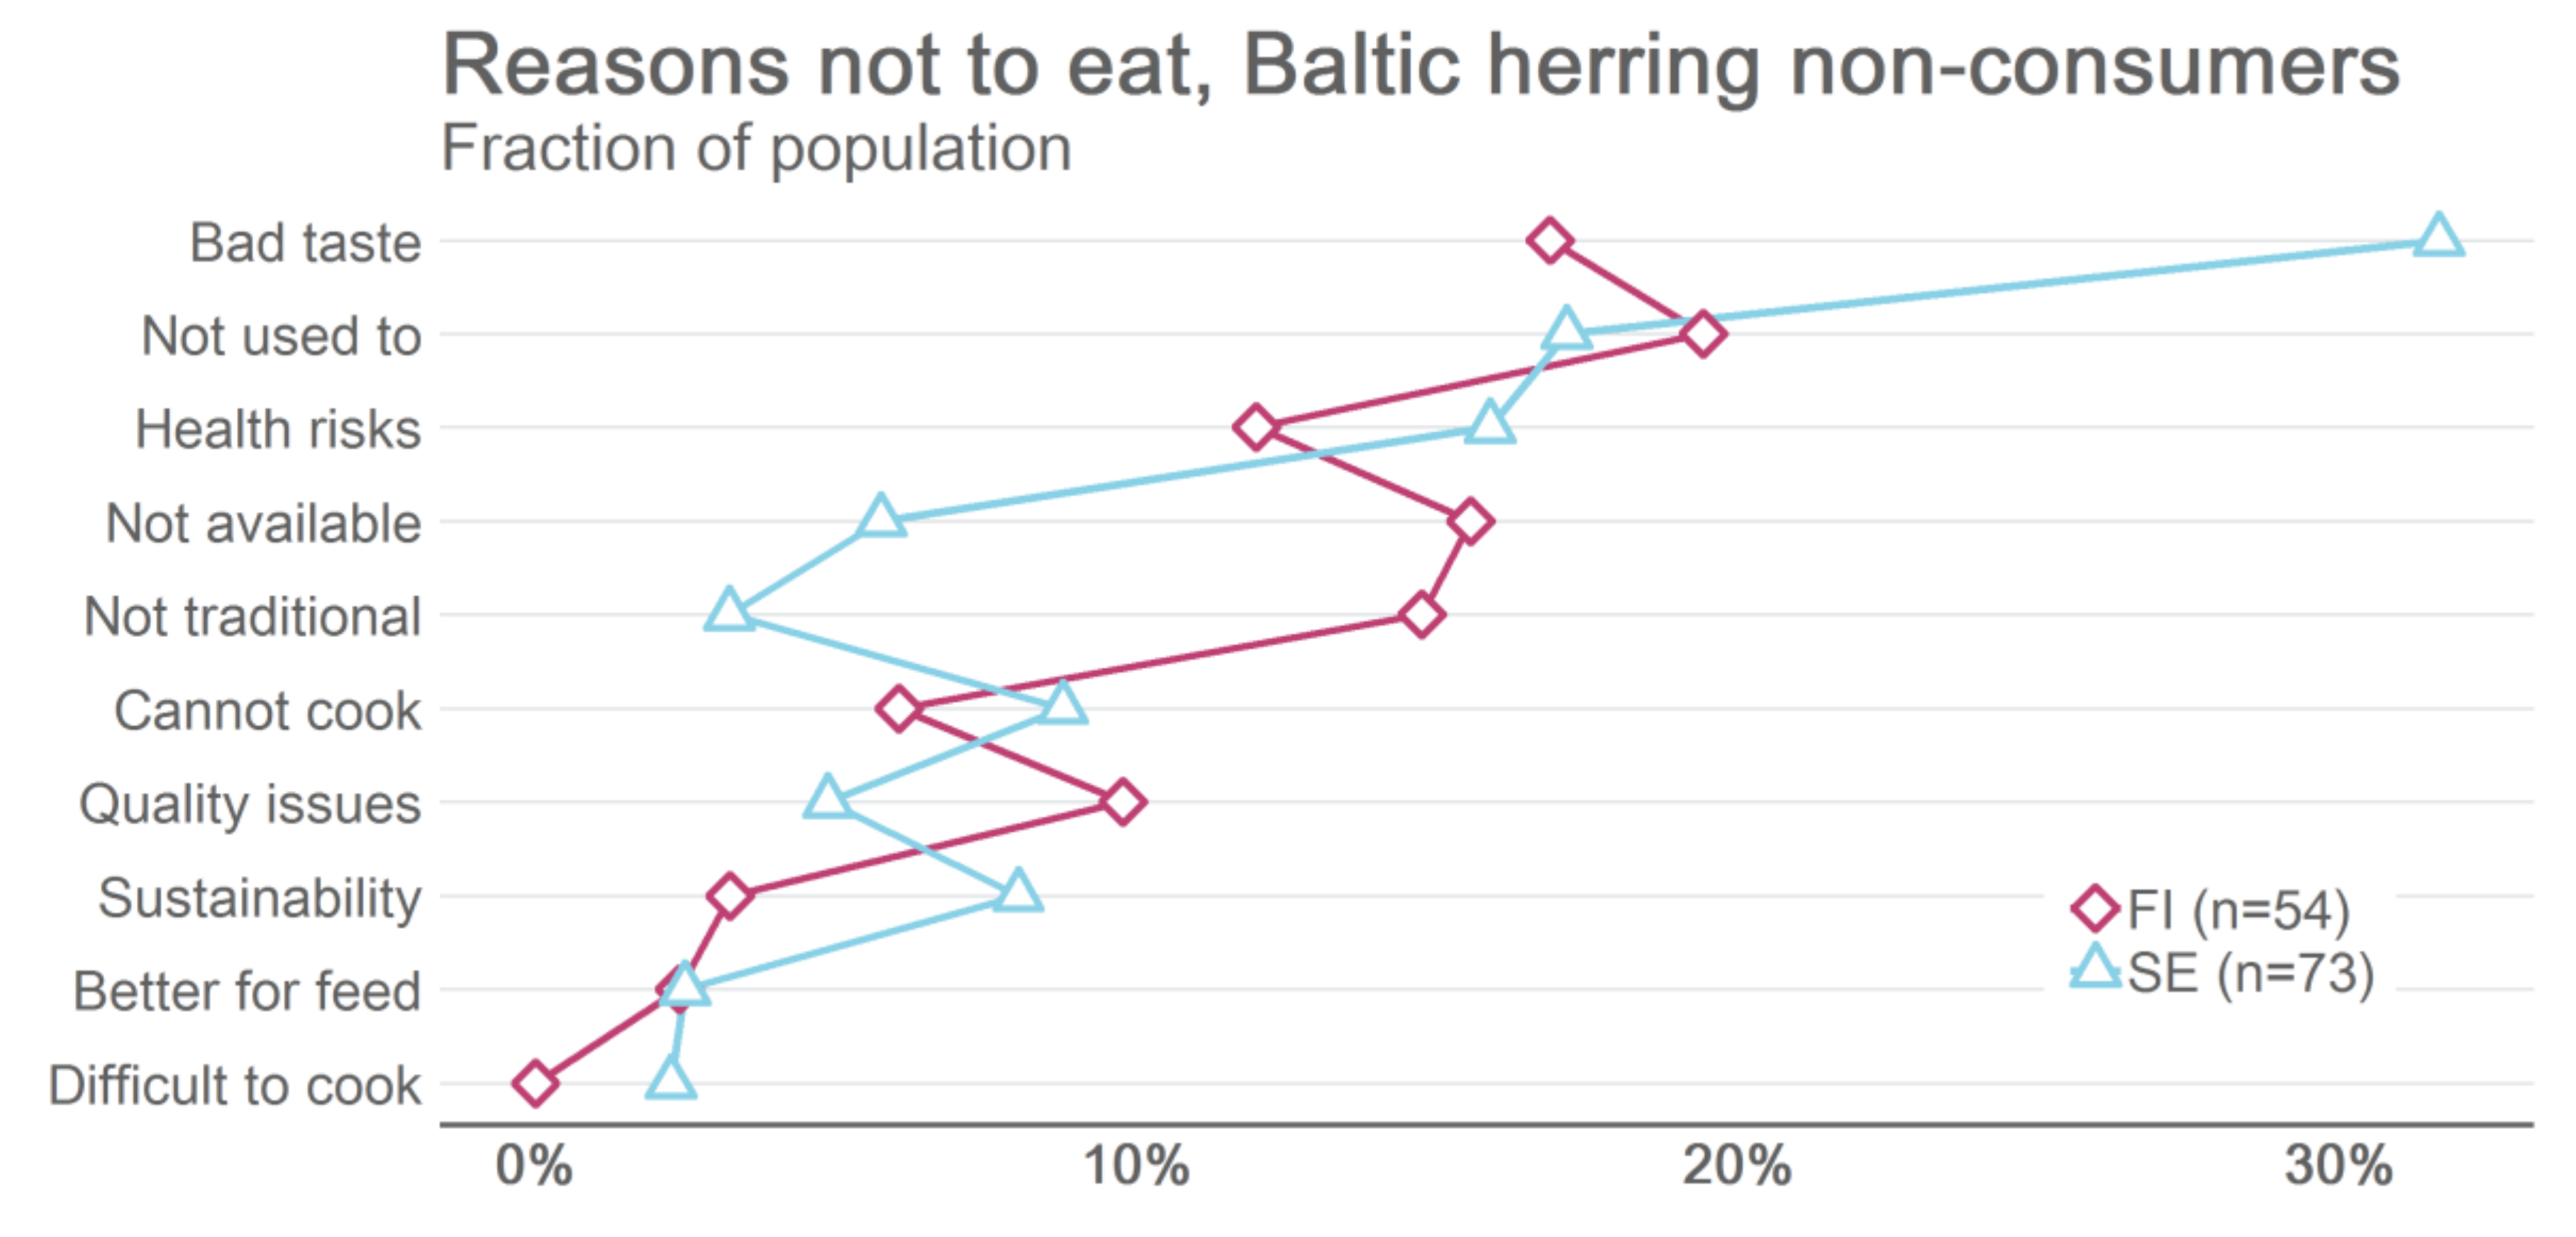
4.3. Key Factors Affecting Baltic Herring Consumption

The most common reason to eat Baltic herring in all four countries was that it was considered to taste good (27%–34%) (Figure 2). In addition, it was perceived healthy (Denmark (24%), Finland (17%), Sweden (13%), Estonia (9%)) and inexpensive (Estonia (14%), Sweden (13%), Finland (12%), Denmark (3%)). The least common reasons in all four countries related to catching the fish oneself (0–2%) and the environmental/climate friendliness of the choice of Baltic herring consumption (0–3%).
Compared to the Finns, the reason people from the other countries consume Baltic herring was more likely to be that it was considered to taste good (p < 0.01– p < 0.05). Moreover, the Danes were more likely (p < 0.01), and the Swedes (p < 0.05) and the Estonians (p < 0.001) were less likely, to eat Baltic herring than the Finns, because of the perceived healthiness. Finally, the Finns were more likely to consume Baltic herring than the Danes, because they consider it inexpensive (p < 0.001). There was no statistically significant difference between the countries relating to eating Baltic herring because it is easy to cook.
The top three reasons among those who eat some herring, but not Baltic herring, in Sweden were that the consumers did not like the taste (32%), were not used to eating it (17%), and were worried about the possible health risks caused by the harmful chemicals in it (16%) (Figure 3). The most common reasons in Finland were that the consumers were not used to eating it (19%), did not like the taste (17%), or because it was not easily available (16%). Only 8% of the Swedes and 3% of the Finns chose not to eat Baltic herring, because they were worried about the sustainability of the stocks.

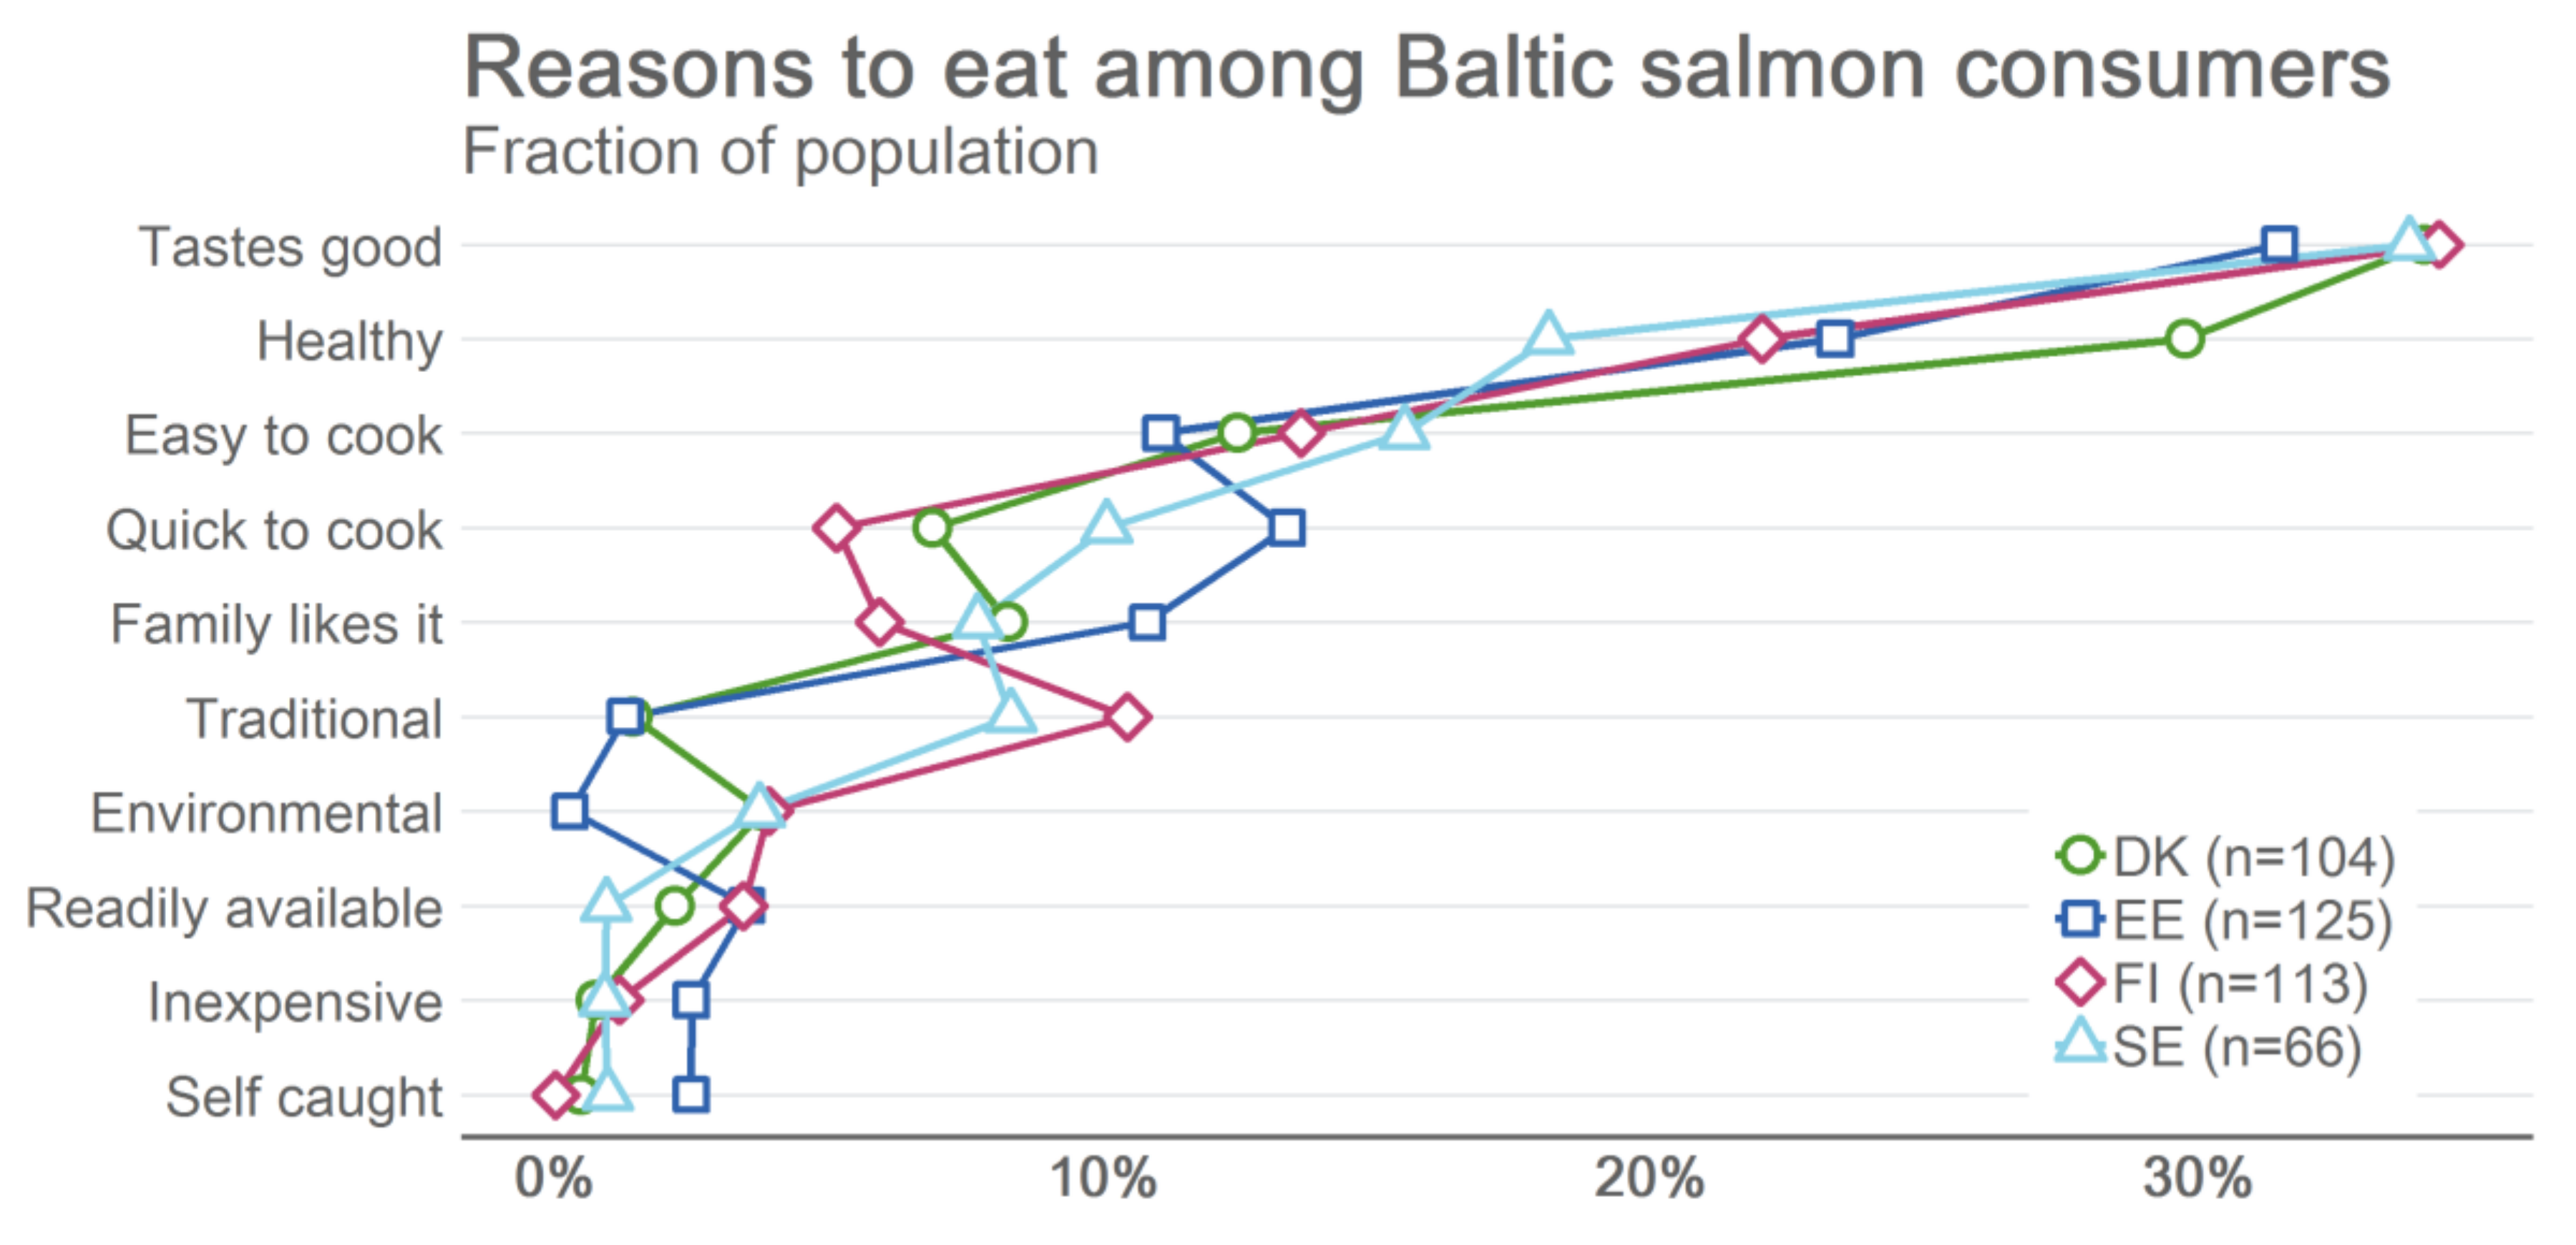
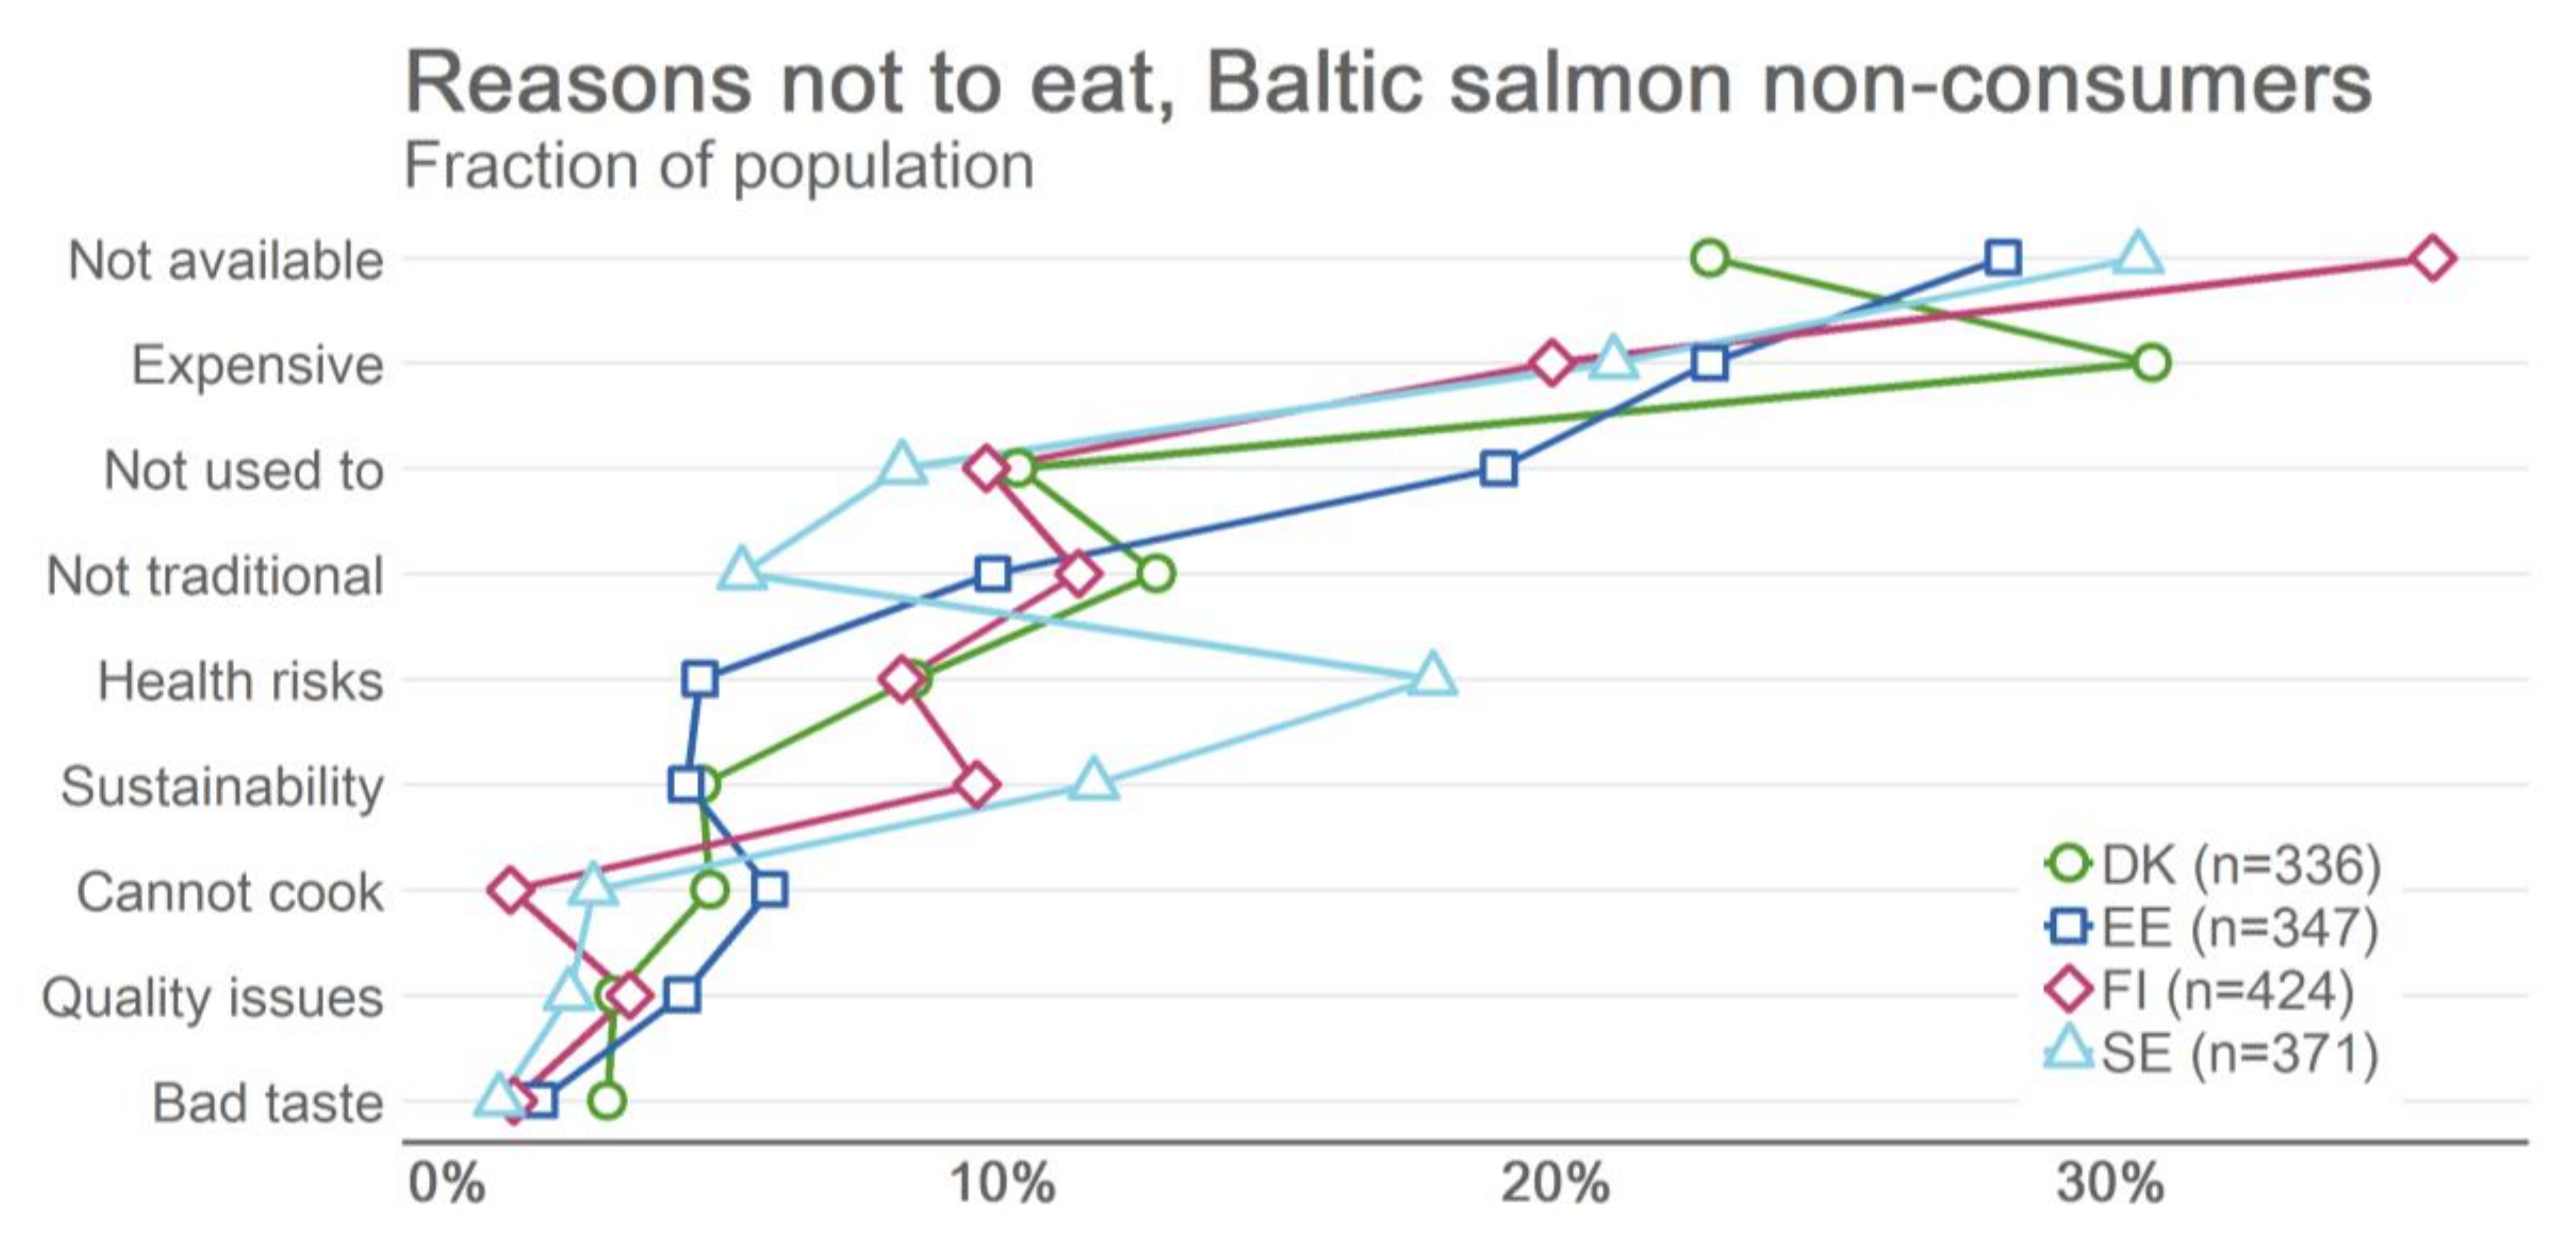
4.4. Comparing Baltic Herring and Salmon Consumption

Compared to herring, salmonids were more commonly consumed in the four countries of this case study. Over 90% of the population, in these countries, consumed salmon or trout at least sometimes. Compared to Baltic herring, Baltic salmon was less commonly consumed: about 10%–16% of population in the surveyed countries consumed Baltic salmon sometimes. Similarly to Baltic herring, many consumers (over 30% of the Danes to 10% of the Finns) reported not knowing what salmon species they consumed.
The most common reasons for eating Baltic salmon were the same as for Baltic herring, namely that it was considered to taste good (over 30% of the Baltic salmon-consuming population in all of the four countries) and to be a healthy choice (from 18% in Sweden to 30% in Denmark) (Figure 4). The main differences between the consumer perceptions on the consumption of the species were that in contrast to Baltic herring, inexpensiveness and disliking the taste were uncommon reasons for eating Baltic salmon, whereas expensiveness (20%–31%) was an important reason for not eating Baltic salmon (Figure 5). Poor availability was a more common reason for not eating Baltic salmon (23%–36%) than Baltic herring. However, the possible health risks caused by the harmful chemicals in the fish was reported as an important reason for not eating either species, especially in Sweden.
The top five most important determinants for increasing the consumption of Baltic herring and that of salmon were the same (Figure 6). Over half of the population identified a lower level of chemicals in fish (59%) and better availability (52%) as determinants that would increase the consumption of Baltic herring. Other popular determinants included an improvement of the stocks (ecolabelling) (47%), lower price (41%) and better information (e.g., package markings or in the store) on the catch date, area, fisher and/or the processor (40%). The two main determinants that were reported to decrease the consumption of both species were a higher price and if the national food safety authorities publish a recommendation to limit consumption.

5. Discussion

5.1. Country-Specific Intricacies

The results show that the majority of fish consumers in the surveyed countries eat some type of herring at least sometimes. Including those consumers who were not sure what type of herring they eat, suggests that over half of all fish consumers in these countries eat Baltic herring at least sometimes. In other words, less than half of the fish consumers do not eat Baltic herring at all. This indicates that the low overall demand for Baltic herring as food relates to the consumption behaviour of both those who do not eat herring at all and those who do but only rarely.
With respect to the first research question (sociodemographic determinants), differences between the countries were found. As expected, Baltic herring is most likely eaten in Estonia, the only surveyed country where the herring catch is used primarily for human consumption and where herring consumption is the most common (see Section 2). The results also suggest that the Swedes are more reluctant to eat Baltic herring than the Finns, which may relate to the difference in risk perceptions and dioxin risk management between the two countries, namely that fish consumers in Sweden have been advised to eat Baltic herring more rarely than in Finland [53,54]. Although previous studies suggest that consumers’ awareness of the advice is low, the results of this study show that the Swedes are more concerned about the health risks related to Baltic herring and salmon consumption than the consumers in the other surveyed countries.
One unanticipated finding was that age and education predict Baltic herring consumption in Denmark and Finland, but not in Estonia and Sweden. This is supported by another finding, namely that the health benefits relating to Baltic herring consumption are also a more important reason in Denmark and Finland compared to Estonia and Sweden. Consumers who are most aware of and interested in the health benefits of fish consumption, are usually highly educated and older [35]. The study also found that purchasing power predicts Baltic herring consumption in Finland. This is intriguing, as the general view has been that the Finns consider Baltic herring as a “common people’s fish” and one that has a poor image as food [21]. Yet, the Finns eat Baltic herring most often in lunch restaurants [39], which could explain the findings as people with a higher purchasing power, often corresponding with age and education, are generally more likely to eat in restaurants. Furthermore, the Finnish public health authorities have advised young people to limit the consumption of Baltic herring [53], which may have contributed to the identified age gradient. Whereas in Sweden, advise to limit Baltic herring consumption has been provided to the whole population [54], which may explain why the Baltic herring consumers are a more heterogeneous group in Sweden compared to Finland. As for Estonia, Baltic herring is among the most commonly consumed fish species [45] and considered the “national fish” [21], which could explain its consumption across all sociodemographic groups.
Fish consumers, especially in Denmark and Estonia, are poorly aware of the type of fish they eat. In these two countries, North Sea herring is among the most consumed species, which can explain this uncertainty. While North Sea herring is larger and fattier than Baltic herring, it may be difficult to notice the difference, especially if the fishes are consumed e.g., as chopped and pickled.. Another possible explanation for the ignorance of the Danish fish consumers is a linguistic one, namely, that the names for Baltic and North Sea herring are completely different in Finnish (“silakka” and “silli”, respectively), Swedish (“strömming” and “sill”) and Estonian (“räim” and “heeringas”), whereas in Danish, similarly to English, the only difference in the names is the region from which the fish comes (“østersøsild” and “sild”). Thus, it could be that, in Denmark, both types of herring are commonly called simply “herring” (sild), whereas in the other countries, a distinction between the two is more obvious.
As for Baltic salmon, the reported uncertainty concerning the type of salmon consumed seems smaller, but as the other results of this survey demonstrate, a note of caution is due here. Over 15% of Estonians reported that they eat Baltic salmon, which is more than in the other surveyed countries. This is highly unlikely, as Estonian fishermen land only around 2000 salmon per year, which is significantly less than in the other three countries. In addition, other Baltic Sea countries cannot sell Baltic salmon to Estonia due to the dioxin regulation, and it is therefore expected that Baltic salmon is more rarely available in Estonia than in the other countries of this case study. One possibility is that consumers confuse Baltic salmon with Baltic Sea trout or rainbow trout farmed in the Baltic Sea, or even with salmon farmed in Norway.

5.2. Drivers and Barriers

Regarding the second research question (the identification of the drivers and barriers relating to, e.g., the availability, price, taste, healthiness, harmful toxins, environmental issues, and cooking, of Baltic herring consumption), the study found that the main drivers of Baltic herring consumption (taste preference and health considerations) correspond with those of Baltic salmon consumption as well as fish consumption in general [37]. Some of the main barriers for Baltic herring and salmon consumption are also the same, e.g., the health risks and poor availability. The latter is not surprising regarding Baltic salmon, as it is available only rarely, locally and in small quantities. However, it is surprising that in the two largest fishing nations, Finland and Sweden, a poor availability is also a common reason for not eating Baltic herring at all. This suggests that the dominance of feed-directed fishing in these two countries constrains the use of Baltic herring for human consumption.
Although some of the drivers and barriers for Baltic herring and salmon consumption are the same, some differences also exist. While disliking the taste of Baltic herring is one of the main reasons for not eating it, disliking the taste is not a relevant factor restricting the consumption of Baltic salmon among fish consumers, which explains the popularity of salmonids as food. A dislike of the taste of Baltic herring seems to be a more common reason for not eating it in Sweden than in Finland. This could be due to the traditional Swedish Baltic herring product, called “surströmming”, which is a strong-smelling fermented dish. Another difference between the reasons behind Baltic herring and salmon consumption is the respondents’ perception on the price of the fish, which seems to be a driver for Baltic herring consumption but a barrier for Baltic salmon consumption. In contrast to Baltic salmon, Baltic herring is widely considered an environmentally friendly and sustainable source of food [11,20]. Yet, the results suggest that environmental friendliness is a more common reason to eat Baltic salmon than Baltic herring. This may relate to the popularity of salmonids in general as food choice and the common perception that fish is an environmentally friendlier option compared to livestock meat. Nevertheless, this indicates that fish consumers in the countries of this case study are poorly aware of the ecological state of the fish stocks.
The results regarding the main barriers for increasing the consumption of Baltic herring among those who already eat it at least sometimes (chemicals (dioxins) found in fish and poor availability) are encouraging from the perspective of prioritising the use of Baltic herring for human consumption. First, it seems that dioxins are not keeping the majority of fish consumers from eating Baltic herring (and salmon), but lower levels of dioxins in the fish entering fish food market could have a positive effect on the quantities consumed. Second, the results indicate that fish consumers would eat Baltic herring in greater quantities if it were more readily available. Third, the results suggest that sustainability certificates and environmental labels, similarly to many other factors, i.e., package markings, lower price, ready meals and a health authority’s recommendation to eat it, would have a positive effect on the consumer demand.

5.3. Implications for Catch Use Governance and Limitations

Based on the results, six main implications for catch use governance are identified. First, the results support proactive catch use governance that prioritises the use of Baltic herring as food. Strategies are required that acknowledge both consumer groups, namely fish consumers who do not eat Baltic herring at all and Baltic herring consumers who eat it rarely. However, these consumers do not constitute a homogeneous group across countries. Instead, Baltic herring consumption is embedded in country-specific conditions (e.g., sociodemographic differences and fish consumption traditions), which are shaped by different values [20], fishing practices and risk perceptions [11,29]. These country-specific intricacies imply that there is a need for country-specific strategies or at least a strategy that acknowledges the diversity across the region.
Second, the availability of Baltic herring on the fish food market needs to be improved. This is supported by the contemporary literature which identifies the poor availability of sustainable food products on the food market as a common obstacle for their consumption [58,59]. Additionally, encouraging examples from the recent years exist as some forage species, e.g., the Atlantic herring, have been successfully redirected to human consumption [33]. These imply that increasing the consumer demand necessitates a gradual increase in the supply of Baltic herring on to the domestic food markets.
Third, although many consumers seem to like traditional Baltic herring dishes, others do not or are not used to eating them. Therefore, development of new products is required. Accordingly, stakeholders have identified product development as one of the key actions to increase the use of Baltic herring for human consumption [11]. In Finland, the development of a new boneless heat-and-eat product, tentatively called “pulled herring,” has already begun [60].
Fourth, the governance system must ensure that Baltic herring entering the market is safe-to-eat. The results suggest that a shift from the ambiguous management of the dioxin problem to a unified one, which ensures that only safe-to-eat Baltic herring is placed on the market, would improve the image of Baltic herring as food and thereby increase its demand. Currently, the Danes and Estonians have only herring that is considered safe-to-eat on their domestic markets, but the image of Baltic herring as fish containing harmful chemicals still seems to restrict consumption. Concerns about the health risks of Baltic herring consumption seem to be a limiting factor also in Finland and Sweden. In addition, the potential to increase Baltic herring consumption in these two countries is limited by the food safety recommendations. Thus, opting to continue on this exemption-driven path might be counter-productive for the fishery, as it sustains the image of Baltic herring as harmful for human health. In addition, from the public health perspective, using only safe-to-eat Baltic herring for human consumption would maximise the health benefits [23].
Fifth, the multiple barriers for Baltic herring consumption suggest that improved information is needed about the fish species, their origin, the environmental and climate effects of their consumption, and the ecological state of the stocks as well as the benefits and risks of the fish for human health. This is supported by previous research which argues that transforming consumption behaviour requires comprehensive information of individuals’ fish consumption choices [61]. In this case, providing more comprehensive information necessitates collaboration between the fisheries sector, the environmental sector and the public health sector, and the stakeholder groups that promote sustainable fish consumption.
Sixth, collaboration between the Baltic Sea countries could help maximising the availability of Baltic herring suitable for human consumption in the most cost-efficient way. Based on the results, affordability of Baltic herring is one of the key drivers for its consumption. Thus, if proactive catch use governance leads to increased consumer prices, this could, in turn, negatively affect consumer demand. One solution for improving the cost-effectiveness of the required actions is regionalised Baltic Sea-level catch use governance. For example, primarily prioritising the catch that is already safe-to-eat for human consumption.
One limitation of the study is that, regarding drivers and barriers, it focused only on those consumers who reported that they eat some type of herring, while those who did not were left out of the analysis. Thus, the results do not comprise the views of the fish consumers who have chosen not to eat Baltic herring, nor do they reveal the factors affecting herring consumption more broadly. Because of this, the number of respondents who were asked about the drivers and barriers of Baltic herring consumption is, in many cases, low, and the results should be interpreted with caution. However, given the apparent similarities between the identified drivers and barriers of Baltic herring consumption and fish consumption in general [37], the authors argue that, by examining Baltic herring consumption specifically, some conclusions can be drawn that are applicable beyond the scope of this single species. For example, it is reasonable to assume that the main reasons for eating or not eating forage species in general are related to liking or disliking the taste, the availability of the fish, consumption habits and the perceived health benefits and risks.

6. Conclusions

The present paper has demonstrated the feasibility of prioritising forage species, such as Baltic herring, for human consumption from the consumer perspective. However, owing to the multifaceted barriers for consumption (e.g., poor availability, dislike of taste, and health risks related to harmful chemicals in fish), using forage species primarily as food calls for proactive catch use governance, which (1) acknowledges the species- and country-specific intricacies of forage fish consumption, (2) improves the availability of safe-to-eat fish, and (3) provides consumers with sufficient information on the species (e.g., the type of herring and its origin), the sustainability of the fisheries, and the health risks and benefits. Addressing these issues necessitates collaboration between relevant sectors and stakeholder groups.

Supplementary Materials

The following are available online at https://www.mdpi.com/2071-1050/11/16/4298/s1, S1: Questionnaire of eating habits of wild Baltic salmon and Baltic herring. To support transparency, the original data and all the results are available online: http://en.opasnet.org/w/Goherr:_Fish_consumption_study.

Author Contributions

Conceptualization, M.P., S.I. and P.H.; Methodology, M.P., J.T.T., A.A., S.I. and P.H.; Software, J.T.T.; Validation, J.T.T., M.P., A.A., S.I. and P.H.; Formal Analysis, M.P., J.T.T., A.A., S.I. and P.H.; Investigation, A.A., M.P., S.I., P.H. and J.T.T.; Resources, P.H. and J.T.T.; Data Curation, J.T.T. and A.A.; Writing—Original Draft Preparation, M.P., S.I., P.H., J.T.T. and A.A.; Writing—Review & Editing, M.P., S.I., P.H. and J.T.T.; Visualization, J.T.T. and M.P.; Supervision, n.a.; Project Administration, A.A., J.T.T. and P.H.; Funding Acquisition, P.H., J.T.T. and M.P.

Funding

This research was supported by BONUS (art 185), jointly funded by the EU and the Academy of Finland. The APC was funded by [the Academy of Finland] grant number (296702).

Acknowledgments

This work resulted from the BONUS GOHERR project (Integrated governance of Baltic herring and salmon stocks involving stakeholders) and was supported by (i) BONUS (Art 185), funded jointly by the EU and the Academy of Finland. The APC was funded by [the Academy of Finland] grant number (296702).

Conflicts of Interest

The authors declare no conflict of interest.

References

  1. UN. Resolution Adopted by the General Assembly on 25 September 2015. Transforming Our World: The 2030 Agenda for Sustainable Development. Available online: http://www.un.org/ga/search/view_doc.asp?symbol=A/RES/70/1&Lang=E (accessed on 27 February 2019).
  2. Wheeler, T.; Von Braun, J. Climate change impacts on global food security. Science 2013, 341, 508–513. [Google Scholar] [CrossRef] [PubMed]
  3. WHO. Food Based Dietary Guidelines in the WHO European Region; WHO: Geneva, Switzerland, 2003. [Google Scholar]
  4. Carlsson-Kanyama, A.; González, A.D. Potential contributions of food consumption patterns to climate change. Am. J. Clin. Nutr. 2009, 89, 1704S–1709S. [Google Scholar] [CrossRef] [PubMed] [Green Version]
  5. Nordic Council of Ministers. Nordic Nutrition Recommendations; Nordic Council of Ministers: Copenhagen, Denmark, 2012. [Google Scholar]
  6. FAO. Code of Conduct for Responsible Fisheries; FAO: Rome, Italy, 1995; Available online: http://www.fao.org/3/a-v9878e.pdf (accessed on 27 February 2019).
  7. FAO. Aquaculture development. 5. Use of wild fish as feed in aquaculture. In FAO Technical Guidelines for Responsible Fisheries No. 5, Suppl. 5; FAO: Rome, Italy, 2011; Available online: http://www.fao.org/3/a-i1917e.pdf (accessed on 27 February 2019).
  8. FAO. The State of World Fisheries and Aquaculture. In Contributing to Food Security and Nutrition for All; FAO: Rome, Italy, 2016; Available online: www.fao.org/3/a-i5555e.pdf (accessed on 10 April 2019).
  9. Thurstan, R.H.; Roberts, C.M. The past and future of fish consumption: Can supplies meet healthy eating recommendations? Mar. Pollut. Bull. 2014, 89, 5–11. [Google Scholar] [CrossRef] [PubMed]
  10. McClanahan, T.; Allison, E.H.; Cinner, J.E. Managing fisheries for human and food security. Fish Fish. 2015, 16, 78–103. [Google Scholar] [CrossRef]
  11. Pihlajamäki, M.; Sarkki, S.; Haapasaari, P. Food security and safety in fisheries governance—A case study on Baltic herring. Mar. Policy 2018, 97, 211–219. [Google Scholar] [CrossRef]
  12. Stephenson, R.; Peltonen, H.; Kuikka, S.; Pönni, J.; Rahikainen, M.; Aro, E.; Setälä, J. Linking biological and industrial aspects of the Finnish commercial herring fishery in the northern Baltic Sea. In Herring: Expectations for a New Millennium; Blackburn, J., Hay, D., Paul, A.J., Stephenson, R., Toresen, R., Witherell, D., Eds.; University of Alaska Sea Grant: Fairbanks, AK, USA, 2001; pp. 741–760. [Google Scholar]
  13. Tacon, A.G.J.; Metian, M. Fishing for feed or fishing for food: Increasing global competition for small pelagic forage fish. Ambio 2009, 38, 6. [Google Scholar] [CrossRef]
  14. Alder, J.; Campbell, B.; Karpouzi, V.; Kaschner, K.; Pauly, D. Forage Fish: From Ecosystems to Markets. Annu. Rev. Environ. Resour. 2008, 33, 153–166. [Google Scholar] [CrossRef]
  15. ICES. Report of the Baltic Salmon and Trout Assessment Working Group (WGBAST), 20–28 March 2018, Turku, Finland; ICES: Copenhagen, Denmark Turku, 2018. [Google Scholar]
  16. ICES. Baltic Fisheries Assessment Working group (WGBFAS), 6–13 April 2018; ICES: Copenhagen, Denmark, 2018. [Google Scholar]
  17. Eurofish. Fisheries and Aquaculture Around the Baltic Sea; Eurofish: Copenhagen, Denmark, 2015; p. 24. Available online: https://www.eurofish.dk/shop/fisheries-and-aquaculture-around-the-baltic-sea-as-pdf-file (accessed on 12 July 2019).
  18. ICES. Report of the Herring Assessment Working Group for the Area South of 62°N (HAWG), 29–31 January 2018 and 12–20 March 2018; ICES: Copenhagen, Denmark, 2018. [Google Scholar]
  19. Setälä, J.; Saarni, K.; Niukko, J. Fish Market Review 2017. Natural Resources Institute Finland (Luke). 2018. Available online: https://www.luke.fi/en/natural-resources/fish-and-the-fishing-industry/fish-market-and-fish-consumption/ (accessed on 12 July 2019).
  20. Ignatius, S.; Delaney, A.; Haapasaari, P. Socio-cultural values as a dimension of fisheries governance: The cases of Baltic salmon and herring. Environ. Sci. Policy 2019, 94, 1–8. [Google Scholar] [CrossRef]
  21. Natural Resources Institute Finland. Fish Consumption 2017. Statistical Database. Available online: https://stat.luke.fi/en/fish-consumption-2017_en (accessed on 10 April 2019).
  22. Setälä, J.; Kankainen, M.; Vielma, J.; Niukko, J.; Pitkämäki, A.; Saario, M.; Tommila, P. Itämerirehua Kotimaisista Kalavirroista Loppuraportti (Baltic Sea Fish Feed from Domestic Resources, Final Report) Luonnonvara-ja Biotalouden Tutkimus. 2016. Available online: https://jukuri.luke.fi/bitstream/handle/10024/535286/luke-luobio_28_2016.pdf?Sequence=4 (accessed on 27 February 2019).
  23. Swedish National Food Agency. Risk and Benefit Assessment of Herring and Salmonid Fish from the Baltic Sea Area; Report no 21-2013; Swedish National Food Agency: Uppsala, Sweden, 2013. [Google Scholar]
  24. Tuomisto, J.T.; Niittynen, M.; Turunen, A.; Ung-Lanki, S.; Kiviranta, H.; Harjunpää, H.; Hallikainen, A. Baltic Herring as Nutrition—Risk Benefit Analysis; Evira Research Reports 1/2015; Finnish Food Safety Authority: Helsinki, Finland, 2015. [Google Scholar]
  25. FAO. The State of World Fisheries and Aquaculture 2018—Meeting the Sustainable Development Goals; FAO: Rome, Italy, 2018; Available online: www.fao.org/3/i9540en/i9540en.pdf (accessed on 27 February 2019).
  26. Parker, R.W.R.; Blanchard, J.L.; Gardner, C.; Green, B.S.; Hartmann, K.; Tyedmers, P.H.; Watson, R.A. Fuel use and greenhouse gas emissions of world fisheries. Nat. Clim. Chang. 2018, 8, 333–337. [Google Scholar] [CrossRef]
  27. European Commission. Regulation (EU) No 1259/2011 of 2 December 2011 Amending Regulation (EC) No 1881/2006 As Regards Maximum Levels for Dioxins, Dioxin-Like PCBs and Non Dioxin-Like PCBs in Foodstuffs; European Commission: Brussels, Belgium, 2011; Available online: http://data.europa.eu/eli/reg/2011/1259/oj (accessed on 10 April 2019).
  28. European Commission. Recommendation (EU) 2016/688 of 2 May 2016 on the Monitoring and Management of the Presence of Dioxins and PCBs in Fish and Fishery Products from the Baltic Sea Region; European Commission: Brussels, Belgium, 2016; Available online: http://data.europa.eu/eli/reco/2016/688/oj (accessed on 10 April 2019).
  29. Haapasaari, P.; Ignatius, S.; Pihlajamäki, M.; Sarkki, S.; Tuomisto, J.T.; Alyne, D. How to improve governance of a complex social-ecological problem? Dioxins in Baltic salmon and herring. Environ. Policy Plan. accepted.
  30. Haapasaari, P.; Ignatius, S.; Pihlajamäki, M.; Bryhn, A.; Sarkki, S.; Tuomisto, J.; Ronkainen, L.; Lehikoinen, A.; Assmuth, T.; Romakkaniemi, A.; et al. Integrated governance for managing complexity? Expert assessment based on the case study of the dioxin problem of Baltic herring and salmon fisheries. Submitted, under review.
  31. Clavelle, T.; Lester, S.E.; Gentry, R.; Froehlich, H.E. Interactions and management for the future of marine aquaculture and capture fisheries. Fish Fish. 2018, 2019, 1–21. [Google Scholar] [CrossRef]
  32. Jennings, S.; Stentiford, G.D.; Leocadio, A.M.; Jeffery, K.R.; Metcalfe, J.D.; Katsiadaki, I.; A Auchterlonie, N.; Mangi, S.C.; Pinnegar, J.K.; Ellis, T.; et al. Aquatic food security: insights into challenges and solutions from an analysis of interactions between fisheries, aquaculture, food safety, human health, fish and human welfare, economy and environment. Fish Fish. 2016, 17, 893–938. [Google Scholar] [CrossRef] [Green Version]
  33. Cashion, T.; Le Manach, F.; Zeller, D.; Pauly, D. Most fish destined for fishmeal production are food-grade fish. Fish Fish. 2017, 18, 837–844. [Google Scholar] [CrossRef]
  34. Hicks, D.; Pivarnik, L.; McDermott, R. Consumer perceptions about seafood—An Internet survey. J. Foodserv. 2008, 19, 213–226. [Google Scholar] [CrossRef]
  35. Carlucci, D.; Nocella, G.; De Devitiis, B.; Viscecchia, R.; Bimbo, F.; Nardone, G. Consumer purchasing behaviour towards fish and seafood products. Patterns and insights from a sample of international studies. Appetite 2015, 84, 212–227. [Google Scholar] [CrossRef]
  36. European Commission. EU Consumer Habits Regarding Fishery and Aquaculture Products, Final Report; European Commission: Brussels, Belgium, 2016. [Google Scholar]
  37. European Commission. Special Eurobarometer 450. In EU consumer Habits Regarding Fishery and Aquaculture Products; Survey conducted by TNS opinion & social at the request of the European Commission; Directorate-General for Maritime Affairs and Fisheries; European Commission: Brussels, Belgium, 2016. [Google Scholar]
  38. Roininen, K.; Lähteenmäki, L.; Tuorila, H. An application of means-end chain approach to consumers’ orientation to health and hedonic characteristics of foods. Ecol. Food Nutr. 2000, 39, 61–81. [Google Scholar] [CrossRef]
  39. Mononen, R.; Urala, N. Kuluttajien Suhtautuminen Silakkaan (Consumer Perceptions on Baltic Herring); Research report 26.11.2010; Kuulas Research Agency: Helsinki, Finland, 2010. [Google Scholar]
  40. Pihlajamäki, M.; Sarkki, S.; Karjalainen, T.P. Food or feed? The contribution of Baltic herring fisheries to food security and safety. In Food Futures: Ethics, Science and Culture; Olsson, I.A.S., Araujo, S.M., Vieira, M.F., Eds.; Wageningen Academic Publishers: Wageningen, The Netherlands, 2016. [Google Scholar]
  41. Ignatius, S.; Haapasaari, P. Addressing socio-cultural values in the use and management of Baltic herring. In Food Futures: Ethics, Science and Culture; Olsson, I.A.S., Araujo, S.M., Vieira, M.F., Eds.; Academic Publishers: Wageningen, The Netherlands, 2016; pp. 233–238. [Google Scholar]
  42. Ignatius, S.; Haapasaari, P. Justification theory for the analysis of the socio-cultural value of fish and fisheries: The case of Baltic salmon. Mar. Policy 2018, 88, 167–173. [Google Scholar] [CrossRef]
  43. Hass, J.K. Economic Sociology: An introduction; Routledge: New York, NY, USA, 2007. [Google Scholar]
  44. European Commission. Final Report of an Audit Carried Out in Denmark from 26 to 30 November 2012 in Order to Evaluate the Monitoring and Control of Dioxins, Furans and PCBs in Fish from the Baltic Region; European Commission: Brussels, Belgium, 2013; pp. 2012–6521. [Google Scholar]
  45. Eschbaum, R.; Hubel, K.; Järvalt, A.; Kärgenberg, E.; Lees, J.; Matetski, L.; Raid, T.; Rakko, A.; Kalda, R.; Sadul, J.V.; et al. Estonian Fishery 2017; Fisheries Information Centre: Pärnu, Estonia, 2019; Available online: http://www.kalateave.ee/et/teadus-ja-arendustegevus/trukised/8625-yearbook-estonian-fishery-2017-kalanduse-teabekeskus-2019 (accessed on 12 July 2019).
  46. Estonian Institute of Economic Research. Kala ja Kalatoodete Turg Eestis; Estonian Institute of Economic: Tallin, Estonia, 2014; Available online: http://www.kalateave.ee/et/teadus-ja-arendustegevus/uurimused/185-2014-uurimused-arhiiv/3594-kala-ja-kalatoodete-turg-eestis-pollumajandusministeerium-2014 (accessed on 10 April 2019).
  47. European Commission. The EU Fish Market, 2018 ed.; European Commission: Brussels, Belgium, 2018. [Google Scholar]
  48. World Economic Outlook Database, World Economic and Finanacial Surveyr. April 2019 Edition. Available online: https://www.imf.org/external/pubs/ft/weo/2019/01/weodata/index.aspx (accessed on 4 July 2019).
  49. Persson, M.; Fagt, S.; Nauta, M.J. Personalised fish intake recommendations: the effect of background exposure on optimisation. Br. J. Nutr. 2018, 120, 946–957. [Google Scholar] [CrossRef] [Green Version]
  50. Swedish National Food Agency. Riksmaten-vuxna 2010–2011. In Livsmedels-Och Näringsintag Bland Vuxna i Sverige; Resultat från matvaneundersökning utförd 2010–2011; Swedish National Food Agency: Uppsala, Sweden, 2012; Available online: https://www.livsmedelsverket.se/globalassets/publikationsdatabas/rapporter/2011/riksmaten_2010_20111.pdf (accessed on 10 April 2019).
  51. European Commission. Final Report of an Audit Carried out in Estonia from 20 to 24 February 2012 in Order to Evaluate the Monitoring and Control of Dioxins, Furans and PCBS in Fish from the Baltic Sea Region; DG(SANCO); European Commission: Brussels, Belgium, 2012; pp. 2012–6531. [Google Scholar]
  52. European Commission. Final Report of an Audit Carried out in Estonia from 10 to 20 June 2014 in Order to Evaluate the Food Safety Control Systems in Place Governing the Production and Placing on the Market of Fishery Products; DG(SANCO); European Commission: Brussels, Belgium, 2014; pp. 2014–7132. [Google Scholar]
  53. Finnish Food Authority. Safe Use of Fish; Finnish Food Authority: Helsinki, Finland, 2019; Available online: https://www.ruokavirasto.fi/en/private-persons/information-on-food/instructions-for-safe-use-of-foodstuffs/safe-use-of-foodstuffs/safe-use-of-fish/ (accessed on 10 April 2019).
  54. Swedish National Food Agency. Fish and Shellfish Advice. Available online: https://www.livsmedelsverket.se/en/food-habits-health-and-environment/dietary-guidelines/adults/fisk-och-skaldjur---rad (accessed on 10 April 2019).
  55. Balch, C.V. Internet Survey Methodology; Cambridge Scholars Publishing: Newcastle upon Tyne, UK, 2010. [Google Scholar]
  56. Cowles, E.L.; Nelson, E. An Introduction to Survey Research; Business Expert Press: New York, NY, USA, 2015. [Google Scholar]
  57. Tuomisto, J.T.; Asikainen, A.; Meriläinen, P.; Haapasaari, P. Health effects of nutrients and environmental pollutants in Baltic herring and salmon: A benefit-risk assessment. BMC Public Health. submitted, under review.
  58. Vermeir, I.; Verbeke, W. Sustainable Food Consumption: Exploring the Consumer “Attitude—Behavioral Intention” Gap. J. Agric. Environ. Ethic 2006, 19, 169–194. [Google Scholar] [CrossRef]
  59. Terlau, W.; Hirsch, D. Sustainable Consumption and the Attitude-Behaviour-Gap Phenomenon-Causes and Measurements towards a Sustainable Development. Int. J. Food Syst. Dyn. 2015, 6, 159–174. [Google Scholar]
  60. Ministry of Agriculture and Forestry of Finland. Fish is a Climate-Friendly Choice and Pulled Herring is the Newest Fish Trend; Ministry of Agriculture and Forestry of Finland: Helsinki, Finland, 2019; Available online: https://mmm.fi/en/article/-/asset_publisher/kala-on-ilmastoystavallinen-valinta-ja-nyhtosilakka-uusin-trendituote-kalasta (accessed on 12 July 2019).
  61. Oken, E.; Choi, A.L.; Karagas, M.R.; Mariën, K.; Rheinberger, C.M.; Schoeny, R.; Sunderland, E.; Korrick, S. Which Fish Should I Eat? Perspectives Influencing Fish Consumption Choices. Environ. Health Perspect. 2012, 120, 790–798. [Google Scholar] [CrossRef] [PubMed]
Figure 1. Baltic herring consumption among fish consumers in the four countries of the case study. Baltic herring: people who eat Baltic herring; Some herring: people who do not know the type of herring they eat; Other herring: people who eat another type of herring, but not Baltic herring; Other fish: people who eat fish, but not herring. This figure does not include those who do not eat any fish.
Sustainability 11 04298 g001
Figure 2. Percentages of reasons for eating Baltic herring.
Sustainability 11 04298 g002
Figure 3. Reasons for not eating Baltic herring. Denmark and Estonia were omitted, because they had less than 20 observations.
Sustainability 11 04298 g003
Figure 4. Reasons for eating Baltic salmon.
Sustainability 11 04298 g004
Figure 5. Reasons for not eating Baltic salmon.
Sustainability 11 04298 g005
Figure 6. The influence of different determinants on potential changes in Baltic herring and salmon consumption.
Sustainability 11 04298 g006
Table 1. Overview of fish consumption and Baltic herring fisheries in the surveyed countries.
Features of InterestDenmarkEstoniaFinlandSweden
GDP per capita (2017) [48]57,400 USD20,200 USD45,900 USD52,900 USD
Consumption of fish (2016) [47]24.7 kg/per capita/year16.0 kg/per capita/year19.5 kg/per capita/year26.4 kg/per capita/year
Baltic herring catch in 2017 and percentage of the total catch [16,18]15,000 t (4%)41,000 t (11%)134,000 t (37%)65,000 t (18%)
Primary use of the Baltic herring catch [16,44,45]IndustrialFood (export)IndustrialIndustrial
Most consumed species [21,46,49,50]Salmon and North Sea herringHerring (Baltic and North Sea) and spratSalmon and tunaSalmon and cod
Strategy to deal with the dioxin problem [44,52,53,54]Use only herring from areas where the maximum dioxin level is not likely to exceed that required for human consumption.Target small (under 17 cm) herring, which is unlikely to exceed the maximum allowable dioxin level for human consumption.Exemption. Advice: children and persons at the fertile age to limit Baltic herring and salmon consumption to one to two times per month.Exemption. Advice: children and women at the childbearing age to limit consumption to two to three times per year and other consumers to ones a week.
Table 2. Statistics of the survey population in each country (DK = Denmark, EE = Estonia, FI = Finland, SE = Sweden).
Sociodemographic
Categories
Country
DKEEFISE
Number of respondents506505597503
Females (%)49544548
>45 years (%)69457161
Purchasing power: Very low (%)5273
Low (%)1619 1513
Sufficient (%)35444335
Good (%)26272529
Very good (%)137815
Excellent (%)5224
Education: Primary education (%)14379
Secondary education (%)30434449
Lower-level college (%)32222718
Higher-level college (%)24322224
Table 3. Determinants of Baltic herring consumption in the surveyed countries. Country-specific logistic regression analysis by age, gender, education and purchasing power; odds ratios (95% confidence intervals).
CountryAges > 45MaleEducationPurchasing Power
Denmark 0.28 (0.22–0.37) ***1.86 (1.01–3.49) *1.73 (0.94–3.27)1.50 (1.09–2.08) *1.05 (0.81–1.38)
Estonia 2.04 (1.58–2.64) ***1.61 (0.53–5.89)1.02 (0.39–2.66)1.58 (0.91–2.92)1.16 (0.69–2.02)
Finland (1)2.46 (1.41–4.41) **1.25 (0.72–2.18)1.54 (1.08–2.24) *1.33 (1.02–1.76) *
Sweden 0.64 (0.49–0.82) ***1.75 (0.87–3.55)1.26 (0.64–2.54)1.35 (0.92–2.06)1.35 (0.97–1.89)
* p < 0.05; ** p < 0.01; *** p < 0.001. Education and purchasing power were assumed to be linear.

