Article

Can a Blend of Amendments Be an Important Component of a Rehabilitation Strategy for Surface Coal Mined Soils?

by
Amanuel B. Abraha
*,
Eyob H. Tesfamariam
and
Wayne F. Truter
Department of Plant and Soil Sciences, University of Pretoria, Private Bag X20, Hatfield, 0028 Pretoria, South Africa
*
Author to whom correspondence should be addressed.
Sustainability 2019, 11(16), 4297; https://doi.org/10.3390/su11164297
Submission received: 27 April 2019 / Revised: 26 June 2019 / Accepted: 27 June 2019 / Published: 8 August 2019
(This article belongs to the Section Environmental Sustainability and Applications)

Abstract

:
Soil compaction impedes plant growth by negatively affecting water infiltration, soil aeration, access to soil water and nutrients, and consequently restricts root development. Previous studies to alleviate such problems in rehabilitated mine soils using a single amendment material did not provide a long lasting solution. The aim of the study was to quantify the role of different amendments in alleviating selected soil hydraulic properties. Five single amendment materials and three different blends of amendments were mixed thoroughly with degraded mine soil in a 1:3 (amendment:soil) ratio and packed in columns. Two additional unamended soils with different bulk densities were included as benchmarks. In general, the application of amendments reduced bulk density (BD) by 4–20%, enhanced infiltration rate by 15–70%, increased porosity by 5–35% and increased plant available water (PAW) by 9–33% compared with the unamended soils. Between amendments, the blends of amendments reduced BD by 9–16%, enhanced infiltration rate by 17–59%, increased porosity by 6–32%, and PAW by 4–28% compared with single amendments. The study showed that a blend of amendments have better soil restoration capacity through improving porosity, infiltration rate and plant available water. A blend of amendments therefore has the potential to be a sustainable and an important component of a rehabilitation strategy for surface coal mined soils.

1. Introduction

Mining of coal is responsible for massive amounts of land degradation through the removal of large quantities of topsoil and subsoil [1]. Such processes have been shown to negatively impact the physical [2] and chemical [3] properties of soils, and henceforth the plant production potential of soils after land reclamation [4]. Soil physical properties affect plant growth in two major ways: Compaction and consequently soil water availability. An increase in soil compaction results in a reduced infiltration rate, thereby reducing the effective rainfall while increasing surface run-off and water erosion [5]. Total porosity, which refers to the volume of soil voids that can be filled by water and/or air, is also affected by soil compaction as it is inversely related to bulk density [6]. Total porosity of soils is distributed among different pore size classes, which fulfil different roles in aeration, infiltration, drainage, and storage of water and mechanical resistance offered to root growth. The rate of infiltration is controlled by the continuity of pores or pathways [7]. Besides reducing the infiltration rate, compaction affects the pore size distribution (PSD) of a soil [8]. As a result, the plant water availability will be affected. Changes in total porosity are related with alterations in PSD. A soil with a broad range of pore size distribution retains water for a longer time making it suitable for plant growth compared with soils with narrow pore size distribution especially in areas where rainfall is erratic [9]. Addition of organic amendments to rehabilitate degraded soils has positive results by providing a conducive environment for biological activities, being a source of organic matter and nitrogen while enhancing the soil physical properties such as bulk density and porosity [10]. In a trial carried out by Ozores-Hampton et al. [11], the effect of long-term application of organic amendments was studied and concluded that it can improve physical (decrease bulk density, increase water holding capacity, and soil hydraulic properties), chemical (increase soil OM, C, pH, and ECE), and biological properties (overall soil microbial activity) of soils.
Various authors have done extensive studies to address restoration of degraded soils using different soil amendments [12,13,14]. A study carried out in Swaziland by Cele and Maboeta [12] showed a significant increase in the water holding capacity of iron mine soil treated with bio-solids. Another study by Yazdanpanah et al. [13] also showed that the application of composted solid waste increased the macro-pore fraction of a soil, leading to greater hydraulic conductivity. In the majority of the cases, the impact of these amendments was short lived (a year or two). This was mainly attributed to the decomposition of organic amendments during the first year of application [15]. The current strategies used by the South African mining industry to rehabilitate soils using liming and fertilisation did not provide enough time for the soil to restore the physical, chemical, and microbial soil function to levels that are acceptable for plants to grow sustainably [4]. This study is aimed at looking for organic amendments or blend of amendments that could improve and maintain the soil hydraulic properties for longer period while still being a source of organic matter to macro and micro fauna, which play a significant role in land rehabilitation.
To our knowledge, little is done to identify durable soil amendment materials that can improve and maintain the soil physical and chemical properties to last longer, which is critical for vegetation establishment and growth. In the present study, we hypothesize that the addition of a blend of amendments will improve the soil physical properties compared to single amendments. The overall aim of the study is to quantify the effect of a single amendment (manure alone, standard mine treatment, compost alone, lucerne alone, and grass alone) and a blend of amendments (grass + manure, grass + compost, and lucerne + manure + compost) as opposed to unamended mine soil on the bulk density, porosity, infiltration, and pore size distribution of degraded mine soil.

2. Materials and Methods

2.1. Study Site and Treatments

To investigate the effect of various soil amendments on selected soil hydraulic properties of degraded mine soil, two parallel studies were conducted; a laboratory column trial without plants and a field trial with similar amendments where grass was planted. This study reports on the laboratory column trial and was meant to determine the effect of treatments alone without contribution from plant residues and roots. The two year laboratory study was conducted in the soil physics laboratory of the University of Pretoria, Pretoria, South Africa. The soil (77% sand, 6% silt and 17% clay) was a Hutton sandy clay loam [16] (loamy, kaolinitic, mesic, Typic Eutrustox) with a pH in water of 5.18 and %C of 0.96. The soil was acquired from a surface coal mine in Mpumalanga, South Africa. For reasons of confidentiality, the exact location and name of the mine cannot be disclosed. To avoid the negative impacts of prolonged soil stockpiling, newly stripped top soil was used. The initial physical and chemical properties of the soil before stripping were not determined because the site was only accessible after top soil stockpiling.
The treatments include soil mixed with cattle manure (L1), standard local mine treatment of liming and fertilization (SMT) (L2), composted woodchips (L3), chopped lucerne hay (L4), chopped pasture grass (L5), a blend of chopped pasture grass and cattle manure (L6), a blend of chopped pasture grass and composted woodchips (L7), a blend of chopped lucerne hay, cattle manure and composted woodchips (L8). Two additional unamended soils (L9 and L10) were included as benchmarks. Treatment (L9) was packed in a similar manner as the other amendments and the second, treatment (L10) was packed to a starting bulk density of 1.6 g cm−3, which reflects a compacted soil in the old rehabilitated areas. The average length of the chopped grass and lucerne was between 2.5–3.5 cm while the size of the manure and compost was 1.5–2.5 cm. The SMT is composed of a mixture of fertiliser applied at a rate of 65 kg N ha−1 (in the form of limestone ammonium nitrate), 203 kg P ha−1 (in the form of super phosphate) and 134 kg K ha−1 (in the form of potassium chloride) and dolomitic lime (4 tons ha−1). The soil amendments were thoroughly mixed with the soil beforehand in a 1:3 (amendment:soil) ratio on volume basis according to the procedures followed by South African mine rehabilitation strategies [17]. All treatments were packed to Plexiglas soil columns (0.1 m internal diameter and 0.3 m height) to a depth of 0.25.
The Plexiglas soil columns were placed on top of engineered polystyrene base provided with a hole at middle bottom section for leachate collection. Two filter materials were placed on top of the polystyrene base to retain the soil within the soil column while allowing the soil solution to leach. The polystyrene bases were connected to suction tubes and Schott bottles to collect drained solution. The amended soil was then packed to a height of 0.25 m on a volume basis by continuously tapping on a bench. The study was laid out in a completely randomized block design (CRBD) with ten treatments of four replications. After packing, all columns received one pore volume of water once a week that was calculated from the bulk density and porosity. Water was applied to represent the rainy season of the Pretoria area for four months [18] and no water was applied for the next eight months to represent the dry season. The same strategy of water application was followed for the second year of the study. The amount of water applied to get one pore volume for each treatment was continuously adjusted based on the real time calculated bulk density. Soil bulk density (BD) was calculated from the weight of the oven-dry soil and total soil volume. Porosity was determined from dry bulk density and particle density, assumed to be 2.65 g cm−3.

2.2. Infiltration and Hydraulic Conductivity

Mini disk infiltrometer, (Campbell Pacific Nuclear, California, USA) with a disk radius of 2.25 cm, was used to calculate infiltration rate and unsaturated hydraulic conductivity (K) at a suction pressure head of 2 cm. This was done twice a year (June and December) over a two-year period. The data collected in each of the columns were used to determine the water infiltration rates of the soil. The hydraulic conductivity of soil in the column was then calculated using the method of Zhang [19]. The method requires measuring cumulative infiltration versus time and fitting the results with the function (Equation (1)):
I = C 1 t + C 2 t ,
where C1 (L T−1) and C2 (L T−1/2) are parameters related to hydraulic conductivity and soil sorptivity respectively, I (L) is the cumulative infiltration, and t (T) is the time. The hydraulic conductivity of the soil (K) was then computed from (Equation (2)):
K ( h ) = C 1 A ,
where C1 is the slope of the curve of the cumulative infiltration versus the square root of time, and A is a value (A = 4.2529) relating to the van Genuchten [20] parameters for a given soil type to the suction rate and radius of the infiltrometer disk (Mini disk infiltrometer manual).

2.3. Soil Water Retention Curve and Pore Size Distribution

After the two years of wet and dry cycle studies, destructive soil core samples were taken from each treatment at two levels, upper layer (0–5 cm) and lower layer (below 5 cm) based on the visible changes in compaction that was seen through the Plexiglas soil columns. Once the upper layer (0–5 cm) was removed, hydraulic conductivity measurements were taken on the lower layer (below 5 cm) and compared with the hydraulic conductivity readings of the upper layer. The soil core samples of both layers (upper and lower layer) were then wetted through capillarity to saturation for 48 h. Matric potential (ψm) and the corresponding volumetric water content (θ) measurements were collected at the following pressure heads (h) 0.5, 1, 2, 3, 5, 10, 33, 50, and 100 kPa using control flow cells and 200, 300, 500, 700, and 1000 kPa using pressure plates. Soil water retention curves (SWRCs) were developed using the van Genuchten equation (Equation (3)) of the RETC program [21] with the Mualem restriction (m = 1 − 1/n) [22] from volumetric water content readings collected at various matric potential readings.
θ ( h ) = θ r + ( θ s θ r ) [ 1 + ( α h ) n ] m ,
where θr and θs are residual and saturated soil water contents respectively, h is the soil water potential head and α, n, and m are empirical parameters that govern the shape of the Soil Water Retention Curve (SWRC). The hydraulic capacity function (Cw) was then derived from the SWRC, which represents the slope of the SWRC, using Equation (4).
C w ( h ) = α n ( θ s θ r ) m n ( h ) n 1 [ 1 + ( α h ) n ] m + 1 ,
Water pressure heads were converted to the pore radii (r) using the relation r = 1490/h, with r and h given in μm and cm, respectively [23]. Pore size distribution recommended by Luxmoore [24], who categorized pores into three classes: Macro-pores (>1000 μm diameter), meso-pores (10–1000 μm diameter), and micro-pores (<10 μm diameter) were used.

2.4. Statistical Analyses

Where applicable, Restricted Maximum Likelihood (REML), or linear mixed model, repeated measurement analysis was used on bulk density over five dates every six months, and on the unsaturated hydraulic conductivity over four dates every six month testing for differences between the 10 treatments, months and treatment by month interaction effects, allowing for changes in variation over months. Means were compared using the Tukey’s Studentized (HSD) range (p < 0.05), as the variances were heterogeneous [25]. Data were analysed using the statistical program GenStat® [26]. Porosity was analysed using standard ANOVA of the Statistical Analysis System (SAS) program for Windows (version 9.3, SAS Institute, Inc., Cary, NC, USA).

3. Results

3.1. Bulk Density

As the columns were packed on a volume basis, the bulk densities of all treatments differed at the beginning of the trial. When data were combined for both years, there was a significant (p < 0.01) month x treatment interaction for bulk density (Table 1). The month x treatment interaction shows generally similar bulk density ranking of soil amendment treatments for each year. This shows that the interaction was primarily caused by magnitude bulk density differences between years. This interaction occurred mainly because bulk density increased with time (Table 2).
Among treatments, treatment L8 (lucerne + manure + compost) had the lowest bulk density in each year. The bulk density readings for treatment L8 were 11.5%, 12.3%, 12.1%, 12.7%, and 12.7% lower than L2 (standard mine treatment) over the five sampling dates. The other treatments which maintained relatively lower bulk density compared with the standard mine treatment were L6 (grass + manure) and L7 (grass + compost), despite similar initial values. However, the difference was not statistically different. On the other hand, the bulk density of the manure treatment (L1) were 1.4%, 2.9%, 4.3%, 4.2% and 6.3% higher than L2 (standard mine treatment) over the five sampling dates. It can be noted that in the first sampling date (Dec 2013), the difference was not statistically significant (Table 2). At the end of the two-year study period, the bulk density of the manure treatment (L1) increased from 1.37 g cm−3 to 1.51 g cm−3, and the highest increase was 10.4%. The second highest increase of 7.8% in the bulk density was observed in the soil only treatment, where no amendment was added. Surprisingly, the compost (L3), lucerne (L4), and grass (L5) treatments recorded bulk densities higher than the standard mine treatment (L2). This was totally unexpected as the amendment materials in these treatments were coarse materials, having a lightweight, but bulkier volume.

3.2. Soil Water Retention Curve and Total Porosity

Soil water retention curves for all the treatments are shown in Figure 1 and the fitted parameters for the van Genuchten equation using RETC program for the upper and lower layers are shown in Table 3. Saturated volumetric water content was highest for soils treated with a blend of amendments, namely L8 (0.457 m3 m−3 upper layer; 0.494 m3 m−3 lower layer), followed by L7 (0.426 m3 m−3 upper layer; 0.413 m3 m−3 lower layer) and L6 (0.417 m3 m−3 upper layer; 0.414 m3 m−3 lower layer) treatments (Table 3). All other treatments had saturated volumetric water contents of less than 0.40 m3 m−3 with the lowest value recorded for the compacted treatment, L10, (0.269 m3 m−3 upper layer; 0.244 m3 m−3 lower layer), which represents the bulk density of most rehabilitated mine soils, followed by soil alone left to settle naturally, L9, (0.294 m3 m−3 upper layer; 0.314 m3 m−3 lower layer), and standard mine treatment, L2, (0.285 m3 m−3 upper layer; 0.322 m3 m−3 lower layer). The air entry value (hA) of the manure treatment (L1) was higher in the upper layer than in the lower layer (Figure 1a). The air entry value (hA) of both layers in the L2, L9, and L10 treatments was also high (Figure 1b,i,j). Plant available water (PAW) was highest in the treatments ameliorated with a blend of amendments (L6, L7, and L8) for both layers (Table 3), while treatments L2, L9, and L10 recorded the lowest PAW.

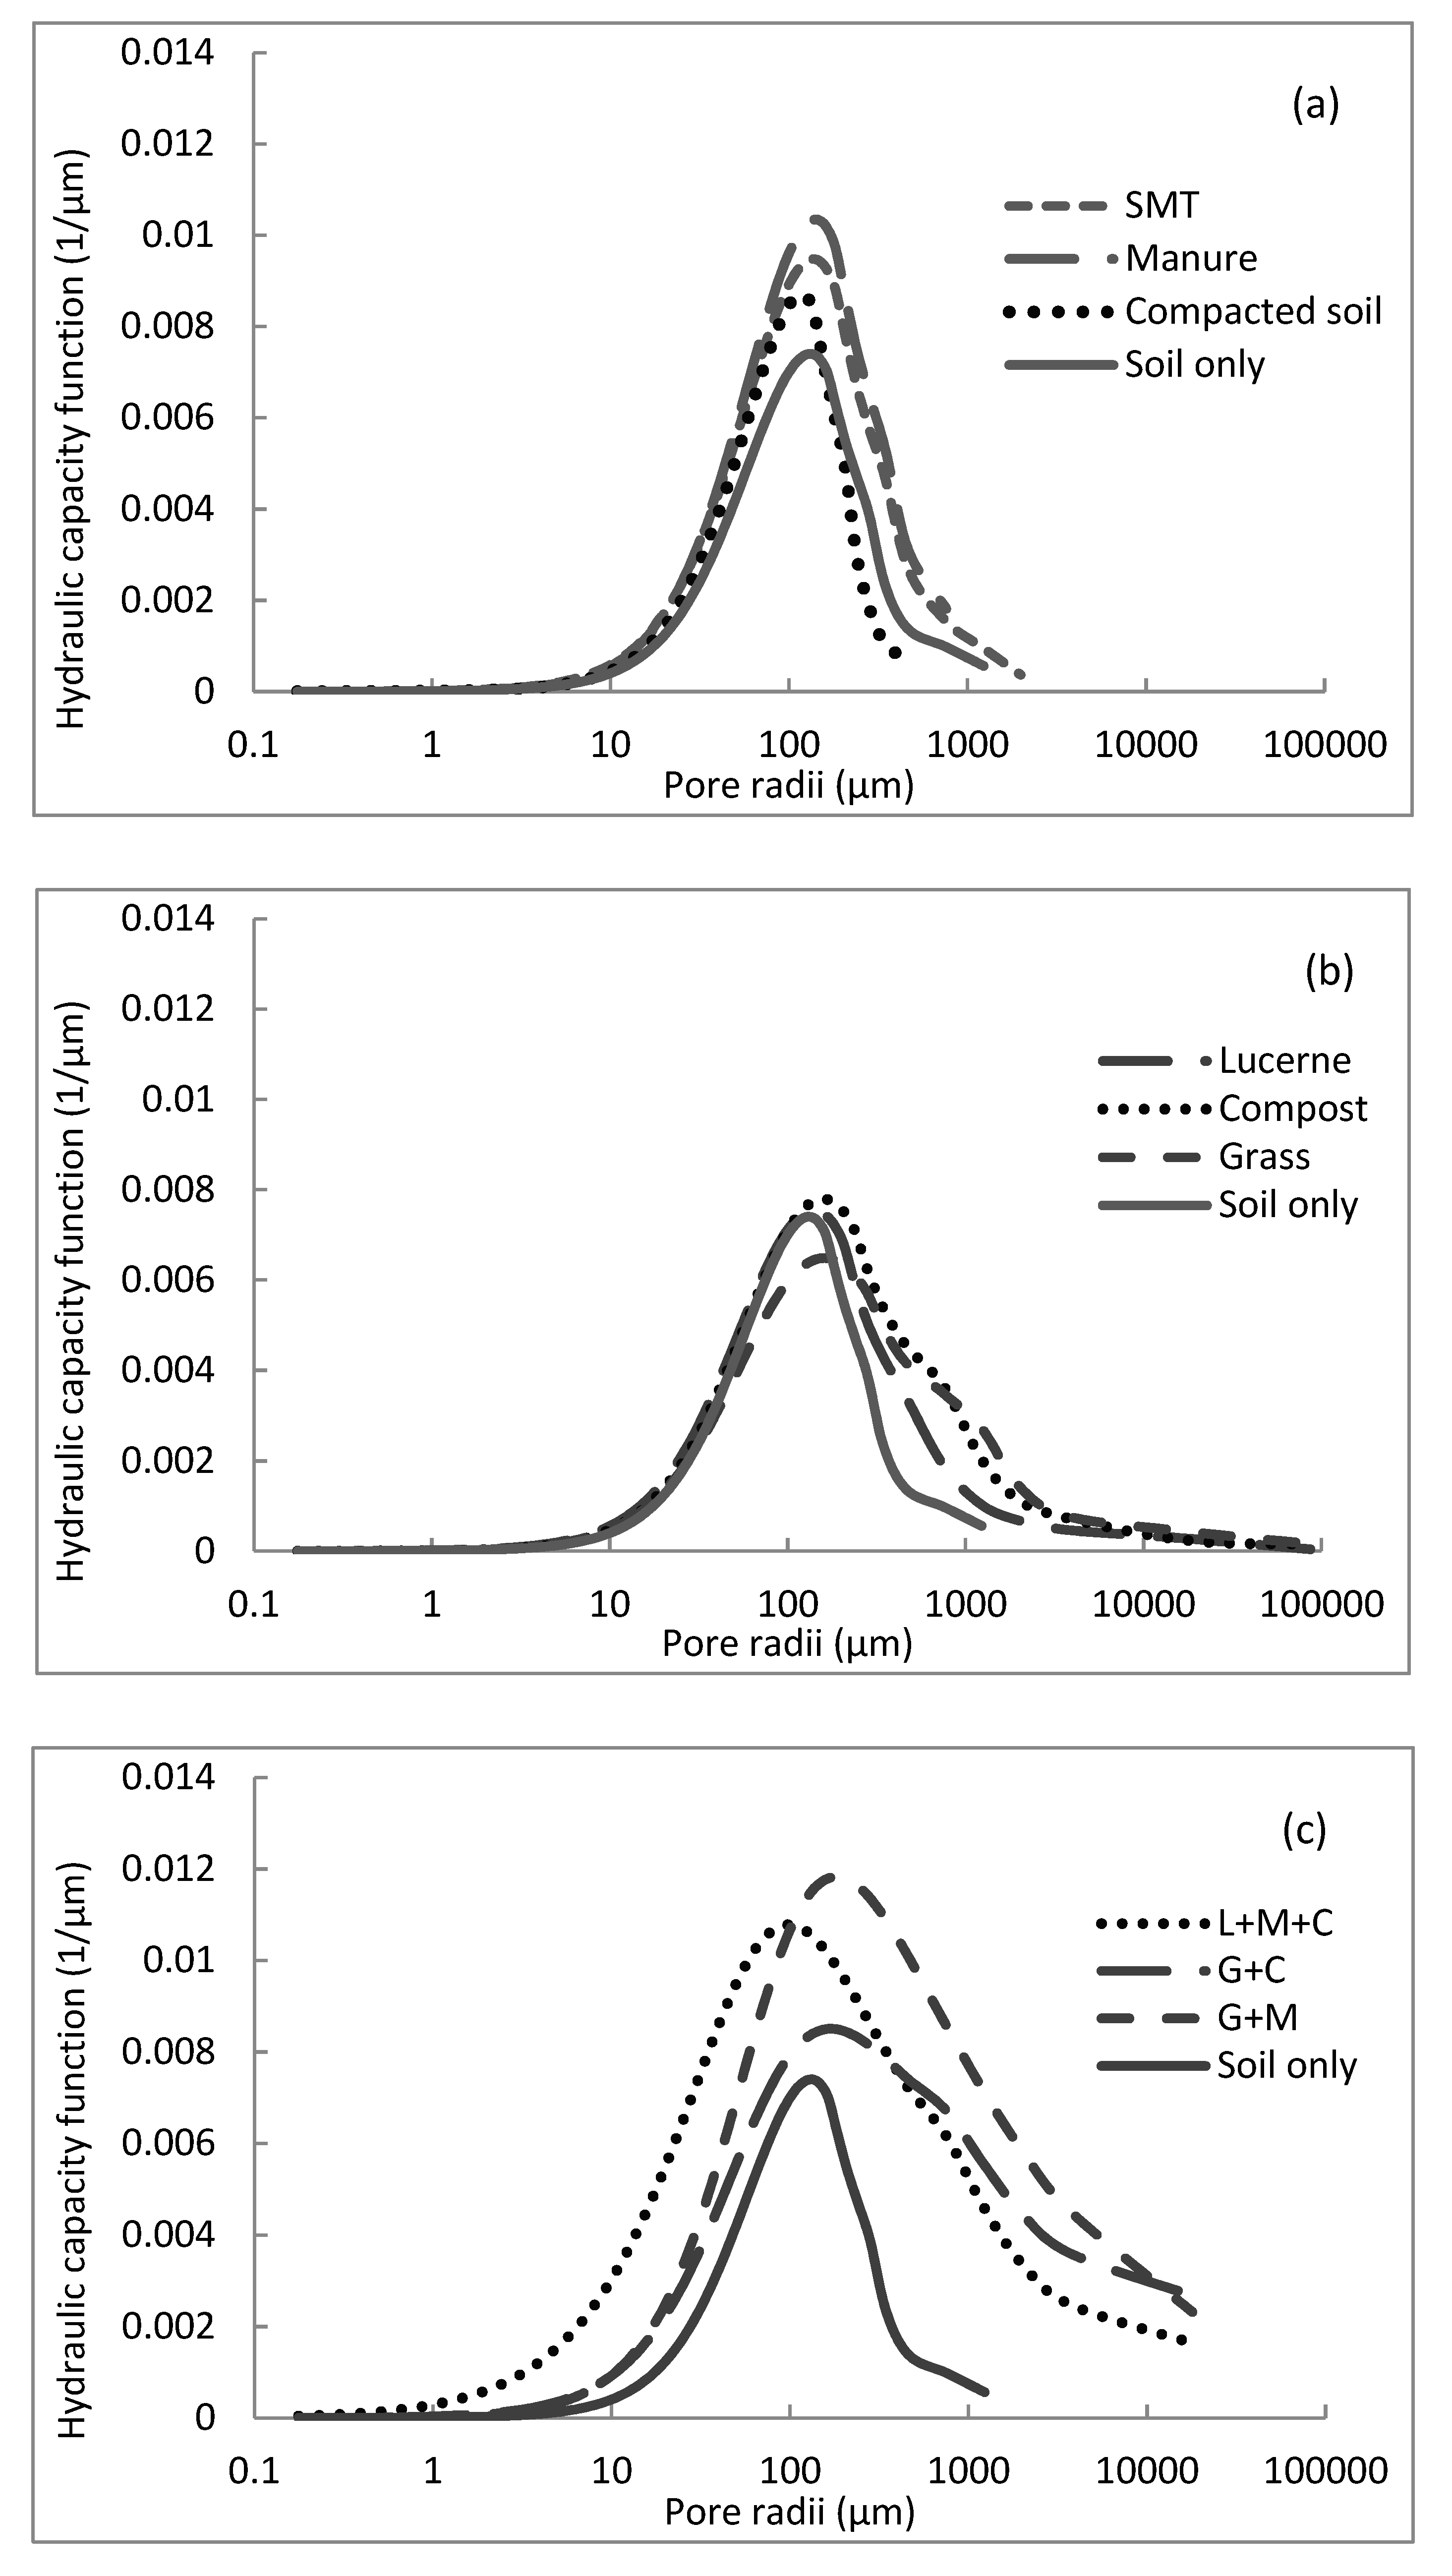
3.3. Pore Size Distribution

Results of the pore size distribution of the different treatments are shown in Figure 2 and Figure 3. In all the treatments, it was apparent that the meso-pores dominated the total porosity accounting for 50 to 66% of the total porosity (Figure 2). Generally, the addition of amendments lowered the proportion of micro-pores by 40% in the upper layer (Figure 2a) and 50% in the lower layer (Figure 2b) of the soil column. The decline was higher in the blend of amendments (L6, L7, and L8), where the proportion of micro-pores decreased by more than 60% compared with the unamended treatments. The observed decline in the proportion of micro-pores in amended treatments was mainly as a result of the relative increase in the proportion of macro and meso-pores. The application of blend of amendment (L6, L7 and L8) increased the proportion of macro-pores by 125% (mean upper layer (UL) and lower layer (LL)) and 530% (mean UL and LL) compared with L9 and L10, respectively. While the application of single amendment (L3, L4, and L5) increased the proportion of macro-pores by 75% (mean UL and LL) and 390% (mean UL and LL) compared with L9 and L10, respectively. Similarly, the application of amendment increased the proportion of meso-pores by 19% (single amendment) and 3% (blend amendment) compared with unamended soil (L9 and L10). It is apparent from this study that the application of amendments played significant role in enhancing the proportion of macro-pores while lowering the fraction of micro-pores. Among amended treatments, L8 had the highest proportion of macro-pores (35%, mean of UL and LL) while L1 and L2 had the least (16% mean of UL and LL). The proportion of macro-pores in the unamended soils was 14% (mean of UL and LL) for the soil only (L9) treatment and 5% (mean of UL and LL) for the compacted soil (L10) treatment. The proportion of macro-pores in the lower layer of each amended treatment (L1 to L8) was relatively higher than the upper layer.

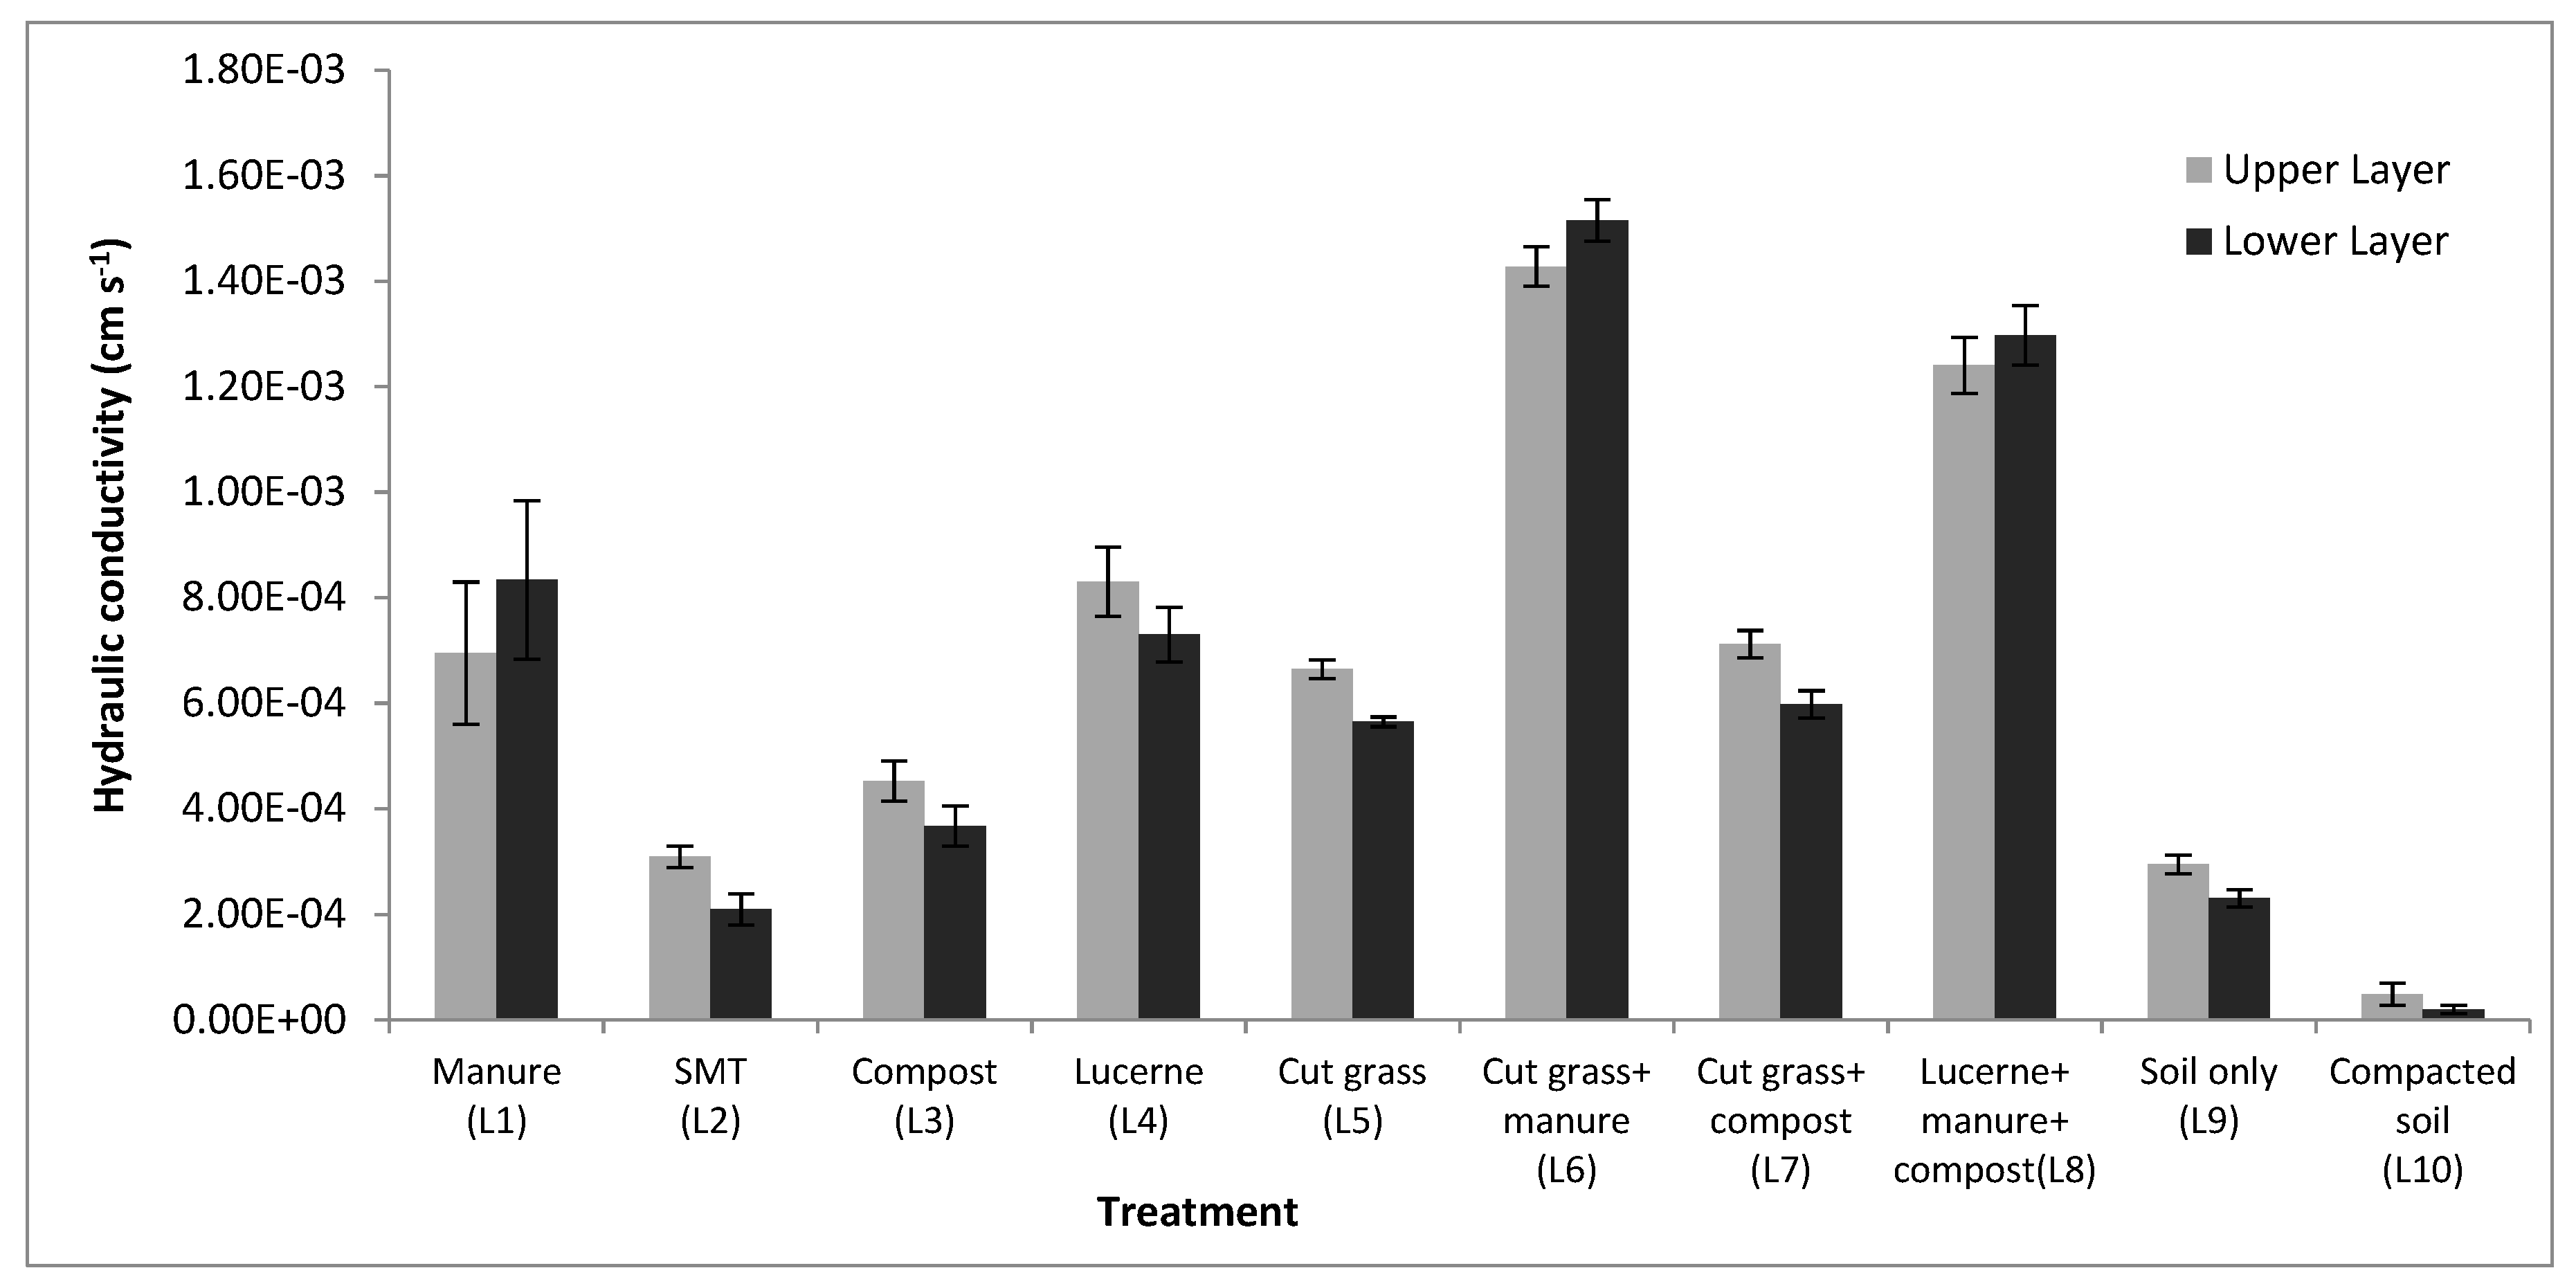
3.4. Infiltration and Hydraulic Conductivity

When data were combined for both years, there was a significant (p < 0.01) month x treatment interaction for cumulative infiltration (Table 4). The month x treatment interaction shows generally similar cumulative infiltration ranking of soil amendment treatments for each year (Table 5). This shows that the interaction was primarily caused by magnitude cumulative infiltration differences between years. With the exception of treatment L2, all amendments increased cumulative infiltration twice and higher than the unamended soils (L9 and L10). Columns treated with a blend of amendments recorded the highest (p < 0.01) cumulative infiltration of above 4 cm, with the L8 treatment (Lucerne + manure + compost) recording the highest (p < 0.01) infiltration of 4.94 cm.
Hydraulic conductivity of a soil can indicate the water infiltration rates when applied to a particular field or soil type. Measurements using mini disk infiltrometer at 2 cm suction showed that the hydraulic conductivity was significantly (p < 0.01) higher for treatments L1, and L4–L8 compared with the unamended L9 and L10 treatments (Table 6). The hydraulic conductivity for these treatments was more than 2.4 times higher than L9 and more than 14 times higher than L10.
Towards the end of the study, hydraulic conductivity measurements were conducted both in the upper 5 cm and below 5 cm layers (Figure 4). There was no significant hydraulic conductivity difference (p > 0.05) between the two layers except for the manure (L1) treatment. The lower layer of the L1 treatment was significantly higher (p < 0.05) than that of the upper layer.

4. Discussion

4.1. Bulk Density

The bulk density of soils varies based largely on soil texture and the degree of soil compaction. To characterize the state of compaction of a soil layer, bulk density and total porosity are the most frequently used parameters. Generally, bulk density increased as time progressed as a result of natural settling of the soil, with the highest bulk density for each treatment recorded at the end of the study period. Maintaining an adequate amount of organic matter stabilizes soil structure and makes it more resistant to degradation and decreases bulk density and soil strength [2]. However, the rate at which the organic matter decomposes is of great importance in stabilizing the soil structure. The bulk density of the manure treatment (L1) increased in a short period mainly due to the faster decomposition rate of manure. After decomposition, the soil compacted easily leading to an increase in the soil bulk density. According to Esse at al. [27], the application of water to soils treated with manure enhances the breakdown of the available organic matter. As water was applied to all treatments in this study, this could have helped in speeding up the decomposition of the manure in the L1 treatment. Generally, organic components in soil amendments have a dilution effect that result in decreasing soil bulk density [28]. In our study, the treatment with the blend of amendments (L8) recorded a lower soil bulk density because of the dilution effect of the organic component in the amendment. Compost decomposes at a slower rate than manure [29]. The presence of compost in the mixture of the L8 treatment helped maintain the lower bulk density recorded in the treatment. This confirms that the addition of slow decomposing amendments can reduce the rate of compaction over time.

4.2. Soil Water Retention Curves and Total Porosity

A soil water retention curve describes the relationship between the soil’s volumetric water content and soil water tension [21]. The air entry value (hA) of the manure treatment (L1) was higher in the upper layer than in the lower layer (Figure 1a), indicating a broad air entry region. This suggests that the manure in upper layer decomposed at a faster rate relative to that of the lower layer resulting in the soil to compact easily. The air entry value (hA) of both layers in the L2, L9 and L10 treatments was also high (Figure 1b,i,j), indicating that the soil was compacted as all had a broad air entry region in the SWRC. The capillary region, which is related to the plant available water, experienced a sharp drop in the gradient of the curve for treatments L2, L9, and L10 (Figure 1b,i,j). In contrast, treatments that had a blend of amendments (L6, L7, and L8) had a gentle capillary region slope (Figure 1f–h). The slope of a retention curve provides a measure of the rate at which water drains from the soil when the suction pressure is increased from the air entry value to the residual water content [9]. This indicates that plants growing under treatments L2, L9, and L10 will experience water deficit earlier due to lower water storage capacity compared with those planted under treatments L6, L7, and L8. Organic matter causes the soil to clump and form aggregates, improving the structure of the soil and its ability to store more water, thereby improving the volumetric water content of the soil. In a study carried out by Minasny and McBratney [30], the addition of 1% organic carbon increased soil water content by 2.95, 1.61, 0.17, and 1.16% at saturation, field capacity, wilting point, and available water capacity, respectively. When the organic matter in the soil decomposes, the soil loses its structure as a result of the decrease in the number of water stable soil aggregates [31], hence severely affecting porosity. This leads to compaction and decreases the water holding capacity of the soil.
In the present study, soils treated with amendments had higher volumetric water content than the untreated soils. This is in agreement with studies conducted by Mi et al. [32], who reported a significant improvement in soil physical properties and soil water content in soils amended with bentonite. The addition of amendments significantly reduced soil bulk density (Table 2). This increased pore spaces in the soil, allowing the soil to retain more water. Compaction of soil reduces the soil’s capacity to store water, which is mainly dependant on soil porosity. Half of a healthy soil’s makeup is pore space, with the other half composed of the solid phase (mineral particles and organic matter) [33]. The addition of amendments in the current study improved total porosity. This is in line with studies carried out by Celik et al. [34] who reported that the addition of manure and compost improved total porosity by 18% and 24%, respectively, through the formation of soil aggregation. Pore space provides room for air and water to circulate between and around the mineral particles, providing a healthy environment for plant roots and beneficial micro-organisms. However, in compacted and less porous soils, the particles are pressed together so tightly that the space for air and water is greatly reduced.

4.3. Pore Size Distribution

Pore size distribution of a soil is the relative abundance of each pore size found in a given volume of soil [35]. All treatments were characterized as uni-modal, expressed by the existence of one inflection point on the retention curve, which coincides with the peak on the derivative curve of the PSD to the retention curve [36]. Almost half of the pores for the manure (L1) and SMT (L2) treatments had pore radii of 40–500 μm while the compacted soil treatment, L10, recorded a larger proportion of the pore radii in the range of 50–250 μm (Figure 3a), indicating a very low proportion of macro-pores. In comparison, a larger proportion of the pore radius for the soil only (L9) treatment was in the range of 40–350 μm. This result corroborates well with the shape of the soil water retention curve for these treatments. The SWRC of the L1, L2, L9 and L10 treatments showed a sharp drop in the capillary region of the curve (Figure 1), which reflects the pore size distribution. The compacted treatment (L10), which reflects the current state of rehabilitated mine lands, had higher relative volume of pores of radius 150 μm and lower relative volume of pores of radius 150 μm and higher compared with soil only, which was left to settle naturally (L9). In contrast, the application of SMT and manure increased the volume of pores of each radii compared with L9. The range of the pore sizes in these treatments represents meso-pores (10–1000 μm) [24]. These pores, also referred to as storage pores [37], are responsible for storing water for plant and micro-organisms. Hence, having high proportion of these pores will increase the plant available water.
A larger proportion of the pore radii for the other single amendment treatments were: between 40–1200 μm for compost (L3), 50–1000 μm for lucerne (L4) and 60–1400 μm for grass (L5) (Figure 3b). This indicates that treatments L3, L4 and L5 had increased proportion of macro-pores when compared to treatments L1, L2, L9 and L10. It is apparent from Figure 3b that treatments L3, L4, and L5 increased the relative volume of pores of radius of 136 μm and higher compared with L9, but had little effect on pores lower than this radius. The only exception was for soils amended with grass alone, which had relatively lower volume of pores of radius between 147–183 μm compared with L9.
A larger proportion of the pores for the blend of amendments (L6, L7, and L8) (Figure 3c) were within the pore radii range of 10–3500 μm. Pores in this range (>1000 μm) are called macro-pores [24]. These pores, also referred to as transmission pores [37], have useful effect on root penetration and water movement. The result indicates that the proportion of the macro-pores in these treatments was considerably higher when compared to the single amendment treatment where the greater range of the pore radii was in the range of 40–1400 μm. Unlike the single amendments of L3, L4, and L5, the blend of amendments increased the relative volume of pores of all radii. The increment was much higher than that of L1 and L2. The contribution to the increase in the relative volume of soil pores (compared with L9) was more deviated to a radii of >150 μm for L7, and radii of >100 μm for L6, while L8 increased the proportion of the relative volume of pores of all radii almost proportionally.
The observed increase in the relative volume of pores in the meso-pore radii (10–1000 μm) was therefore the reason for the increase in PAW for treatments L3, L4, L5, L6, L7, and L8 (Table 3) compared with L1, L2, L9, and L10. Among the blend of amendments, L8 had the highest PAW (130 mm m−1), mainly because of the higher relative volume of pores in the meso-pore radii, especially between 10–100 μm, compared with other treatments. In the current study, pore size distribution was altered by organic amendments. This is supported in previous studies as Pagliai and Vittori Antisari [38] stated that both micro-porosity and macro-porosity increased with the application of livestock manure or compost.

4.4. Infiltration and Hydraulic Conductivity

The infiltration capacity, defined as the maximum rate at which water can be absorbed by soil, decreases rapidly over time [39]. The interaction that occurred between month x treatment is mainly because cumulative infiltration decreased with time as a result of the increase in the bulk density (Table 2). Cumulative infiltration decreased with time with the lowest infiltration for each treatment recorded at the end of the study period (Table 5). This is in line with the studies carried out by Horton [39]. Generally, amended soils had higher cumulative infiltration compared with untreated soils of L9 and L10. Columns treated with a blend of amendments recorded the highest (p < 0.01) cumulative infiltration. This is mainly due to the increase in the proportion of macro-pores both in the upper and lower layers compared with all other treatments (Figure 2). Macro-pores play an important role in the infiltration rate of soils [40]. Previous studies showed that water infiltration was severely reduced in structure-less, compact and degraded soils [41]. The results from this study are in line with previous studies [41] as L9 and L10 recorded low infiltration rates mainly due to the very low proportion of macro-pores and high proportion of micro-pores both in the upper and lower layers (Figure 2). The low infiltration rate recorded from L9 and L10 has negative implications on the effective rain (rainfall minus runoff), while an increase in the infiltration rate of the amended treatments indicate improvement in the effective rain. The increase in hydraulic conductivity in the amended materials was caused by the presence of higher proportion of macro-pores (Figure 2 and Figure 3b,c) as a result of reduced bulk density. Saturated hydraulic conductivity typically increases with decreasing bulk density [13]. In contrast, the unamended treatments of L9 and L10 had higher bulk density, lower percentage of macro-pores and higher proportion of micro-pores (Figure 3a), hence lower hydraulic conductivity. The reported increase in hydraulic conductivity of the amended treatments is in agreement with the results obtained by Miranda et al. [42], who reported that the addition of amendments to degraded soils increases the hydraulic conductivity because of the consequential increase in the proportion of macro-pores, which are mainly responsible for water movement in saturated soils. It is interesting to note that the saturated hydraulic conductivity of the grass + manure (L6) amendment was highest despite having lower total porosity than the lucerne + manure + compost (L8). This is due to the highest relative volume of pores in the macro-pore radii (>1000 μm) compared with all other treatments. When the hydraulic conductivity of the upper 5 cm and below 5 cm layers was compared, a significant difference was observed in the manure (L1) treatment. The reason for this is the relatively faster decomposition of the manure when exposed to higher temperature experienced on the soil surface than the lower layers.
In summary, at the end of the two year study, the treatments with a single amendment recorded higher soil bulk densities than those treatments with a blend of amendments as shown in Table 2. The higher soil bulk density had an effect on the porosity and soil water retention, as less water was retained in the treatments with a single amendment. The effect of the higher soil bulk density was clearly shown in the pore size distribution as those treatments with higher soil bulk densities had relatively more micro-pores and few macro-pores (Figure 2). The compacted soil (L10), which was characterized by higher bulk density, had the least PSD and fewer macro-pores. Macro-pores are important for soil aeration and are generally referred to as transmission pores [40,43] through which water moves freely under gravity. These pores are important in soil-plant-water relationships and maintaining good soil structure [44]. Considering this, crops planted to L1, L2, L9, and L10 treatments will suffer from shortage of water and the roots will find it difficult to penetrate the soil [45]. The compost (L3), lucerne (L4), and grass (L5) treatments, however, had more macro-pores compared with L1, L2, L9, and L10 treatments (Figure 2). The reason is due to the bulkier and slower degradability rate of the amendment material which increased the total volume of the soil, thereby decreasing the bulk density and increasing total porosity, especially the macro-pore fraction. When compared to the L9 treatment, the L3, L4, and L5 treatments had a larger proportion of macro-pores (Figure 2), which could help plants grown in such soils to a better access to water and deeper root penetration. All of the above effects (bulk density, porosity, soil water retention, and pore size distribution) played an important role in the infiltration rate. Treatments with a single amendment recorded lower infiltration rates. If the infiltration rate is low, there will be an increase in run-off losses, thereby decreasing the effective rainfall. Clearly, the blend of amendments performed better than the other treatments in terms of their bulk densities, porosity and pore size distribution. Observing the shape of the retention curve (especially in the capillary region of the curve) for the blend of amendments (Figure 1), the slope of the curve was generally gentle than other treatments indicating higher pore size distribution. A higher pore size distribution is an indication of higher plant available water storage as the water will be stored in a gradient of pore sizes, which will be released gradually as the matric suction increases.

5. Conclusions

Grass growth in reclaimed mined soils has been, to a large extent, unsuccessful despite various interventions including fertilization mainly due to the deterioration of the soil physical properties. A two-year study showed that standard mine treatment does not last long as observed also on the ground in reclaimed lands. Amelioration with a blend of amendments was able to improve soil physical properties that include reducing the soil bulk density by 12–18%, decreasing air entry value by 6–12%, increasing plant water availability by 35–40%, and increasing infiltration rate by 24%. The inflection points for the pore distribution frequency of the treatments with a blend of amendments were higher when compared to the untreated soil, suggesting an increase in the volume of storage and transmission pores. The addition of a blend of amendments generally improved the soil bulk density, porosity, pore size distribution and plant available water to levels that would be more favourable to plant development.

Author Contributions

Conceptualization, W.T.; Formal analysis, A.A.; Funding acquisition, W.T.; Investigation, A.A.; Methodology, A.A. and E.T.; Project administration, W.T.; Supervision, E.T. and W.T.; Writing—original draft, A.A.; Writing—review & editing, E.T. and W.T.

Funding

This research was funded by Coaltech Research Association (Project title: COMPACTION ALLEVIATION/MITIGATION RESEARCH INITIATIVE: Prevention of Soil Compaction through Top Soil/Sub Soil Preservation before placement as a growth medium for a vegetation cover), grant number 8.2.4.

Acknowledgments

The authors are grateful to Marie Smith for helping with the statistical analysis. The help of the anonymous reviewers in editing of the article is also acknowledged.

Conflicts of Interest

The authors declare no conflict of interest.

References

  1. Rocha-Nicoleite, E.; Overbeck, G.; Müller, S. Degradation by coal mining should be priority in restoration planning. Perspect. Ecol. Conserv. 2017, 15, 202–205. [Google Scholar] [CrossRef]
  2. Dejun, Y.; Zhengfu, B.; Shaogang, L. Impact on soil physical qualities by the subsidence of coal mining: A case study in Western China. Environ. Earth Sci. 2016, 75, 652–665. [Google Scholar] [CrossRef]
  3. Neina, D.; Buerkert, A.; Joergensen, R. Effects of land use on microbial indices in tantalite mine soils, Western Rwanda. Land Degrad. Dev. 2016, 28, 181–188. [Google Scholar] [CrossRef]
  4. Mushia, N.; Ramoelo, A.; Ayisi, K. The impact of the quality of coal mine stockpile soils on sustainable vegetation growth and productivity. Sustainability 2016, 8, 546–558. [Google Scholar] [CrossRef]
  5. Berisso, F.E.; Schjønning, P.; Keller, T.; Lamande, M.; Etana, A.; de Jonge, L.W.; Iversen, B.V.; Arvidsson, J.; Forkman, J. Persistent effects of subsoil compaction on pore size distribution and gas transport in a loamy soil. Soil Tillage Res. 2012, 122, 42–51. [Google Scholar] [CrossRef]
  6. Lipiec, J.; Kus’, J.; Słowin´ska-Jurkiewicz, A.; Nosalewicz, A. Soil porosity and water infiltration as influenced by tillage methods. Soil Tillage Res. 2006, 89, 210–220. [Google Scholar] [CrossRef]
  7. Kutı´lek, M. Soil hydraulic properties as related to soil structure. Soil Tillage Res. 2004, 79, 175–184. [Google Scholar] [CrossRef]
  8. Czyz, E.A. Effects of traffic on soil aeration, bulk density and growth of spring barley. Soil Tillage Res. 2004, 79, 153–166. [Google Scholar] [CrossRef]
  9. Fredlund, D.G.; Houston, S.L. Interpretation of soil-water characteristic curves when volume change occurs as soil suction is changed. In Advances in Unsaturated Soils; CRC Press: Boca Raton, FL, USA, 2013; pp. 15–31. [Google Scholar]
  10. Pant, P.K.; Ram, S. Long-term manuring and fertilization effects on soil physical properties after forty two cycles under rice-wheat system in North Indian Mollisols. Int. J. Curr. Microbiol. App. Sci. 2018, 7, 232–240. [Google Scholar] [CrossRef]
  11. Ozores-Hampton, M.; Stansly, PA.; Salame, TP. Soil chemical, physical, and biological properties of a sandy soil subjected to long-term organic amendments. J. Sustain. Agric. 2011, 35, 243–259. [Google Scholar] [CrossRef]
  12. Cele, E.C.; Maboeta, M. A greenhouse trial to investigate the ameliorative properties of biosolids and plants on physicochemical conditions of iron ore tailings: Implications for an iron ore mine site remediation. J. Environ. Manag. 2016, 165, 167–174. [Google Scholar] [CrossRef] [PubMed]
  13. Yazdanpanah, N.; Mahmoodabadi, M.; Cerdà, A. The impact of organic amendments on soil hydrology, structure and microbial respiration in semiarid lands. Geoderma 2016, 266, 58–65. [Google Scholar] [CrossRef]
  14. Mohammadshirazi, F.; McLaughlin, R.; Heitman, J.; Brown, V. A multi-year study of tillage and amendment effects on compacted soils. J. Environ. Manag. 2017, 203, 533–541. [Google Scholar] [CrossRef] [PubMed]
  15. Sánchez, Ó.; Ospina, D.; Montoya, S. Compost supplementation with nutrients and microorganisms in composting process. Waste Manag. 2017, 69, 136–153. [Google Scholar] [CrossRef] [PubMed]
  16. Soil Classification Working Group. Soil Classification: A Taxonomic System for South Africa; Department of Agriculture Development: Pretoria, South Africa, 1991. [Google Scholar]
  17. Truter, W.F.; (University of Pretoria, Pretoria, South Africa). Personal communication, 2013.
  18. Dyson, L.L.; Van Heerden, J.; Marx, H.G. Short-Term Forecasting Techniques for Heavy Rainfall; WRC Report No. 1011/1/02; Water Research Commission: Pretoria, South Africa, 2002. [Google Scholar]
  19. Zhang, R. Determination of soil sorptivity and hydraulic conductivity from the disk infiltrometer. Soil Sci. Soc. Am. J. 1997, 61, 1024–1030. [Google Scholar] [CrossRef]
  20. Van Genuchten, M.T. A closed-form equation for predicting the hydraulic conductivity of unsaturated soils. Soil Sci. Soc. Am. J. 1980, 44, 892–898. [Google Scholar] [CrossRef]
  21. Van Genuchten, M.T.; Leij, F.J.; Yates, S.R. The RETC Code for Quantifying the Hydraulic Functions of Unsaturated Soils; Document EPA/600/2-91/065; US Salinity Laboratory, USDA: Riverside, CA, USA, 1991; p. 85.
  22. Mualem, Y. Hydraulic conductivity of unsaturated soils: Prediction and formulas. In Methods of Soil Analysis. I. Physical and Mineralogical Methods; Soil Science Society of America; American Society of Agronomy: Madison, WI, USA, 1986; Volume 9, pp. 799–823. [Google Scholar]
  23. Kutı´lek, M.; Nielsen, D.R. Soil Hydrology; Catena Verlag: Cremlingen, Germany, 1994. [Google Scholar]
  24. Luxmoore, R.J. Micro-, meso-, and macro-porosity of soil. Soil Sci. Soc. Am. J. 1981, 45, 671–672. [Google Scholar] [CrossRef]
  25. Snedecor, G.W.; Cochran, W.G. Statistical Methods, 7th ed.; Iowa State University Press: Iowa City, IA, USA, 1980; p. 507. [Google Scholar]
  26. Payne, R.W.; Murray, D.A.; Harding, S.A.; Baird, D.B.; Soutar, D.M. Introduction to Genstat ® for Windows ™, 18th ed.; VSN International: Hemel Hempstead, UK, 2015. [Google Scholar]
  27. Esse, P.C.; Buerkert, A.; Hiernaux, P.; Assa, A. Decomposition of and nutrient release from ruminant manure on acid sandy soils in the Sahelian zone of Niger, West Africa. Agric. Ecosyst. Environ. 2001, 83, 55–63. [Google Scholar] [CrossRef] [Green Version]
  28. Bronick, C.J.; Lal, R. Soil structure and management: A review. Geoderma 2005, 124, 3–22. [Google Scholar] [CrossRef]
  29. Al Chami, Z.; Bou Zein Eldeen, S.; Al Bitar, L.; Atallah, T. Decomposition of olive-mill waste compost, goat manure and Medicago sativa in Lebanese soils as measured using the litterbag technique. Soil Res. 2016, 54, 191–199. [Google Scholar] [CrossRef]
  30. Minasny, B.; McBratney, A.B. Limited effect of organic matter on soil available water capacity. Eur. J. Soil Sci. 2017, 69, 39–47. [Google Scholar] [CrossRef] [Green Version]
  31. Tisdall, J.M.; Oades, J.M. Organic matter and water-stable aggregates in soils. J. Soil Sci. 1982, 33, 141–163. [Google Scholar] [CrossRef]
  32. Mi, J.; Gregorich, E.G.; Xu, S.; McLaughlin, N.B.; Ma, B.; Liu, J. Effect of bentonite amendment on soil hydraulic parameters and millet crop performance in a semi-arid region. Field Crops Res. 2017, 212, 107–114. [Google Scholar] [CrossRef]
  33. Schoonover, J.E.; Crim, J.F. An introduction to soil concepts and the role of soils in watershed management. J. Contemp. Water Res. Edu. 2015, 154, 21–47. [Google Scholar] [CrossRef]
  34. Celik, I.; Ortas, I.; Kilic, S. Effects of compost, mycorrhiza, manure and fertilizer on some physical properties of a Chromoxerert soil. Soil Tillage Res. 2004, 78, 59–67. [Google Scholar] [CrossRef]
  35. Nimmo, J.R. Porosity and pore size distribution. In Encyclopedia of Soils in the Environment; Elsevier: London, UK, 2004; Volume 3, pp. 295–303. [Google Scholar]
  36. Kutı´lek, M.; Jendele, L.; Panayiotopoulos, K. The influence of uniaxial compression upon pore size distribution in bi-modal soils. Soil Tillage Res. 2006, 86, 27–37. [Google Scholar] [CrossRef]
  37. Pagliai, M.; Vignozzi, N. The soil pore system as an indicator of soil quality. Adv. Geo. Ecol. 2002, 35, 69–80. [Google Scholar]
  38. Pagliai, M.; Vittori Antisari, L. Influence of waste organic matter on soil micro- and macrostructure. Bioresour. Technol. 1993, 43, 205–213. [Google Scholar] [CrossRef]
  39. Horton, R. An approach toward the physical interpretation of infiltration capacity. Soil Sci. Soc. Am. Proc. 1940, 5, 339–417. [Google Scholar]
  40. Kay, B.D.; VandenBygaart, A.J. Conservation tillage and depth stratification of porosity and soil organic matter. Soil Tillage Res. 2002, 66, 107–118. [Google Scholar] [CrossRef]
  41. Lal, R. Restoring soil quality to mitigate soil degradation. Sustainability 2015, 7, 5875–5895. [Google Scholar] [CrossRef]
  42. Miranda, M.; Freire, M.; Almeida, B.; Freire, A.; Freire, F.; Pessoa, L. Improvement of degraded physical attributes of a saline-sodic soil as influenced by phytoremediation and soil conditioners. Arch. Agron. Soil Sci. 2018, 64, 1–15. [Google Scholar] [CrossRef]
  43. Greenland, D.J. Soil management and soil degradation. J. Soil Sci. 1981, 32, 301–322. [Google Scholar] [CrossRef]
  44. Bhattacharyya, R.; Prakash, V.; Kundu, S.; Gupta, H. Effect of tillage and crop rotations on pore size distribution and soil hydraulic conductivity in sandy clay loam soil of the Indian Himalayas. Soil Tillage Res. 2006, 82, 129–140. [Google Scholar] [CrossRef]
  45. Pagliai, M.; Raglione, M.; Panini, T.; Maletta, M.; La Marca, M. The soil structure after ten years of conventional and minimum tillage of two Italian soils. Soil Tillage Res. 1995, 34, 209–223. [Google Scholar] [CrossRef]
Figure 1. Water retention curves of the upper and lower layers for (a) manure, (b) standard mine treatment (SMT), (c) compost, (d) lucerne, (e) grass, (f) a blend of grass and manure, (g) a blend of grass and compost, (h) a blend of lucerne, manure and compost, (i) soil only and (j) compacted soil.
Sustainability 11 04297 g001
Figure 2. Pore size distribution of the different treatments divided into micro-pores, meso-pores and macro-pores for the (a) upper layer and (b) lower layer. SMT = Standard mine treatment.
Sustainability 11 04297 g002
Figure 3. Pore size distribution of the different treatments obtained using hydraulic capacity function (Cw) as compared to the soil only treatment. (a) manure, standard mine treatment (SMT), compacted soil and soil only, (b) lucerne, compost grass and soil only, and (c) a blend of grass and manure (G + M), a blend of grass and compost (G + C), a blend of lucerne, manure and compost (L + M + C) and soil only.
Sustainability 11 04297 g003
Figure 4. Hydraulic conductivity of the upper layer and lower layer of the different treatments. SMT = standard mine treatment.
Sustainability 11 04297 g004
Table 1. Summary of ANOVA on degrees of freedom, F values, and F probabilities for the analysis of variance for soil bulk density (Tukey’s Studentized range test) at University of Pretoria, South Africa.
Source of Variationdf F valueF > pr
Month4614.74<0.01
Treatment9241.68<0.01
Month*treatment3611.89<0.01
df, degrees of freedom.
Table 2. Treatment effect on the mean bulk density (g cm−3) over the study period.
TreatmentDec 2013Jun 2014Dec 2014Jun 2015Dec 2015
Manure (L1)1.37 b1.41 c1.45 c1.48 de1.51 e
Standard mine treatment (L2)1.35 b1.37 b1.39 b1.42 bc1.42 bc
Compost (L3)1.41 c1.43 c1.45 cd1.47 de1.49 de
Lucerne (L4)1.40 c1.42 c1.43 c1.45 cd1.46 cd
Grass (L5)1.45 d1.47 d1.48 de1.50 ef1.51 e
Grass + manure (L6)1.35 b1.37 b1.38 b1.40 b1.40 b
Grass + compost (L7)1.35 b1.37 b1.37 b1.38 b1.38 b
Lucerne + manure + compost (L8)1.21 a1.22 a1.24 a1.26 a1.26 a
Soil only (L9)1.44 d1.47 d1.50 e1.53 f1.56 f
Compacted soil (L10)1.60 e1.60 e1.60 f1.68 g1.69 g
SEM0.00620.00680.00770.00830.0086
Means with the same letter within a column are not significantly different.
Table 3. Soil properties and fitted parameters for the Van Genuchten equation using the RETC program for both layers.
TreatmentUpper LayerLower Layer
θr
(m3 m−3)
θs
(m3 m−3)
α
(m−1)
nmPAW
(mm m−1)
r2θr
(m3 m−3)
θs
(m3 m−3)
α
(m−1)
nmPAW
(mm m−1)
r2
Manure (L1)0.10.3330.8601.4360.304910.950.10.3640.2931.3380.253940.98
Standard mine treatment (L2)0.10.2950.6511.5580.358890.940.10.3220.1821.3180.242970.96
Compost (L3)0.10.4120.0881.3010.2321100.970.10.4080.0921.4120.2921100.98
Lucerne (L4)0.10.4160.5381.4030.2871060.980.10.3930.4911.3030.2271010.97
Grass (L5)0.10.3720.3621.3160.2401020.970.10.3730.3181.3520.2731050.97
Grass and manure (L6)0.10.4170.0941.2880.2241190.980.10.4140.1571.2940.2331150.98
Grass and compost (L7)0.10.4260.0591.2470.1981130.960.10.4130.0891.2690.2121110.97
Lucerne, manure and compost (L8)0.10.4570.0481.2010.1681240.950.10.4940.0801.2730.2151300.82
Soil only (L9)0.10.2840.8391.9400.484820.980.10.3140.6761.3750.260890.95
Compacted soil (L10)0.10.2690.7691.7690.435760.980.10.2440.5271.4810.328720.97
Table 4. Summary of ANOVA on degrees of freedom, F values, and F probabilities for the analysis of variance for cumulative infiltration (Tukey’s Studentized range test) at University of Pretoria, South Africa.
Source of Variationdf F ValueF > pr
Month3118.84<0.01
Treatment9672.90<0.01
Month*treatment274.54<0.01
df, degrees of freedom.
Table 5. Treatment effect on the cumulative infiltration (cm) over the study period.
TreatmentJun 2014Dec 2014Jun 2015Dec 2015
Manure (L1)3.12 c2.96 d2.88 d2.83 d
Standard mine treatment (L2)1.80 d1.74 e1.71 e1.69 e
Compost (L3)2.98 c2.93 d2.85 d2.82 d
Lucerne (L4)1.40 c3.86 c3.80 c3.74 c
Grass (L5)2.94 c2.89 d2.85 d2.83 d
Grass + manure (L6)4.16 b4.13 b4.10 b4.06 b
Grass + compost (L7)4.12 b4.09 bc4.04 bc4.02 b
Lucerne + manure + compost (L8)4.94 a4.91 a4.88 a4.85 a
Soil only (L9)1.49 e1.47 f1.44 f1.42 f
Compacted soil (L10)0.70 f0.69 g0.68 g0.68 g
SEM0.15520.14150.15810.1575
Means with the same letter within a column are not significantly different.
Table 6. Treatment effect on the mean hydraulic conductivity (cm s−1) over the study period.
TreatmentJun 2014Dec 2014Jun 2015Dec 2015
Manure (L1)5.71 × 10⁻⁴ b4.66 × 10−4 cd6.62 × 10−4 bc6.95 × 10−4 c
SMT (L2)8.86 × 10⁻⁵ d2.41 × 10−4 de2.65 × 10−4 ef3.09 × 10−4 d
Compost (L3)2.26 × 10⁻⁴ cd4.15 × 10−4 cd4.17 × 10−4 de4.53 × 10−4 d
Lucerne (L4)6.18 × 10⁻⁴ b7.15 × 10−4 b7.47 × 10−4 b8.30 × 10−4 c
Grass (L5)4.11 × 10⁻⁴ bc5.12 × 10−4 bc5.48 × 10−4 cd6.64 × 10−4 c
Grass + manure (L6)1.22 × 10⁻³ a1.27 × 10−3 a1.34 × 10−3 a1.43 × 10−3 a
Grass + compost (L7)5.14 × 10⁻⁴ b4.93 × 10−4 bc5.81 × 10−4 c7.12 × 10−4 c
Lucerne + manure + compost (L8)1.15 × 10⁻³ a1.17 × 10−3 a1.22 × 10−3 a1.24 × 10−3 b
Soil only (L9)1.95 × 10⁻⁴ cd2.55 × 10−4 d2.26 × 10−4 f2.95 × 10−4 d
Compacted soil (L10)2.43 × 10⁻⁵ d1.97 × 10−5 e2.74 × 10−5 g4.88 × 10−5 e
SEM5.41 × 10−54.84 × 10−53.15 × 10−53.67 × 10⁻⁵
Means with the same letter within a column are not significantly different.

