1. Introduction
Particulate air pollution causes significant health impacts in cities. A new wave of pollution control initiatives is needed to stem the current crippling levels of air pollution. At present, proper air quality management is urgently needed to effectively reduce air pollution, especially for PM
10 and PM
2.5. Urban PM
2.5 originates mainly from sources such as traffic-related emissions, road/soil dust, biomass burning, and agriculture activities, but it was found that coal and coal-related industrial processes account for 50–60% of PM
2.5 in cities in China [
1].
The Korea National Institute of Environmental Research has selected six coal-fired power plants, three bituminous coal-fired thermal power plants, and three anthracite coal-fired power plants, with a capacity of 100 MW or more, as the measurement target facilities to measure emission factors. In addition, the calculation of emission factors for newly released PM
2.5 based on the atmospheric environment in 2015 has been significant in that it provides the basis for calculating related emissions in the future. The generated emission factors are expected to be replaced by international emission factors, which are obtained by collecting expert opinions, evaluating credibility, holding emission factor committees, and securing objectivity and reliability, but they fail to properly reflect the reality of coal-fired power plants in Korea [
2].
Officially, total suspended particle (TSP), PM
10, and PM
2.5 emissions from stationary sources in Korea’s Clean Air Policy Support System (CAPSS) have been calculated only for filterable PM (FPM). However, PM from the emission sources can be divided into the FPM and condensable PM (CPM) [
3].
Table 1 shows the measurement methods for fine PM in exhaust gas. In the US, EPA Method 201A, which measures FPM using a cyclone, and EPA Method 202, which measures CPM, are used simultaneously to investigate the characteristics of particulate emissions from stationary emission sources [
4,
5]. In Europe, FPM is measured at the stationary emission sources using an impactor method [
6], and FPM and CPM were simultaneously measured at the emission source using the ISO 25597: 2013 method [
7]. The VDI (Verein Deutscher Ingenieure; Association of German Engineers) method and Japanese standard association method are used to measure FPM in Germany and Japan, respectively [
8,
9,
10].
US EPA Method 201A is applied for the standard test method for PM
10 and PM
2.5 emission from stationary sources in Korea (ES 01307.1) [
4,
11]. However, the test measurement method for CPM has not been designated, as it is difficult to determine systematically and comprehensively the characteristics of PM emissions. For this reason, it is necessary to establish a Korean standard test method for CPM in a stationary source [
12]. The ES 01307.1 test method requires a sampling nozzle, pipe, pitot tube, filter holder, heating device, impinger train, and flow measurement components. The ES 01317.1 method uses a cyclone as a particle separator to measure the PM
10 and PM
2.5 emissions from a stationary source, and measurements are performed using isokinetic sampling conditions. If necessary, a PM
10 and PM
2.5 particle size separator can be attached simultaneously to measure the mass concentration according to particle size. The ISO 23210 method is recognized as a Korean standard (KS), and used for low concentration (<40 mg/m
3) emission sources using a two-stage cascade impactor. It is a representative simultaneous measurement method. However, although the mass concentration of total particulate matter (TPM) measured in the general atmosphere using a cascade impactor can be used as the absolute concentration, it has been stated that the TPM mass concentration measured by the ISO 23210 method for stack measurement cannot be used [
6,
13].
Adami et al. reported on the first 10 years of the Covenant of Mayors of sustainable energy focusing on an Italian case including their population change [
14]. Further, a variety of studies have been conducted for sustainable energy consumption from the local to regional levels [
15,
16]. Many studies have analyzed the correlation between energy use and greenhouse gas emissions. However, despite the significant amount of fine PM emissions from combustion activities, to the best of our knowledge, no study has analyzed the correlation between energy use and PM
2.5 emissions. Therefore, this study analyzed the Korean PM
2.5 emissions in past, present, and future energy mix scenarios from 1970 to 2035 with the aim of identifying a sustainable, future environmentally friendly energy mix scenario for Korea related to dust emissions.
2. Materials and Methods
Business-as-usual (BAU) was calculated (2016–2035) based on the Korea National Statistical Office’s past energy use data (1970–2015), Scenario 1 was based on the Korea National Energy Basic Plan, and Scenario 2 was based on the fuel cell energy conversion policy, and they were used to calculate energy use and fine PM
2.5 emissions. Korean energy supply and demand statistics are intended to provide basic data for establishing various energy policies such as energy demand forecasts and energy efficiency analyses by comparing and analyzing various factors affecting energy demand and supply. Energy supply and demand statistics are calculated by applying an energy calorific value conversion standard based on the total calorific value. The energy calorific conversion standard has been revised six times since 1980, and since 2007, it has been prepared and published every five years in accordance with the energy law established in 2006. The primary energy used in this study is the energy supplied domestically by production, import/export, and stock change, and it is calculated as the sum of the energy to be converted to other energy and the final energy consumed in industry, transport, household, and commercial use. In the current national energy balance, oil refining, which corresponds to the input of crude oil and production of petroleum products, is not regarded as a conversion statistic. Instead, the petroleum products produced are regarded as primary energy imports [
17].
The 2016–2035 BAU energy use in this study is based on data from the 2nd national energy basic plan. The energy basic plan covers all areas of the energy sector, and it is a comprehensive plan that systematically links with other energy-related plans and adjusts them from a macroscopic point of view. The energy basic plan provides the principles and directions for other energy-related plans by energy source and sector. It is a top-level plan with a character, and it aims at presenting the basic philosophy and vision of the country’s mid- and long-term energy policy. In order to achieve this goal, this plan will guide a shift in demand-oriented energy policy, the establishment of a decentralized power generation system, the harmonization of the environment and safety, and the strengthening of energy security to ensure a stable supply of energy.
Table 2 shows the energy supply and demand forecasts for the 2nd energy supply and demand plan [
18]. The FPM emission factor is based on the emission factor of the national air pollutant emission method manual reported by the National Institute of Environmental Research (NIER) [
19], and the dust emission factor of nuclear and hydroelectric activities is zero.
The CPM
2.5 emission factors used to calculate the amount of fine PM emissions from combustion activities are based on the coefficients reported by the National Institute of Environmental Research in 2016.
Table 3 shows the CPM
2.5 emission factors of stationary emission sources in Korea published by the NIER. Natural gas (LNG), diesel, and bunker C oil were measured at the boiler without control facilities, and the bituminous coal emission factor was measured at the end of the power plant control facility [
12]. CPM
2.5 emissions from the combustion of diesel oil, bunker C oil, and bituminous coal are calculated by multiplying the PM
2.5 filterable dust (FPM) emission factor in
Table 3 by the ratio of the FPM
2.5 emission factor to the CPM
2.5 emission factor; that is, the amount of CPM
2.5 was calculated by multiplying the CPM
2.5 to FPM
2.5 ratio of 18.46 for diesel, 1.58 for bunker C, and 9.94 for bituminous coal. Bunker A oil and Bunker B oil were used for Bunker C oil, and for anthracite coal, bituminous coal was used to calculate CPM
2.5.
Table 3 shows the FPM
2.5 and CPM
2.5 emission factors for fuel in the United States, China, and Taiwan, as well as Korea’s emission factors. For the future, the energy consumption scenarios in Korea were applied to Scenario 1, which was the energy conversion policy set by the current government’s 7th power supply and demand plan, and Scenario 2, the energy conversion policy to strengthen the fuel cell, and estimating the amount of fine PM emissions.
3. Results
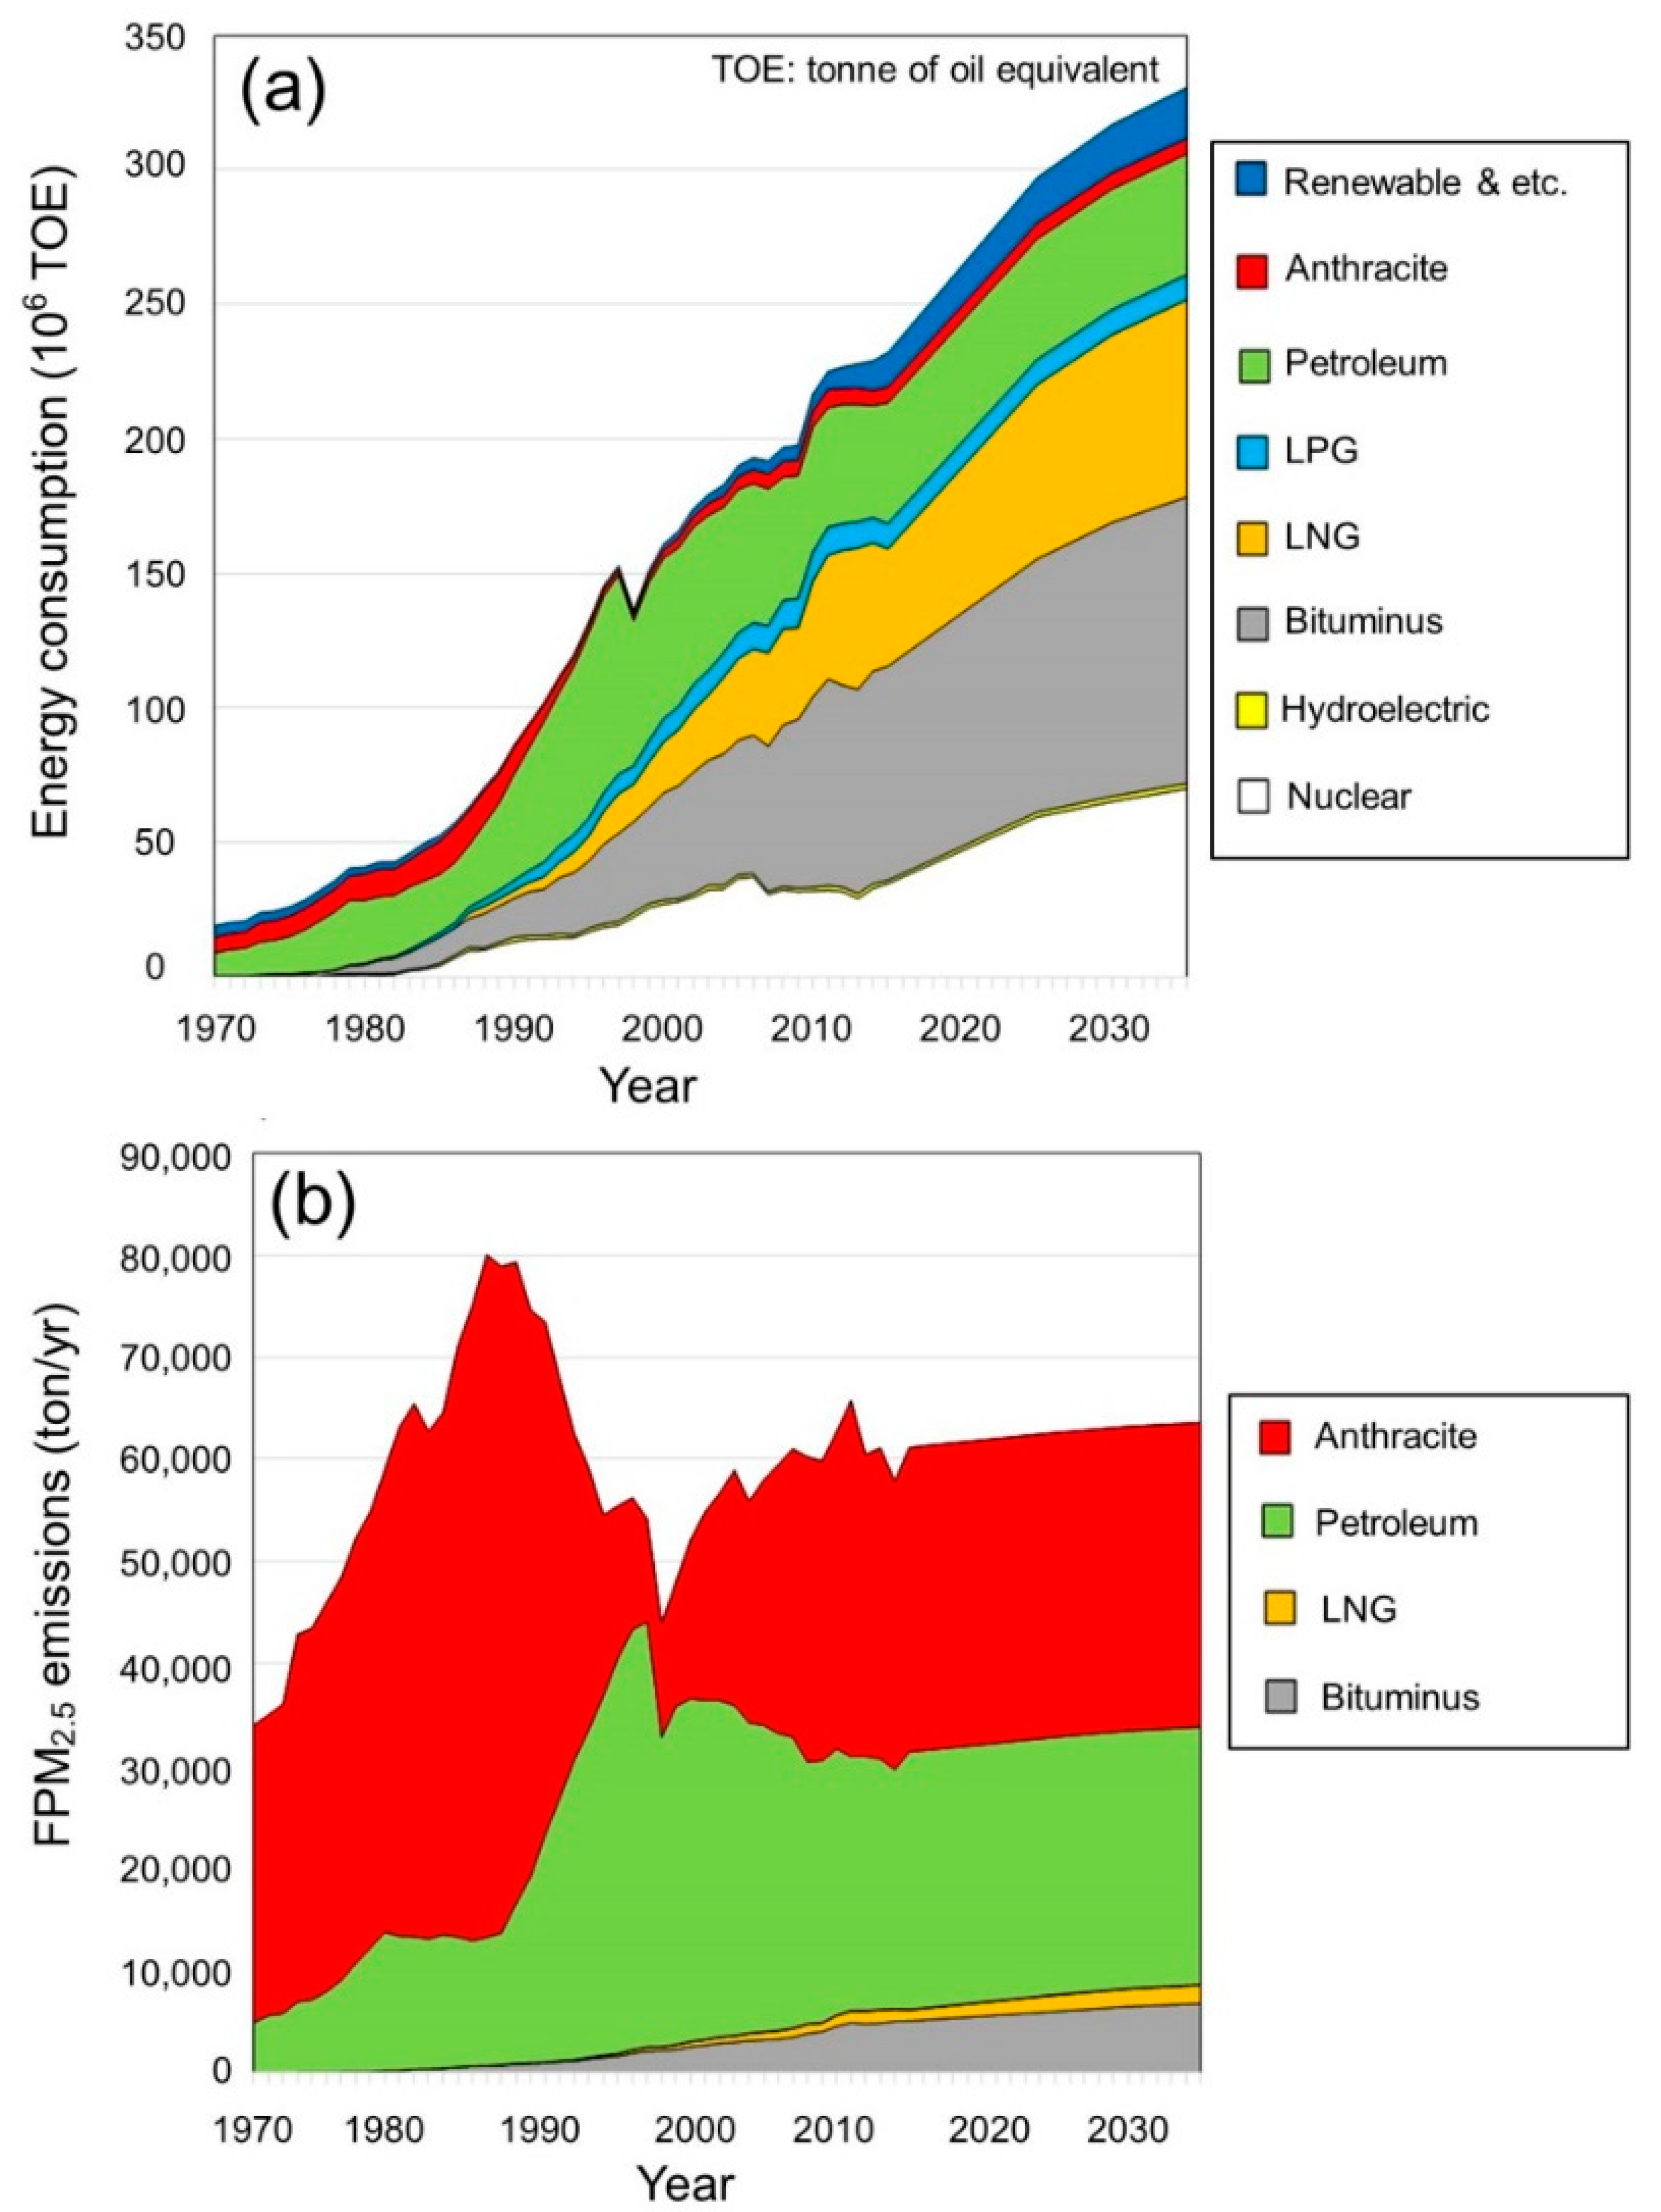
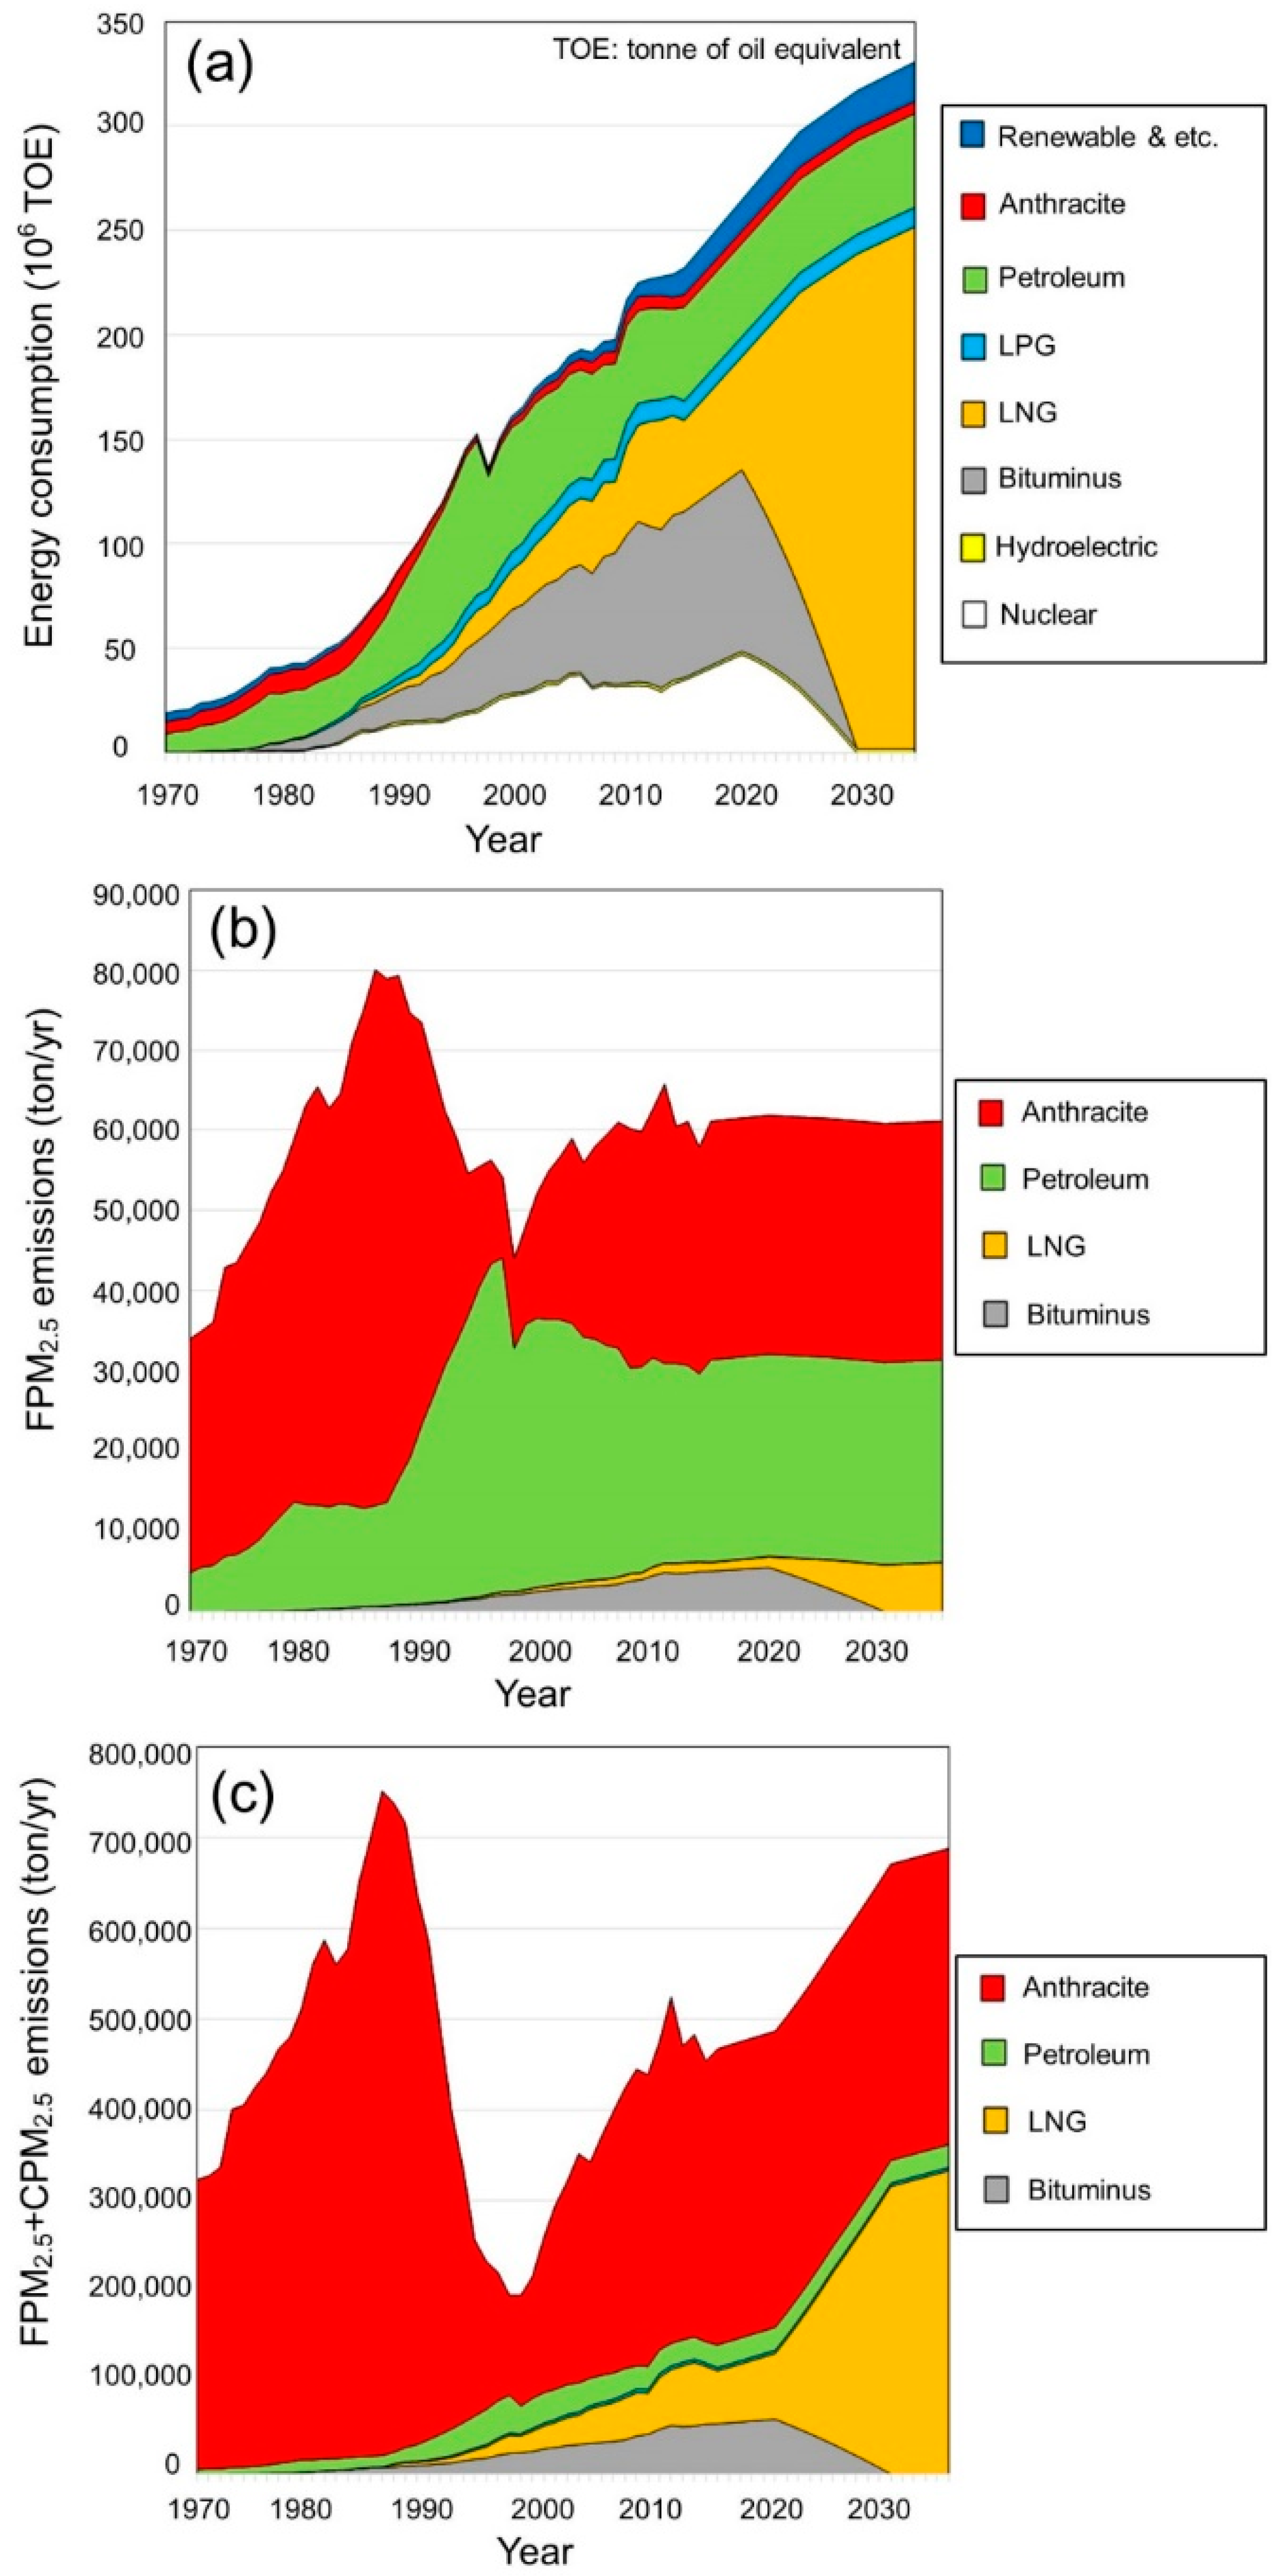
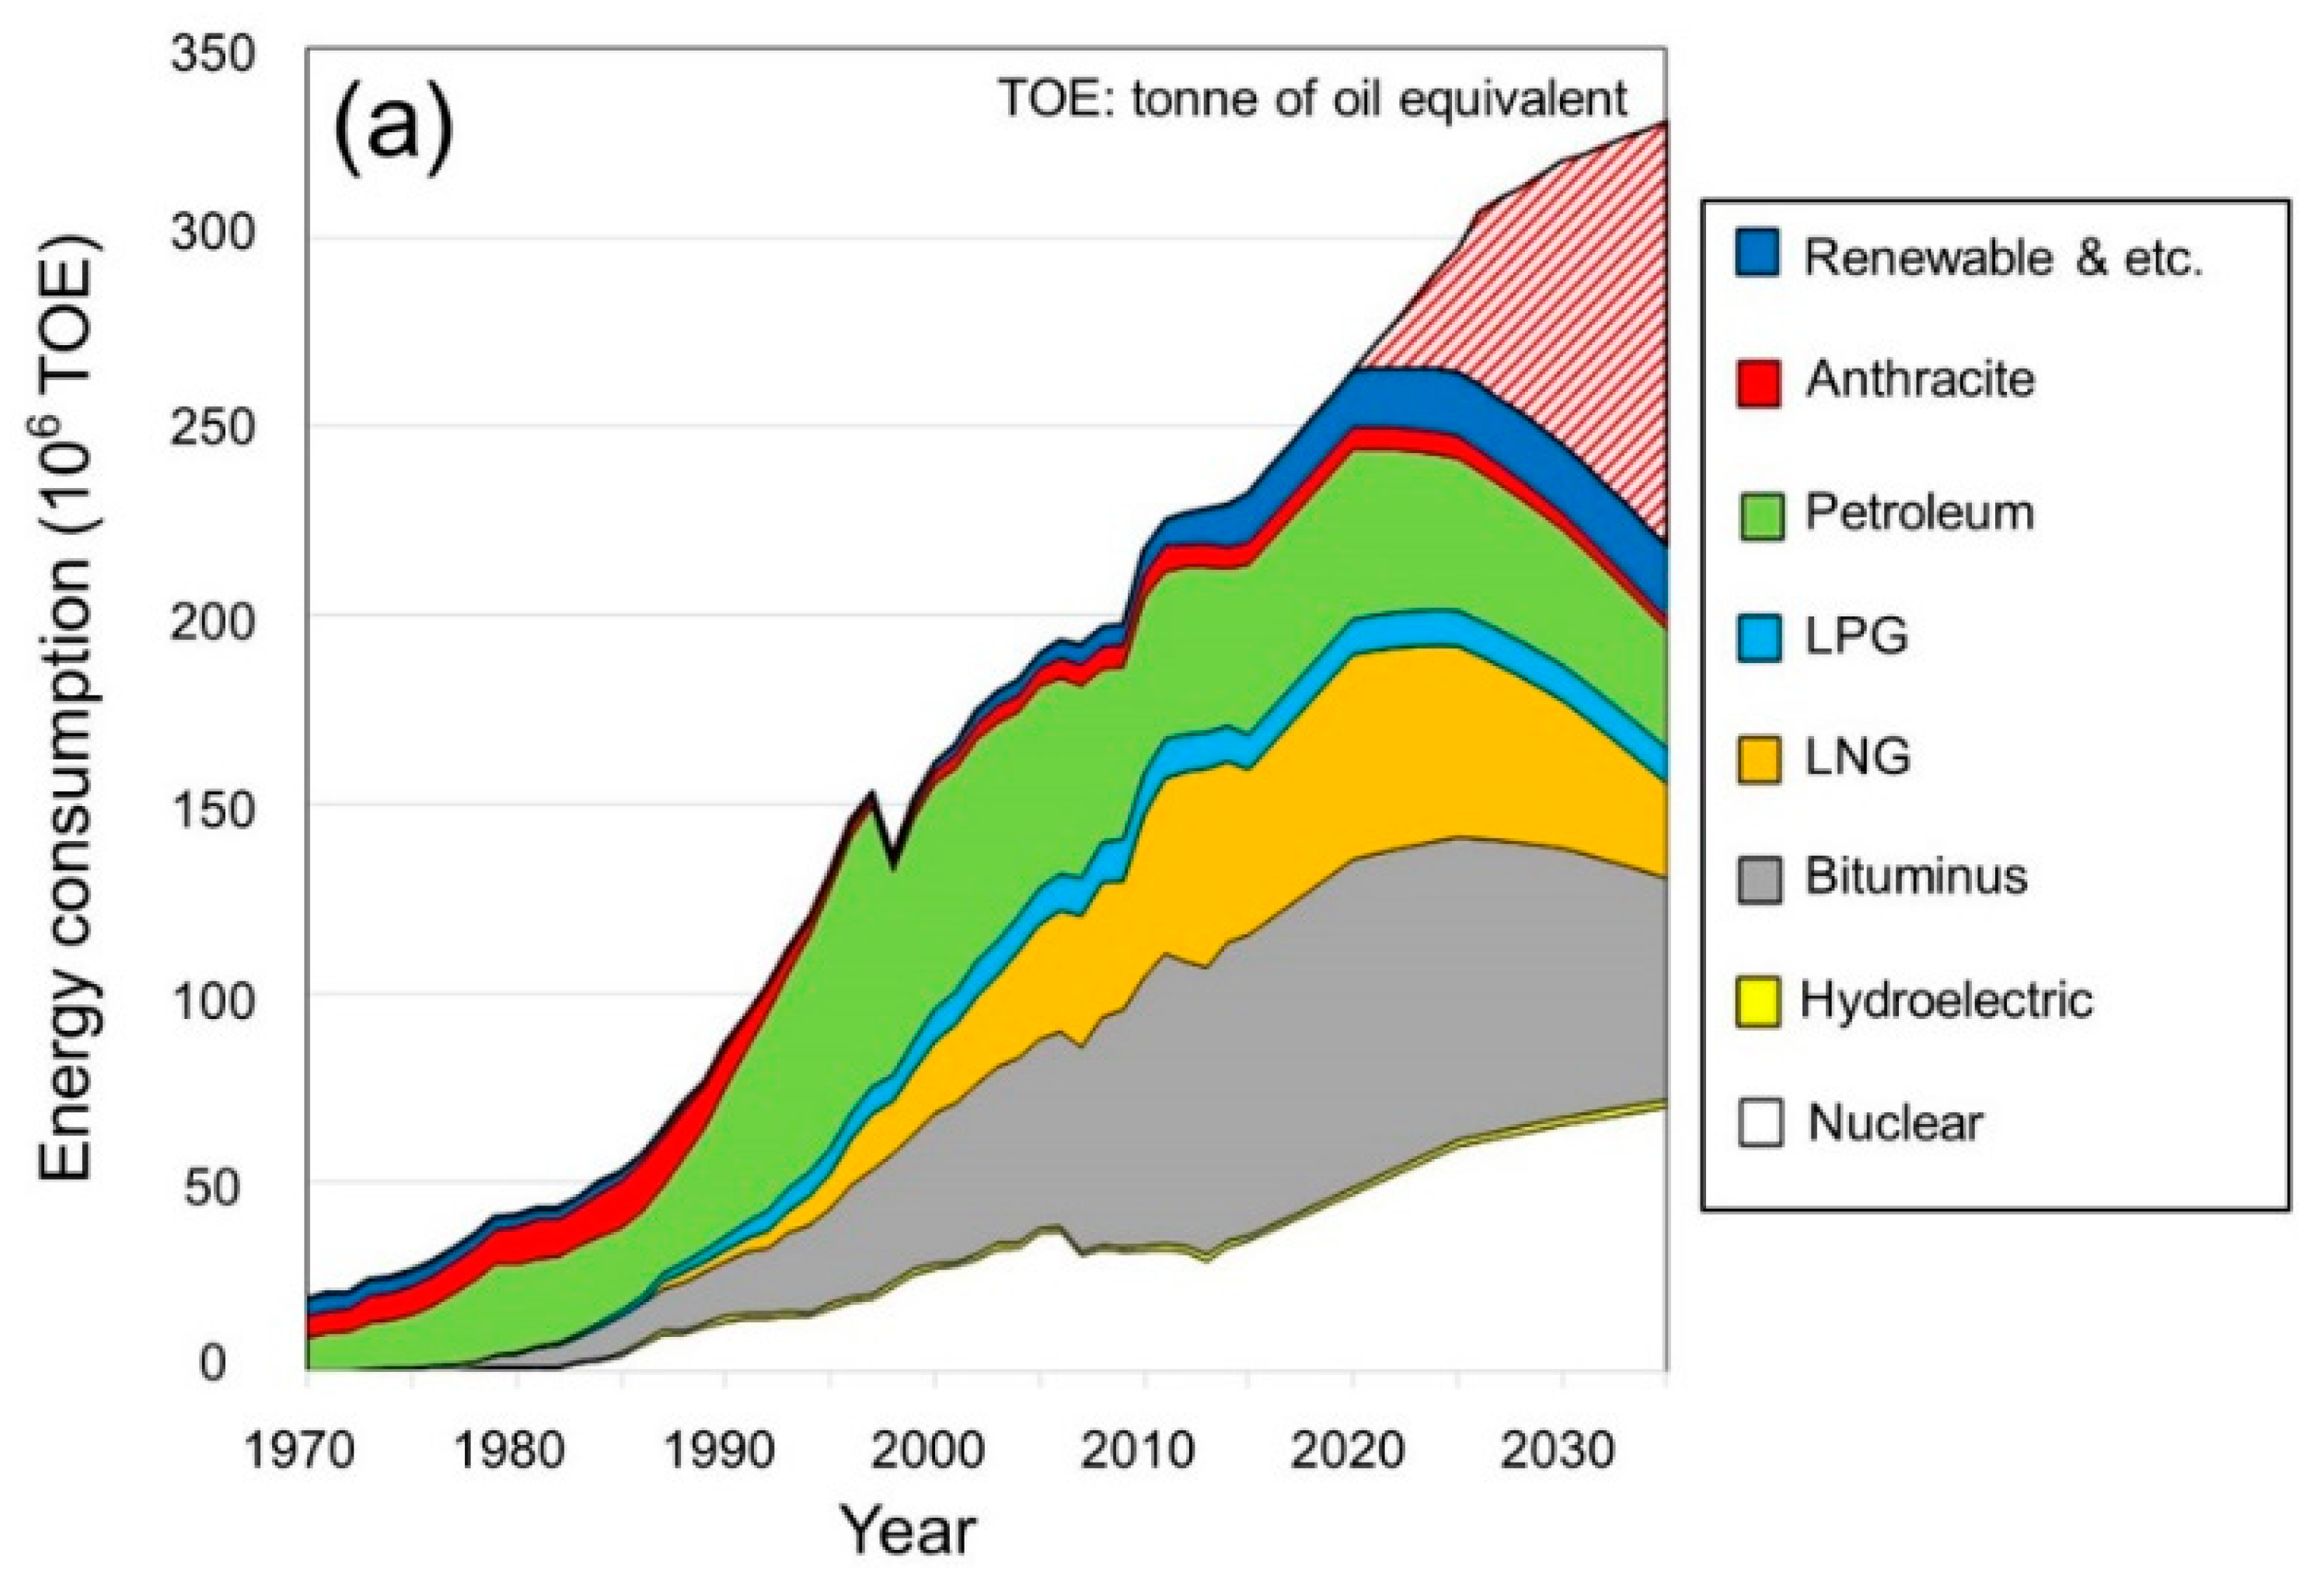
Figure 1a shows the national energy BAU in Korea as the primary energy standard for each fuel. Data from the National Statistical Office from 1970 to 2015 were used. From 2016 to 2035, the second energy basic plan of the Ministry of Industry and Trade was applied. We examined the energy composition of each year. In terms of the energy-use ratio in 1970, petroleum was the largest with 8.7 × 10
6 TOE (45.4%), followed by anthracite with 5.8 × 10
6 TOE (30.2%) and by renewable energy, etc., with 4.3 × 10
6 TOE (22.3%). Here, the components of renewable energy and other energy include modern wood fuel such as firewood and renewable energy such as sunlight and geothermal energy. In the 1970s, because nuclear power plants were not yet available in Korea, the use of nuclear energy was not estimated. The use of fossil fuel was mainly analyzed as the use of petroleum. The most popular use of anthracite in urban areas was for heating energy in the private sector, and wood in rural areas was mainly used as firewood. Regarding the energy use ratio in 1990, petroleum was the largest with 39.7 × 10
6 TOE (46.0%), coal with 14.4 × 10
6 TOE (16.7%) was second, nuclear energy with 13.2 × 10
6 TOE (15.3%) was third, and anthracite (9.9 × 10
6 TOE) (11.5%) was fourth. In the 1980s, three types of energy began to be used in Korea: Nuclear energy, bituminous coal, and natural gas (LNG). Nuclear energy and bituminous coal were used as power generation fuels to supply electric energy, and LNG was an energy source that was introduced to replace anthracite coal, which was previously used for residence heating. Regarding the energy-use ratio in 2010, coal was the most common with 71.0 × 10
6 TOE (32.7%), petroleum was second with 46.4 × 10
6 TOE (21.4%), LNG energy consumption was third with 43.0 × 10
6 TOE (19.8%), and nuclear power was fourth with 31.9 × 10
6 TOE (14.7%). Since the 1960s, the Korean government has made efforts to supply energy for the industrial sector in order to promote economic development. As a result, the supply of electricity to the entire country has become efficient. As the economy rapidly developed and income rose, after the 2000s, the residential and commercial sector demanded a higher quality of life. As a result, the proportion of energy use, which had been focused on the industrial sector until the 1990s, increased as the proportion of residential and commercial sectors increased, and the demand for convenient and clean electric energy increased. Subsequently, the contribution of nuclear and bituminous coal, the primary energy source of electric energy, increased rapidly. It was estimated that the contribution of renewable energy such as sunlight and geothermal increased since the 2000s. In order to increase the number of mountain trees following their destruction in the Korean War in 1950, the Korean government has been continuously restricting the cutting of trees. Since 2000, the government has been promoting renewable energy such as solar power and wind power to increase its use. Regarding the energy-use composition ratio in 2035, the largest was bituminous coal with 106.5 × 10
6 TOE (32.2%), the second was LNG with 73.3 × 10
6 TOE (22.2%), the third was petroleum with 70.0 × 10
6 TOE (21.2%), and the fourth was oil with 44.9 × 10
6 TOE (13.6%).
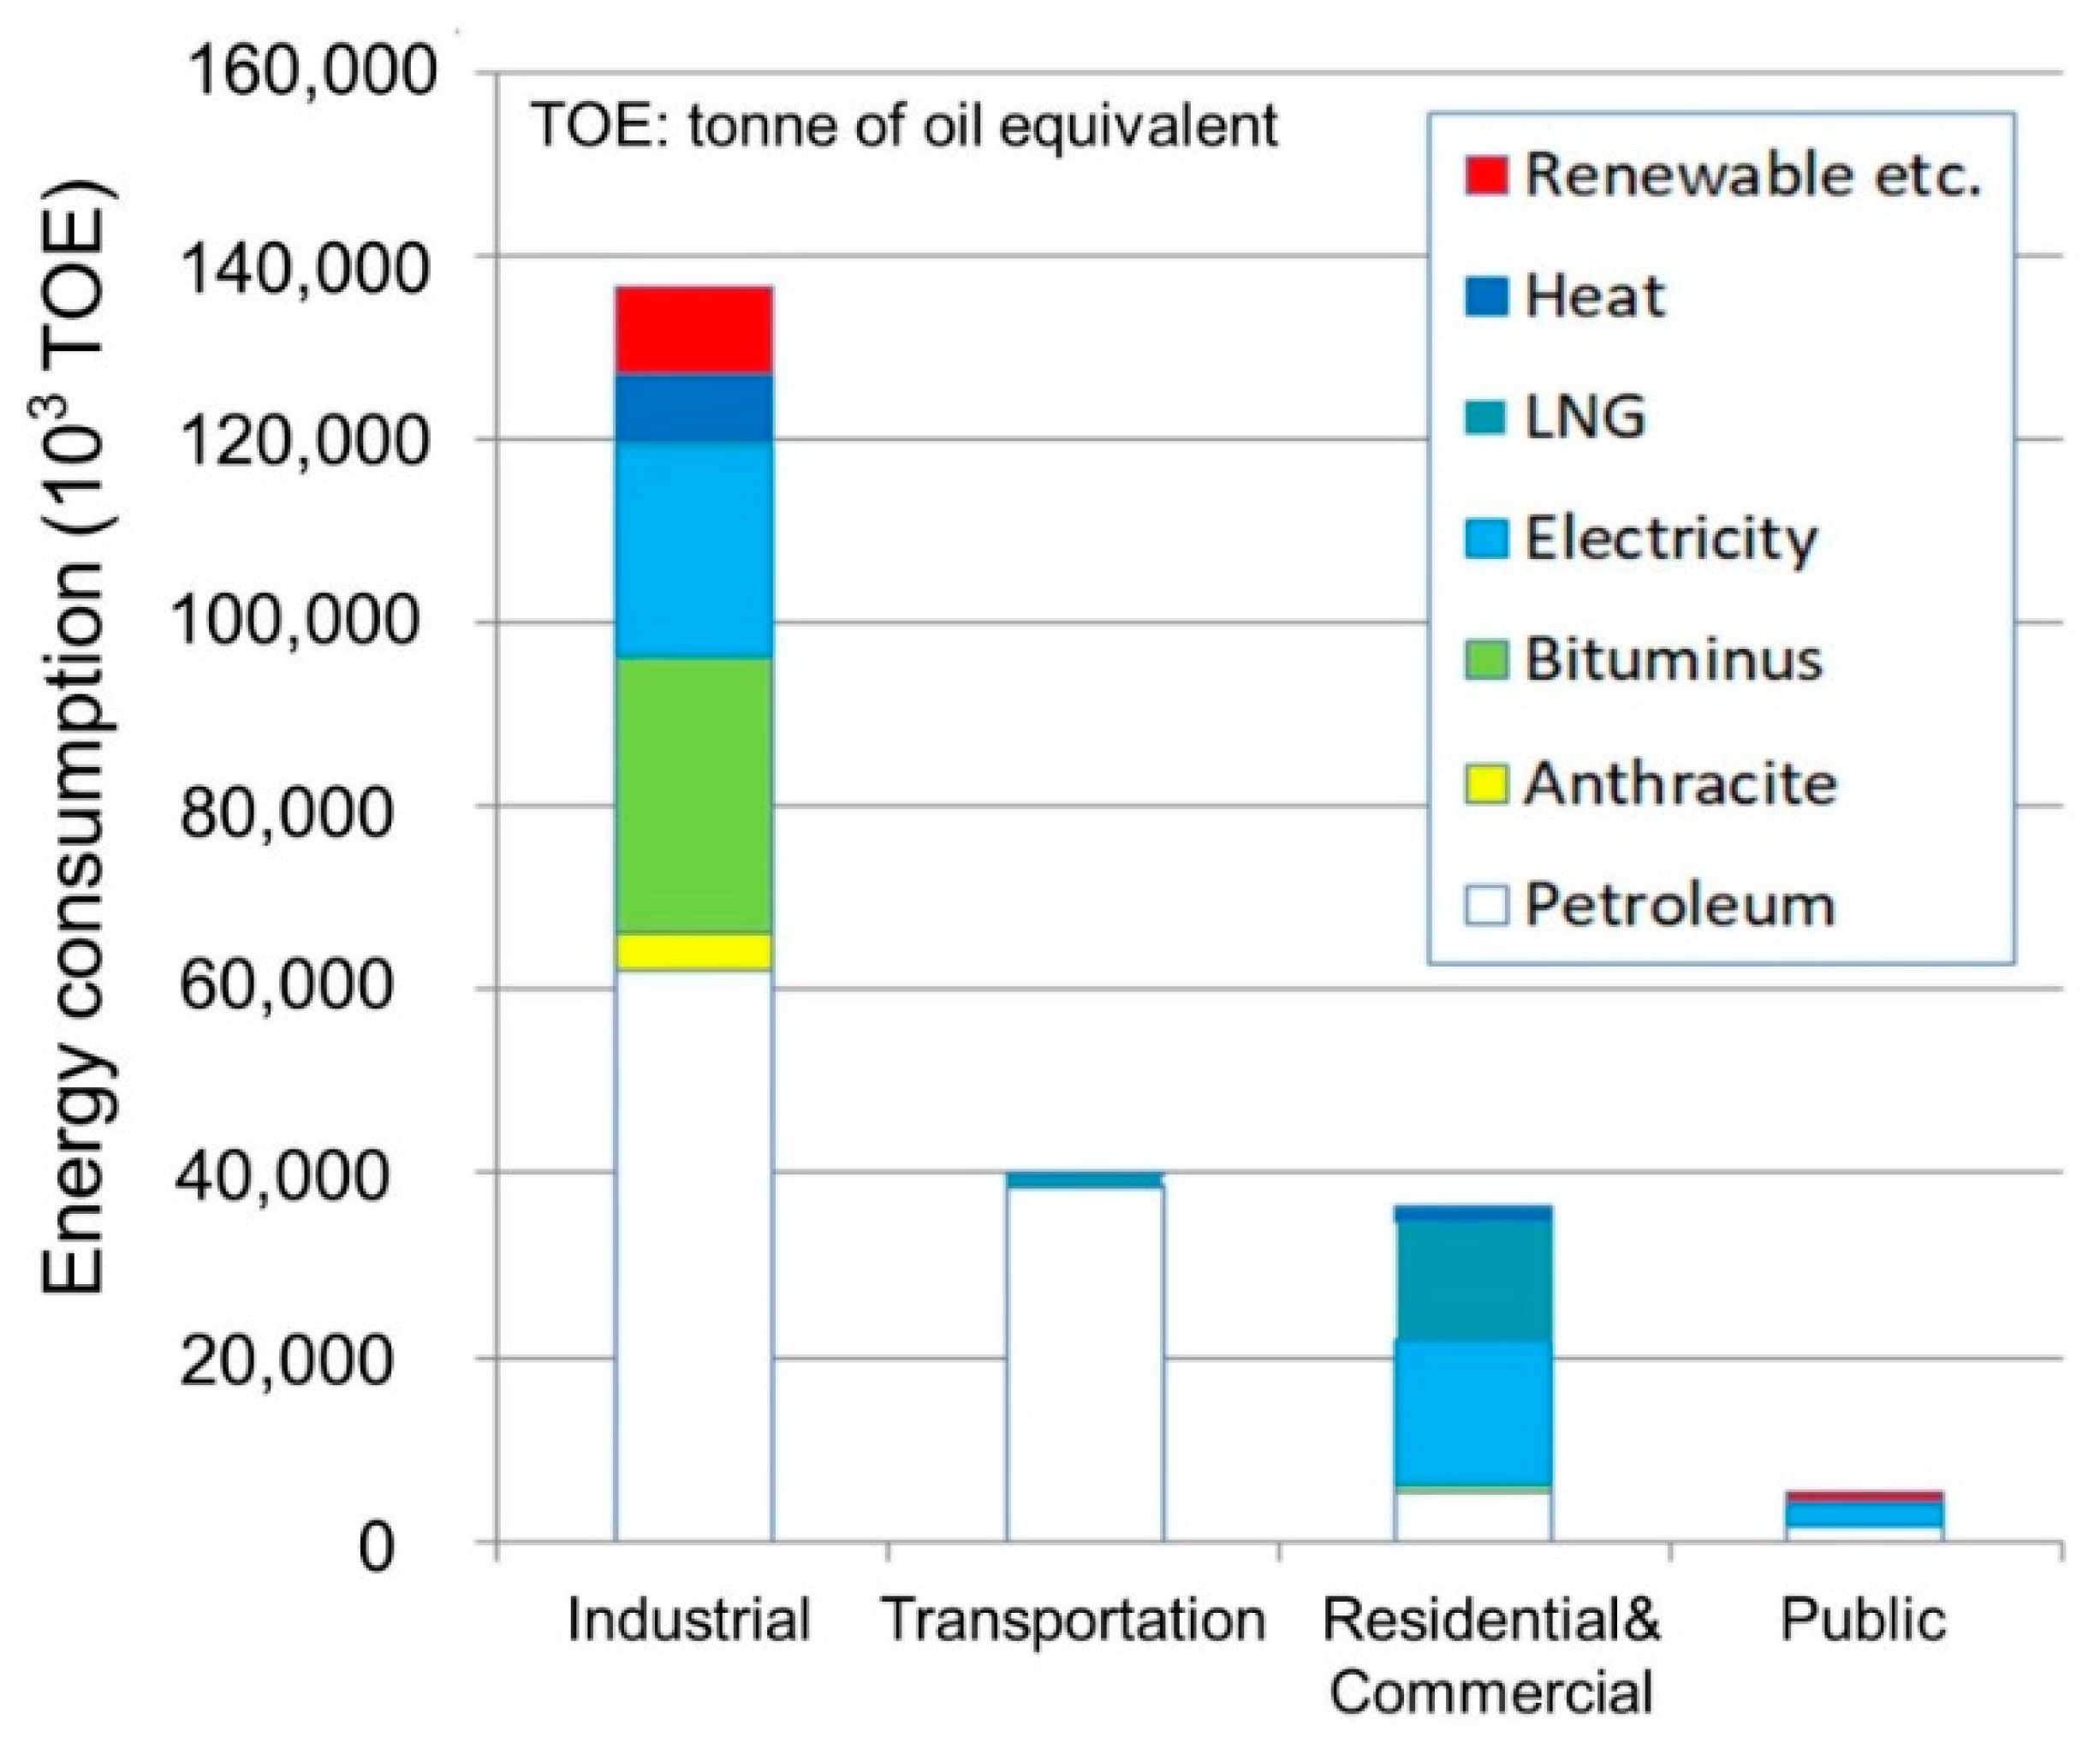
Figure 2 shows Korea’s final energy consumption by categories in 2015, using energy in the following order: Industry, transportation, home/commercial, and public. By category, the consumption by the industry was 62.1 × 10
6 TOE (45.5%) petroleum, 30.1 × 10
6 TOE (22.0%) bituminous coal, 22.8 × 10
6 TOE (16.7%) electricity, 9.4 × 10
6 TOE (6.8%) renewable and other, and 7.6 × 10
6 TOE (5.6%) heat. The consumption by the transport was 38.4 × 10
6 TOE (95.2%) petroleum, 1.3 × 10
6 TOE (3.2%) LNG, and 0.4 × 10
6 TOE renewable and other. The consumption by the residential and commercial sectors was 16.0 × 10
6 TOE (44.0%) electric energy, 12.7 × 10
6 TOE (34.7%) LNG, and 5.3 × 10
6 TOE (14.6%) oil.
Figure 1b shows FPM
2.5 emissions, which is based on Korean annual PM
2.5 emissions by fuel in 2014, as reported by the National Institute of Environmental Research. It is obtained by calculating PM
2.5 per fuel by multiplying the emission factor of each energy type. Since 1970, dust emissions have continued to increase but have been decreasing since the mid-1980s, and they were lowered to gauze emissions in 1997 because of the IMF financial crisis. Since the IMF crisis has ended, they have risen sharply since 1998 and have been stable since 2015. The amount of FPM
2.5 emissions in 2010 was 30,975 tons (49.4%), followed by oil with 26,071 tons (41.6%), coal with 4497 tons (7.2%), and LNG with 1063 tons (1.7%). Regarding the composition of FPM
2.5 emissions in 2035, anthracite was the largest at 29,760 tons (46.8%), petroleum at 25,218 tons (39.7%), bituminous coal burning at 6760 tons (10.6%), and LNG at 1795 tons (2.8%).
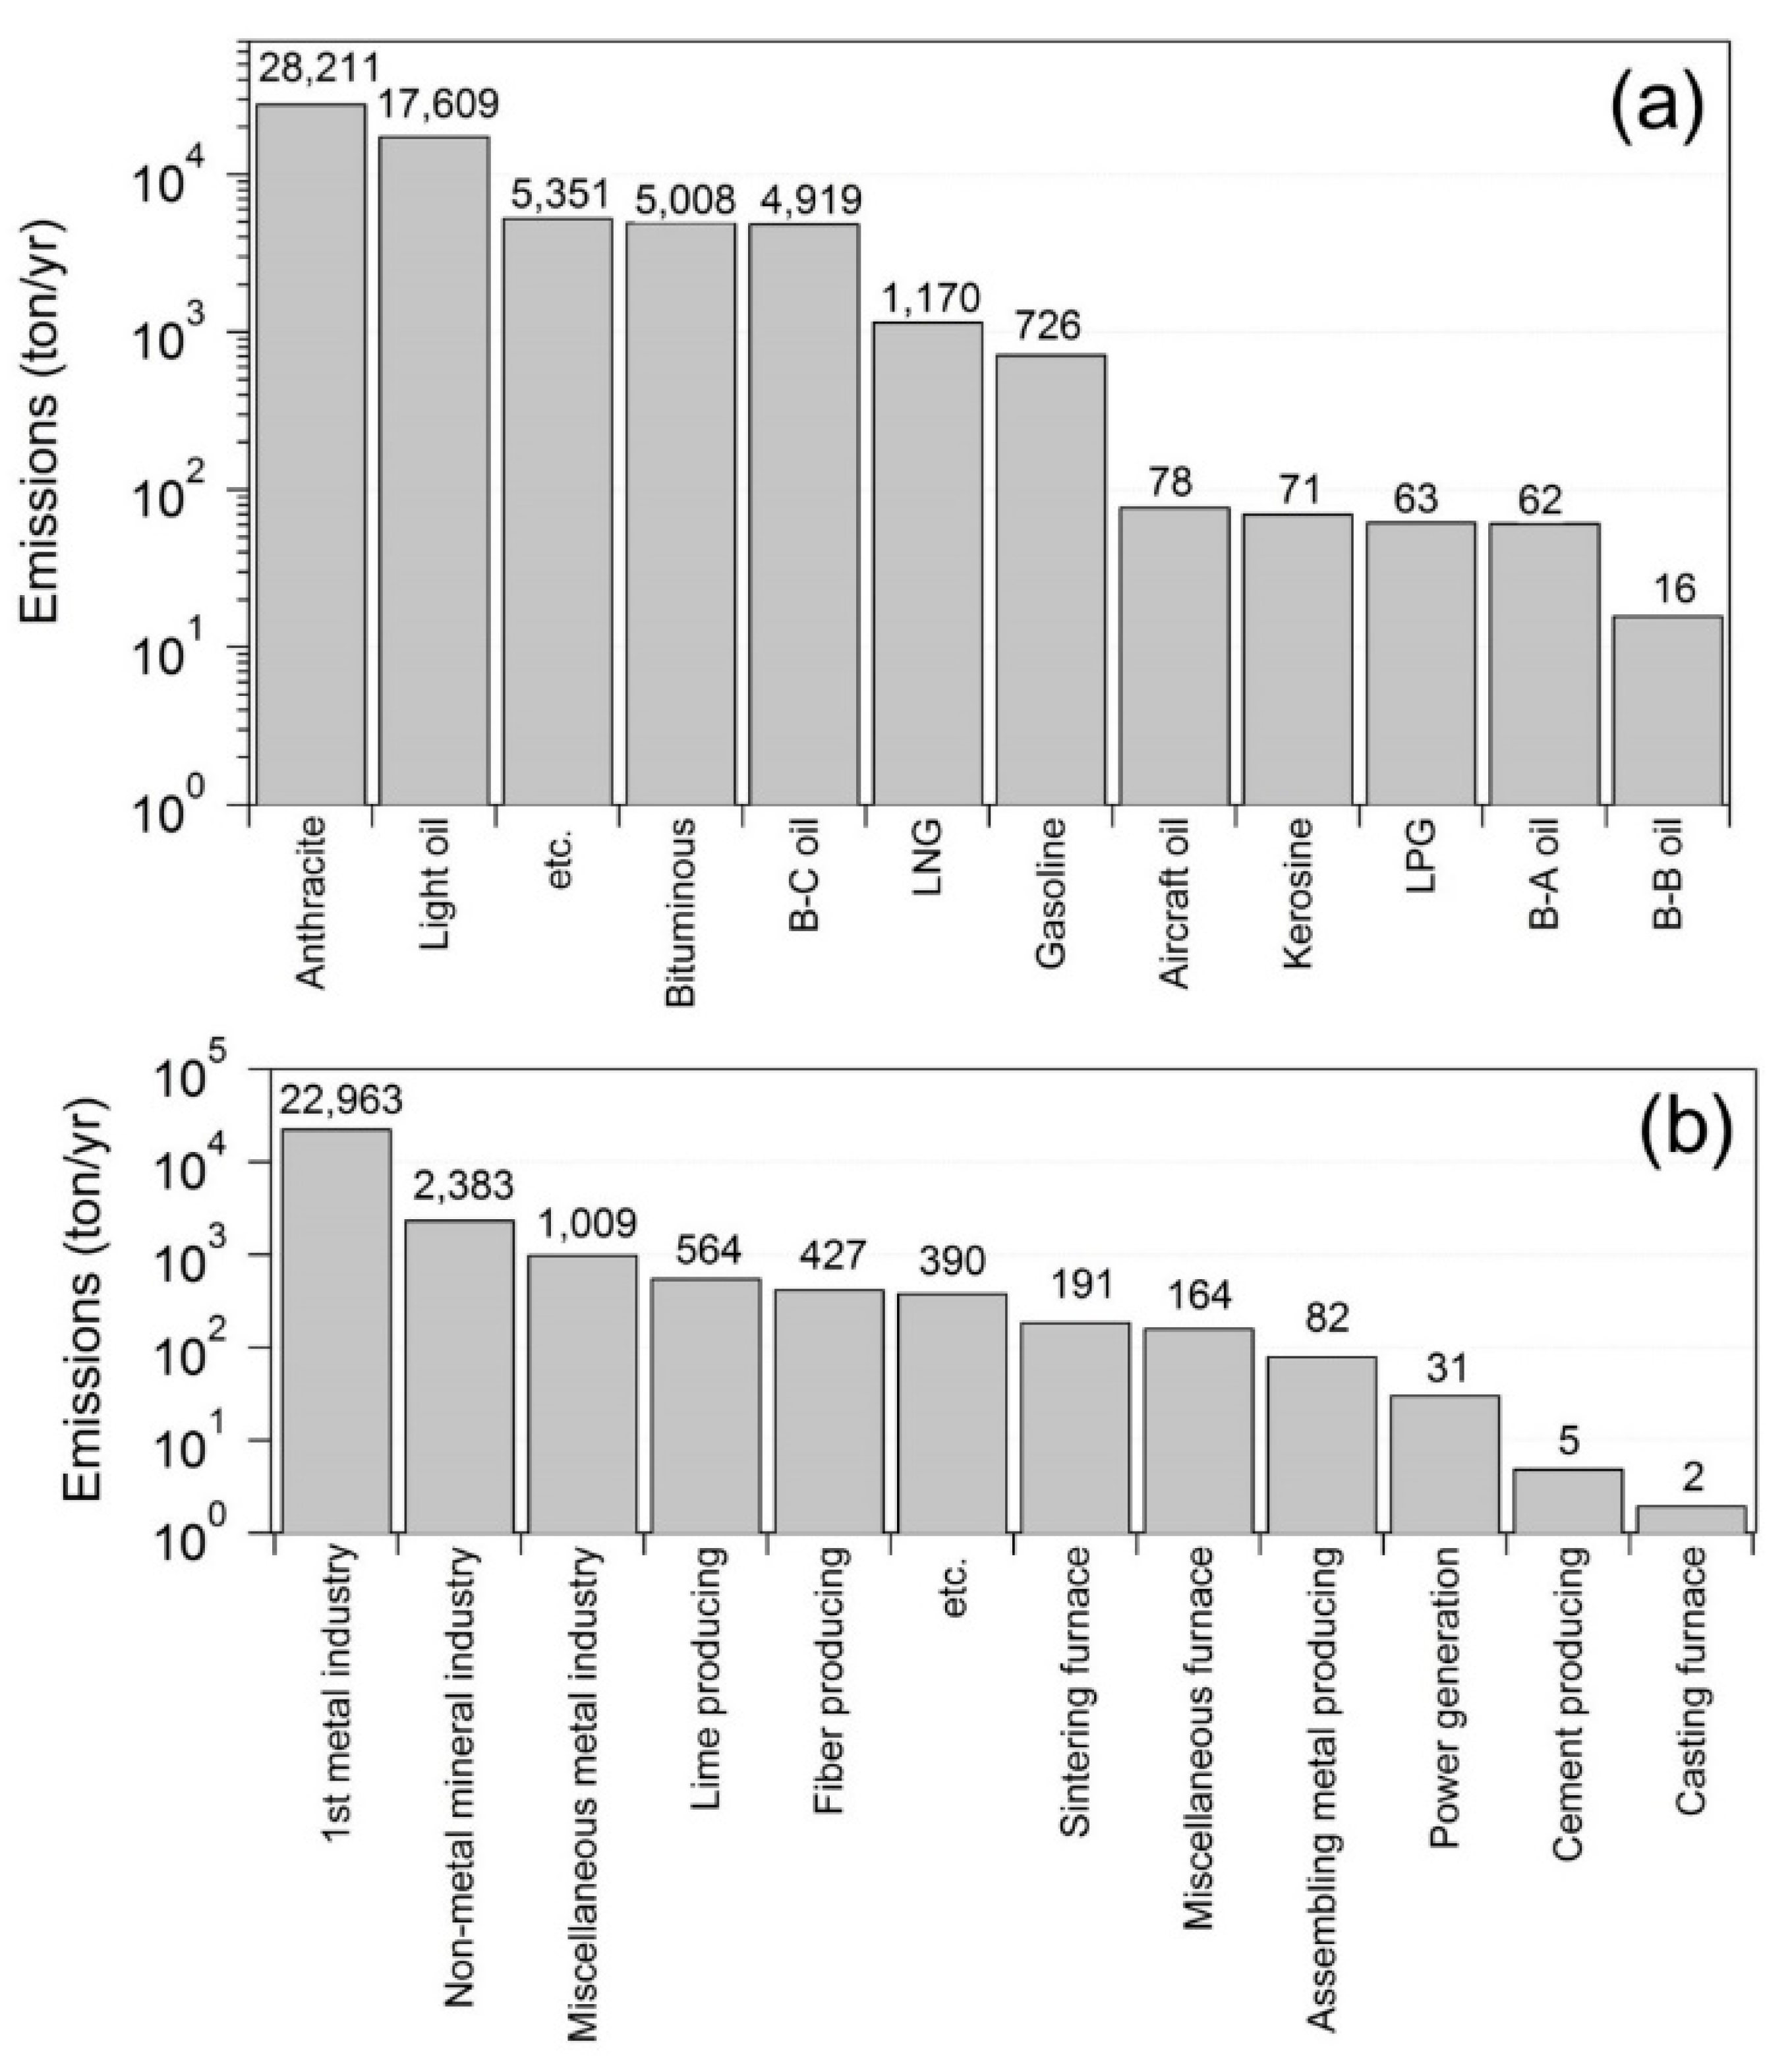
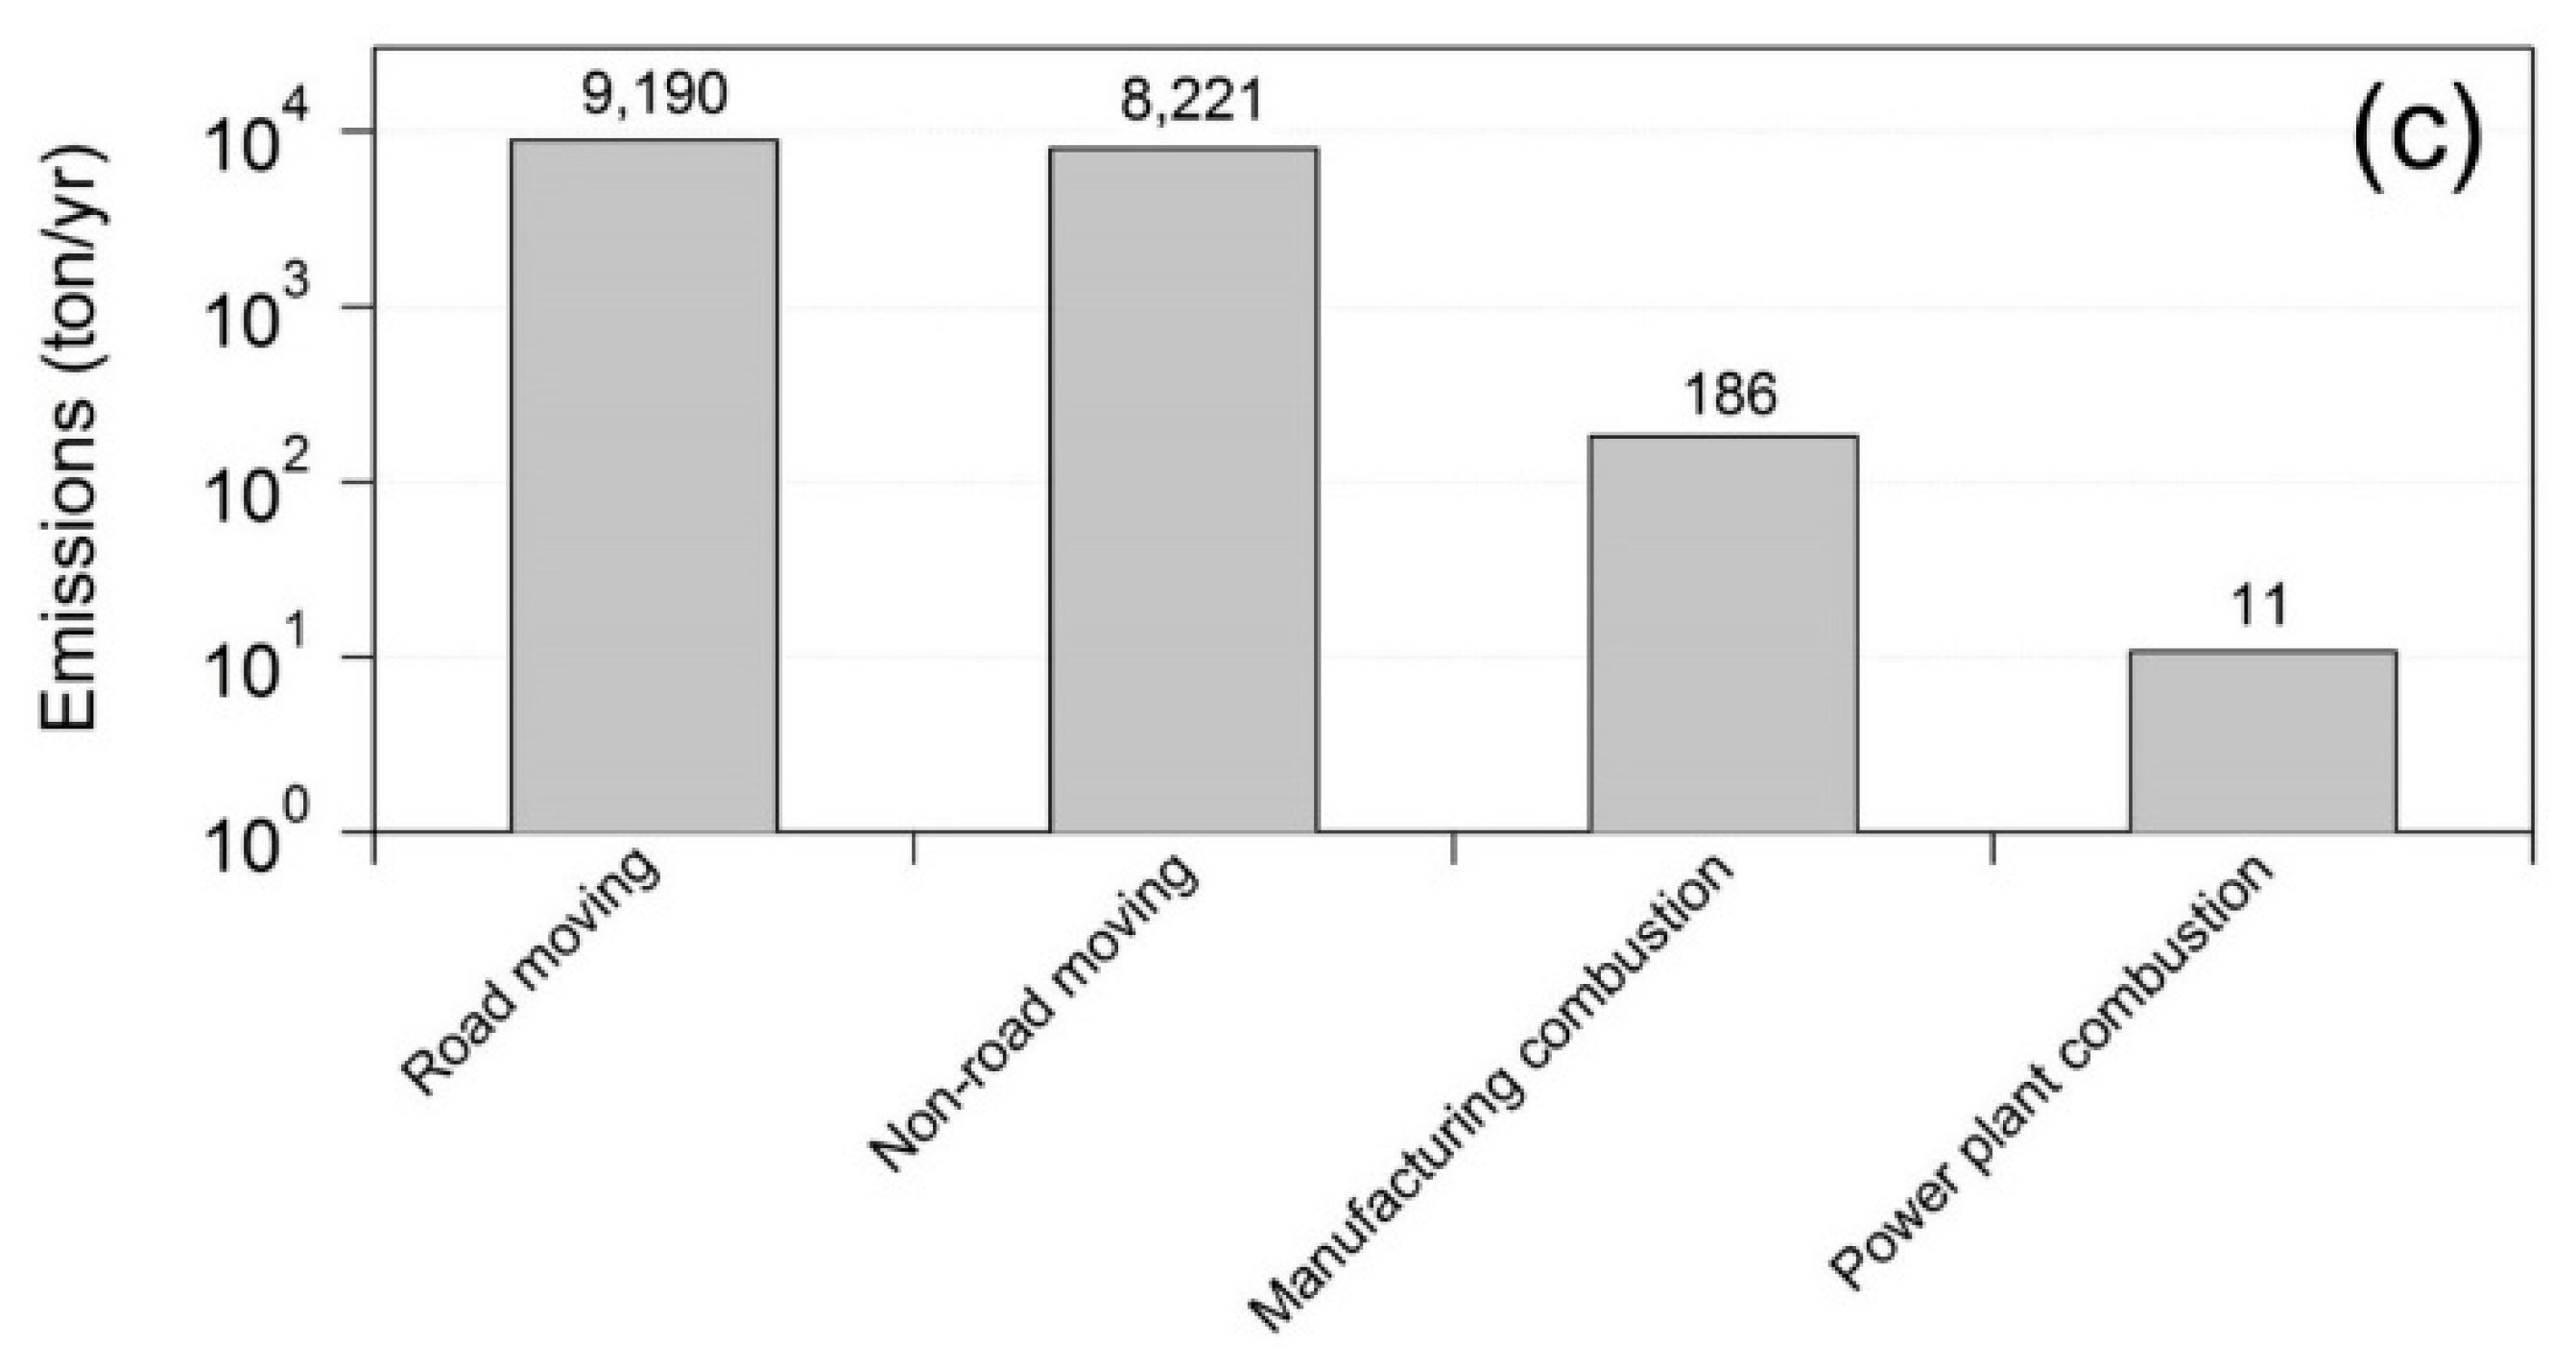
Figure 3 shows the emissions of FPM
2.5 by fuel for each air pollutant source in Korea in 2014 [
25]. Anthracite coal was the largest contributor to emissions of FPM
2.5, followed by diesel. Korea’s air pollutant emission sources are managed by the CAPSS. The CAPSS source classification system is based on the European Core Inventory of Air Emission (CORINAIR) source classification system (SNAP 97) and is divided into 13 major categories. Fuel combustion sources are divided into energy industry (01), non-industry (02), and manufacturing combustion (03). Emissions from manufacturing processes are divided into production process (04). Gasoline evaporation at gas stations and low-cost stations is included in energy transport and storage (05), and emissions from the use of paint including organic solvents represent (06). Automobiles are classified as non-road (08) sources for roads (07), aviation, ships, and construction machinery and include sources for waste treatment (09), as well as agricultural activities (10). Fires are classified as biogenic combustion (13) sources, such as fugitive pollutants (11), road rebuilding, construction activities, fugitive dusts (12), meat grills, and charcoal fireplaces [
25]. According to
Figure 3b, most of the anthracite coal use was by the primary metal manufacturing industry, and non-metallic mineral manufacturing occupied the second place by CAPSS fuel source. According to
Figure 3c, most of the diesel consumption in CAPSS fuel sources was by road and non-road transport sources.
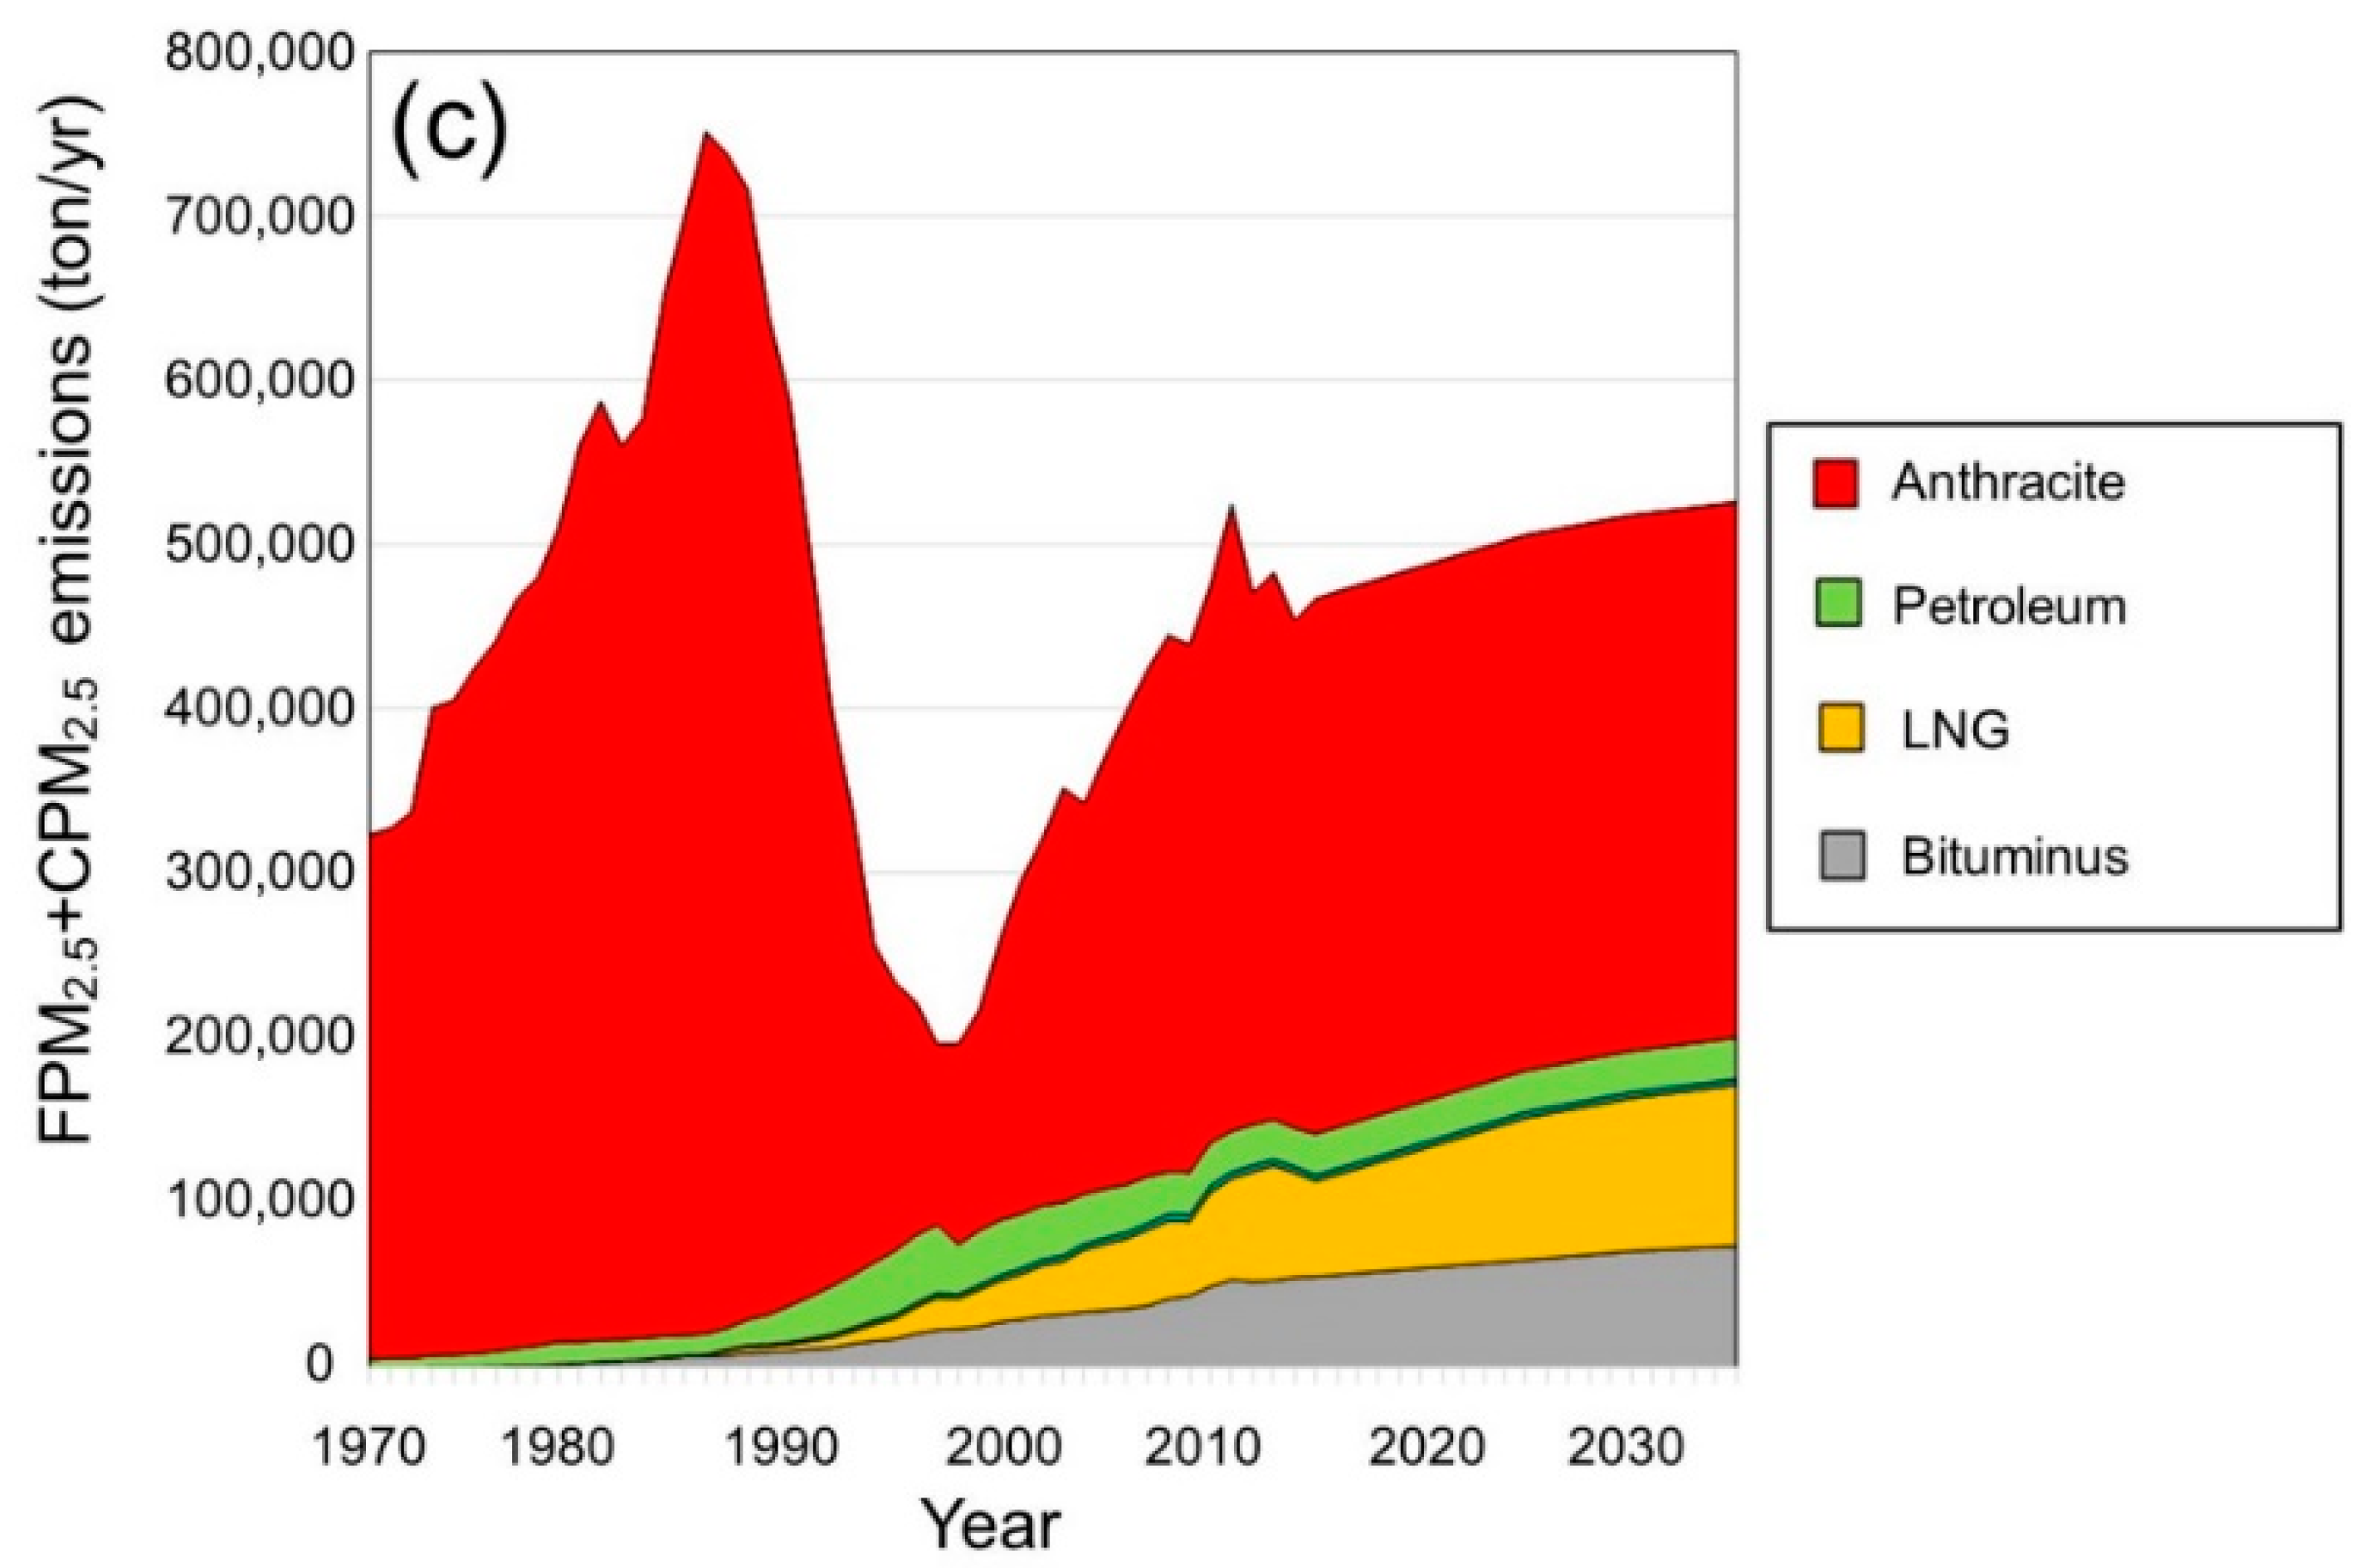
Figure 1c shows the amount of PM
2.5 (FPM
2.5 + CPM
2.5) by fuel calculated by substituting the ratio of CPM
2.5 to FPM
2.5 reported by the NIER in 2016. The contribution of anthracite coal was the highest, followed by LNG, bituminous coal, and energy oil. Regarding FPM
2.5 + CPM
2.5 emissions in 2010, 338,968 tons of anthracite (71.3%) was the largest pollutant, 57,437 tons (12.1%) of LNG was the second largest pollutant, 49,194 tons (10.3%) of bituminous coal was the third largest, and 26,071 tons (5.5%) of oil was the fourth largest. Regarding the composition of FPM
2.5 + CPM
2.5 emissions in 2035, anthracite was the largest at 325,569 tons (61.9%), LNG was second at 97,891 tons (18.6%), bituminous coal was the third at 73,841 tons (14.0%), and oil was the fourth largest at 25,218 tons (4.8%). When the FPM
2.5 and the CPM
2.5 are considered together, the ratio of anthracite coal to LNG is larger than that for the FPM
2.5, but the proportion of LNG is relatively higher.
Figure 4 shows the change in dust emissions according to Scenario 1 of the Korea Energy Mix.
Figure 4a shows Korea’s national energy mix in Scenario 1 in terms of primary energy consumption. Scenario 1 is characterized by the current Korean government’s fine dust reduction policy. This scenario aims to convert nuclear power generation (nuclear fission) and bituminous coal-fired power generation from 2020 to gas power generation (LNG) by 2030. Of course, in reality, nuclear power plants are planned to be phased down by 2070, but this study assumes that the operation of nuclear power plants and bituminous coal-fired power plants will cease in 2030 because of the desire to see the change in the fuel conversion policy more clearly. For Scenario 1 in 2035, LNG is the largest with 249.8 × 10
6 TOE (75.5%), followed by petroleum with 44.9 × 10
6 TOE (13.6%), renewable energy with 18.8 × 10
6 TOE (5.7%), and LPG with 9.3 × 10
6 TOE (2.8%).
Figure 4b shows the FPM
2.5. The conversion of nuclear power and coal-fired power to gas power generation resulted in a gradual increase in PM
2.5 emissions. For Scenario 1 in 2035, according to the FPM emission composition, anthracite was the largest pollutant with 29,760 tons (46.8%), followed by petroleum with 25,218 tons (39.7%), LNG with 6118 tons (10.0%), and it is estimated that LPG will be fourth largest with 63 tons (0.1%).
Figure 4c shows PM
2.5 (FPM
2.5 + CPM
2.5) calculated by applying the CPM
2.5 to FPM
2.5 ratio reported by the NIER in 2016 (Scenario 1 FPM emissions per fuel by year as shown in
Figure 4b + CPM
2.5). Considering the CPM
2.5, the scenarios for converting bituminous coal-fired power to gas-fired power produce markedly different results compared to those shown in the graph of
Figure 1c, which shows the dust emission of the BAU scenario, contrary to the intention of the present government of reducing the dust emissions.
For Scenario 1, LNG was the highest at 333,604 tons (48.5%), followed by anthracite at 325,569 tons (47.3%), petroleum emissions at 25,218 tons (3.7%), and LPG at 3420 tons (0.5%). For Scenario 1, which adopts the Korean government’s dust reduction policy that converts nuclear power and bituminous coal-fired power generation to gas power generation, the dust emissions in 2035 are relatively higher than BAU emissions when considering condensable dust. For this reason, we have decided to establish a policy scenario that can effectively reduce the emission of filterable dust and condensable dust.
Figure 5 shows PM
2.5 emissions according to the Korea energy mix Scenario 2.
Figure 5a shows the Korean energy mix Scenario 2 for each fuel based on primary energy. The characteristics of Scenario 2 are as follows. In
Figure 3c, anthracite coal accounted for the largest portion of the country’s dust emissions, so fuel cells were the primary source to replace anthracite applications (primary metal manufacturing and non-metallic mineral manufacturing industries). The use of bituminous coal-fired thermal power and LNG will gradually decrease over the 15-year period from 2020 to 2035, reducing bituminous coal-fired power by 44.2% compared to that in 2020 and LNG by 66.0% compared to that in 2020. The scenario was replaced by a cogeneration system. Fuel cells can also be operated 24 h a day without stopping. Therefore, we believe that it is possible to substitute bituminous coal-fired power and gas power generation as base load power sources. This did not change the generation portion of nuclear energy. For Scenario 2 in 2035, the generation by LNG fuel cells is the largest with 112.7 × 10
6 TOE (34.1%), followed by nuclear power generation with 70.0 × 10
6 TOE (21.2%), bituminous coal with 58.6 × 10
6 TOE (17.7%), and petroleum with 31.4 × 10
6 TOE (9.5%).
Figure 5b shows the FPM
2.5. It can be seen that the amount of dust emission decreases by replacing anthracite with fuel cell power after 2020. For Scenario 2 in 2035, regarding FPM
2.5 emissions, petroleum was the largest at 17,652 tons (47.8%), followed by anthracite at 14,880 tons (40.3%), bituminous coal at 3712 tons (10.1%), and LNG emissions at 610 tons (1.7%).
Figure 5c shows the amount of total PM (FPM + CPM) by fuel calculated by applying the ratio of CPM
2.5 to FPM
2.5 reported by the National Institute of Environmental Research. For Scenario 2, the anthracite FPM
2.5 + CPM
2.5 emissions in 2035 was 162,784 tons (63.2%), followed by coal with 40,613 tons (15.8%), LNG combustion with 33,283 tons (12.9%), and petroleum with 17,652 tons (6.8%).
Table 4 summarized PM
2.5 emissions by the BAU scenario, 1st energy consumption, and 2nd energy consumption in 2035. The amount of PM
2.5 emissions are in the order of 1st energy consumption, BAU scenario, and 2nd energy consumption. PM
2.5 emission from anthracite in 2nd energy consumption was about twice less than that of BAU and 1st energy consumption because fuel cell substitutes anthracite.
4. Discussion
The results of this study for estimating national emissions according to Scenarios 1 and 2 showed that there was a large difference between the PM
2.5 calculation result according to the existing FPM
2.5 only and the total PM
2.5 result including CPM
2.5. Nevertheless, most countries currently do not measure CPM because they have not felt that is was necessary. Because CPM
2.5 is an important part of PM
2.5, PM
2.5 emissions from combustion sources will be underestimated if the CPM
2.5 is not included in PM
2.5 [
23]. A Japanese study also stated that CPM
2.5 clearly makes important contributions to emissions and concentrations of organic aerosol, and further evaluations of PM
2.5 emission characteristics as well as emission surveys of CPM
2.5 from many representative combustion sources are needed from simulations using Community Multi-scale Air Quality (CMAQ, v5.0.2) [
26].
An interesting point is that general PM
2.5 prevention techniques (cyclone, filter cloth, electrostatic precipitator, etc.) for reducing PM
2.5 emissions from the source may be effective at reducing FPM
2.5 but not at reducing CPM
2.5. In other words,
Table 3 shows that the US EPA’s ratio of CPM
2.5 compared to FPM
2.5 from the 1970s to 1990s is not high because the FPM
2.5 reduction technology decades ago was not efficient; thus, the FPM
2.5 emission factor is not small, and CPM
2.5/FPM
2.5 is not high. However, because the data reported after 2010 include improved techniques for removing FPM
2.5, the absolute value of the FPM
2.5 emission factor at the end of the prevention facility was lower than it was before the 2010s. However, the reduction rate of condensable dust did not improve until now, so the CPM
2.5/FPM
2.5 after the 2010s were relatively high [
12]. Therefore, in order to efficiently reduce the amount of CPM
2.5, which is very high compared to the FPM
2.5 depending on the fuel (especially, LNG), it is necessary to further investigate the cause of CPM
2.5 and the particle size distribution. If we consider the CPM
2.5 in addition to the FPM
2.5 when calculating the emission inventory, it will be necessary to change the priority of the reduction policies aimed to improve national air quality, and the main reduction policies may be completely different from the current ones.
As shown in
Figure 3b, the most significant contribution to the analysis of Korean PM
2.5 emissions by BAU energy use was found to be primary metal manufacturing using anthracite coal. During 2017, Korean blast furnaces produced 47,675,000 tons (67.1%) of iron, and electric furnaces were reported to have produced 23,405,000 tons (32.9%) [
27]. Electric furnace steel mills use scrap iron as a raw material, and carbon dioxide and energy consumption are only one-quarter of those for the conventional blast furnace, while blast furnaces use iron ore and coal as its main raw materials. Therefore, with electric furnace steel mills, resources are recycled, and greenhouse gas emissions and dust generation can be low [
27]. In addition to the PM problem, the problem of environmental damage caused by releasing harmful substances into the atmosphere has become an issue, such as when heavy metals are released from a smelter using raw stone [
28,
29]. Therefore, moving steel mills and smelters from the blast furnace process to the electric furnace process can be more eco-friendly and save energy.
5. Conclusions
In this study, we analyzed the PM2.5 emissions in Korea in past, present, and future energy mix scenarios from 1970 to 2035 using three scenarios, including the BAU energy conversion policy (FPM and TPM), Scenario 1 (the energy conversion policy to increase LNG combustion and decrease bituminous coal combustion), and Scenario 2 (the energy conversion policy to increase fuel cell use). The following conclusions were reached. FPM2.5 was 63,585 ton/year based on BAU. The contribution of anthracite was 46.8%, followed by petroleum at 39.7%, bituminous coal at 10.6%, and LNG at 2.8%.
In Scenario 1, FPM2.5 was 61,158 ton/year, with anthracite (46.8%) contributing the largest share, followed by oil with 39.7%, LNG with 10.0%, and LPG with 0.1%. The conversion of nuclear and bituminous coal power generation to gas-fired power generation is estimated to reduce FPM2.5 emissions by about 3.81%. In Scenario 2, FPM2.5 was 36,917 tons/year, with oil accounting for 47.8%, anthracite for 40.3%, bituminous coal for 10.1%, and LNG for 1.7%. Moreover, it was found that the FPM2.5 emission reduction effect was about 41.94% compared to that for BAU. In other words, it is estimated that the reduction effect of FPM2.5 due to the conversion to fuel cells is 38.13% more than the reduction effect due to the dust emission reduction policy according to the existing national energy conversion policy. For 2035, the PM2.5 (FPM2.5 + CPM2.5) emission results are as follows. BAU was 525,938 tons/year, with anthracite (61.9%), LNG (18.6%), bituminous coal (14.0%), and petroleum (4.8%) as the largest contributors. In Scenario 1, PM2.5 was 687,810 ton/year, with LNG accounting for 48.5%, anthracite 47.3%, petroleum 3.7%, and LPG 4%. Notably, PM2.5 emissions that should be reduced as a result of the current energy conversion policy can increase by 30.78% compared to that with BAU when considering CPM2.5. Thus, it is necessary to review this issue carefully. However, because the CPM2.5 emission factors used in this study were not the official values of the country, an additional study should be carried out to increase the accuracy of the CPM2.5 emission factors. In Scenario 2, PM2.5 was 257,752 ton/year, with anthracite accounting for 63.2%, bituminous coal accounting for 15.8%, LNG combustion accounting for 12.9%, and petroleum accounting for 6.8%. This was a 50.99% reduction compared to the conventional BAU PM2.5 emission results. When considering the CPM2.5, Scenario 2 achieved an excellent dust reduction effect compared with the effect of the dust reduction policy that the Korean government intends to pursue.
In previous studies it has been reported that the proportion of CPM
2.5 is very important in the contribution analysis of atmospheric PM
2.5 sources [
26]. In the future, CPM
2.5 should be considered when estimating PM
2.5 emissions and PM
2.5 reduction. Moreover, continuous studies should be carried out so that the CPM
2.5 emission factors, which were not of high quality in the current measurement and analysis study, can be derived as a certified emission factor.


