Soil Water Content and Temperature Dynamics under Grassland Degradation: A Multi-Depth Continuous Measurement from the Agricultural Pastoral Ecotone in Northwest China


Abstract
1. Introduction
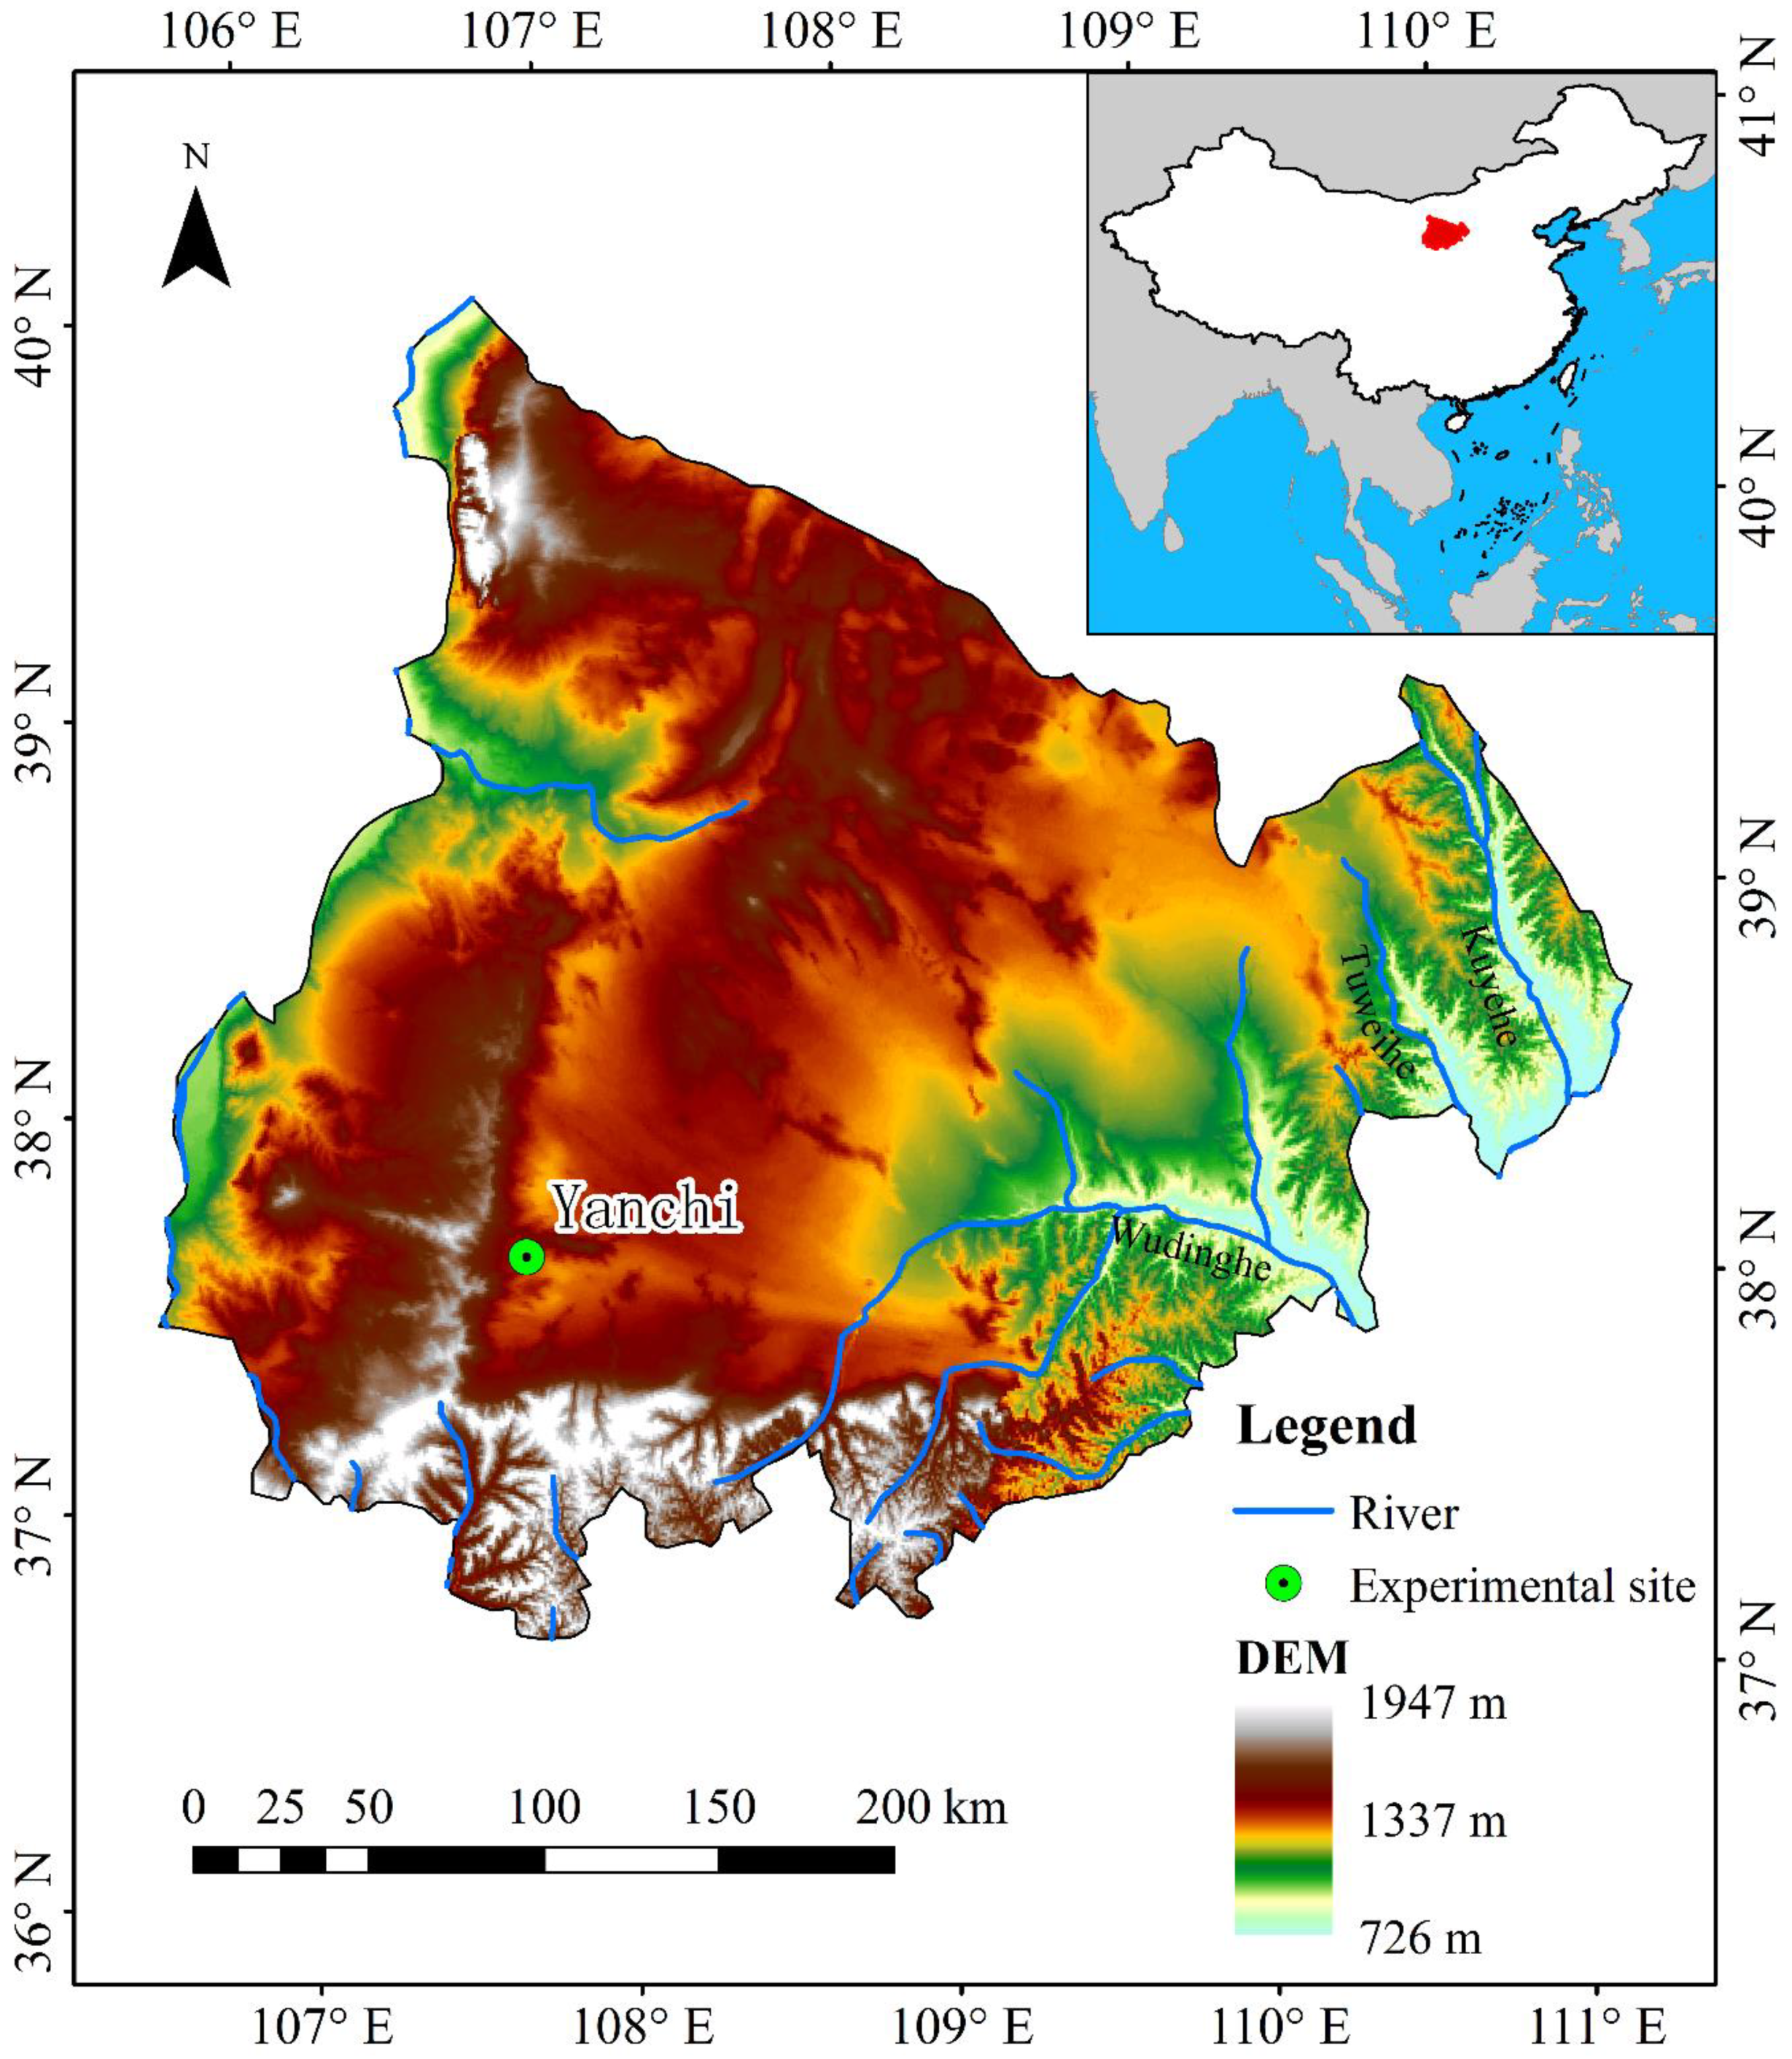
2. Study Area
3. Data and Methods
4. Results and Discussion
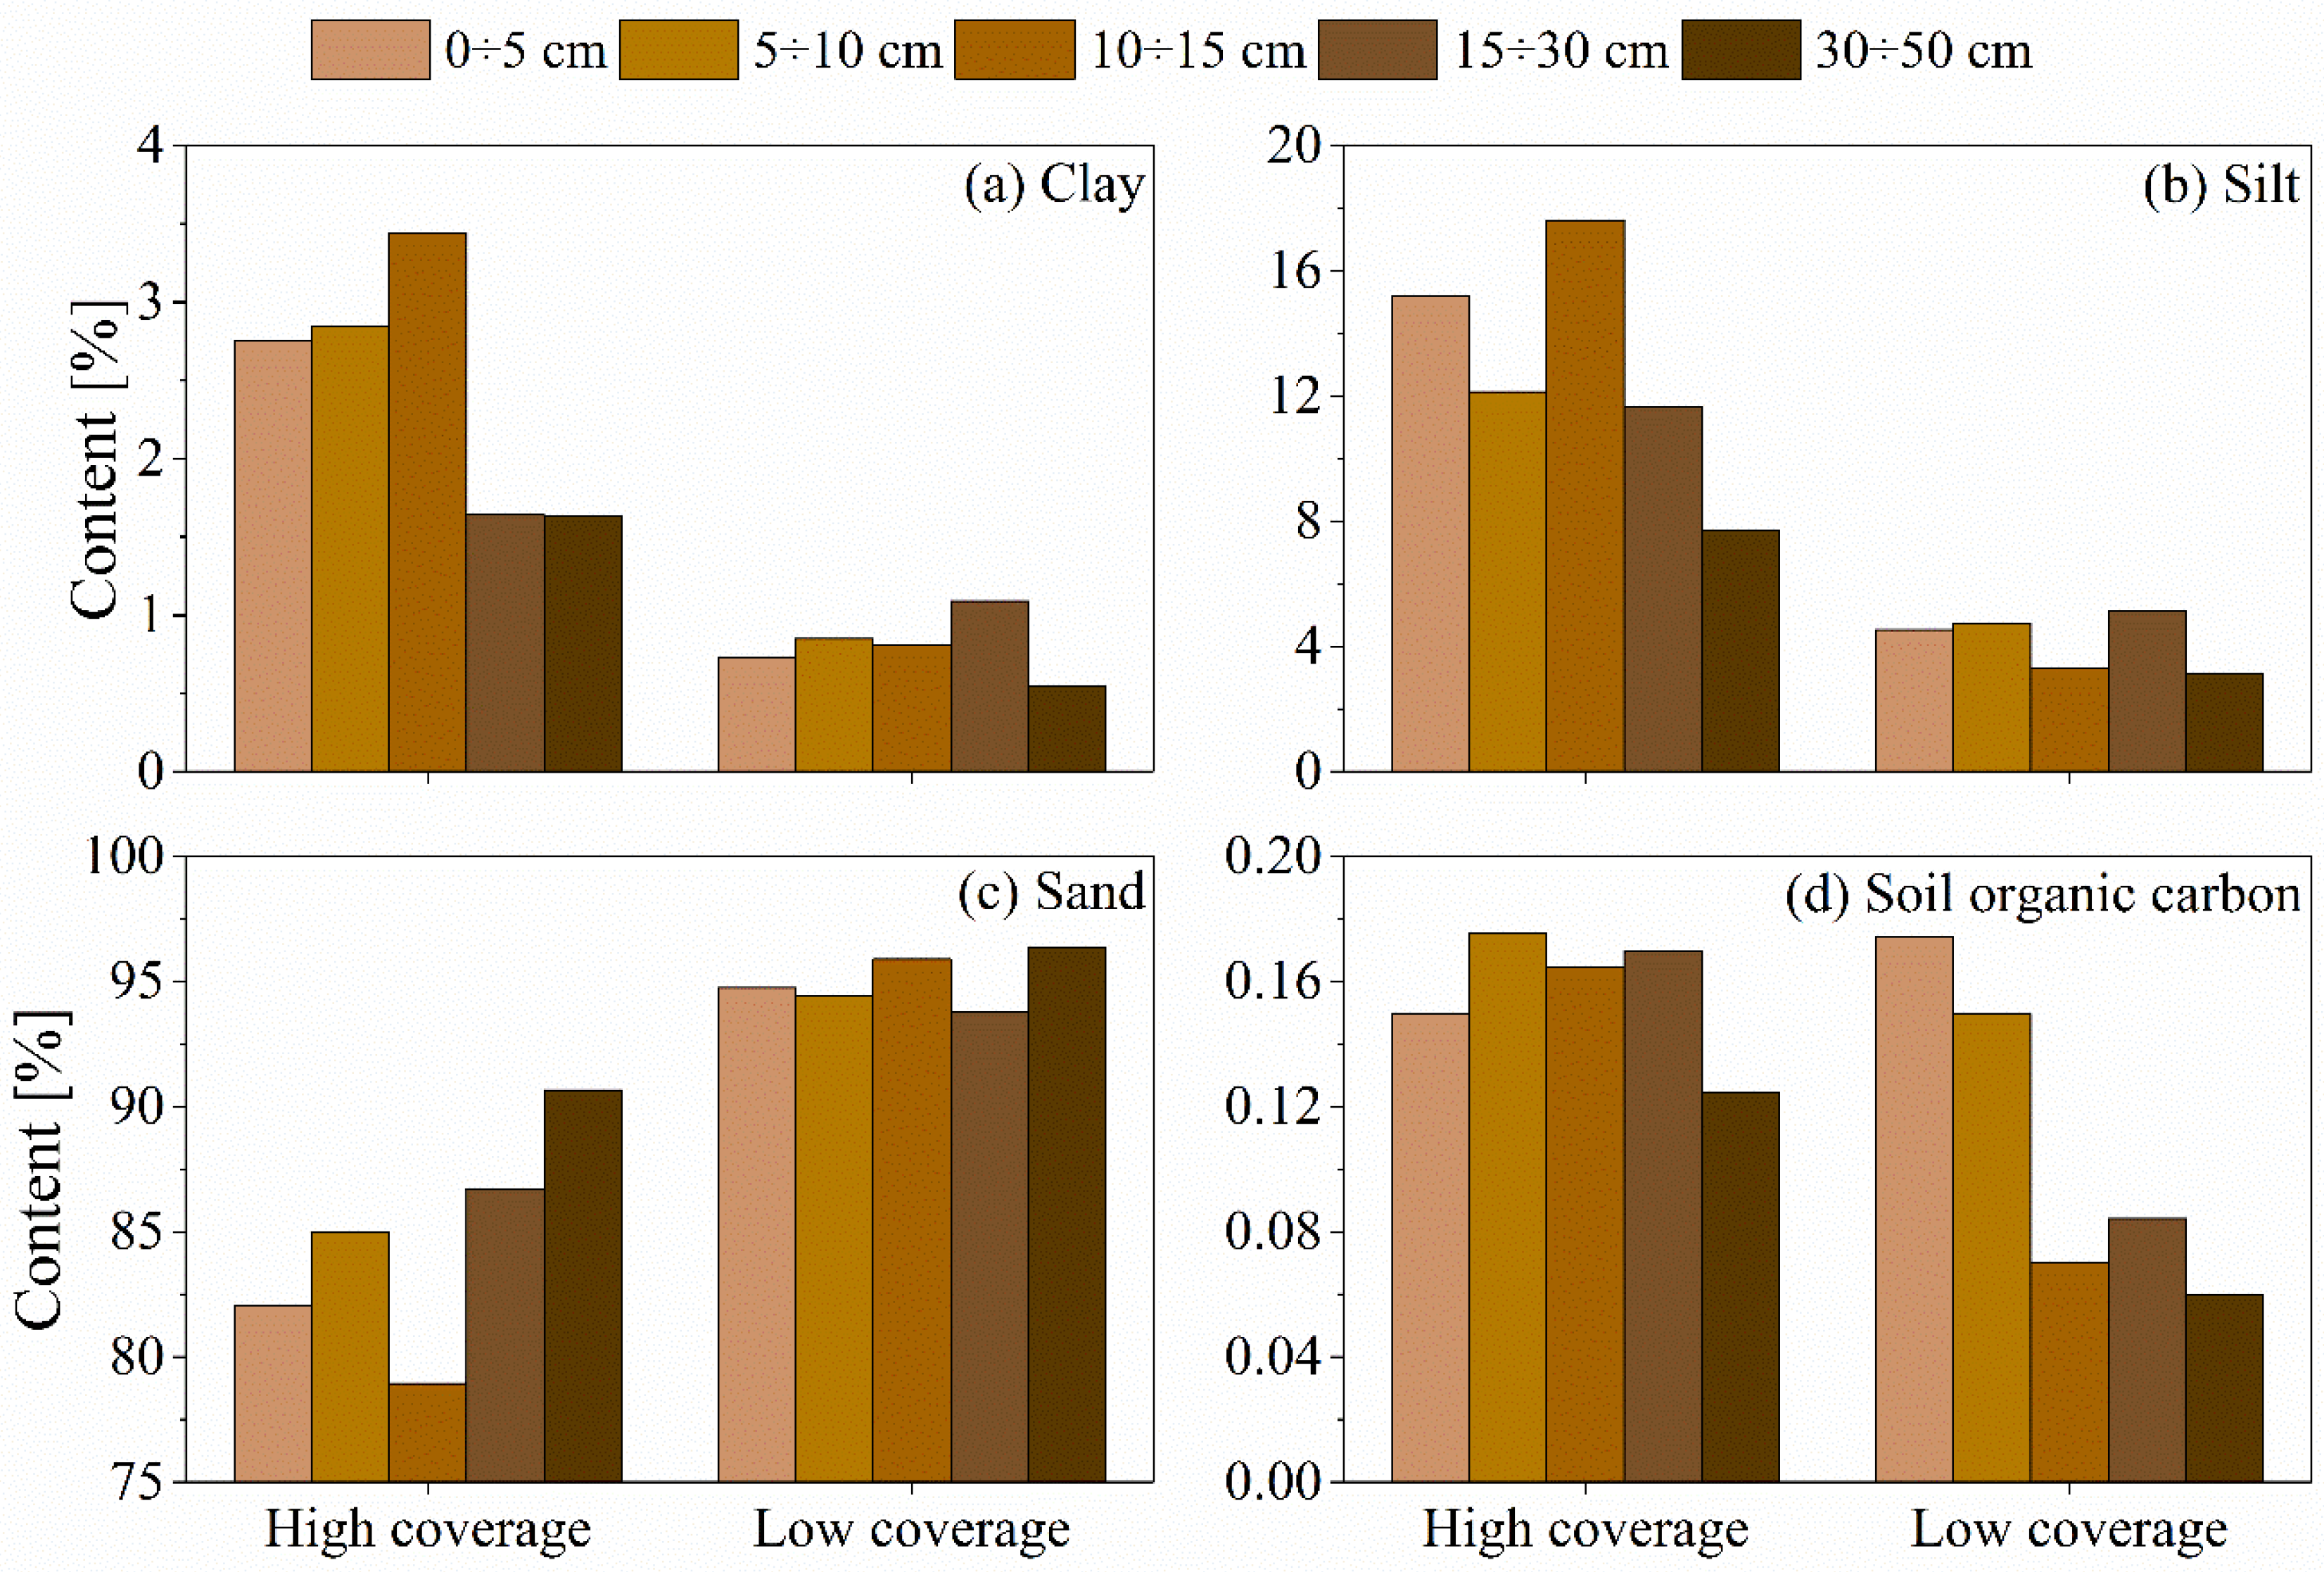
4.1. Soil Physical and Chemical Properties
4.2. Soil Temperature Profiles
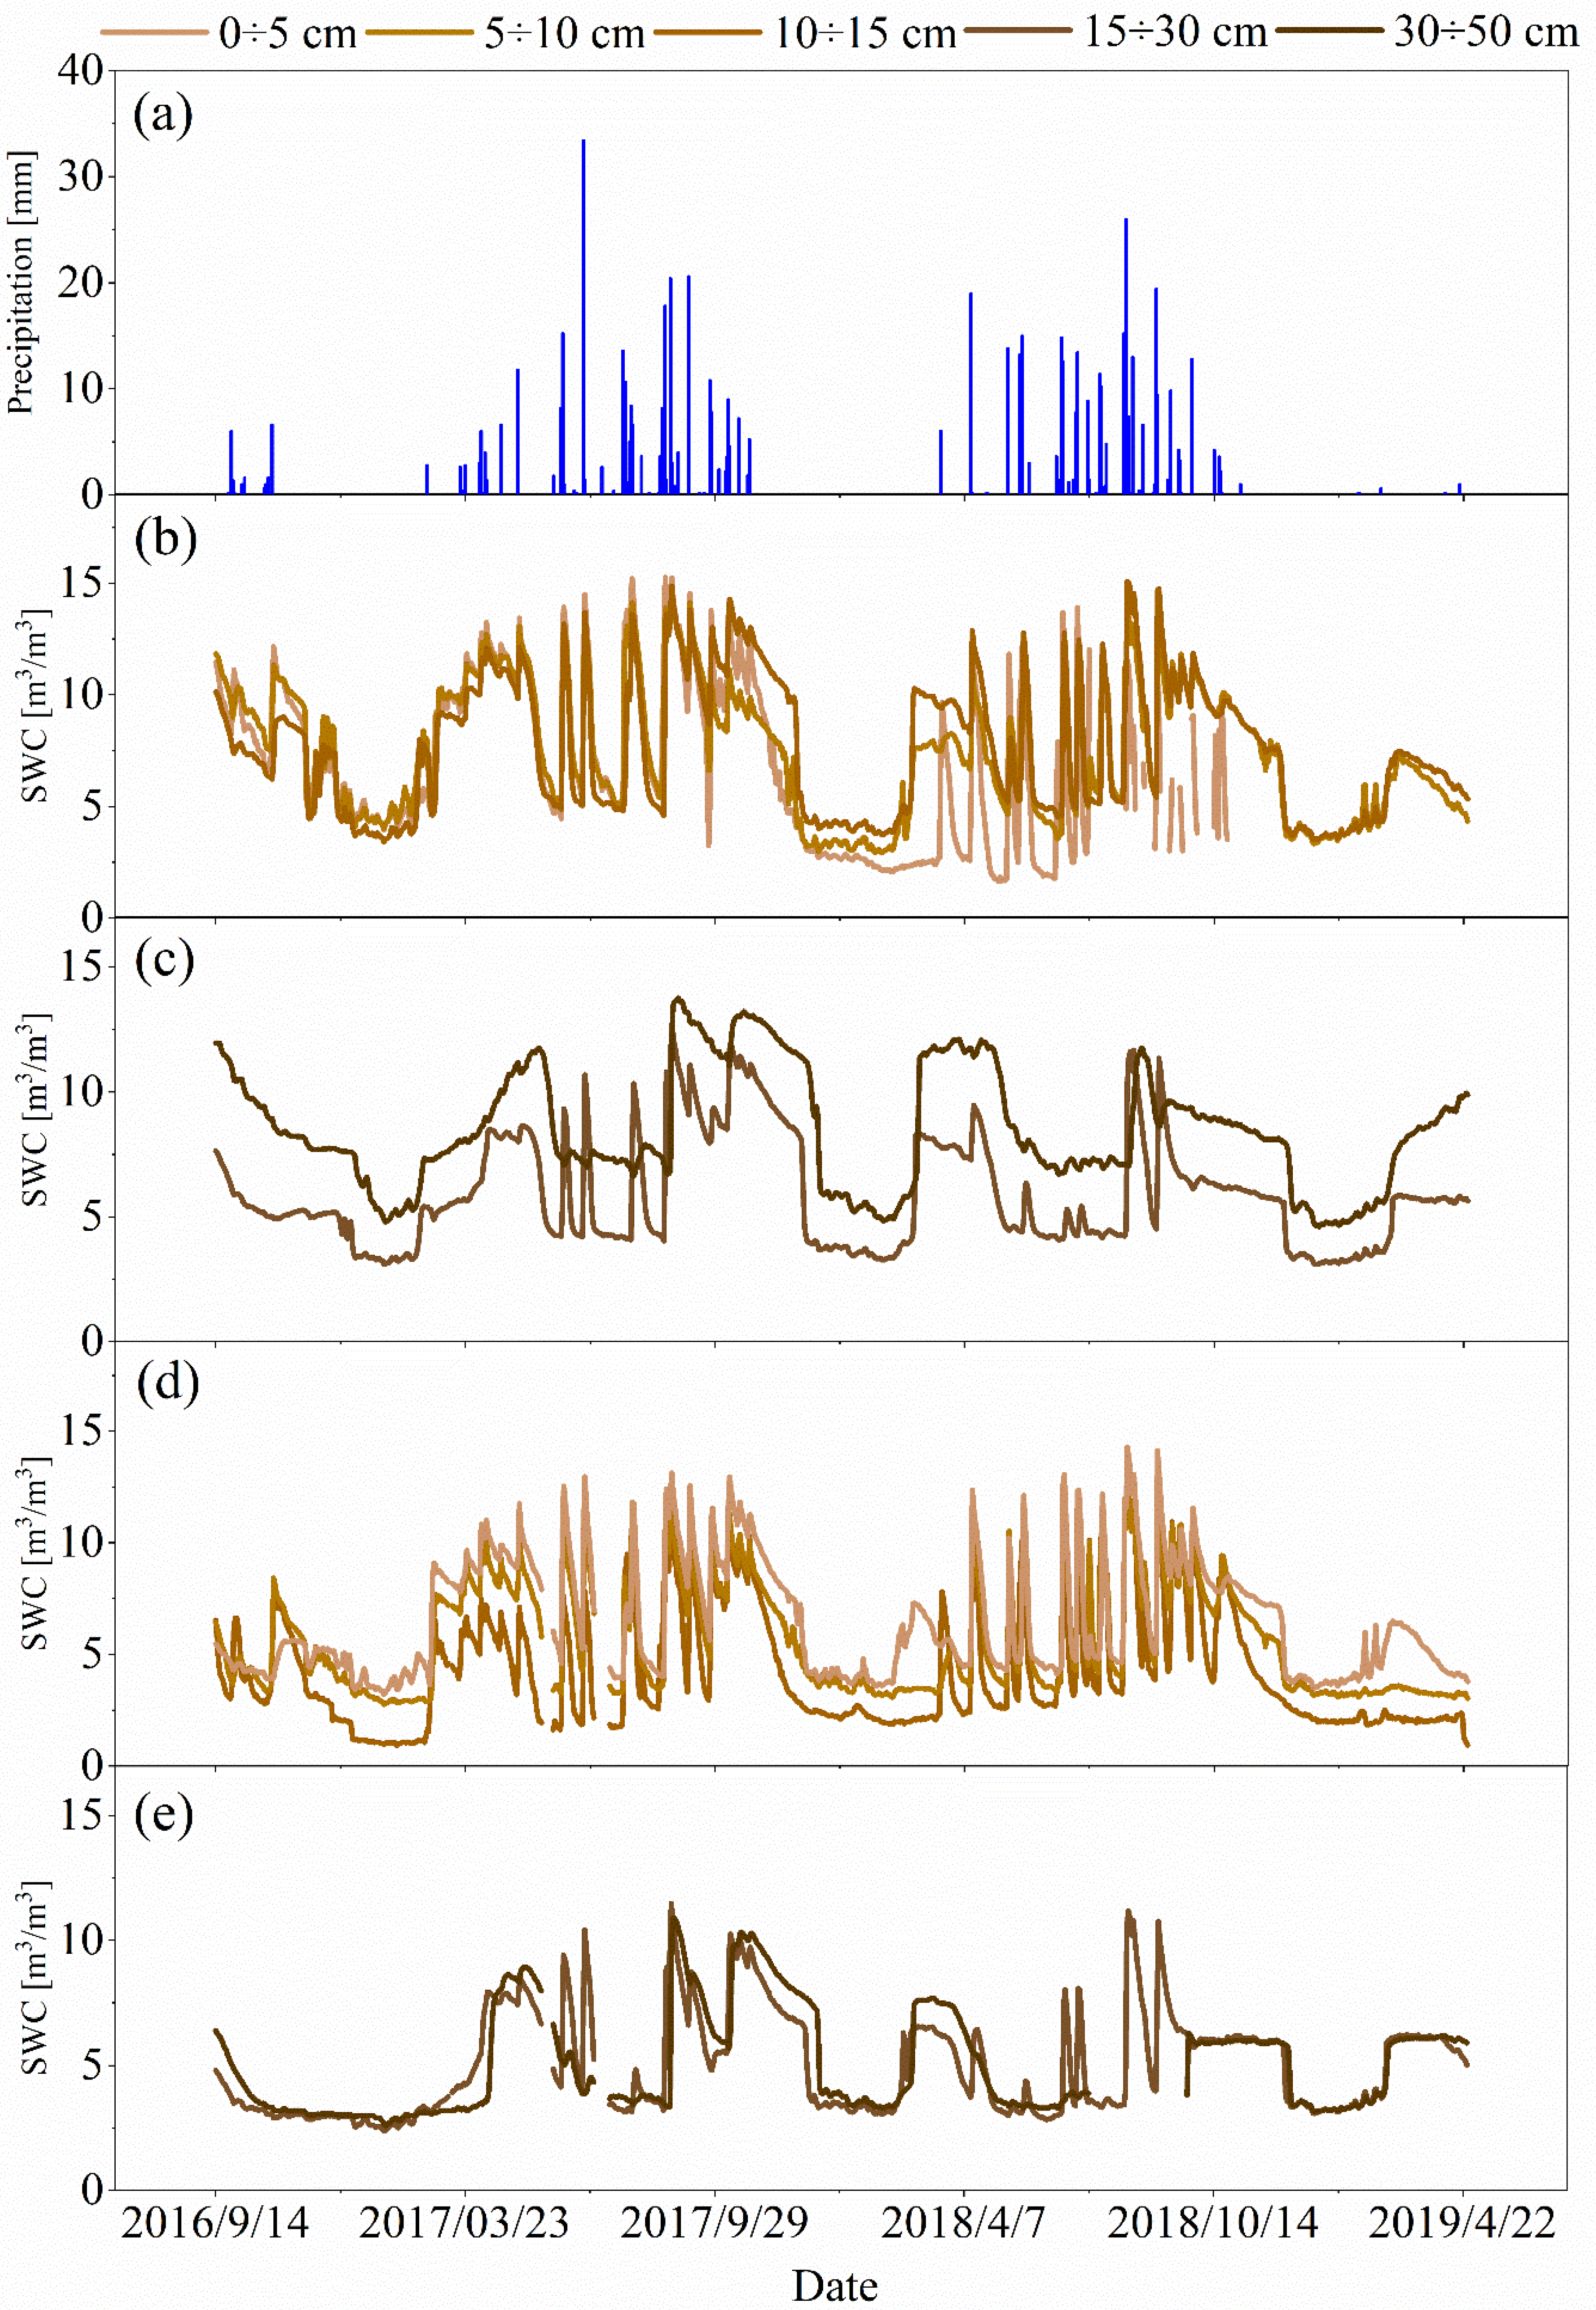
4.3. Soil Water Content Profiles
4.4. Soil Water Content Response to Precipitation
5. Conclusions
Author Contributions
Funding
Acknowledgments
Conflicts of Interest
References
- He, Z.B.; Zhao, W.Z.; Liu, H.; Chang, X.X. The response of soil moisture to rainfall event size in subalpine grassland and meadows in a semi-arid mountain range: A case study in northwestern China’s Qilian Mountains. J. Hydrol. 2012, 420, 183–190. [Google Scholar] [CrossRef]
- Hillel, D. Environmental Soil Physics; Academic Press: San Diego, CA, USA, 1998. [Google Scholar]
- Tian, J.; Zhang, B.Q.; He, C.S.; Han, Z.B.; Bogena, H.R.; Huisman, J.A. Dynamic response patterns of profile soil moisture wetting events under different land covers in the Mountainous area of the Heihe River Watershed, Northwest China. Agric. For. Meteorol. 2019, 271, 225–239. [Google Scholar] [CrossRef]
- Pan, Y.X.; Wang, X.P. Factors controlling the spatial variability of surface soil moisture within revegetated-stabilized desert ecosystems of the Tengger Desert, Northern China. Hydrol. Process. 2009, 23, 1591–1601. [Google Scholar] [CrossRef]
- Albertson, J.D.; Montaldo, N. Temporal dynamics of soil moisture variability: 1. Theoretical basis. Water Resour. Res. 2003, 39. [Google Scholar] [CrossRef]
- Brocca, L.; Tullo, T.; Melone, F.; Moramarco, T.; Morbidelli, R. Catchment scale soil moisture spatial-temporal variability. J. Hydrol. 2012, 422–423, 63–75. [Google Scholar] [CrossRef]
- Qiu, Y.; Fu, B.; Wang, J.; Chen, L. Spatial variability of soil moisture content and its relation to environmental indices in a semi-arid gully catchment of the Loess Plateau, China. J. Arid Environ. 2001, 49, 723–750. [Google Scholar] [CrossRef]
- Tavakol, A.; Rahmani, V.; Quiring, S.M.; Kumar, S.V. Evaluation analysis of NASA SMAP L3 and L4 and SPoRT-LIS soil moisture data in the United States. Remote Sens. Environ. 2019, 229, 234–246. [Google Scholar] [CrossRef]
- Bauer-Marschallingere, B.; Freeman, V.; Cao, S.; Paulik, C.; Schaufler, S.; Stachl, T.; Modanesi, S.; Massario, C.; Ciabatta, L.; Brocca, L.; et al. Toward Global Soil Moisture Monitoring With Sentinel-1: Harnessing Assets and Overcoming Obstacles. IEEE Trans. Geosci. Remote 2019, 57, 520–539. [Google Scholar] [CrossRef]
- El Hajj, M.; Baghdadi, N.; Zribi, M.; Bazzi, H. Synergic Use of Sentinel-1 and Sentinel-2 Images for Operational Soil Moisture Mapping at High Spatial Resolution over Agricultural Areas. Remote Sens. 2017, 9, 1292. [Google Scholar] [CrossRef]
- Andreasen, M.; Jensen, K.H.; Desilets, D.; Franz, T.E.; Zreda, M.; Bogena, H.R.; Looms, M.C. Status and Perspectives on the Cosmic-Ray Neutron Method for Soil Moisture Estimation and Other Environmental Science Applications. Vadose Zone J. 2017, 16. [Google Scholar] [CrossRef]
- Strati, V.; Albéri, M.; Anconelli, S.; Baldoncini, M.; Bittelli, M.; Bottardi, C.; Chiarelli, E.; Fabbri, B.; Guidi, V.; Raptis, K.G.C.; et al. Modelling Soil Water Content in a Tomato Field: Proximal Gamma Ray Spectroscopy and Soil–Crop System Models. Agriculture 2018, 8, 60. [Google Scholar] [CrossRef]
- Western, A.W.; Bloschl, G. On the spatial scaling of soil moisture. J. Hydrol. 1999, 217, 203–224. [Google Scholar] [CrossRef]
- Qiu, Y.; Fu, B.J.; Wang, J.; Zhang, X.L.; Meng, Q.H. Spatiotemporal variation of soil moisture and its relation to environmental factors. Chin. J. Ecol. 2007, 26, 100–107. [Google Scholar] [CrossRef]
- Penna, D.; Brocca, L.; Borga, M.; Dalla Fontana, G. Soil moisture temporal stability at different depths on two alpine hillslopes during wet and dry periods. J. Hydrol. 2013, 477, 55–71. [Google Scholar] [CrossRef]
- Li, H.D.; Shen, W.S.; Zou, C.X.; Jiang, J.; Fu, L.N.; She, G.H. Spatio-temporal variability of soil moisture and its effect on vegetation in a desertified aeolian riparian ecotone on the Tibetan Plateau, China. J. Hydrol. 2013, 479, 215–225. [Google Scholar] [CrossRef]
- Zhang, S.L.; Yang, D.W.; Yang, Y.T.; Piao, S.L.; Yang, H.B.; Lei, H.M.; Fu, B.J. Excessive afforestation and soil drying on China’s Loess Plateau. J. Geophys. Res. Biogeosci. 2018, 123, 923–935. [Google Scholar] [CrossRef]
- Troch, P.A.; Martinez, G.F.; Pauwels, V.R.N.; Durcik, M.; Sivapalan, M.; Harman, C.; Brooks, P.D.; Gupta, H.; Huxman, T. Climate and vegetation water use efficiency at catchment scales. Hydrol. Process. 2009, 23, 2409–2414. [Google Scholar] [CrossRef]
- Trancoso, R.; Larsen, J.R.; McAlpine, C.; McVicar, T.R.; Phinn, S. Linking the Budyko framework and the Dunne diagram. J. Hydrol. 2016, 535, 581–597. [Google Scholar] [CrossRef]
- Nash, M.S.; Wierenga, P.J.; Gutjahr, A. Time-Series analysis of soil-moisture and rainfall along a line transect in arid rangeland. Soil Sci. 1991, 152, 189–198. [Google Scholar] [CrossRef]
- Pan, Y.X.; Wang, X.P.; Jia, R.L.; Chen, Y.W.; He, M.Z. Spatial variability of surface soil moisture content in a re-vegetated desert area in Shapotou, Northern China. J. Arid Environ. 2008, 72, 1675–1683. [Google Scholar] [CrossRef]
- Lin, X.R.; Ma, F.Y.; Long, L.Q.; Jia, X.H. Soil water dynamics under sand-fixing vegetation in Shapotou Area. J. Desert Res. 2001, 3, 3–8. [Google Scholar]
- Zhang, Z.H.; Huisingh, D. Combating desertification in China: Monitoring, control, management and revegetation. J. Clean. Prod. 2018, 182, 765–775. [Google Scholar] [CrossRef]
- Li, F.R.; Zhang, H.; Zhang, T.H.; Shirato, Y. Variations of sand transportation rates in sandy grasslands along a desertification gradient in northern China. Catena 2003, 53, 255–272. [Google Scholar] [CrossRef]
- McVicar, T.R.; Van Niel, T.G.; Li, L.T.; Wen, Z.M.; Yang, Q.K.; Li, R.; Jiao, F. Parsimoniously modelling perennial vegetation suitability and identifying priority areas to support China’s re-vegetation program in the Loess Plateau: Matching model complexity to data availability. For. Ecol. Manag. 2010, 259, 1277–1290. [Google Scholar] [CrossRef]
- Zhang, S.L.; Yang, H.B.; Yang, D.W.; Jayawardena, A.W. Quantifying the effect of vegetation change on the regional water balance within the Budyko framework. Geophys. Res. Lett. 2016, 43, 1140–1148. [Google Scholar] [CrossRef]
- Chen, Y.P.; Wang, K.B.; Lin, Y.S.; Shi, W.Y.; Song, Y.; He, X.H. Balancing green and grain trade. Nat. Geosci. 2015, 8, 739–741. [Google Scholar] [CrossRef]
- Wei, B.; Xie, Y.; Jia, X.; Wang, X.; He, H.; Xue, X. Land use/land cover change and it’s impacts on diurnal temperature range over the agricultural pastoral ecotone of Northern China. Land Degrad. Dev. 2018, 29, 3009–3020. [Google Scholar] [CrossRef]
- Li, Y.; He, T.H.; Qu, X.N. The study on agriculture-animal husbandry industrial adjustment in Yanchi County based on its climate changes. J. Arid Land Resour. Environ. 2009, 13, 82–86. [Google Scholar] [CrossRef]
- Xu, D.M.; Liu, C.F.; Xie, Y.Z.; Wang, K. Changes of soil properties during sandy desertification for grassland in Yanchi County. Res. Soil Water Conserv. 2009, 16, 85–88. [Google Scholar]
- Li, B. Study on the Distribution and Hydrological Characteristics of Biological Soil Crusts in Different Desertificaltion Ecosystem Areas; Beijing Forestry University: Beijing, China, 2015. [Google Scholar]
- Cheng, Z.Q.; Zhang, K.B.; Liu, J.; Chang, J.; Wang, X.; Wang, L.L.; Su, P.F. The study on vegetable niche of natural grassland of desertification grassland region in Yanchi County, Ningxia. Res. Soil Water Conserv. 2011, 18, 36–40. [Google Scholar]
- LI-COR Inc. Plant Canopy Analyzer Operating Manual; LI-COR Inc.: Lincoln, NE, USA, 1991. [Google Scholar]
- Chen, J.M.; Black, T.A. Defining Leaf-Area Index for Non-Flat Leaves. Plant Cell Environ. 1992, 15, 421–429. [Google Scholar] [CrossRef]
- Garriques, S.; Shabanov, N.V.; Swanson, K.; Morisette, J.T.; Baret, F.; Myneni, R.B. Intercomparison and sensitivity analysis of Leaf Area Index retrievals from LAI-2000, AccuPAR, and digital hemispherical photography over croplands. Agric. For. Meteorol. 2008, 148, 1193–1209. [Google Scholar] [CrossRef]
- Decagon Devices Inc. 5TE Operator’s Manual; Decagon Devices Inc.: Pullman, WA, USA, 2010. [Google Scholar]
- Visconti, F.; de Paz, J.M.; Martinez, D.; Molina, M.J. Laboratory and field assessment of the capacitance sensors Decagon 10HS and 5TE for estimating the water content of irrigated soils. Agric. Water Manag. 2014, 132, 111–119. [Google Scholar] [CrossRef]
- Bai, X.; Zhang, L.H.; Wang, Y.B.; Tian, J.; He, C.S.; Liu, G.H. Variations of soil moisture under different land use and land cover types in the Qilian Mountain, China. Res. Soil Water Conserv. 2017, 24, 17–25. [Google Scholar] [CrossRef]
- Zhang, S.Y.; Li, X.Y. Soil moisture and temperature dynamics in typical alpine ecosystems: A continuous multi-depth measurements-based analysis from the Qinghai-Tibet Plateau, China. Hydrol. Res. 2018, 49, 194–209. [Google Scholar] [CrossRef]
- Carson, T.B.; Marasco, D.E.; Culligan, P.J.; McGillis, W.R. Hydrological performance of extensive green roofs in New York City: Observations and multi-year modeling of three full-scale systems. Environ. Res. Lett. 2013, 8. [Google Scholar] [CrossRef]
- Callesen, I.; Keck, H.; Andersen, T.J. Particle size distribution in soils and marine sediments by laser diffraction using Malvern Mastersizer 2000-method uncertainty including the effect of hydrogen peroxide pretreatment. J. Soil Sediment. 2018, 18, 2500–2510. [Google Scholar] [CrossRef]
- Gambill, D.R.; Wall, W.A.; Fulton, A.J.; Howard, H.R. Predicting USCS soil classification from soil property variables using Random Forest. J. Terramech. 2016, 65, 85–92. [Google Scholar] [CrossRef]
- Boguta, P.; Sokolowska, Z. Statistical relationship between selected physicochemical properties of peaty-muck soils and their fraction of humic acids. Int. Agrophys. 2014, 28, 269–278. [Google Scholar] [CrossRef]
- Wang, Y.B.; Wang, G.X.; Zhang, C.M.; Long, X.J. Response of soil physicochemical properties to the change of the vegetation ecosystem on the Tibetan Plateau. J. Glaciol. Geocryol. 2007, 6, 921–927. [Google Scholar]
- Sun, Y.; Wang, Y.B.; Sun, Z.; Liu, G.H.; Gao, Z.Y. Impact of soil organic matter on water hold capacity in permafrost active layer in the Tibetan Plateau. J. Desert Res. 2017, 37, 288–295. [Google Scholar]
- Romanovsky, V.E.; Osterkamp, T.E. Thawing of the active layer on the coastal plain of the Alaskan Arctic. Permafr. Periglac. Process. 1997, 8, 1–22. [Google Scholar] [CrossRef]
- Liu, G.S.; Wang, G.X.; Hu, H.C.; Li, T.B.; Wang, J.F.; Ren, D.X.; Huang, Y.J. Influence of vegetation coverage on water and heat processes of the active layer in permafrost regions of the Tibetan Plateau. J. Glaciol. Geocryol. 2009, 31, 89–95. [Google Scholar]
- Chai, W.; Wang, G.X.; Li, Y.S.; Hu, H.C. Response of soil moisture under different vegetation coverage to precipitation in the headwaters of the Yangtze River. J. Glaciol. Geocryol. 2008, 2, 329–337. [Google Scholar]
- Wang, G.X.; Shen, Y.P.; Qian, J.; Wang, J.D. Study on the influence of vegetation change on soil moisture cycle in alpine meadow. J. Glaciol. Geocryol. 2003, 25, 653–659. [Google Scholar]
- Wang, J.D.; Wang, G.X.; Chen, L. Impact factors to soil moisture of alpine meadow and their spatial heterogeneity. J. Glaciol. Geocryol. 2006, 28, 428–433. [Google Scholar]
- Tian, J.; Zhang, B.Q.; He, C.S.; Yang, L.X. Variability in soil hydraulic conductivity and soil hydrological response under different land covers in the mountainous area of the Heihe River Watershed, Northwest China. Land Degrad. Dev. 2017, 28, 1437–1449. [Google Scholar] [CrossRef]


| Coverage | Year | 0 ÷ 5 cm | 5 ÷ 10 cm | 10 ÷ 15 cm | 15 ÷ 30 cm | 30 ÷ 50 cm |
|---|---|---|---|---|---|---|
| High | 2016–2017 | 62 | 61 | 61 | 51 | 39 |
| 2017–2018 | 95 | 87 | 81 | 83 | 71 | |
| 2018–2019 | 81 | 79 | 77 | 79 | 73 | |
| Low | 2016–2017 | 50 | 51 | 47 | 47 | 26 |
| 2017–2018 | 72 | 74 | 73 | 69 | 55 | |
| 2018–2019 | 79 | 78 | 76 | 68 | 64 |
| Coverage | Depth [cm] | Mean SWC [m3/m3] (10−2) | SD [m3/m3] (10−2) | CV [%] | Range [m3/m3] (10−2) * | Median [m3/m3] (10−2) |
|---|---|---|---|---|---|---|
| High | 0 ÷ 5 | 6.9 | 3.6 | 52 | 13.6 | 6.2 |
| 5 ÷ 10 | 7.5 | 2.9 | 39 | 11.4 | 7.2 | |
| 10 ÷ 15 | 7.6 | 3.0 | 39 | 11.3 | 7.4 | |
| 15 ÷ 30 | 5.9 | 2.2 | 37 | 9.6 | 5.4 | |
| 30 ÷ 50 | 8.5 | 2.3 | 28 | 9.1 | 8.1 | |
| Low | 0 ÷ 5 | 4.2 | 2.6 | 62 | 11.7 | 3.2 |
| 5 ÷ 10 | 5.6 | 2.4 | 44 | 10.2 | 4.5 | |
| 10 ÷ 15 | 6.5 | 2.6 | 40 | 11.1 | 5.5 | |
| 15 ÷ 30 | 5.0 | 2.0 | 40 | 9.1 | 4.2 | |
| 30 ÷ 50 | 5.0 | 2.1 | 41 | 5.3 | 3.9 |
| Coverage | Seasons | Depth [cm] | Mean SWC [m3/m3] (10−2) | SD [m3/m3] (10−2) | CV [%] | Range [m3/m3] (10−2) | Median [m3/m3] (10−2) |
|---|---|---|---|---|---|---|---|
| High | Spring (Mar–May) | 0 ÷ 5 | 7.4 | 3.8 | 52 | 11.8 | 8.4 |
| 5 ÷ 10 | 8.2 | 2.3 | 28 | 8.8 | 7.7 | ||
| 10 ÷ 15 | 8.5 | 2.1 | 24 | 8.6 | 8.9 | ||
| 15 ÷ 30 | 6.6 | 1.4 | 21 | 5.2 | 5.9 | ||
| 30 ÷ 50 | 9.7 | 1.9 | 16 | 5.6 | 9.4 | ||
| Summer (Jun–Aug) | 0 ÷ 5 | 7.6 | 3.9 | 52 | 13.5 | 6.3 | |
| 5 ÷ 10 | 8.1 | 3.2 | 39 | 10.8 | 6.8 | ||
| 10 ÷ 15 | 7.7 | 3.3 | 43 | 10.6 | 5.5 | ||
| 15 ÷ 30 | 5.7 | 2.4 | 42 | 5.7 | 4.4 | ||
| 30 ÷ 50 | 7.7 | 1.4 | 19 | 7.1 | 7.3 | ||
| Autumn (Sep–Nov) | 0 ÷ 5 | 8.7 | 2.6 | 29 | 11.5 | 9.2 | |
| 5 ÷ 10 | 9.4 | 1.7 | 18 | 9.6 | 9.5 | ||
| 10 ÷ 15 | 9.7 | 2.1 | 21 | 10.3 | 9.6 | ||
| 15 ÷ 30 | 7.4 | 2.0 | 28 | 7.1 | 6.5 | ||
| 30 ÷ 50 | 10.3 | 1.8 | 18 | 6.1 | 9.6 | ||
| Winter (Dec–Feb) | 0 ÷ 5 | 3.9 | 1.5 | 28 | 6.9 | 4.1 | |
| 5 ÷ 10 | 4.5 | 1.4 | 30 | 6.1 | 4.1 | ||
| 10 ÷ 15 | 4.6 | 1.2 | 26 | 6.9 | 4.1 | ||
| 15 ÷ 30 | 3.9 | 0.9 | 23 | 5.3 | 3.5 | ||
| 30 ÷ 50 | 6.1 | 1.5 | 24 | 6.9 | 5.6 | ||
| Low | Spring (Mar–May) | 0 ÷ 5 | 4.0 | 2.1 | 53 | 9.6 | 3.2 |
| 5 ÷ 10 | 5.6 | 2.3 | 41 | 8.0 | 4.7 | ||
| 10 ÷ 15 | 7.0 | 2.2 | 32 | 9.4 | 6.4 | ||
| 15 ÷ 30 | 5.6 | 1.5 | 27 | 5.4 | 6.1 | ||
| 30 ÷ 50 | 5.8 | 1.9 | 33 | 5.8 | 6.1 | ||
| Summer (Jun–Aug) | 0 ÷ 5 | 5.4 | 3.1 | 57 | 11.0 | 4.2 | |
| 5 ÷ 10 | 6.6 | 2.8 | 43 | 9.3 | 6.1 | ||
| 10 ÷ 15 | 7.2 | 3.1 | 43 | 10.4 | 5.6 | ||
| 15 ÷ 30 | 5.1 | 2.5 | 48 | 8.6 | 3.8 | ||
| 30 ÷ 50 | 4.2 | 1.4 | 34 | 7.6 | 3.8 | ||
| Autumn (Sep–Nov) | 0 ÷ 5 | 6.0 | 2.3 | 39 | 9.7 | 5.7 | |
| 5 ÷ 10 | 7.1 | 1.9 | 27 | 9.6 | 7.1 | ||
| 10 ÷ 15 | 7.7 | 2.3 | 30 | 10.2 | 8.0 | ||
| 15 ÷ 30 | 5.9 | 2.0 | 35 | 7.9 | 6.0 | ||
| 30 ÷ 50 | 6.3 | 2.2 | 35 | 7.5 | 6.0 | ||
| Winter (Dec–Feb) | 0 ÷ 5 | 2.1 | 0.7 | 36 | 5.6 | 2.1 | |
| 5 ÷ 10 | 3.5 | 0.6 | 18 | 5.0 | 3.4 | ||
| 10 ÷ 15 | 4.4 | 1.0 | 23 | 6.0 | 4.0 | ||
| 15 ÷ 30 | 3.5 | 1.0 | 28 | 4.4 | 3.3 | ||
| 30 ÷ 50 | 3.8 | 1.2 | 32 | 5.3 | 3.4 |
© 2019 by the authors. Licensee MDPI, Basel, Switzerland. This article is an open access article distributed under the terms and conditions of the Creative Commons Attribution (CC BY) license (http://creativecommons.org/licenses/by/4.0/).
Share and Cite
Yang, W.; Wang, Y.; He, C.; Tan, X.; Han, Z. Soil Water Content and Temperature Dynamics under Grassland Degradation: A Multi-Depth Continuous Measurement from the Agricultural Pastoral Ecotone in Northwest China. Sustainability 2019, 11, 4188. https://doi.org/10.3390/su11154188
Yang W, Wang Y, He C, Tan X, Han Z. Soil Water Content and Temperature Dynamics under Grassland Degradation: A Multi-Depth Continuous Measurement from the Agricultural Pastoral Ecotone in Northwest China. Sustainability. 2019; 11(15):4188. https://doi.org/10.3390/su11154188
Chicago/Turabian StyleYang, Wenjing, Yibo Wang, Chansheng He, Xingyan Tan, and Zhibo Han. 2019. "Soil Water Content and Temperature Dynamics under Grassland Degradation: A Multi-Depth Continuous Measurement from the Agricultural Pastoral Ecotone in Northwest China" Sustainability 11, no. 15: 4188. https://doi.org/10.3390/su11154188
APA StyleYang, W., Wang, Y., He, C., Tan, X., & Han, Z. (2019). Soil Water Content and Temperature Dynamics under Grassland Degradation: A Multi-Depth Continuous Measurement from the Agricultural Pastoral Ecotone in Northwest China. Sustainability, 11(15), 4188. https://doi.org/10.3390/su11154188