Selection of the Most Sustainable Renewable Energy System for Bozcaada Island: Wind vs. Photovoltaic


Abstract
1. Introduction
1.1. Research Motivation
1.1.1. Review of Life Cycle Assessment (LCA) and Life Cycle Cost (LCC)
1.1.2. LCA Applications of Renewable Technologies
LCA of Solar Panels
LCA of the Onshore Wind Farm
LCA of Photovoltaic vs. Wind Systems
2. System Boundaries and Methodology
2.1. System Boundaries
2.2. Life Cycle Assessment (LCA) and Life Cycle Cost (LCC)
2.2.1. Life Cycle Assessment (LCA)
Production Phase
Construction Phase
Operation and Maintenance Phase
Decommissioning and Recycling (or Disposal) Phase
2.2.2. Life Cycle Cost (LCC)
Initial Investment Costs
Operation and Maintenance Costs
Disposal or Recycling Costs
3. Ground-Mounted Photovoltaic Plant
3.1. Model Structure and Assumptions
3.2. Life Cycle Inventory (LCI) of the Photovoltaic System
3.3. Life Cycle Cost (LCC) of the Photovoltaic System
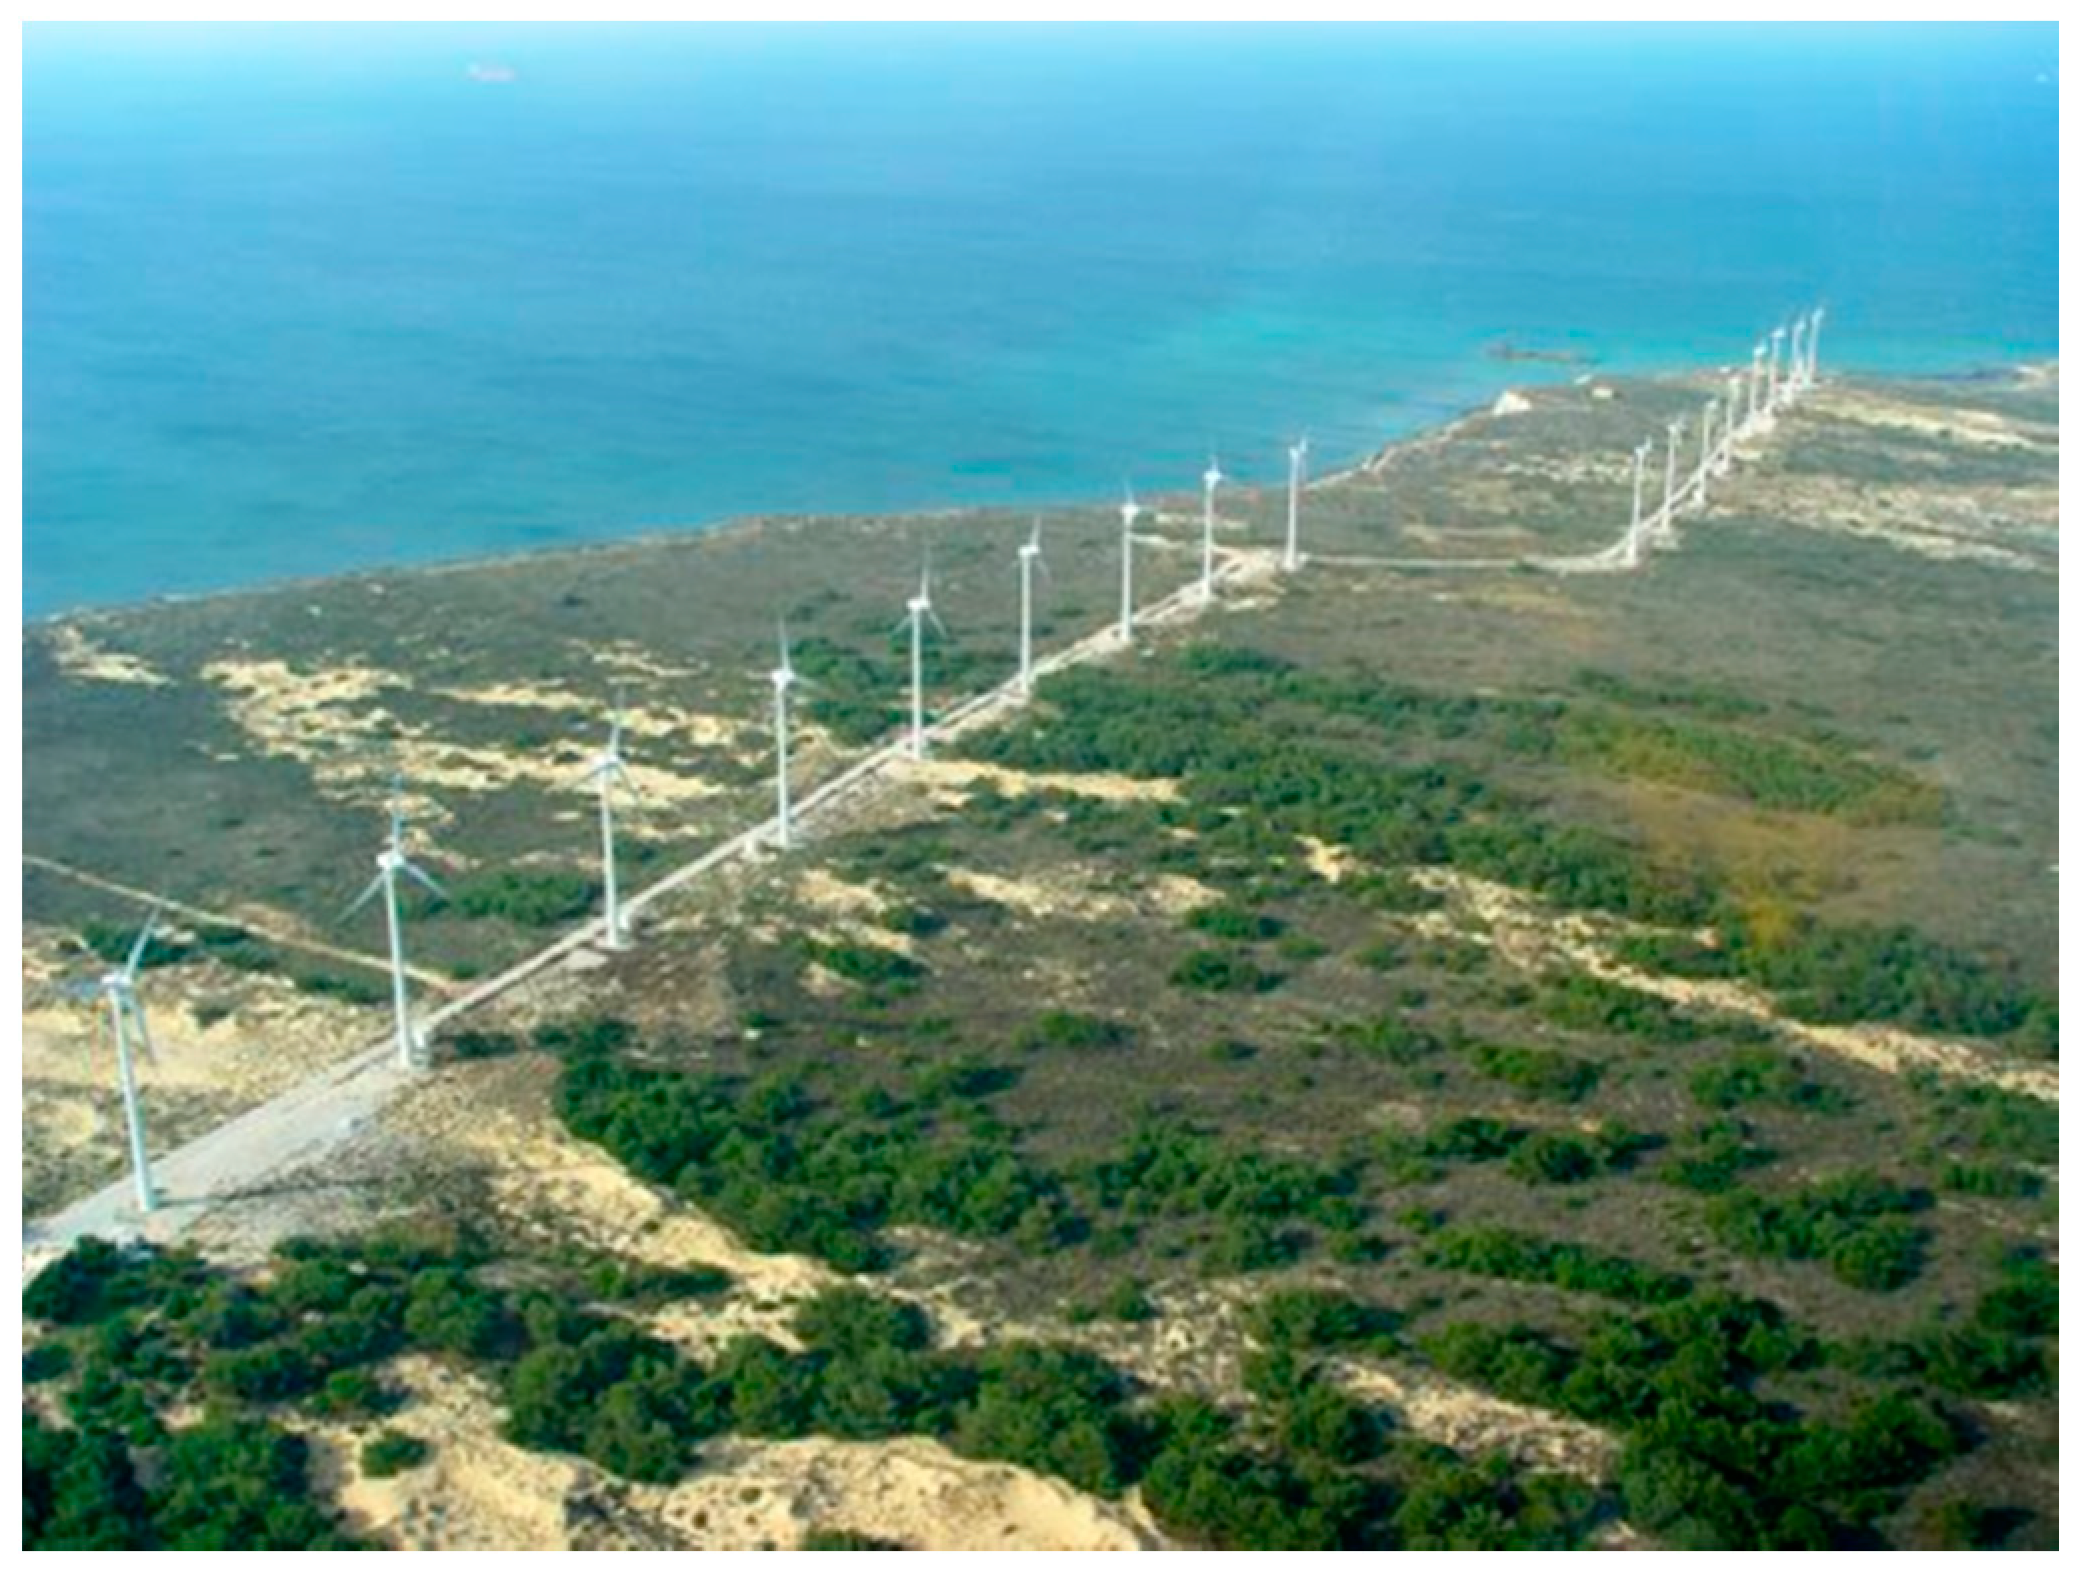
4. Onshore Wind Farm
4.1. Model Structure and Assumptions
4.2. Life Cycle Inventory (LCI) of Onshore Wind Farm
4.2.1. Moving Parts of the Wind Turbine
Nacelle
Rotor
4.2.2. Moving Parts of the Wind Turbine
Tower
Foundations and Roads
4.3. Life Cycle Cost (LCC) of Onshore Wind Farm
5. Results
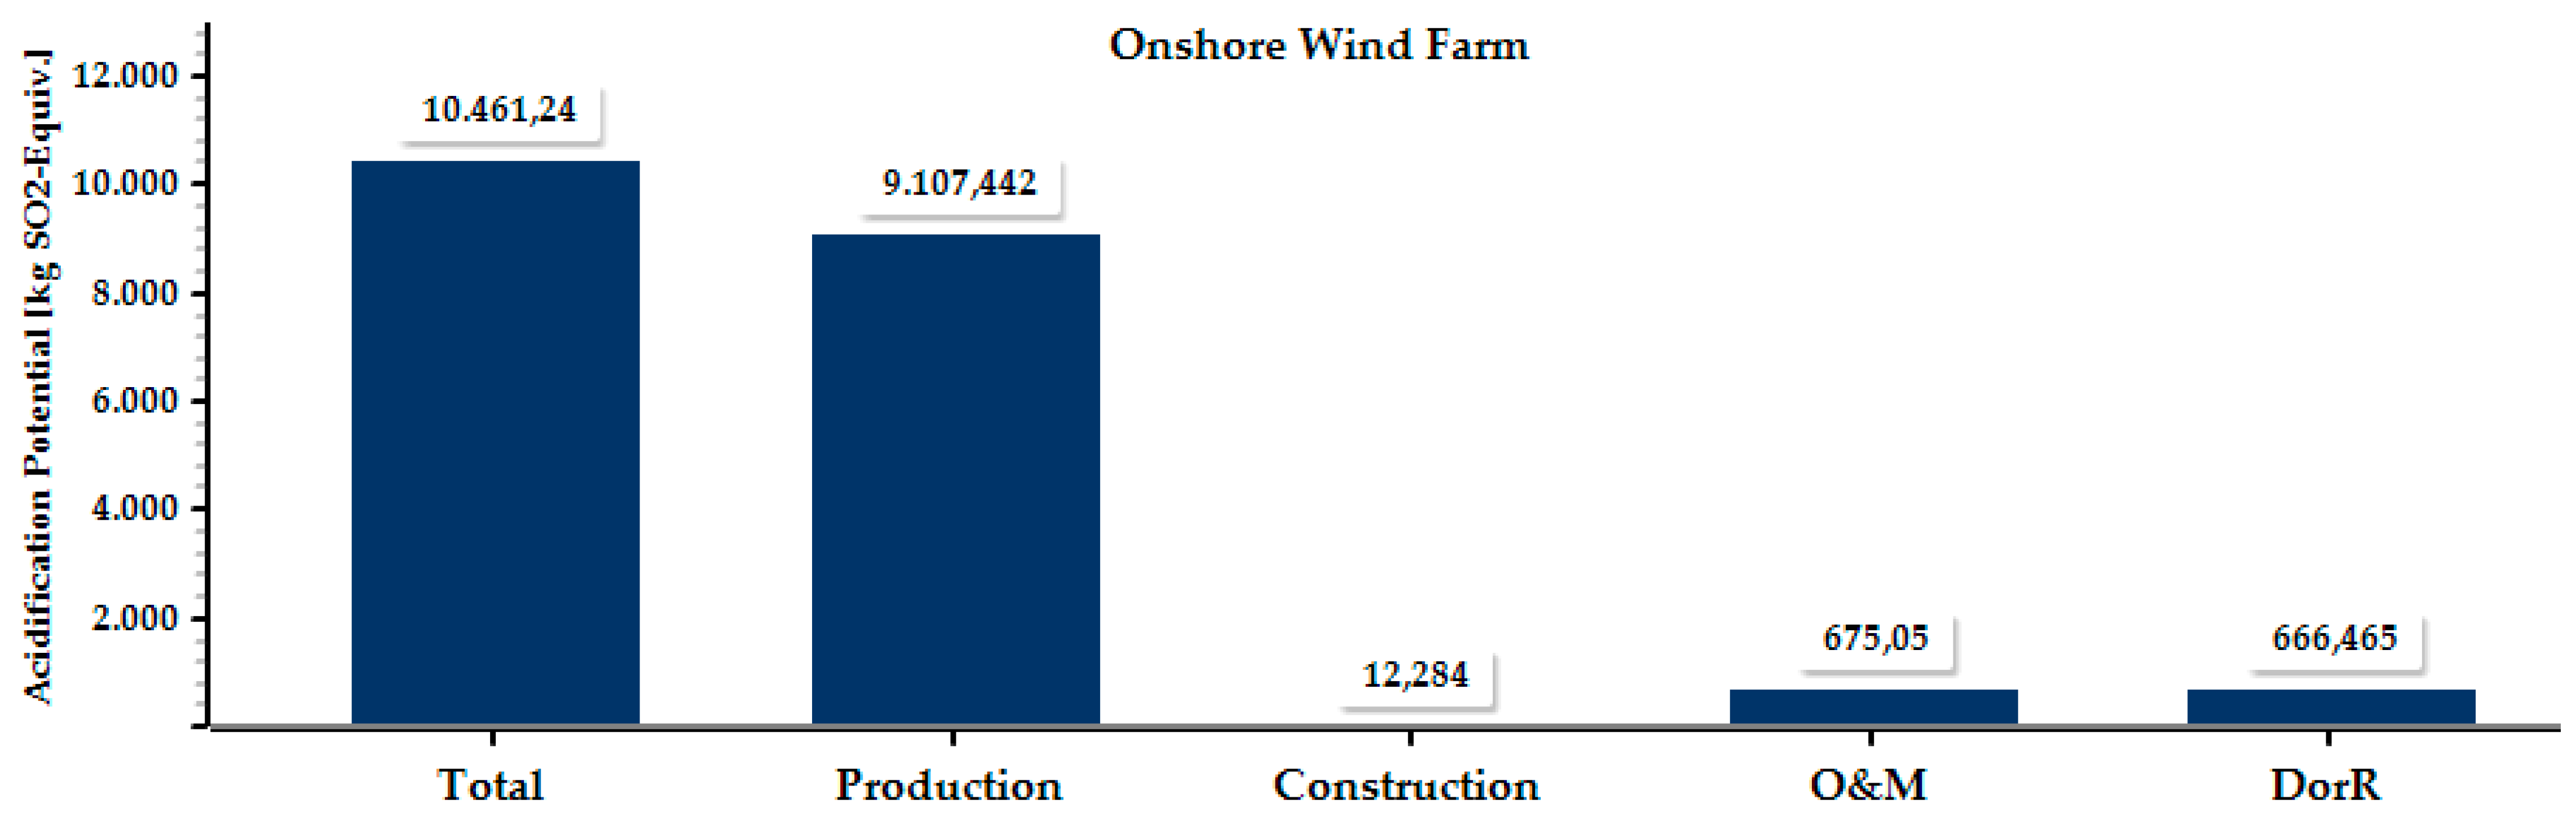
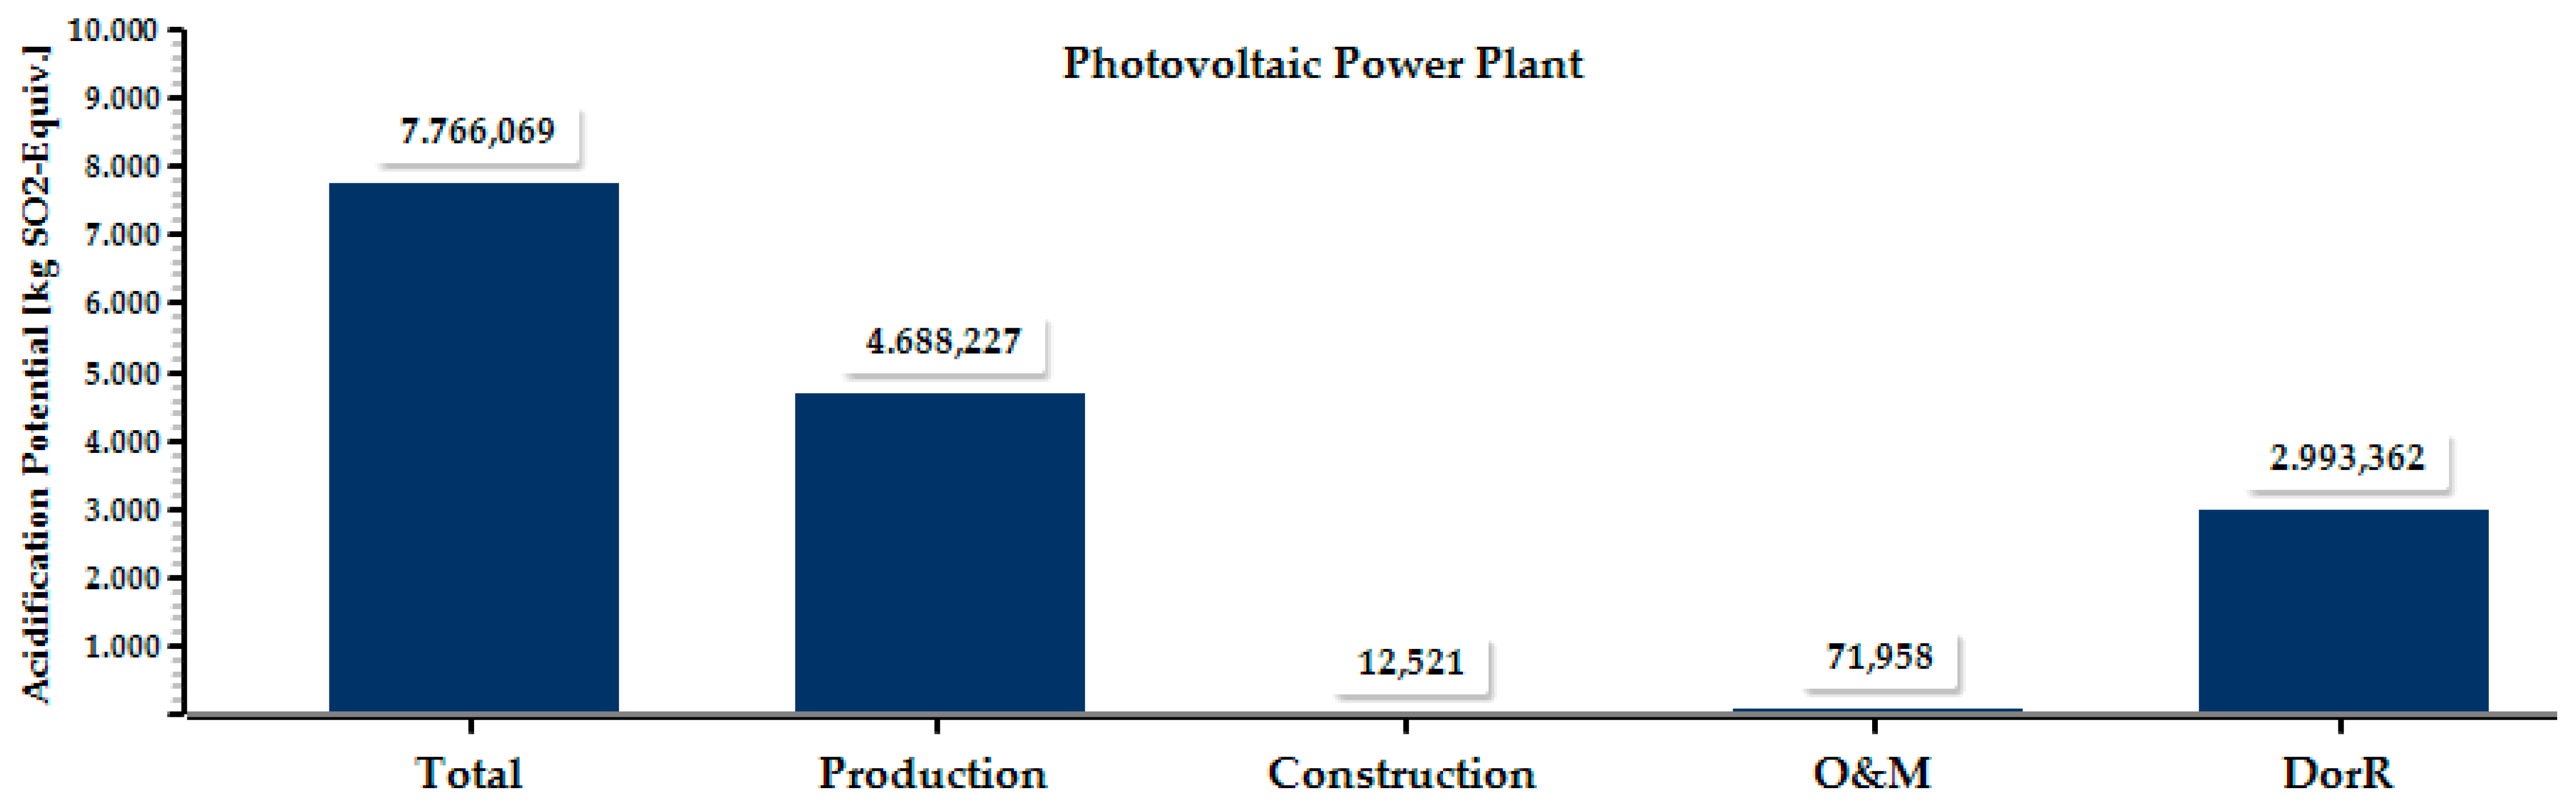
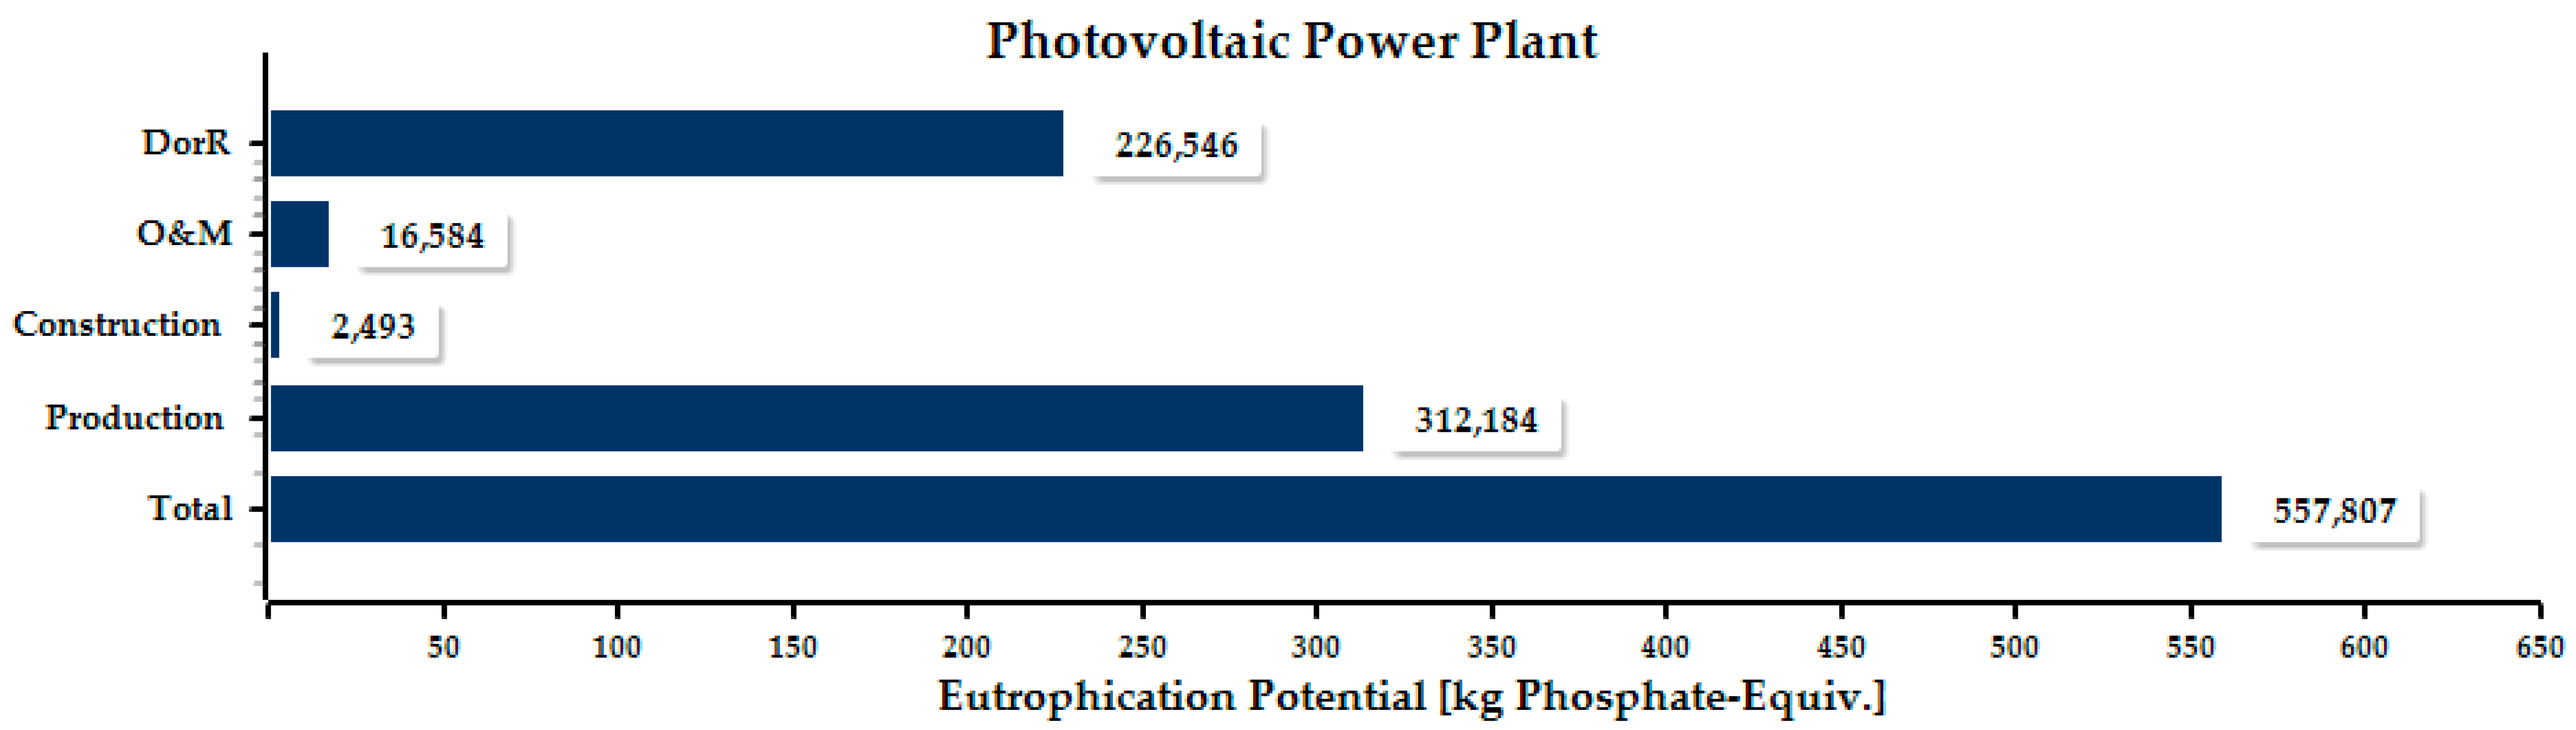
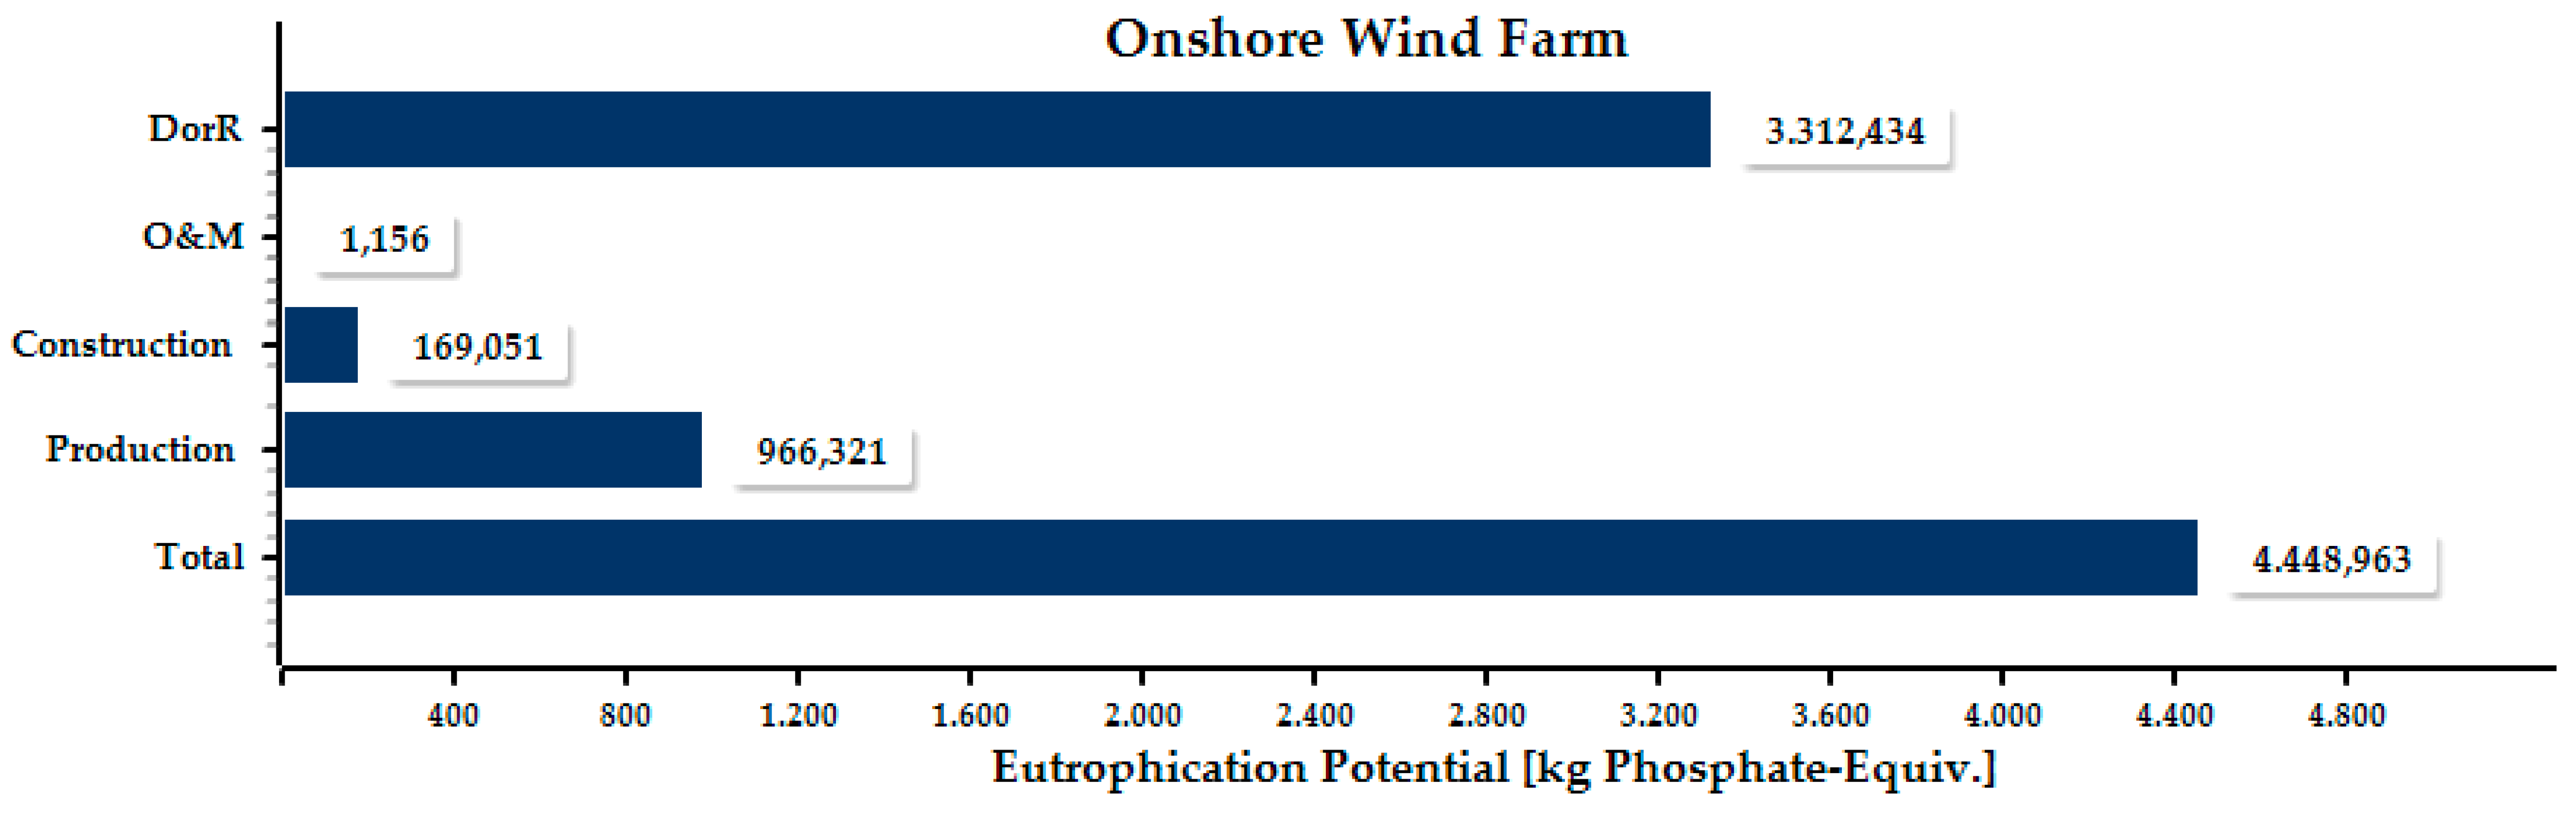
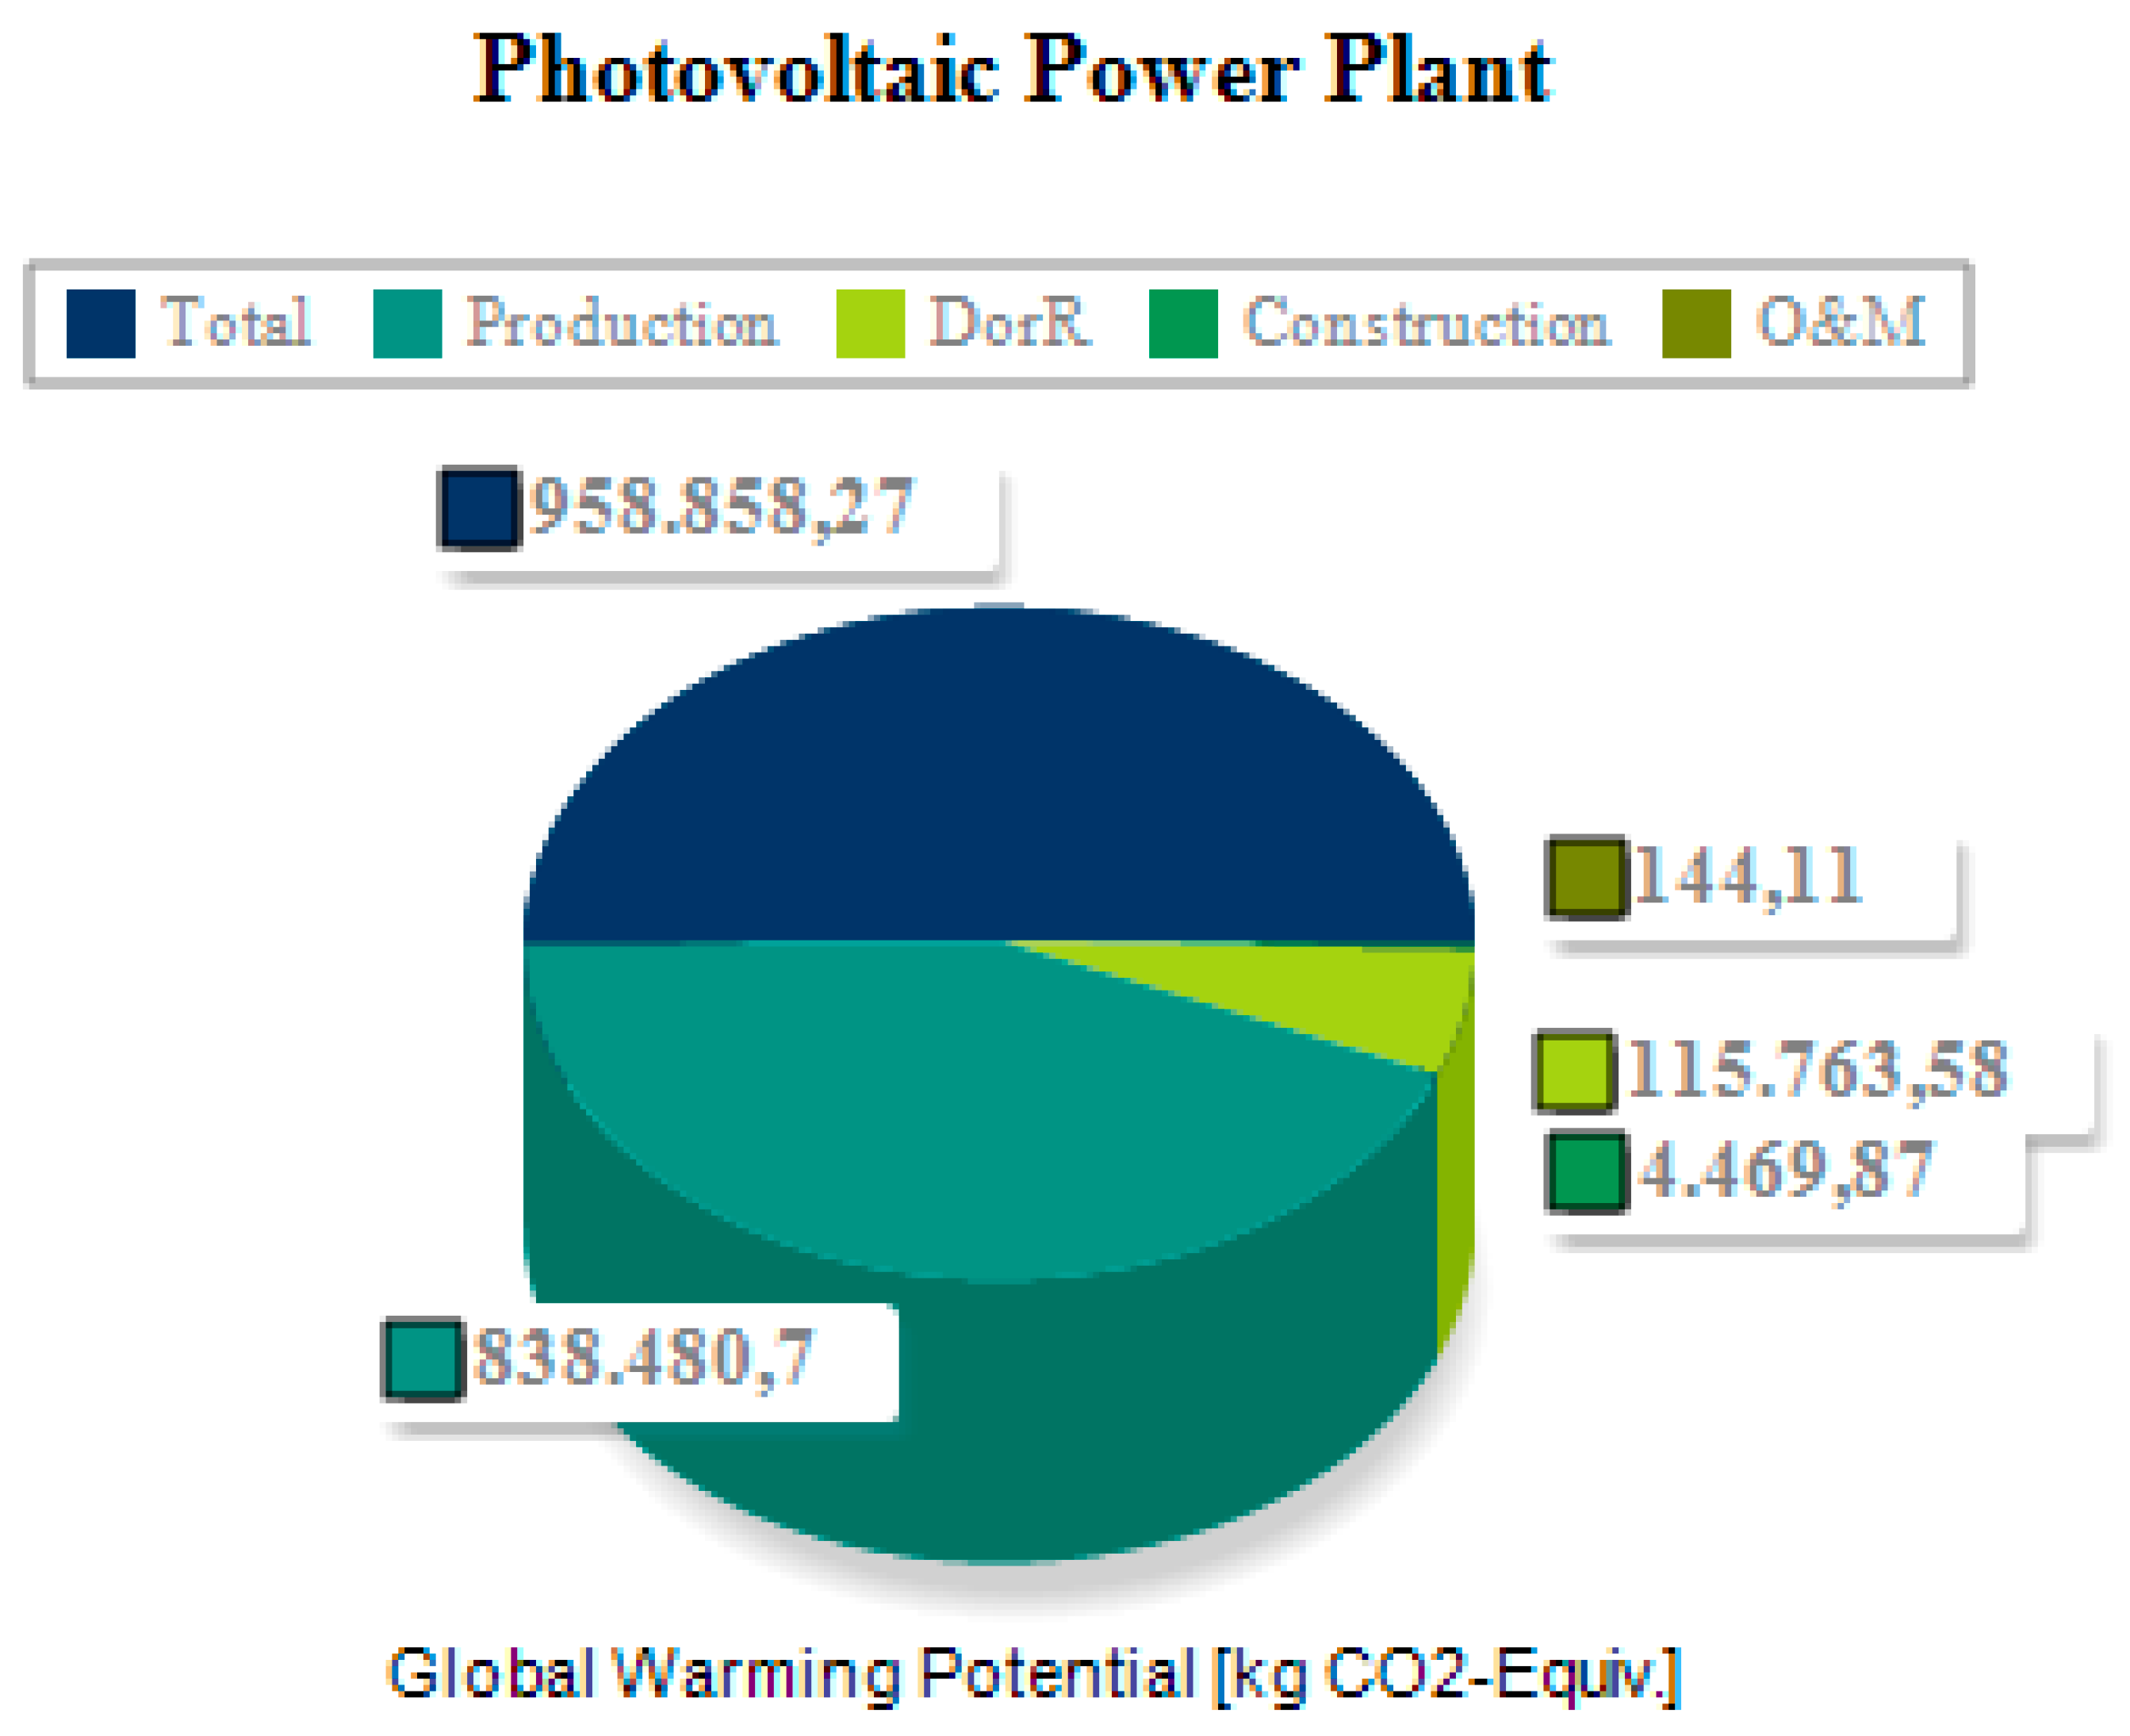
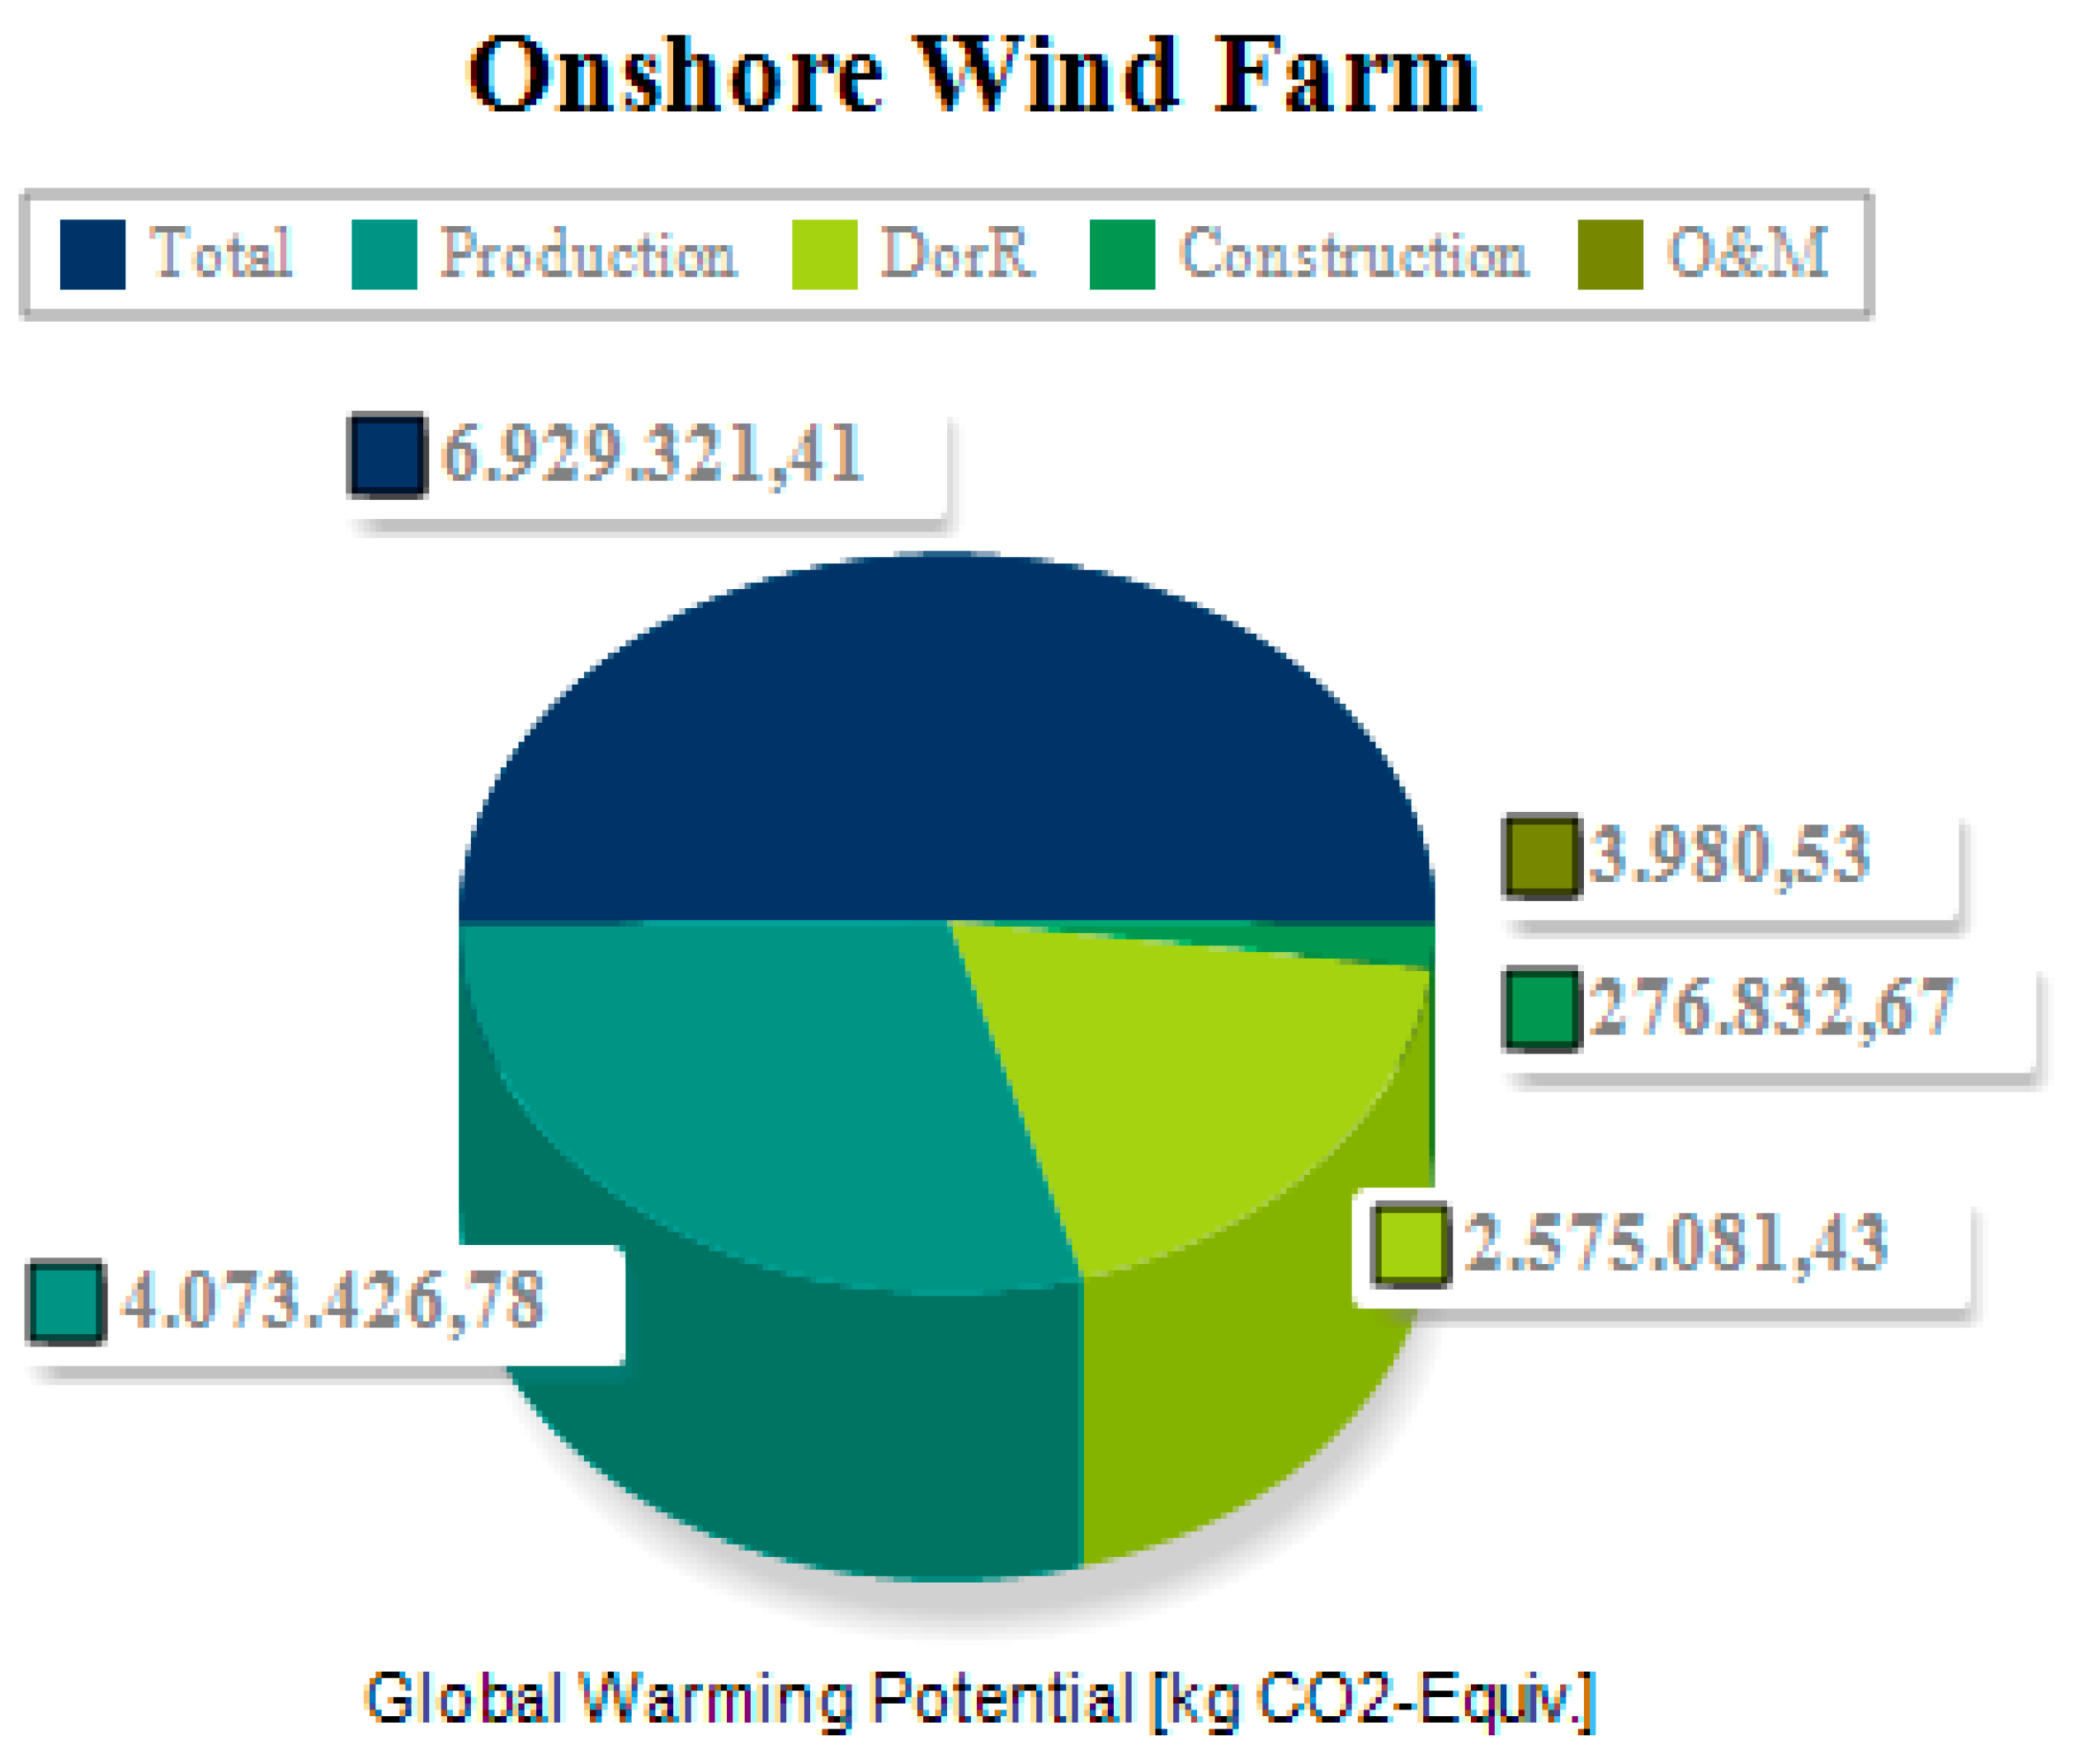
5.1. Life Cycle Impact Assessment (LCIA)
5.2. Life Cycle Cost Analysis (LCCA)
5.3. Sensitivity Analysis
5.3.1. Sensitivity Analysis for the PV System
5.3.2. Sensitivity Analysis for Wind Farm
6. Discussion
7. Conclusions
Author Contributions
Funding
Acknowledgments
Conflicts of Interest
Nomenclature
| IMO | International Maritime Organisation |
| MARPOL | Maritime Pollution |
| LCA | Life cycle assessment |
| LCC | Life cycle cost |
| LCCA | Life cycle cost analysis |
| LCI | Life cycle inventory |
| LCIA | Life cycle impact analysis |
| EPBT | Energy-payback time |
| GHGs | Greenhouse emissions |
| GWP | Global warming potential |
| AP | Acidification potential |
| EP | Eutrophication potential |
| RES | Renewable energy sources |
| CO2 | Carbon dioxide |
| CO2 eq | Carbon dioxide equivalent |
| PV | Photovoltaic |
| O&M | Operation and maintenance |
| DorR | Disposal or recycling |
| Cinv | Investment cost |
| CO&M | Operation and maintenance costs |
| CDorR | Disposal or recycling costs |
| PVGIS | Solar radiation database |
| LCCPV | Life cycle cost of photovoltaic power plant |
| LCCONW | Life cycle cost of wind farm |
| Cpanels | Cost of solar panels |
| Cost of electrical apparatus for PV plant | |
| Cost of infrastructure of PV plant | |
| Cost of operation and maintenance procedure of PV system | |
| Total transportation cost of PV plant throughout lifespan | |
| Transportation costs of PV plant during initial investment phase | |
| Transportation costs of PV plant for operation and maintenance phase | |
| Transportation costs of PV plant during disposal or recycling phase | |
| Ctap water | Cost of tap water |
| Cspare panels | Cost of spare solar panels |
| Cost of disposal or recycling of photovoltaic power plant | |
| BP | British Petrol |
| Cturbines | Cost of turbines |
| Cost of electrical apparatus for wind farm | |
| Cost of infrastructure of wind farm | |
| Cost of operation and maintenance procedure of wind farm | |
| Total transportation cost of wind farm throughout lifespan | |
| Transportation costs of wind farm during initial investment phase | |
| Transportation costs of wind farm for operation and maintenance phase | |
| Transportation costs of wind farm during disposal or recycling phase | |
| Cost of maintenance procedure of wind farm in terms of material costs | |
| Cost of disposal or recycling of wind farm | |
| OECD | Organization for Economic Co-operation and Development |
| IIC | Initial investment cost |
| LUCE | Levelized unit cost to produce 1 MWh electricity |
| LUCEONW | Levelized unit cost to produce 1 MWh electricity for wind farm |
| LUCEPV | Levelized unit cost to produce 1 MWh electricity for photovoltaic power plant |
References
- Schanes, K.; Giljum, S.; Hertwich, E. Low carbon lifestyles: A framework to structure consumption strategies and options to reduce carbon footprints. J. Clean. Prod. 2016, 139, 1033–1043. [Google Scholar] [CrossRef]
- Kavli, H.P.; Oguz, E.; Tezdogan, T. A comparative study on the design of an environmentally friendly RoPax ferry using CFD. Ocean. Eng. 2017, 137, 22–37. [Google Scholar] [CrossRef]
- European Union. Energy Road Map 2050; Publications Office of the European Union: Brussels, Belgium, 2012. [Google Scholar]
- Jeong, B.; Oğuz, E.; Wang, H.; Zhou, P. Multi-criteria decision-making for marine propulsion: Hybrid, diesel electric and diesel mechanical systems from cost-environment-risk perspectives. Appl. Energy 2018, 230, 1065–1081. [Google Scholar] [CrossRef]
- Aysar, M.; Lorenzo, S.; Ponci, F.; Monti, A. Multi-agent based intelligent frequency control in multi-terminal dc grid-based hybrid ac/dc networks. IET Renew. Power Gener. 2018, 12, 1434–1443. [Google Scholar]
- Adrees, A.; Milanovic, J.V.; Mancarella, P. The Influence of Location of Distributed Energy Storage Systems on Primary Frequency Response of Low Inertia Power Systems. In Proceedings of the IEEE Power & Energy Society General Meeting (PESGM), Portland, OR, USA, 5–10 August 2018. [Google Scholar]
- Wang, H.; Oguz, E.; Jeong, B.; Zhou, P. Life cycle cost and environmental impact analysis of ship hull maintenance strategies for a short route hybrid ferry. Ocean. Eng. 2018, 161, 20–28. [Google Scholar] [CrossRef]
- Marzi, J.; Papanikolaou, A.; Corrignan, P.; Zaraphonitisc, G.; Harries, S. HOLISTIC Ship Design for Future Waterborne Transport. In Proceedings of the 7th Transport Research Arena TRA 2018, Austria, Vienna, 16–19 April 2018. [Google Scholar]
- Jeong, B.; Wang, H.; Oguz, E.; Zhou, P. An effective framework for life cycle and cost assesment for marine vessels aiming to select optimal propulsion systems. J. Clean. Prod. 2018, 187, 111–130. [Google Scholar] [CrossRef]
- Wang, H.; Oguz, E.; Jeong, B.; Zhou, P. Life cycle and economic assesment pf solar panel array applied to a short route ferry. J. Clean. Prod. 2019, 219, 471–484. [Google Scholar] [CrossRef]
- Hernández, C.V.; González, J.S.; Blanco, R.F. New method to assess the long-term role of wind energy generation in reduction of CO2 emissions- Case Study of european Union. J. Clean. Prod. 2019, 207, 1099–1111. [Google Scholar] [CrossRef]
- Özkale, C.; Celik, C.; Turkmen, A.C.; Cakmaz, E.S. Decision analysis application intended for selection of a power plant running on renewable energy sources. Renew. Sustain. Energy Rev. 2017, 70, 1011–1021. [Google Scholar] [CrossRef]
- Santoyo-Castelazo, E.; Azapagic, A. Sustainability assessment of energy systems: Integrating environmental, economic and social aspects. J. Clean. Prod. 2014, 80, 119–138. [Google Scholar] [CrossRef]
- Hong, J.H.; Kim, J.; Son, W.; Shin, H.; Kim, N.; Lee, W.K.; Kim, J. Long-term energy strategy scenarios for South Korea: Transition to a sustainable energy system. Energy Policy 2019, 127, 425–437. [Google Scholar] [CrossRef]
- Keleş, S.; Bilgen, S. Renewable energy sources in Turkey for climate change mitigation and energy sustainability. Renew. Sustain. Energy Rev. 2012, 16, 5199–5206. [Google Scholar] [CrossRef]
- Panwar, N.; Kaushik, S.; Kothari, S. Role of renewable energy sources in environmental protection: A review. Renew. Sustain. Energy Rev. 2011, 15, 1513–1524. [Google Scholar] [CrossRef]
- Li, Q.S.; Chen, F.; Li, Y.; Lee, Y. Implementing wind turbines in a tall building for power generation: A study of wind loads and wind speed amplifications. J. Wind Eng. Ind. Aerodyn. 2013, 116, 70–82. [Google Scholar] [CrossRef]
- Vourdoubas, J. Review of sustainable energy technologies used in buildings in the Mediterranean basin. J. Build. Sustain. 2018, 1, 2. [Google Scholar]
- Yuan, X.; Wang, X.; Zuo, J. Renewable energy in buildings in China—A review. Renew. Sustain. Energy Rev. 2013, 24, 1–8. [Google Scholar] [CrossRef]
- IPEEC Building Energy Efficiency Taskgroup. Zero Energy Building Definitions and Policy Activity-An International Review; International Partnership for Energy Efficiency Cooperation: Paris, France, 2018. [Google Scholar]
- Eremia, M.; Toma, L.; Sanduleac, M. The Smart City Concept in the 21st century. Procedia Eng. 2017, 181, 12–19. [Google Scholar] [CrossRef]
- Nistor, S.; Carr, S.; Sooriyabandara, M. The Island Hydrogen Project: Electrolytic Generated Hydrogen for Automotive and Maritime Applications. IEEE Electrif. Mag. 2018, 6, 55–60. [Google Scholar] [CrossRef]
- Yazici, M.S.; Hatipoğlu, M. Hydrogen and fuel cell demonstrations in Turkey. Energy Procedia 2012, 29, 683–689. [Google Scholar] [CrossRef]
- Oğulata, R.T. Energy sector and wind energy potential in Turkey. Renew. Sustain. Energy Rev. 2003, 7, 469–484. [Google Scholar] [CrossRef]
- Jackson, D.; Brander, M. The risk of burden shifting from embodied carbon calculation tools for the infrastructure sector. J. Clean. Prod. 2019, 223, 739–746. [Google Scholar] [CrossRef]
- Akanbi, L.A.; Oyedele, L.O.; Omoteso, K.; Bilal, M.; Akinade, O.O.; Ajayi, A.O.; Delgado, J.M.D.; Owolabi, H.A. Disassembly and deconstruction analytics system (D-DAS) for construction in a circular economy. J. Clean. Prod. 2019, 223, 386–396. [Google Scholar] [CrossRef]
- Wiedemann, S.; McGahan, E.; Murphy, C.; Yan, M.-J.; Henry, B.; Thoma, G.; Ledgard, S. Enviromental impacts and resource use of Australian beef and lamb exported to the USA determined using life cycle assessment. J. Clean. Prod. 2015, 94, 67–75. [Google Scholar] [CrossRef]
- Atilgan, B.; Azapagic, A. Life cycle enviromental impacts of electricity from fossil fuels in Turkey. J. Clean. Prod. 2014, 106, 555–564. [Google Scholar] [CrossRef]
- Atilgan, B.; Azapagic, A. Renewable electricity in Turkey: Life cycle enviromental impacts. Renew. Energy 2016, 89, 649–657. [Google Scholar] [CrossRef]
- Rakotoson, V.; Praene, J.P. A life cycle assessment approach to the electricity generation of French overseas territories. J. Clean. Prod. 2017, 168, 755–763. [Google Scholar] [CrossRef]
- Utne, I.B. Life cycle cost (LCC) as a tool for improving sustainability in Norvewgian fishing fleet. J. Clean. Prod. 2009, 17, 335–344. [Google Scholar] [CrossRef]
- Delugo, M.; Zanchi, L.; Maltese, S.; Bonoli, A.; Pierini, M. Enviromental and economic life cycle assessment of a lightweight solution for an automotive component: A comparison between talc-filled and hollow glass microspheres-reinforced polymer composites. J. Clean. Prod. 2016, 139, 548–560. [Google Scholar] [CrossRef]
- Cheung, W.M.; Marsh, R.; Griffin, P.W.; Griffin, P.W.; Newnes, L.B.; Mileham, A.R.; Lanham, J.D. Towards cleaner production: A roadmap for predicting product end-of-life costs at early design concept. J. Clean. Prod. 2015, 87, 431–441. [Google Scholar] [CrossRef]
- Yılan, G. Comparison of Life Cycle Assessment of Electricty Production Mix in Turkey with Future Electricty Production Scenarios; Marmara University Institute for Graduate Studies in Pure and Applied Sciences: Istanbul, Turkey, 2018. [Google Scholar]
- Ormazabal, M.; Jaca, C.; Puga-Leal, R. Analysis and Comparison of Life Cycle Assessment and Carbon Footprint Software. Adv. Intell. Syst. Comput. 2014, 281, 1521–1530. [Google Scholar]
- Speck, R.; Selke, S.; Auras, R.; Fitzsimmons, J. Choice of Life Cycle Assessment Software Can Impact Packaging System Decisions. Packag. Technol. Sci. 2015, 28, 579–588. [Google Scholar] [CrossRef]
- Speck, R.; Selke, S.; Auras, R.; Fitzsimmons, J. Life Cycle Assessment Software: Selection Can Impact Results. J. Ind. Ecol. 2016, 20, 18–28. [Google Scholar] [CrossRef]
- Herrmann, I.T.; Moltesen, A. Does it matter which Life Cycle Assessment (LCA) tool you choose? A comparative assessment of SimaPro and GaBi. J. Clean. Prod. 2015, 86, 163–169. [Google Scholar] [CrossRef]
- Silva, D.; Nunes, A.O.; da Silva Moris, A.; Moro, C.; Piekarski, T.O.R. How Important Is the LCA Software Tool You Choose Comparative Results from GaBi; openLCA, SimaPro and Umberto: Medellin, DC, USA, 2017. [Google Scholar]
- Fu, Y.; Liu, X.; Yuan, Z. Life-cycle assessment of multi-crystalline photovoltaic (PV) systems in China. J. Clean. Prod. 2015, 86, 180–190. [Google Scholar] [CrossRef]
- Nugent, D.; Sovacool, B.K. Assessing the lifecycle greenhouse gas emissions from solar PV and wind energy: A critical meta-survey. Energy Policy 2014, 65, 229–244. [Google Scholar] [CrossRef]
- Bonou, A.; Laurent, A.; Olsen, S.I. Life cycle assessment of onshore and offshore wind energy—From theory to application. Appl. Energy 2016, 180, 327–337. [Google Scholar] [CrossRef]
- Chipindula, J.; Botlaguduru, V.S.V.; Du, H.; Kommalapati, R.R.; Huque, Z. Life Cycle Environmental Impact of Onshore and Offshore Wind Farms in Texas. Sustainability 2018, 10, 2022. [Google Scholar] [CrossRef]
- Haapala, K.R.; Prempreeda, P. Comparative life cycle assessment of 2.0 MW wind turbines. Int. J. Sustain. Manuf. 2014, 3, 170–185. [Google Scholar] [CrossRef]
- Schmidt, K.; Alvarez, L.; Arevalo, J.; Abbassi, B. Life Cycle Impact Assessment of Renewable Energy Systems: Wind vs. Photovoltaic Systems. Int. J. Curr. Res. 2017, 9, 59140–59147. [Google Scholar]
- Yudha, H.M.; Dewi, T.; Risma, P.; Oktarina, Y. Life Cycle Analysis for the Feasibility of Photovoltaic System Application in Indonesia. IOP Conf. Ser. Earth Environ. Sci. 2018, 124, 012005. [Google Scholar] [CrossRef]
- Desideri, U.; Proietti, S.; Zepparelli, F.; Sdringola, P.; Bini, S. Life Cycle Assessment of a ground-mounted 1778 kWp photovoltaic plant and comparison with traditional energy production systems. Appl. Energy 2012, 97, 930–943. [Google Scholar] [CrossRef]
- Ito, M.; Kato, K.; Sugihara, H.; Kichimi, T.; Song, J.; Kurokawa, K. A Preliminary Study on Potential for Very Large-Scale Photovoltaic Power Generation (VLS-PV) System on the Gobi Desert from Economic and Environmental Viewpoints. Sol. Energy Mater. Sol. Cells 2003, 75, 507–517. [Google Scholar] [CrossRef]
- Luo, W.; Khoo, Y.S.; Kumar, A.; Low, J.S.C.; Li, Y.; Tan, Y.S.; Wang, Y.; Aberle, A.G.; Ramakrishna, S. A comparative life-cycle assessment of photovoltaic electricity generation in Singapore by multicrystalline silicon technologies. Sol. Energy Mater. Sol. Cells 2018, 174, 157–162. [Google Scholar] [CrossRef]
- Palanov, N. Life-Cycle Assessment of Photovaltaic Systems; Lund University: Lund, Sweden, 2014. [Google Scholar]
- Yu, M.; Halog, A. Solar Photovoltaic Development in Australia—A Life Cycle Sustainability Assessment Study. Sustainability 2015, 7, 1213–1247. [Google Scholar] [CrossRef]
- Wu, P.; Ma, X.; Ji, J.; Ma, Y. Review on life cycle assessment of energy payback of solar photovoltaic systems and a case study. Energy Procedia 2017, 105, 68–74. [Google Scholar] [CrossRef]
- Ito, M.; Kato, K.; Komoto, K.; Kichimi, T.; Kurokawa, K. A comparative study on cost and life-cycle analysis for 100 MW very large-scale PV (VLS-PV) systems in deserts using m-Si, a-Si, CdTe, and CIS modules. Prog. Photovolt. Res. Appl. 2008, 16, 17–30. [Google Scholar] [CrossRef]
- Zhong, Z.-W.; Song, B.; Loh, P.E. LCAs of a polycrystalline photovoltaic module and a wind turbine. Renew. Energy 2011, 36, 2227–2237. [Google Scholar] [CrossRef]
- Mason, J.; Fthenakis, V.M.; Hansen, T.; Kim, H.C. Energy Pay-Back and Life Cycle CO2 Emissions of the BOS in an Optimized 3.5 MW PV Installation. Prog. Photovolt. Res. Appl. 2006, 14, 179–190. [Google Scholar] [CrossRef]
- Institute of Environmental Sciences. CML, 2016 CML-IA Characterisation Factors; Leiden University: Leiden, The Netherlands, 2016. [Google Scholar]
- ISO. ISO 14040:2006—Environmental Management–Life Cycle Assessment–Principles and Framework; International Organization for Standardization: Geneva, Switzerland, 2006. [Google Scholar]
- ISO. ISO 14044:2006—Environmental Management–Life Cycle Assessment–Requirements and Guidelines; International Organization for Standardization: Geneva, Switzerland, 2006. [Google Scholar]
- Frischknecht, R.; Heath, G.; Raugei, M.; Sinha, P.; de Wild-Scholten, M. Methodology Guidelines on Life Cycle Assessment of Photovoltaic Electricity, 3rd ed.; Brookhaven National Laboratory: New York, NY, USA, 2016. [Google Scholar]
- Lee, D. Fundamentals of Life-Cycle Cost Analysis. Transp. Res. Rec. J. Transp. Res. Board 2002, 1812, 203–210. [Google Scholar] [CrossRef]
- Denholm, P.; Margolis, R. Land-Use Requirements and the Per-Capita Solar Footprint for Photovoltaic Generation in the United States. Energy Policy 2008, 36, 3531–3543. [Google Scholar] [CrossRef]
- Ministry of Development, Regional Development Administration for Konya Plain Project. KOP Bölgesinde Arazi ve Enerji Üretimi Planlaması; Regional Development Administration for Konya Plain Project: Konya, Turkey, 2012. [Google Scholar]
- Bores Bozcaada Santrali. Available online: http://www.demirer.com.tr/santral/bores/index.html (accessed on 13 July 2019).
- Jordan, D.C.; Kurtz, S.R. Photovoltaic Degradation Rates—An Analytical Review; NREL: Golden, CO, USA, 2012; Volume 5200, p. 18. [Google Scholar]
- Ito, M. Life Cycle Assessment of PV systems. In Crystalline Silicon-Properties and Uses; Basu, S., Ed.; IntechOpen: London, UK, 2011. [Google Scholar]
- Karadogan, O.; Kilicarslan, T.; ve Celiktas, M.S. The Actual Performance Value of Photovoltaic Solar System In Turkey and Compare with Software Result; SOLARTR: İzmir, Turkey, 2014. [Google Scholar]
- Erik, A.; Fraile, D.; Frischknecht, R.; Fthenakis, V.; Held, M.; Kim, H.C.; Pölz, W.; Raugei, M.; de Wild Scholten, M. Methodology Guidelines on Life Cycle Assessment of Photovoltaic Electricity; International Energy Agency, Photovoltaic Power Systems Programme, Rolf Frischknecht, ESU-services Ltd.: Uster, Switzerland, 2009. [Google Scholar]
- Jungbluth, N.; Stucki, M.; Frischknecht, R.; Büsser, S. Photovoltaics; ESU-services Ltd. & Swiss Centre for Life Cycle Inventories: Uster, Switzerland, 2010. [Google Scholar]
- Appleyard, D. Light Cycle: Recycling PV Materials. Renew. Energy World Mag. 2009, 109, 28–35. [Google Scholar]
- Abu-Rumman, A.K.; Muslih, I.; Barghash, M.A. Life Cycle Costing of PV Generation System. J. Appl. Res. Ind. Eng. 2017, 4, 252–258. [Google Scholar]
- Batman, A.; Bagriyanik, F.G.; Aygen, Z.E.; Gul, O.; Bagriyanik, M. A feasibility study of grid-connected photovoltaic systems in Istanbul, Turkey. Renew. Sustain. Energy Rev. 2012, 16, 5678–5686. [Google Scholar] [CrossRef]
- Inflation Calculator. Available online: http://www3.tcmb.gov.tr/inflationcalc2/inflationcalc.php (accessed on 13 July 2019).
- BP Türkiye-Ürünler ve Servisler-Akaryakıt-Akaryakıt Pompa Satış Fiyatları. Available online: http://www.bppompafiyatlari.com/ (accessed on 13 July 2019).
- Kerosen-Kerosen Manufacturers, Suppliers and Exporters on Alibaba.comJetFuel. Available online: https://www.alibaba.com/trade/search?fsb=y&IndexArea=product_en&CatId=&SearchText=kerosen (accessed on 13 July 2019).
- Turkish Wind Energy Association. Turkish Wind Energy Statistic Report; Turkish Wind Energy Association: Ankara, Turkey, 2018. [Google Scholar]
- Lee, Y.; Tzeng, Y.; Su, C. Life Cycle Assessment of Wind Power Utilization in Taiwan. In Proceedings of the 7th International Conference on Eco Balance, Tsukuba, Japan, 14–16 November 2006. [Google Scholar]
- Razdan, P.; Garrett, P. Life Cycle Assessment of Electricity Production from an onshore V110-2.0 MW Wind Plant; Vestas Wind Systems A/S, Hedeager 42, Aarhus N, 8200, Denmark, 2015. Available online: https://www.vestas.com/~/media/vestas/about/sustainability/pdfs/lcav11020mw181215.pdf (accessed on 13 July 2019).
- Enercon E-40/6.44-600,00 kW-Wind Turbine. Available online: https://en.wind-turbine-models.com/turbines/68-enercon-e-40-6.44 (accessed on 13 July 2019).
- Ghenai, C. Life Cycle Analysis of Wind Turbine. In Sustainable Development—Energy, Engineering and Technologies—Manufacturing and Environment; Ghenai, C., Ed.; InTech: Melbourne, FL, USA, 2012; p. 27. [Google Scholar]
- Chan, D.; Mo, J. Life cycle reliability and maintenance analyses of wind turbines. Energy Procedia 2017, 110, 328–333. [Google Scholar] [CrossRef]
- Andersen, P.D.; Bonou, A.; Beauson, J.; Brøndsted, P. Recycling of Wind Turbines; Technical University of Denmark (DTU): Lyngby, Denmark, 2014. [Google Scholar]
- Abu-Rumman, A.K.; Muslih, I.; Barghash, M.A. Life Cycle Costing of Wind Genaration System. J. Appl. Res. Ind. Eng. 2017, 4, 185–191. [Google Scholar]
- Erdem, O. Bozcaada’da CFD Programı Kullanarak Bir Rüzgar Enerji Santralinin Potansiyelinin Belirlenmesi. Tesisat Mühendisliği 2015, 147, 20–26. [Google Scholar]
- Erdem, O.; Batur, B.; Bilge, Z.D.; Temir, G. Bozcaada’da Kurulacak Olan Bir Rüzgar Enerjisi Santralinin Ekonomik Analizi. Tesisat Mühendisliği 2015, 148, 22–27. [Google Scholar]
- Ozerdem, B.; Ozer, S.; Tosun, M. Feasibility study of wind farms: A case study for Izmir, Turkey. J. Wind Eng. Ind. Aerodyn. 2006, 94, 725–743. [Google Scholar] [CrossRef]
- OECD. Producer Price Indices (PPI). 2019. Available online: https://data.oecd.org/price/producer-price-indices-ppi.htm#indicator-chart (accessed on 2 May 2019).
- Henderson, G. Potential for Reducing Cost of Energy by Scaling Up a Low-Mass wind turbine design. In Proceedings of the 16th International Workshop on Large-Scale Integration of Wind Power, Berlin, Germany, 25–27 October 2017. [Google Scholar]
- Fathiyah, R.; Mellott, R.; Panagoda, M.; Lane, M. Windmill Design Optimization through Component Costing; IEEE Seminar: London, UK, 2000. [Google Scholar]
- Merta, G.; Linkeb, B.; Auricha, J. Analysing the Cumulative Energy Demand of Product-Service Systems for wind turbines. Procedia CIRP 2017, 59, 214–219. [Google Scholar] [CrossRef]
- Gkantou, M.; ve Baniotopoulos, C.C. Life Cycle Analysis of Onshore Wind Turbine Towers. In Proceedings of the 2nd International TU1304 WINERCOST, Catanzaro, Italy, 21–23 March 2018. [Google Scholar]
- Kim, T.H.; Chae, C.U. Environmental Impact Analysis of Acidification and Eutrophication Due to Emissions from the Production of Concrete. Sustainability 2016, 8, 1. [Google Scholar] [CrossRef]


| Phases | Installation | Solar Cells | PV System | GHGs [kg/MWh] | EPBT [years] | ||||||
|---|---|---|---|---|---|---|---|---|---|---|---|
| Onset | Final | Roof | Ground | Module Efficiency | Cell Type | On-Grid | Off-Grid | Location | References | ||
| Material choices | Recycling | √ | √ | - | All | √ | √ | - | - | Indonesia | [46] |
| Extraction of raw materials | Recycling | - | √ | 14.4% | mc-Si | √ | - | 106 | 4.17 | Perugia, Italy | [47] |
| Production | O&M | - | √ | 12.8% | multi-Si | - | - | 12.0 | 1.9 | Gobi Desert | [48] |
| Production | O&M | √ | - | - | multi-si | - | - | 20.9–30.2 | 1.01–1.08 | Singapore | [49] |
| Production | Recycling (BOS) | √ | - | 14.2% | mono-si | - | √ | 0.053 | 2.5 | Copenhagen, Denmark | [50] |
| Production | O&M | √ | - | 14.7% | multi-si | √ | - | - | 2.33 | Australia | [51] |
| Production | Recycling or disposal | - | √ | - | multi-Si | √ | - | - | 2.3 | China | [52] |
| Production | O&M | - | √ | 12.8% | multi-si | √ | - | 13.9–14.9 | 2.2–2.3 | Gobi Desert | [53] |
| Production | Disposal | - | √ | - | multi-si | √ | - | with ReCiPe method | Toronto | [45] | |
| - | Disposal or recycling | - | - | - | multi-si | - | √ | - | - | - | [54] |
| Production | Disposal | - | √ | 12.2% | BOS (multi-si) | √ | - | 29/m2 | 0.21–0.37 | Springerville, USA | [55] |
| PV system Assumptions and Specifications | Comments | |
| Nominal power of photovoltaic plant | 1.2 MW | Extrapolation with land–use for 1 MW |
| Area of plant for infrastructure | 20,560 m2 | Established wind farm area |
| Plant area | 16,400 m2 | Land requirement for 1MW |
| Performance ratio | 0.80 | PVGIS database and Reference [67] |
| Degradation ratio | 0.6% | [64] |
| Lifetime of the plant | 30 years | [65] |
| Lifetime of the inverters | 15 years | [65] |
| Lifecycle inventory assumptions | ||
| Production up to wafer | In Taiwan | Including processes excluding transportation |
| Electricity mix | Chinese | No Taiwanese grid mix in GaBi |
| Transportation of wafers | By ocean-going ship | 8689 nautical miles as shortest route |
| Production of solar cell | In Turkey | Assembly with metallization pastes and wafers |
| Production of other parts | In Turkey | Ground mounting structures (aluminum frames) |
| Electricity mix | Bulgarian mix | No Turkish grid mix and production in Tekirdag |
| Transportation to site | By truck and ferry | By ferry to island |
| Initialization | Greek mix | No Turkish grid mix (for installation) |
| Operation and Maintenance | By truck | Carrying waterand replacements of broken panels and inverters |
| List of Materials for Solar Cells | |
| Nominal power of the solar module | 265 Wp |
| Number of solar module | 4615 + 15 |
| Number of solar cell in a module | 60 |
| Number of solar cell | 277,800 |
| Area of one solar cell | 243 cm2 |
| Area of photovoltaic modules | 6855 m2 |
| List of materials used for the support structure (open ground mounting structure) | |
| Steel, zinc coated | 3909 kg |
| Aluminum | 3111 kg |
| Materials | Weight (kg) | By Truck (km) | By Ferry (km) | Transportation Costs | Cost Categories |
|---|---|---|---|---|---|
| Solar panels | 77,840 | 291 | 10 | $171.56 | IIC |
| Open ground mounting structure | 8990 | 390 | 8 | $135.50 | IIC |
| Inverters | 9849 | 451 | 8 | $878.01 | IIC |
| Spare inverters | 9849 | 451 + 80 | 8 | $1032.60 | O&M |
| Spare solar panels | 252 | 291 + 80 | 10 | $218.72 | O&M |
| Tap water | 46,593 | 80 | - | $372.20 | O&M |
| Solar panels for recycling | 77,776 | Without ferry and truck (with cargo plane) | $8525.77 | DorR | |
| Aluminum scrap | 3111 | 300 | 8 | $71.70 | DorR |
| Copper scrap | 1100 | 300 | 8 | $33.04 | DorR |
| Steel scrap | 8636 | 300 | 8 | $111.44 | DorR |
| Wind Farm Assumptions and Specifications | Comments | |
|---|---|---|
| Nominal power of photovoltaic plant | 10.2 MW | Established wind farm capacity |
| Area of plant for infrastructure | 20,560 m2 | Established wind farm area |
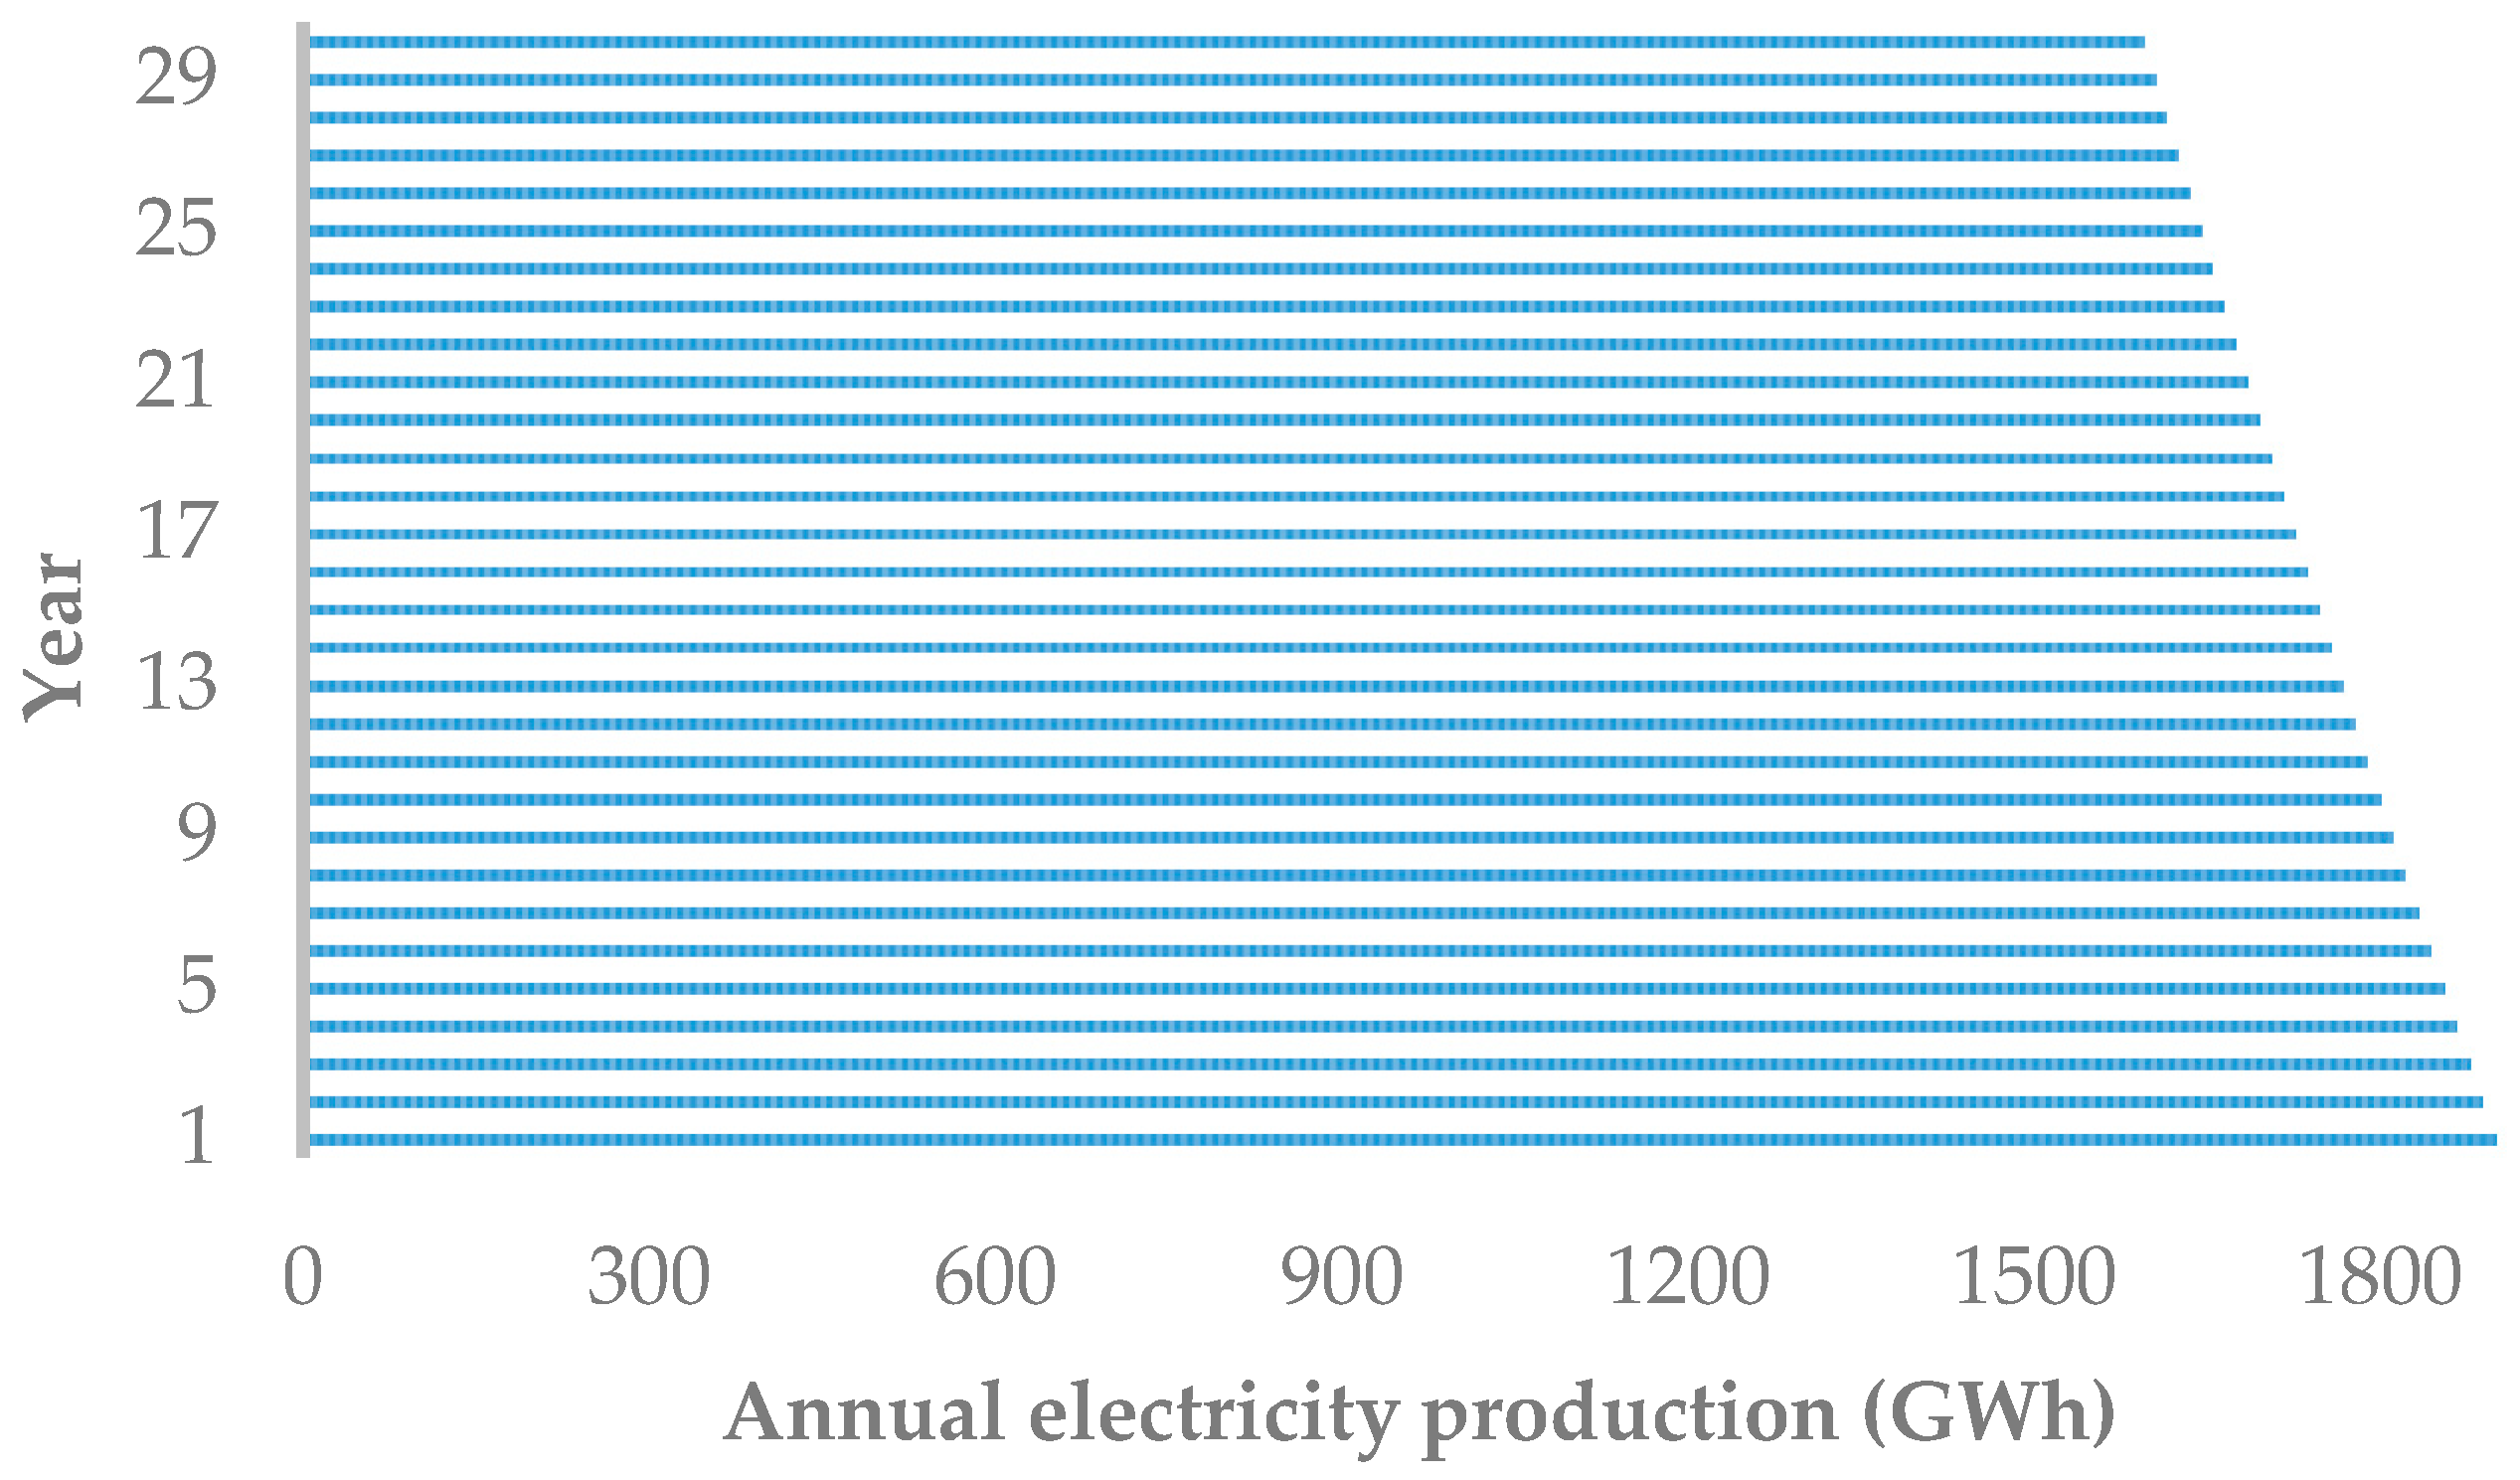
| Average produced electricity per year | 34 GWh | From the discussion with operating company |
| Lifetime of the plant | 20 years | [43] |
| Lifecycle inventory assumptions | ||
| Production up to wind turbine | In Germany | Including processes excluding transportation |
| Electricity mix | Deutch | Production in Germany |
| Transportation of wind turbines | By truck | 2640 km |
| Production of other parts | In Turkey | Concrete, cables, and inverters |
| Electricity mix | Bulgarian mix | No Turkish grid mix and production in Turkey |
| Transportation of other parts | By truck | 305 and441 km for concrete and cables and inverters |
| Transportation to site | By truck and ferry | By ferry to the island |
| Initialization | Greek mix | No Turkish grid mix (for installation) |
| Operation and Maintenance | By truck | 3400 kg lubricant [77] |
| Onshore Wind Farm on Bozcaada Island | |
|---|---|
| Location of the wind farm | West side of the island |
| Number of turbines | 17 |
| Nominal power of turbine | 600 kW |
| Underground wiring between turbines | 9 km |
| Rotor diameter * | 43.7 m |
| Tower height | 44 m |
| Enercon E-40 Wind Turbine | |
|---|---|
| Power capacity | 0.60 MW |
| Rotor diameter | 43.70 m |
| Tower height | 44.00 m |
| Rotor weight | 8.27 tons |
| Nacelle weight | 19.77 tons |
| Tower weight | 29.91 tons |
| Base weight | 220.00 tons |
| Total weight | 277.95 tons |
| Name of the Components | Treatment | Ratio | Materials Treated | Mass of Components |
|---|---|---|---|---|
| Nacelle + tower | Landfill | 10% | Iron | 845 tons |
| Recycling | 90% | |||
| Rotor | Landfill | 100% | Composite | 142 tons |
| Foundation | Landfill | 100% | Concrete | 3740 tons |
| Decomposition of electronic parts | Landfill | 5% | Aluminum | 132 tons |
| Recycling | 95% |
| Materials | Weight (t) | By Truck (km) | By Ferry (km) | Transportation Costs | Cost Categories |
|---|---|---|---|---|---|
| Nacelle | 336 | 2640 | 8 | $24,009 | IIC |
| Rotor | 142 | 2640 | 8 | $15,925 | IIC |
| Cables and inverter | 132 | 441 | 8 | $2275 | IIC |
| Foundation and roads | 3740 | 305 | 8 | $28,187 | IIC |
| Tower | 508 | 2640 | 8 | $31,735 | IIC |
| Spare parts | 6.1 | 300 | Allocated | $141 | O and M |
| Lubricants | 3.4 | 300 | 8 | $34 | O and M |
| Iron | 845 | 100 | 15 | $2712 | DorR |
| Composite | 142 | 100 | 15 | $681 | DorR |
| Concrete | 3740 | - | - | Landfill | DorR |
| Aluminum | 132 | 100 | 15 | $424 | DorR |
| Onshore Wind Farm | Photovoltaic Power Plant | |
|---|---|---|
| Global Warming Potential [kg CO2-eq./MWh] | 10.58 | 18.33 |
| Acidification Potential [kg SO2-eq./MWh] | 0.01538 | 0.09816 |
| Eutrophication Potential [kg Phosphate-eq./MWh] | 0.00654 | 0.00794 |
| Energy Pay Back Time [year] | 0.62 | 2.06 |
| Cumulative Energy Demand [MJ/MWh] | 104.65 | 234.53 |
| Onshore Wind Farm | Photovoltaic Power Plant | |||
|---|---|---|---|---|
| Cost specifications | Total cost for the phases [$] | Ratios of the transportation cost | Total cost for the phases [$] | Ratios of the transportation cost |
| IIC | 23,838,415.88 | 0.0043 | 2,104,369.07 | 0.0006 |
| O and M | 106,961.61 | 0.0016 | 713,648.20 | 0.0023 |
| DorR | 3816.94 | 1 | 8741.95 | 1 |
| LCC | 23,949,194.42 | 0.0044 | 2,826,759.22 | 0.0041 |
| Photovoltaic Power Plant | |||
|---|---|---|---|
| Cases | First Case | Second Case (Base Case) | Third Case |
| Phase | Recycling with the end-of life approach | Real recycling plant case | Real recycling plant case |
| Differences | Without scrap materials transportation | Aluminum recycling ratio = 0.7 | Aluminum recycling ratio = 0.9 |
| GHGs [kg CO2-eq./MWh] | 16.07 | 18.33 | 18.33 |
| EPBT [years] | 1.82 | 2.06 | 2.06 |
| CED [MJ/MWh] | 207.76 | 234.53 | 234.58 |
| Onshore Wind Farm | ||
|---|---|---|
| Cases | Case A | Case B (Base case) |
| Phase | Disposal or recycling | Disposal or recycling |
| Differences | without scrap materials transportation | with scrap materials transportation (100 km by truck and 15 km by ferry) |
| GHGs [kg CO2 eq./MWh] | 10.57 | 10.58 |
| EPBT [years] | 0.61 | 0.62 |
| CED [MJ/MWh] | 104.46 | 104.65 |
| Phases | Production | Construction | O&M | DorR | System |
|---|---|---|---|---|---|
| Results | |||||
| GHGs [kg CO2-eq./MWh] | 16.0291 | 0.0854 | 0.0028 | 2.2130 | PV |
| 6.0102 | 0.4077 | 0.0059 | 4.1567 | Onshore | |
| EPBT [years] | 1.7881 | 0.0102 | 0.0002 | 0.2649 | PV |
| 0.5562 | 0.0347 | 0.0016 | 0.0229 | Onshore | |
| CED [MJ/MWh] | 203.7367 | 1.1390 | 0.0249 | 29.6316 | PV |
| 94.7149 | 5.8463 | 0.2716 | 3.8147 | Onshore | |
| LUCE [$/MWh] | 40.2288 | 13.6427 | 0.1671 | PV | |
| 35.0565 | 0.1573 | 0.0056 | Onshore | ||
© 2019 by the authors. Licensee MDPI, Basel, Switzerland. This article is an open access article distributed under the terms and conditions of the Creative Commons Attribution (CC BY) license (http://creativecommons.org/licenses/by/4.0/).
Share and Cite
Oğuz, E.; Şentürk, A.E. Selection of the Most Sustainable Renewable Energy System for Bozcaada Island: Wind vs. Photovoltaic. Sustainability 2019, 11, 4098. https://doi.org/10.3390/su11154098
Oğuz E, Şentürk AE. Selection of the Most Sustainable Renewable Energy System for Bozcaada Island: Wind vs. Photovoltaic. Sustainability. 2019; 11(15):4098. https://doi.org/10.3390/su11154098
Chicago/Turabian StyleOğuz, Elif, and Ayşe Eylül Şentürk. 2019. "Selection of the Most Sustainable Renewable Energy System for Bozcaada Island: Wind vs. Photovoltaic" Sustainability 11, no. 15: 4098. https://doi.org/10.3390/su11154098
APA StyleOğuz, E., & Şentürk, A. E. (2019). Selection of the Most Sustainable Renewable Energy System for Bozcaada Island: Wind vs. Photovoltaic. Sustainability, 11(15), 4098. https://doi.org/10.3390/su11154098