Assessing the Recreational Value of a National Forest Park from Ecotourists’ Perspective in Taiwan


Abstract
1. Introduction
2. Materials and Methods
2.1. Travel Cost Method
2.2. Recreational Value
2.3. Variable Selection and Calculation
2.3.1. Travel Costs
- Accommodation cost is the total amount per capita for accommodation expenses in HRFRA.
- Transportation cost is the cost of back-and-forth transportation. It can be further divided into four modes of transportation: public transportation, tour buses, bicycles or walking, and automobiles or scooters. Using open-ended questions, we inquired about public transportation costs and costs of tour buses by asking the tourists how much they spent. The transportation fee for walking or cycling is nil. As for automobiles and scooters, the cost depends on fuel consumption. The calculation is as follows: This study assumed that the automobiles considered were normal passenger cars travelling at a fixed average speed of 60 km/h, whereas scooters travel at an average speed of 40 km/h [14]. The length of their journey (time) and fuel consumption are also taken into consideration.
- For time cost, numerous studies [6,25,26] have focused on the time spent travelling to recreational areas and the time spent inside such areas. If recreational demands are used as dependent variables, the TTC should not include the stay time within a recreational site because it would result in a biased estimation. Moreover, the length of stay is at the visitors’ discretion; thus, it should be set as an endogenous variable. However, the travel time to a recreational site is affected by the distance, making it an exogenous variable. Therefore, it is not appropriate to combine the two factors because the endogenous variable could generate endogeneity [6,25,26]. Therefore, this study only considers the travel time for a round trip to HNFRA without including the time of stay.
- Consumer expense includes souvenirs bought, food, drinks, and admission fee in HNFRA [14]. The admission fee can be found from the HNFRA’s official website (HNFRA, 2017).
2.3.2. Socioeconomic Background and Recreational Behavior
2.3.3. Environmental Quality
2.3.4. Substitute Sites
2.4. Questionnaire Design
3. Results
3.1. Descriptive Statistics
3.2. Visitors’ Recreational Behavior
3.3. Visitors’ Preferences
3.4. Visitors’ Willingness to Revisit and Environment Assessment
3.5. Travel Cost Analysis
3.6. Recreational Demand
3.7. Recreational Value
4. Conclusions and Recommendations
4.1. Conclusions
4.2. Recommendations
4.3. Limitations and Future Research
Author Contributions
Funding
Conflicts of Interest
References
- Directorate General of Budget, Accounting and Statistics, Executive Yuan, Taiwan. Available online: https://www.moi.gov.tw/stat/english/ (accessed on 15 May 2017).
- Zhang, H.Y. Evaluation of Recreation Value of Urban Forest Park Based on ITCM-Jingyuetan National Forest Park as an Example. Master’s Thesis, Yanbian University, Yanji, China, 2016. [Google Scholar]
- Tourism Bureau, Ministry of Transport and Communications, Taiwan. Available online: https://eng.taiwan.net.tw/ (accessed on 5 April 2017).
- Huisun National Forest Recreation Area. Available online: http://huisun.nchu.edu.tw/ (accessed on 2 April 2017).
- Ward, F.A.; Beal, D.J. Valuing Nature with Travel Cost Models: A Manual; Edward Elgar Publishing: Cheltenham, UK, 2000. [Google Scholar]
- Liao, P.Y. Economic Evaluation of Recreation Benefits at Taiwan National Parks: Travel Demand System Frame. Master’s Thesis, National Taiwan University, Taipei, Taiwan, 2006. [Google Scholar]
- Rathnayake, R.M.W. Economic values for recreational planning at Horton Plains National Park, Sri Lanka. Tour. Geogr. 2016, 18, 213–232. [Google Scholar] [CrossRef]
- Chen, L.K. Factors affecting recreation experiences and recreation values of forest recreational areas-a case study of Chi-Lan Forest Recreational Area. J. Ilan. Ins. Tech. 1998, 1, 27–37. [Google Scholar]
- Zawacki, W.T.; Maarainko, A.; Bowder, J.M. A travel cost analysis of nonconsumptive wildlife-associated recreation in the United States. For. Sci. 2000, 46, 496–506. [Google Scholar]
- Clawson, M. Methods of Measuring the Demand for and Value of Outdoor Recreation; Resources for the Future: Washington, DC, USA, 1959. [Google Scholar]
- Clawson, M.; Knetsch, J.L. Economics of Outdoor Recreation; Johns Hopkins University Press: Baltimore, MD, USA, 1966. [Google Scholar]
- Brown, W.G.; Nawas, F. Impact of aggregation on the estimation of outdoor recreation demand functions. American J. Agric. Econ. 1973, 55, 246–249. [Google Scholar] [CrossRef]
- Gum, R.L.; Martin, W.E. Problems and solutions in estimating the demand for and value of rural outdoor recreation. Am. J. Agric. Econ. 1975, 11, 558–566. [Google Scholar] [CrossRef]
- Zhang, F.; Wang, X.H.; Nunes, P.A.L.D.; Ma, C. The recreational value of Gold Coast Beaches, Australia: An application of the travel cost method. Ecosyst. Serv. 2015, 11, 106–114. [Google Scholar] [CrossRef]
- Asafu-Adjaye, J. Environmental Economics for Non-Economists: Techniques and Policies for Sustainable Development, 2nd ed.; World Scientific Publishing: Singapore, 2005. [Google Scholar]
- Bennett, J. Estimating the recreational use values of national parks. Tour. Econ. 1996, 2, 303–320. [Google Scholar] [CrossRef]
- Rolfe, J.; Dyack, B. Valuing recreation in the Coorong Australia, with travel cost and contingent behavior models. Econ. Rec. 2011, 87, 282–293. [Google Scholar] [CrossRef]
- Long, J. Regression Models for Categorical and Limited Dependent Variables; Advanced Quantitative Techniques in the Social Sciences, Book 7; SAGE Publications: Thousand Oaks, CA, USA, 1997. [Google Scholar]
- Dobbs, I.M. Adjusting for sample selection bias in the individual travel cost method. J. Agric. Econ. 1993, 44, 335–342. [Google Scholar] [CrossRef]
- Shaw, D. On-site samples’ regression: Problems of non-negative integers, truncation, and endogenous stratification. J. Econ. 1988, 37, 211–223. [Google Scholar] [CrossRef]
- McCullagh, P. Generalized linear models. European J. Oper. Res. 1984, 16, 285–292. [Google Scholar] [CrossRef]
- Blackwell, B.D. The Economics of Coastal Foreshore and Beach Management: Use, Safe Bathing Facilities, Erosion and Conservation. Ph.D. Thesis, The University of Queensland, Brisbane, Australia, 2003. [Google Scholar]
- Bowker, J.M.; Leeworthy, V.R. Accounting for ethnicity in recreation demand: A flexible count data approach. J. Leis. Res. 1998, 30, 64–78. [Google Scholar] [CrossRef]
- Creel, M.D.; Loomis, J. Theoretical and empirical advantages of truncated count data estimators for analysis of deer hunting in California. Am. J. Agric. Econ. 1990, 72, 434–441. [Google Scholar] [CrossRef]
- Bockstael, N.E.; McConnell, K.E.; Strand, I.E., Jr. A random utility model for sport fishing: Some preliminary results for Florida. Mar. Resour. Econ. 1989, 6, 245–260. [Google Scholar] [CrossRef]
- McConnell, K.E. On-site time in the demand for recreation. Am. J. Agric. Econ. 1992, 74, 918–925. [Google Scholar] [CrossRef]
- Chang, S.H. Recreational Benefits and Pricing Policy of Nature-Based Tourism: A Case Study of Guandu Nature Park. Master’s Thesis, National Taipei University, Taipei, Taiwan, 2015. [Google Scholar]
- Shi, D.Q.; Zhang, Y.J. Application of travel cost method in recreation value evaluation. J. Beijing For. Univ. 2010, 9, 69–74. [Google Scholar]
- Ho, W.H. The Recreation Value of Rural Tourism in Sinpu. Master’s Thesis, National Tsing Hua University, Hsinchu, Taiwan, 2013. [Google Scholar]
- Yen, J.J. The development of tourism spatio-temporal framework. J. Out. Rec. Stu. 1993, 6, 31–53. [Google Scholar]
- Liston-Heyes, C.; Heyes, A. Recreational benefits from the Dartmoor National Park. J. Environ. Manag. 1999, 55, 69–80. [Google Scholar] [CrossRef]
- Gokovali, U.; Bahar, O.; Kozak, M. Determinants of length of stay: A parametric survival use of analysis. Tour. Manag. 2007, 28, 736–746. [Google Scholar] [CrossRef]
- Kozak, M. Repeaters’ behavior at two distinct destinations. Ann. Tour. Res. 2001, 28, 785–808. [Google Scholar] [CrossRef]
- Wang, E.; Yu, Y.; Little, B.B.; Li, Z. Crop insurance premium design based on survival analysis model. Agric. Sci. Proc. 2010, 1, 67–75. [Google Scholar] [CrossRef][Green Version]
- Martinez-Espineira, R.; Amoako-Tuffour, J. Recreation demand analysis under truncation, overdispersion, and endogenous stratification: An application to Gros Morne National Park. J. Environ. Manag. 2008, 88, 1320–1332. [Google Scholar] [CrossRef]
- Oppermann, M. Travel life cycle. Ann. Tour. Res. 1995, 22, 535–552. [Google Scholar] [CrossRef]
- Zimmer, Z.; Brayley, R.E.; Searle, M.S. Whether to go and Where to go: Identification of important influences on seniors’ decisions to travel. J. Travel Res. 1995, 33, 3–10. [Google Scholar] [CrossRef]
- Lohmann, M.; Danielsson, J. Predicting travel patterns of senior citizens: How the past may provide a key to the future. J. Vacat. Mark. 2001, 7, 357–366. [Google Scholar] [CrossRef]
- Schröder, A.; Widmann, T. Demographic Change and Its Impact on the Travel Industry: Oldies-nothing but Goldies. In Trends and Issues in Global Tourism; Conrady, R., Buck, M., Eds.; Springer: Berlin/Heidlberg, Germany, 2007. [Google Scholar]
- Hsu, C.Y. A Study on Recreation Benefits and Tourists’ Evaluations for Museums—A Case of National Museum of Natural Science in Taiwan. Master’s Thesis, National Chung Hsing University, Hsinchu, Taiwan, 2008. [Google Scholar]
- Tu, C.S. The Economic Value of Museums and the Methods for Evaluation—A Case Study of National Science and Technology Museum in Taiwan. Master’s Thesis, National Sun Yat-sen University, Kaohsiung, Taiwan, 2013. [Google Scholar]
- Lee, C.H.; Chen, Y.T.; Hsieh, C.M.; Hsu, S.W. Economic assessment of tourism quality improvement programs for the Taroko National Park. Sports Exerc. Res. 2016, 18, 1–13. [Google Scholar]
- Chen, Y.H.; Lee, C.H.; Chen, Y.H. Evaluation of economic benefits from visitor’s ecotourism quality improvement in forest recreational area-a case of Chi-Tou Forest Recreational Area. Taiwanese Agric. Econ. Rev. 2011, 16, 1–40. [Google Scholar]
- Lima, J.D.; Maia, M.L.; Lucas, K. Income vs. travel time: Why do the poorest and the richest travel fastest in Northeastern Brazil? Transp. Res. Proc. 2017, 25, 4285–4295. [Google Scholar] [CrossRef]
- Loomis, J.B.; Yorizane, S.; Larson, D. Testing significance of multi-destination and multi-purpose trip effects in a travel cost method demand model for whale watching trips. Agric. Res. Econ. Rev. 2000, 29, 183–191. [Google Scholar] [CrossRef]
- Huang, Y.L.; Chen, K.L. The effect of multiple destination trips on recreation benefits-an example of leisure agriculture in Yilan County, Taiwan. Taiwan. Agric. Econ. Rev. 2011, 16, 41–76. [Google Scholar]
- Liao, H.H. Evaluating the Recreation Value of Yangmingshan National Park. Master’s Thesis, Chinese Culture University, Taipei, Taiwan, 2003. [Google Scholar]


| Type | Variable (code) | Explanation |
|---|---|---|
| Socioeconomic variables | Gender (GENDER) | Dummy variable (Male = 1, Female = 0) |
| Age (AGE) | Continuous variable (years) | |
| Personal income (INC) | Continuous variable (NT$) | |
| Level of education (EDU) | Dummy variable (Elementary school = 1; junior high school = 2; high school/vocational school = 3; university/college for professional training = 4; Master’s degree or above = 5) | |
| Living area (AREA) | Dummy variable (local = 1; nonlocal = 0) | |
| Travel costs | A+MTC | Transportation costs + accommodation (NT$) |
| A+TTC+MTC | Transportation costs + accommodation + time costs (NT$) | |
| A+OE+MTC | Transportation costs + accommodation + consumer expenses (NT$) | |
| A+OE+TTC+MTC | Transportation costs + accommodation + time costs + consumer expenses (NT$) | |
| Environmental quality | SAT | Continuous variable (points), visitors’ evaluation of the local environment (minimum 1 point, maximum 10 points) |
| Recreational behavior | Length of stay (LOS) | Continuous variable (h) |
| Transportation time (TRATIME) | Continuous variable (h) | |
| Number of companions (NIP) | Continuous variable (people) | |
| Substitute sites | SUBSITE | Dummy variable (HNFRA is the main destination = 1; HNFRA is not the main destination = 0) |
| Variable | Overall Visitors (n = 223) | Local Visitors (n = 128) | Nonlocal Visitors (n = 95) | |||
|---|---|---|---|---|---|---|
| Mean | Standard Deviation | Mean | Standard Deviation | Mean | Standard Deviation | |
| Age | 44.31 | 14.08 | 40.25 | 14.16 | 49.76 | 12.02 |
| Gender1 | 0.43 | 0.49 | 0.46 | 0.50 | 0.39 | 0.49 |
| Level of education2 | 3.87 | 0.74 | 3.88 | 0.71 | 3.84 | 0.76 |
| Monthly income (NT$) | 42,690.58 | 21,870.39 | 40,468.75 | 20,345.81 | 45,684.21 | 23,549.00 |
| Place of residence3 | 0.57 | 0.50 | – | – | – | – |
| Recreational demand (number of visits/per year) | 1.71 | 1.10 | 2.05 | 1.24 | 1.25 | 0.65 |
| Substitute sites4 | 0.91 | 0.29 | 0.90 | 0.30 | 0.92 | 0.28 |
| Company (number of people) | 20.43 | 38.10 | 10.90 | 13.99 | 33.28 | 53.38 |
| Length of stay (h) | 16.49 | 18.97 | 16.86 | 22.48 | 15.99 | 12.91 |
| Travelling time (h) | 2.28 | 1.15 | 1.73 | 0.76 | 3.01 | 1.17 |
| Environmental rating5 (points) | 7.44 | 1.58 | 7.27 | 1.72 | 7.67 | 1.36 |
| Variable | Overall Visitors (n = 223) | Local Visitors (n = 128) | Nonlocal Visitors (n = 95) | ||||
|---|---|---|---|---|---|---|---|
| Number | Percentage (%) | Number | Percentage (%) | Number | Percentage (%) | ||
| Gender | M | 96 | 43.0 | 59 | 46.1 | 37 | 38.9 |
| F | 127 | 57.0 | 69 | 53.9 | 58 | 61.1 | |
| Age | 18–29 years | 51 | 22.9 | 43 | 33.6 | 8 | 8.4 |
| 30–49 years | 71 | 31.8 | 32 | 32.8 | 29 | 30.5 | |
| 50–64 years | 86 | 38.6 | 39 | 30.5 | 47 | 49.5 | |
| 65 years or above | 15 | 6.7 | 4 | 3.1 | 11 | 11.6 | |
| Level of education | Elementary school | 0 | 0.0 | 0 | 0.0 | 0 | 0.0 |
| Junior high school | 9 | 4.0 | 4 | 3.1 | 5 | 5.3 | |
| High school/vocational school | 50 | 22.4 | 29 | 22.7 | 21 | 22.1 | |
| University/college for professional training | 126 | 56.5 | 73 | 57.0 | 53 | 55.8 | |
| Graduate studies and above | 38 | 17.0 | 22 | 17.2 | 16 | 16.8 | |
| Monthly income | Below NT$20,000 | 53 | 23.8 | 31 | 24.2 | 22 | 23.2 |
| NT$20,000—NT$40,000 | 66 | 29.6 | 44 | 34.4 | 22 | 23.2 | |
| NT$40,000—NT$60,000 | 60 | 26.9 | 31 | 24.2 | 29 | 30.5 | |
| NT$60,000—NT$80,000 | 28 | 12.6 | 16 | 12.5 | 12 | 12.6 | |
| NT$80,000—NT$100,000 | 8 | 3.6 | 3 | 2.3 | 5 | 5.3 | |
| Above NT$100,000 | 8 | 3.6 | 3 | 2.3 | 5 | 5.3 | |
| Profession | Student | 28 | 12.6 | 25 | 19.5 | 3 | 3.2 |
| Military, government employee, or teacher | 35 | 15.7 | 13 | 10.2 | 22 | 23.2 | |
| Industrial sector | 29 | 13.0 | 18 | 14.1 | 11 | 11.6 | |
| Commerce | 20 | 9.0 | 13 | 10.2 | 7 | 7.4 | |
| Service industry | 39 | 17.5 | 28 | 21.9 | 11 | 11.6 | |
| Freelance | 19 | 8.5 | 7 | 5.5 | 12 | 12.6 | |
| Agricultural, forestry, fishery and husbandry | 3 | 1.3 | 1 | 0.8 | 2 | 2.1 | |
| Unemployed | 3 | 1.3 | 1 | 0.8 | 2 | 2.1 | |
| Retired | 28 | 12.6 | 10 | 7.8 | 18 | 18.9 | |
| Other | 18 | 8.1 | 11 | 8.6 | 7 | 7.4 | |
| Place of residence | Local | 128 | 57.4 | ||||
| Nonlocal | 95 | 42.6 | |||||
| Variable | Overall Visitors (n = 223) | Local Visitors (n = 128) | Nonlocal Visitors (n = 95) | ||||
|---|---|---|---|---|---|---|---|
| Number | Percentage | Number | Percentage | Number | Percentage | ||
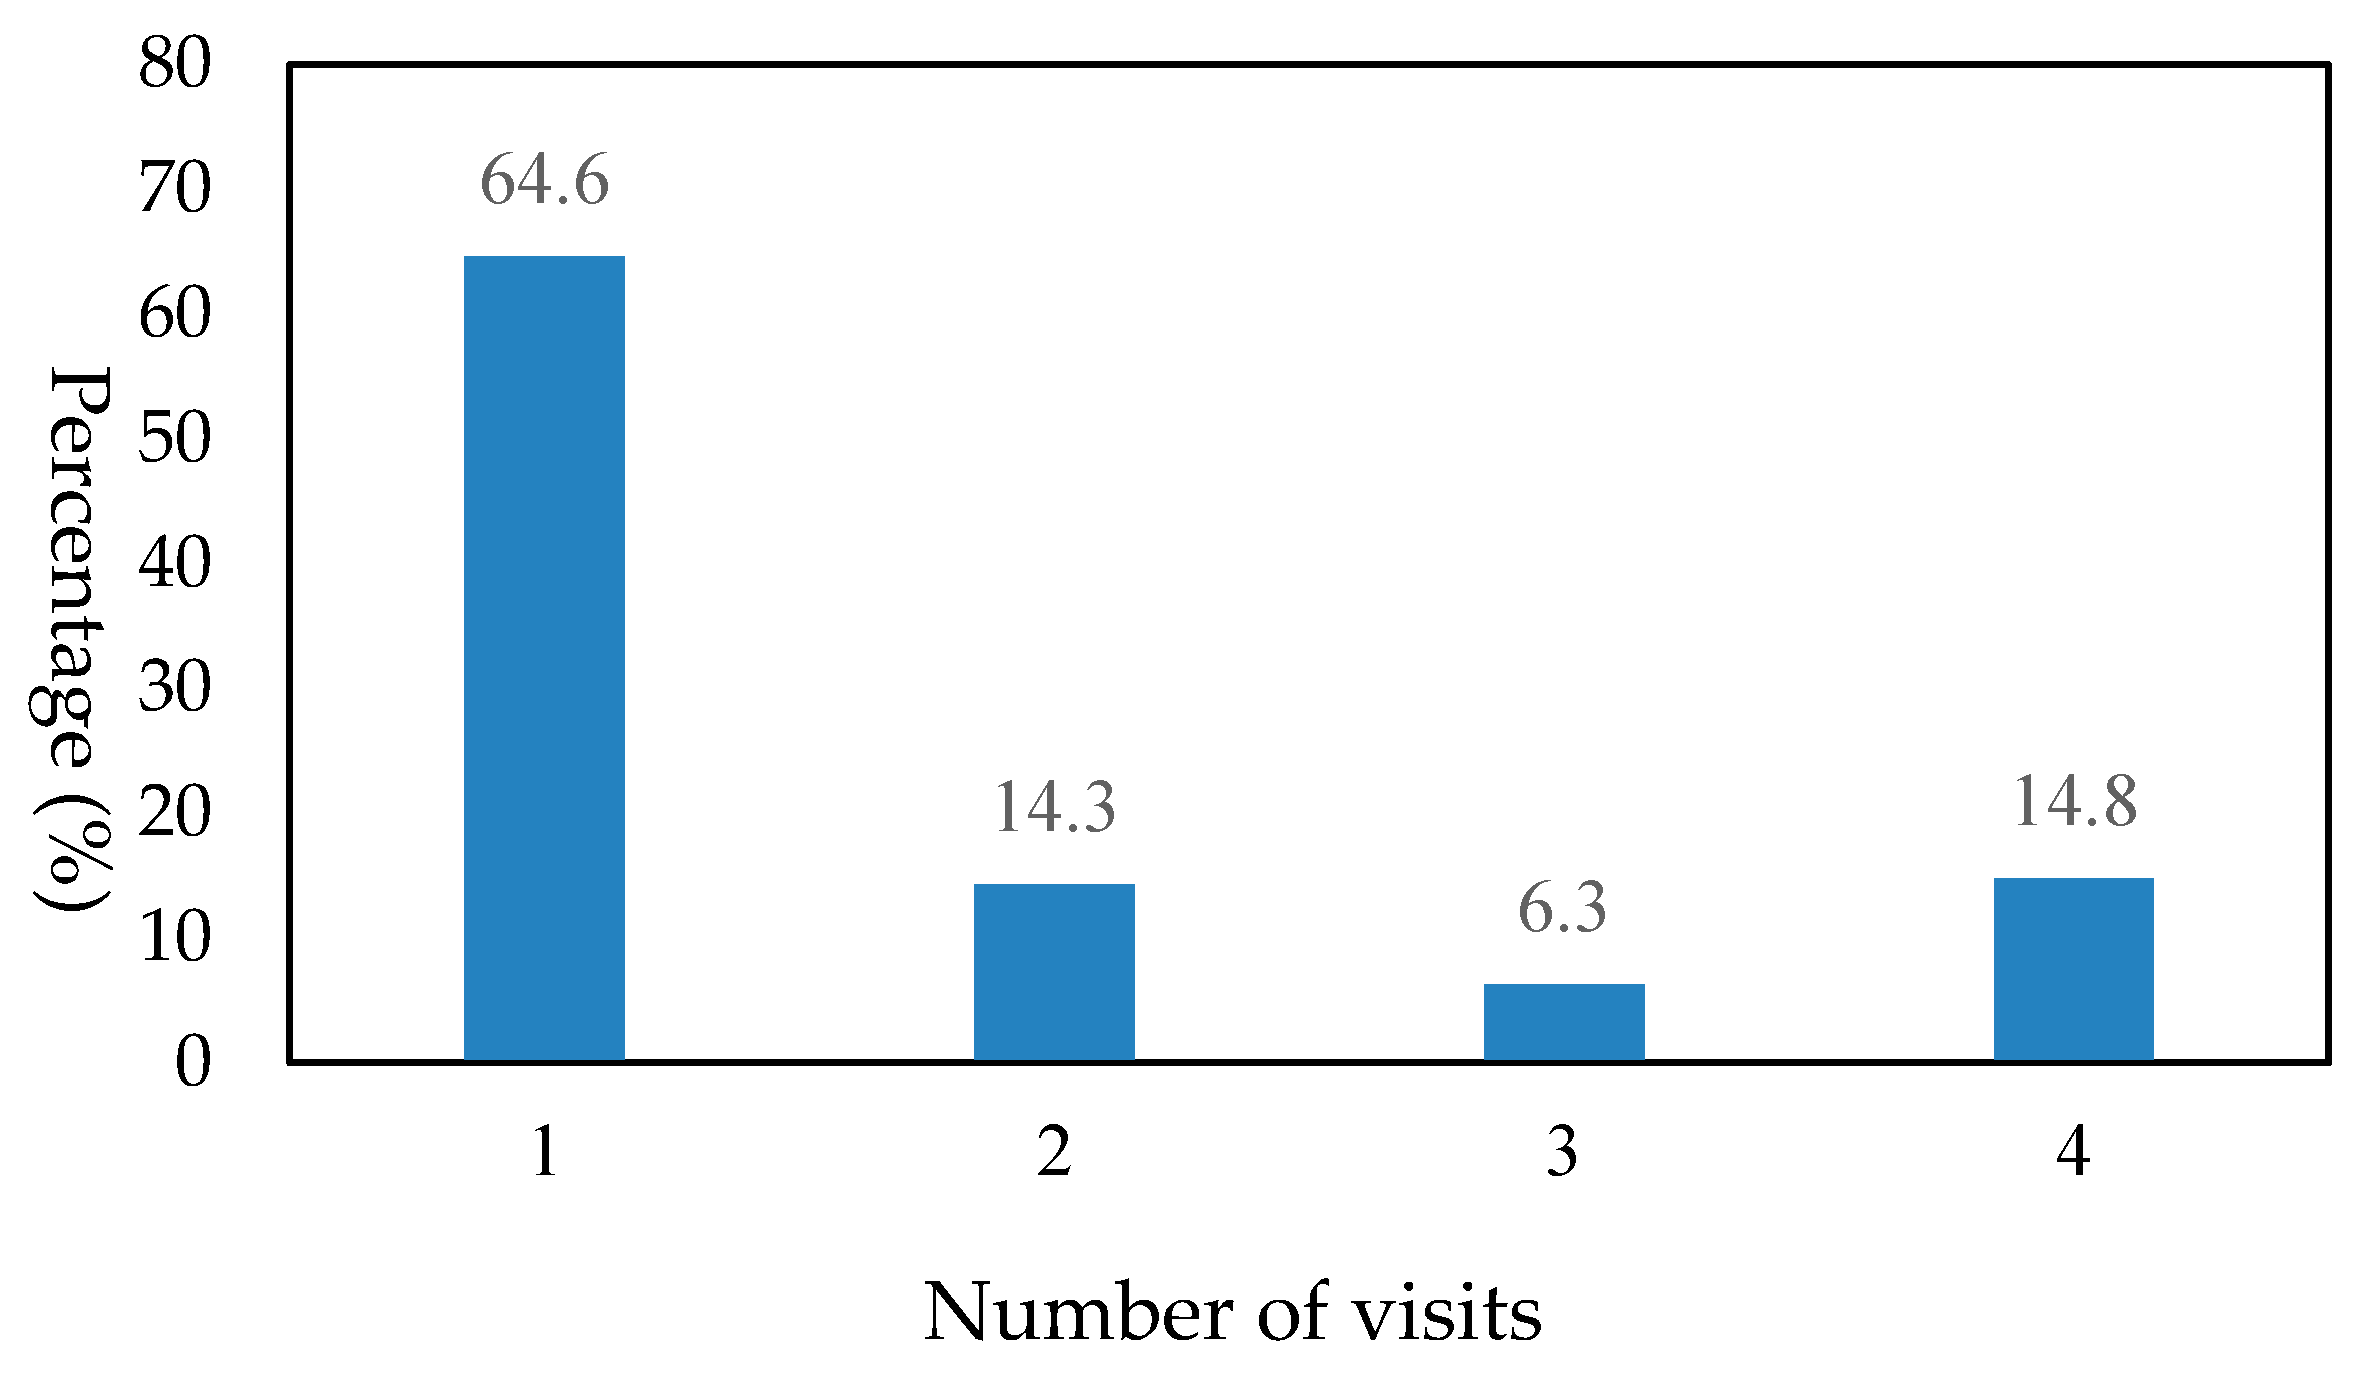
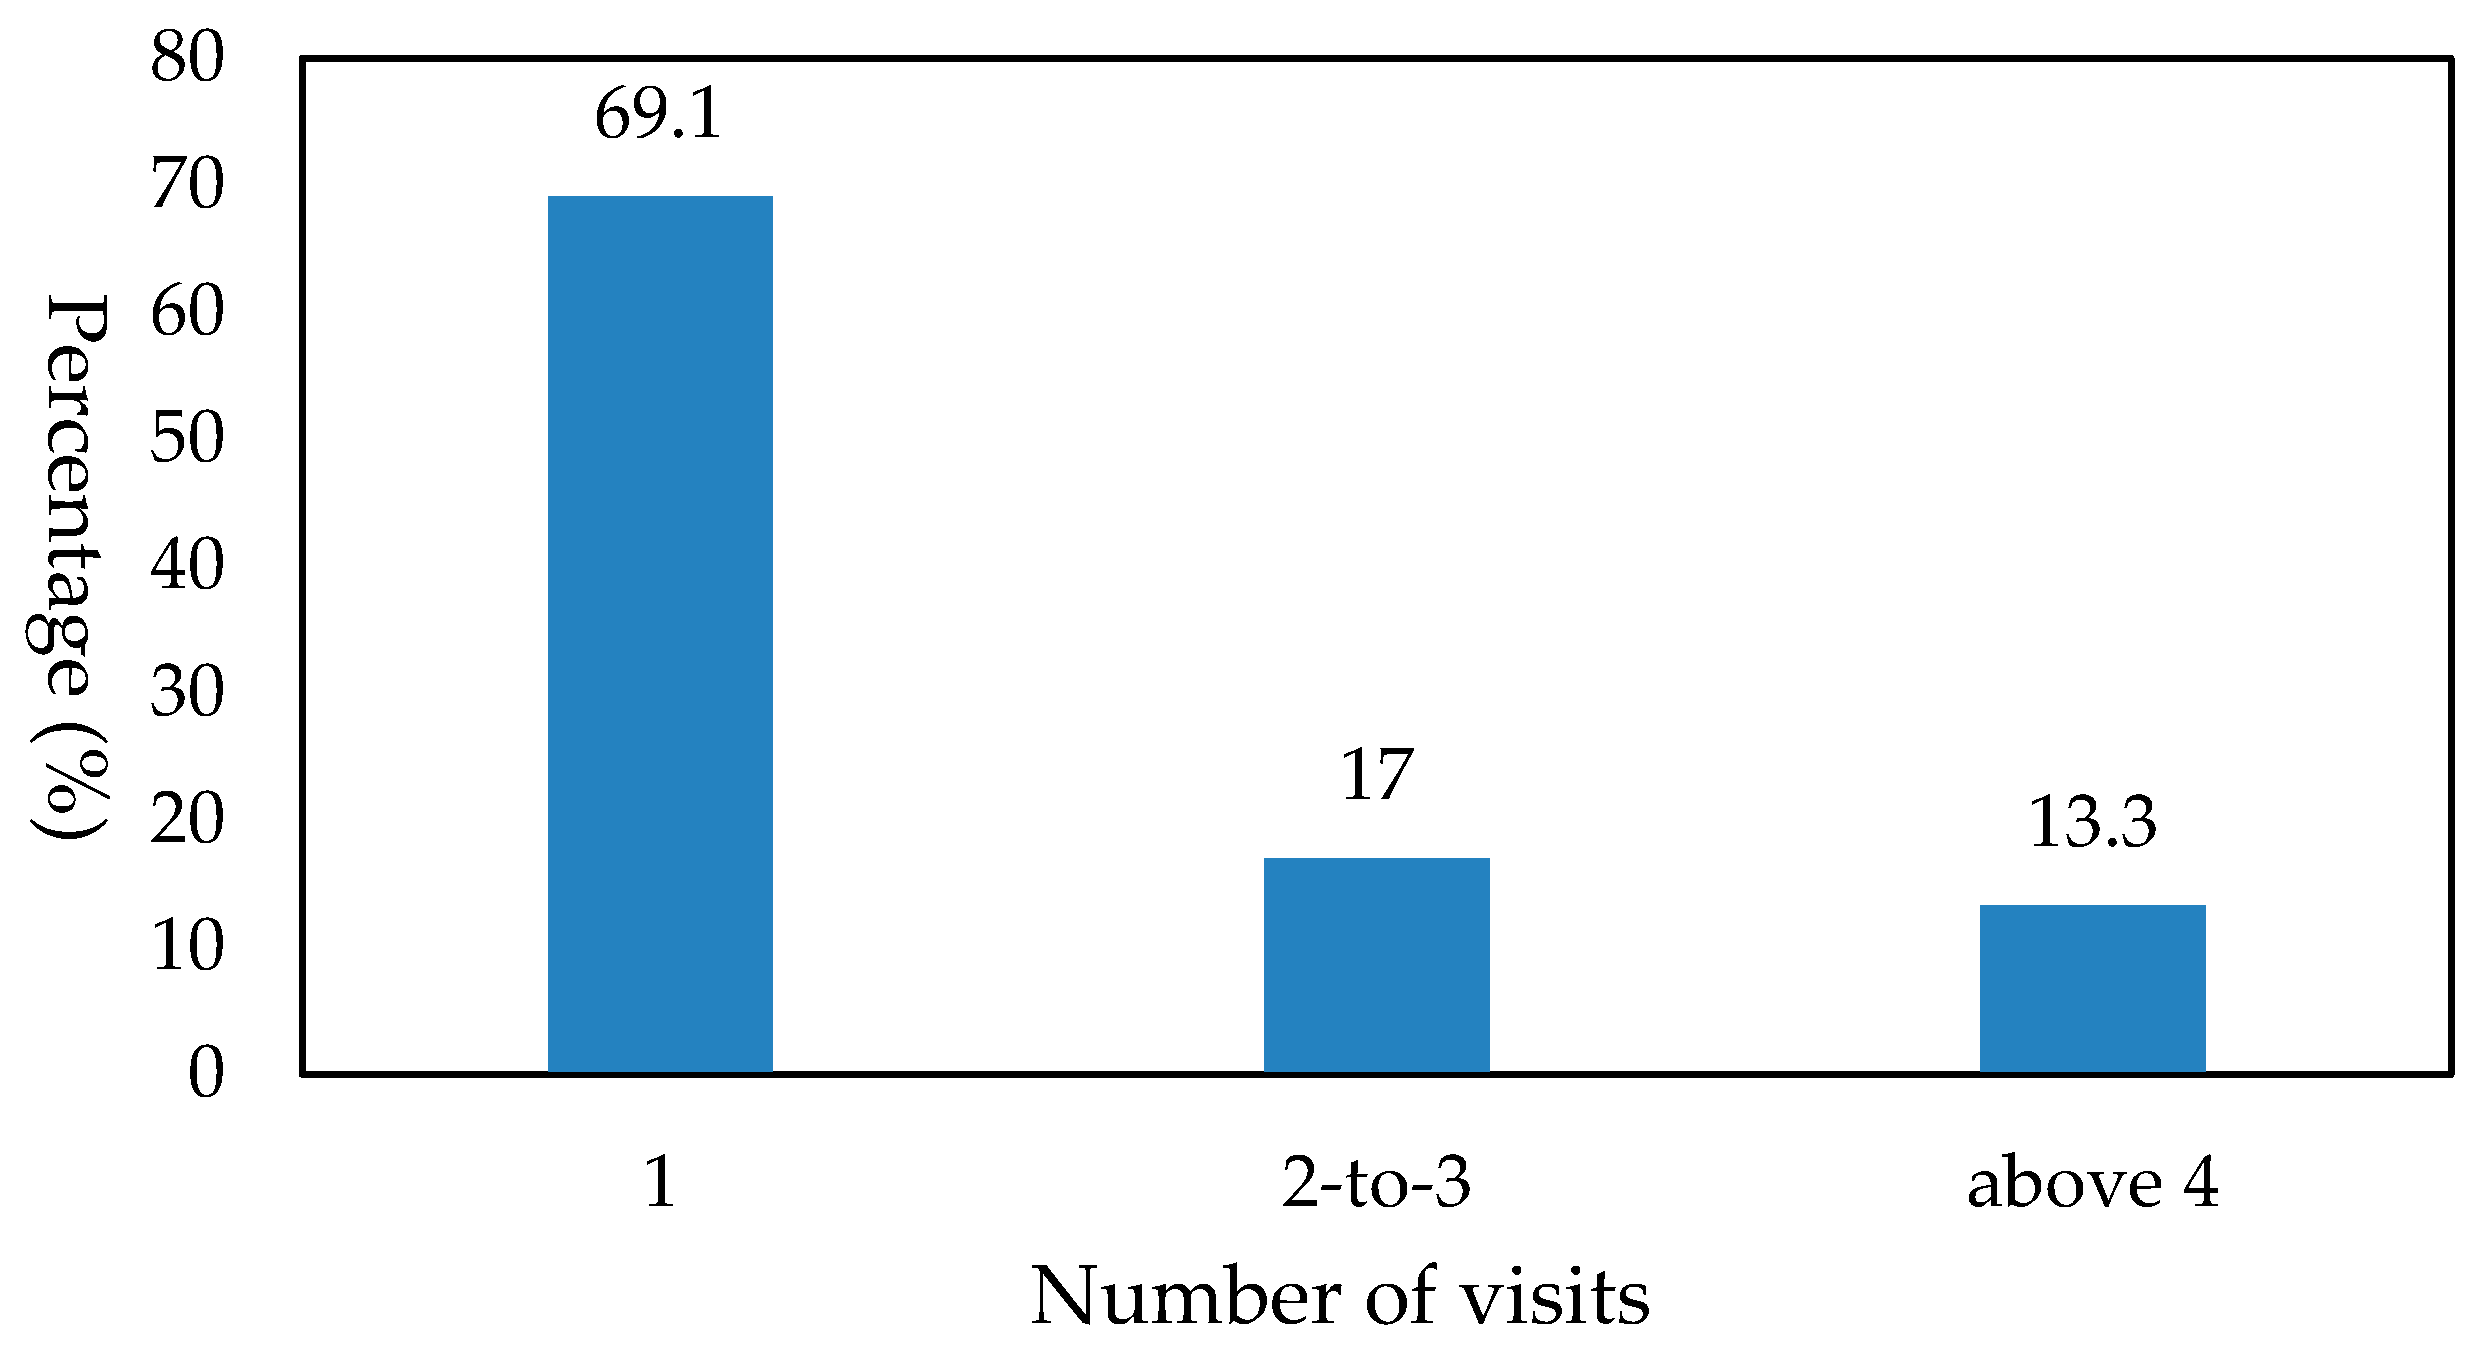
| Recreational demand | Number of visits (1) | 144 | 64.6 | 66 | 51.2 | 79 | 83.2 |
| Number of visits (2) | 32 | 14.3 | 21 | 16.3 | 11 | 11.6 | |
| Number of visits (3) | 14 | 6.3 | 12 | 9.3 | 2 | 2.1 | |
| Number of visits (4 or above) | 33 | 14.8 | 30 | 23.3 | 3 | 3.2 | |
| Substitute site | Intentional visit | 202 | 90.6 | 116 | 89.9 | 87 | 91.6 |
| Fortuitous visit | 21 | 9.4 | 13 | 10.1 | 8 | 8.4 | |
| Length of stay | Below 2 h | 11 | 4.9 | 4 | 3.1 | 7 | 7.4 |
| 2–4 h | 42 | 18.8 | 26 | 20.2 | 16 | 16.8 | |
| 4–6 h | 60 | 26.9 | 44 | 34.1 | 17 | 17.9 | |
| 6–8 h | 19 | 8.5 | 15 | 11.6 | 4 | 4.2 | |
| 2 days, 1 night | 70 | 31.4 | 23 | 17.8 | 47 | 49.5 | |
| 3 days, 2 nights | 4 | 1.8 | 1 | 0.8 | 3 | 3.2 | |
| 4 days, 3 nights | 17 | 7.6 | 16 | 12.4 | 1 | 1.1 | |
| Means of transportation | Motorcycle/scooter | 12 | 5.4 | 12 | 9.3 | 0 | 0.0 |
| Automobile | 168 | 75.3 | 105 | 82.2 | 63 | 66.3 | |
| Walking, bicycle | 1 | 0.4 | 1 | 0.8 | 0 | 0.0 | |
| Public transportation | 5 | 2.2 | 1 | 0.8 | 4 | 4.2 | |
| Tour bus | 37 | 16.6 | 9 | 7.0 | 28 | 29.5 | |
| Item | Enjoying the Scenery | Mountaineering | Academic Research | Playing with the Water | Picnicking | Resting on a Hammock | Playing Sports | Forest Bathing |
|---|---|---|---|---|---|---|---|---|
| Number (percentage) | 153 (22.5%) | 102 (15.0%) | 14 (2.1%) | 74 (10.9%) | 60 (8.8%) | 102 (15.0%) | 10 (1.5%) | 164 (24.2%) |
| Variables | Absolutely Not Willing | Not Willing | Maybe | Willing | Absolutely Willing | Mean | |
|---|---|---|---|---|---|---|---|
| Willing to revisit | 0 (0.0%) | 2 (0.9%) | 20 (9.0%) | 114 (51.1%) | 87 (39.0%) | 4.28 | |
| Willingness to revisit 1 | Willing to recommend the site to other people | 0 (0.0%) | 1 (0.4%) | 26 (11.7%) | 113 (50.7%) | 83 (37.2%) | 4.25 |
| HNFRA is one of your first priority scenic spots | 2 (0.9%) | 4 (1.8%) | 40 (17.9%) | 117 (52.5%) | 60 (26.9%) | 4.03 | |
| Environment assessment 2 | 7.44 | ||||||
| Variable Code | Overall Visitors (n = 223) | Local Visitors (n = 128) | Nonlocal Visitors (n = 95) | |||
|---|---|---|---|---|---|---|
| Mean | Standard Deviation | Mean | Standard Deviation | Mean | Standard Deviation | |
| A | 446.24 | 1014.27 | 369.41 | 1254.71 | 544.48 | 530.62 |
| MTC | 259.43 | 201.72 | 205.21 | 189.67 | 332.49 | 195.19 |
| TTC | 454.20 | 351.81 | 326.69 | 238.70 | 626.01 | 404.17 |
| OE | 800.67 | 707.49 | 717.11 | 665.34 | 913.25 | 749.49 |
| Travel costs (A + OE + TTC + MTC) | 1946.38 | 2773.94 | 1597.65 | 1697.46 | 2416.24 | 1248.69 |
| Variables | Overall Visitors | Nonlocal Visitors | Local Visitors |
|---|---|---|---|
| Ln (A+OE+TTC+MTC) | −0.024 | −0.190 | −0.002 |
| Place of residence (AREA) | |||
| Local | 0.438 ** | – | – |
| Nonlocal | – | – | – |
| Gender (GENDER) | |||
| Male | 0.039 | 0.085 | −0.002 |
| Female | – | – | – |
| Age (AGE) | 0.010 * | 0.014 | 0.006 |
| Level of education (EDU) | 0.125 | 0.186 | 0.135 |
| Ln (INC) | −0.258 | −0.236 | −0.134 |
| Length of stay (LOS) | 0.004 | −0.001 | 0.006 * |
| Travelling time (TRATIME) | −0.046 | −0.048 | 0.020 |
| Substitute sites (SUBSITE) | |||
| Intentional trip | −0.028 | 0.189 | −0.055 |
| Fortuitous trip | – | – | – |
| Number of people (NIP) | −0.002 | 0.000 | −0.020 ** |
| Environmental rating (SAT) | 0.005 | −0.002 | −0.013 |
| β0 | 2.276 | 2.732 | 1.631 |
| α coefficient value 1 | 0.000 | 0.000 | 0.000 |
| Likelihood ratio chi-square | 30.789 ** | 7.533 | 17.562 |
| Log-likelihood value | −313.136 | −109.172 | −196.225 |
| Overall Visitors (n = 223) | Nonlocal Visitors (n = 95) | Local Visitors (n = 128) | |
|---|---|---|---|
| Annual recreational demands per capita (times) | 1.70 | 1.25 | 2.05 |
| 95% confidence interval (CI) upper limit | 1.85 | 1.39 | 2.27 |
| 95% confidence interval (CI) lower limit | 1.56 | 1.14 | 1.85 |
| Recreational value per capita per time (NT$) | 1904 | 2528 | 1561 |
| Annual recreational value per capita (NT$) | 3237 | 3160 | 3201 |
| 95% confidence interval (CI) upper limit | 3523 | 3514 | 3545 |
| 95% confidence interval (CI) lower limit | 2970 | 2882 | 2889 |
| Annual total recreational value (NT$) | 347,270,560 | 461,081,920 | 284,710,790 |
© 2019 by the authors. Licensee MDPI, Basel, Switzerland. This article is an open access article distributed under the terms and conditions of the Creative Commons Attribution (CC BY) license (http://creativecommons.org/licenses/by/4.0/).
Share and Cite
Liu, W.-Y.; Chen, P.-Z.; Hsieh, C.-M. Assessing the Recreational Value of a National Forest Park from Ecotourists’ Perspective in Taiwan. Sustainability 2019, 11, 4084. https://doi.org/10.3390/su11154084
Liu W-Y, Chen P-Z, Hsieh C-M. Assessing the Recreational Value of a National Forest Park from Ecotourists’ Perspective in Taiwan. Sustainability. 2019; 11(15):4084. https://doi.org/10.3390/su11154084
Chicago/Turabian StyleLiu, Wan-Yu, Pin-Zheng Chen, and Chi-Ming Hsieh. 2019. "Assessing the Recreational Value of a National Forest Park from Ecotourists’ Perspective in Taiwan" Sustainability 11, no. 15: 4084. https://doi.org/10.3390/su11154084
APA StyleLiu, W.-Y., Chen, P.-Z., & Hsieh, C.-M. (2019). Assessing the Recreational Value of a National Forest Park from Ecotourists’ Perspective in Taiwan. Sustainability, 11(15), 4084. https://doi.org/10.3390/su11154084