1. Introduction
The transportation industry is the leading and basic industry of national economic and social development, and an important guarantee for social and economic development and improvement of people’s living standards. Transportation plays an important role in the whole social development. Raising the level of transportation management can not only promote employment, expand domestic demand, and promote social and economic development and urbanization, but also effectively improve the utilization of social resources, actively improve the environment, and facilitate people’s travel. In some areas, transportation administration departments have begun to try to introduce public participation. The public is the direct beneficiary and experiencer of transportation management and services. The introduction of public participation system in transportation management can better satisfy people’s interests and needs by drawing on public opinions and making decisions, supervising, and evaluating transportation planning.
At present, the public participation system in China’s transportation management is still in early stages, and the transparency and openness of information such as transportation decision-making and supervision are insufficient. The mechanism of public participation is not perfect, the consciousness of public participation is weak, and the channels of participation are scarce. Therefore, actively exploring the countermeasures to improve the public participation system in transportation management is an urgent problem to be solved in the current transportation management.
In recent years, the emergence of big data analysis technology provides us with new ideas and methods to acquire and process traffic data [
1]. The purpose of this paper is to apply the content analysis method of big data technology to traffic planning field, and put forward a set of processes and methods combined with it, so as to provide feasible large data analysis methods for traffic planners. This study focuses on text data that people often ignore, trying to obtain public views and opinions on the traffic system from comment texts, and then apply them to public participation in transportation. In doing so, it can improve the extent of public participation, and speed up the collection and processing of information. The effective information in public opinion can be made full use of to analyze the spatial and temporal characteristics and make up for the blind spots that traditional planning cannot achieve.
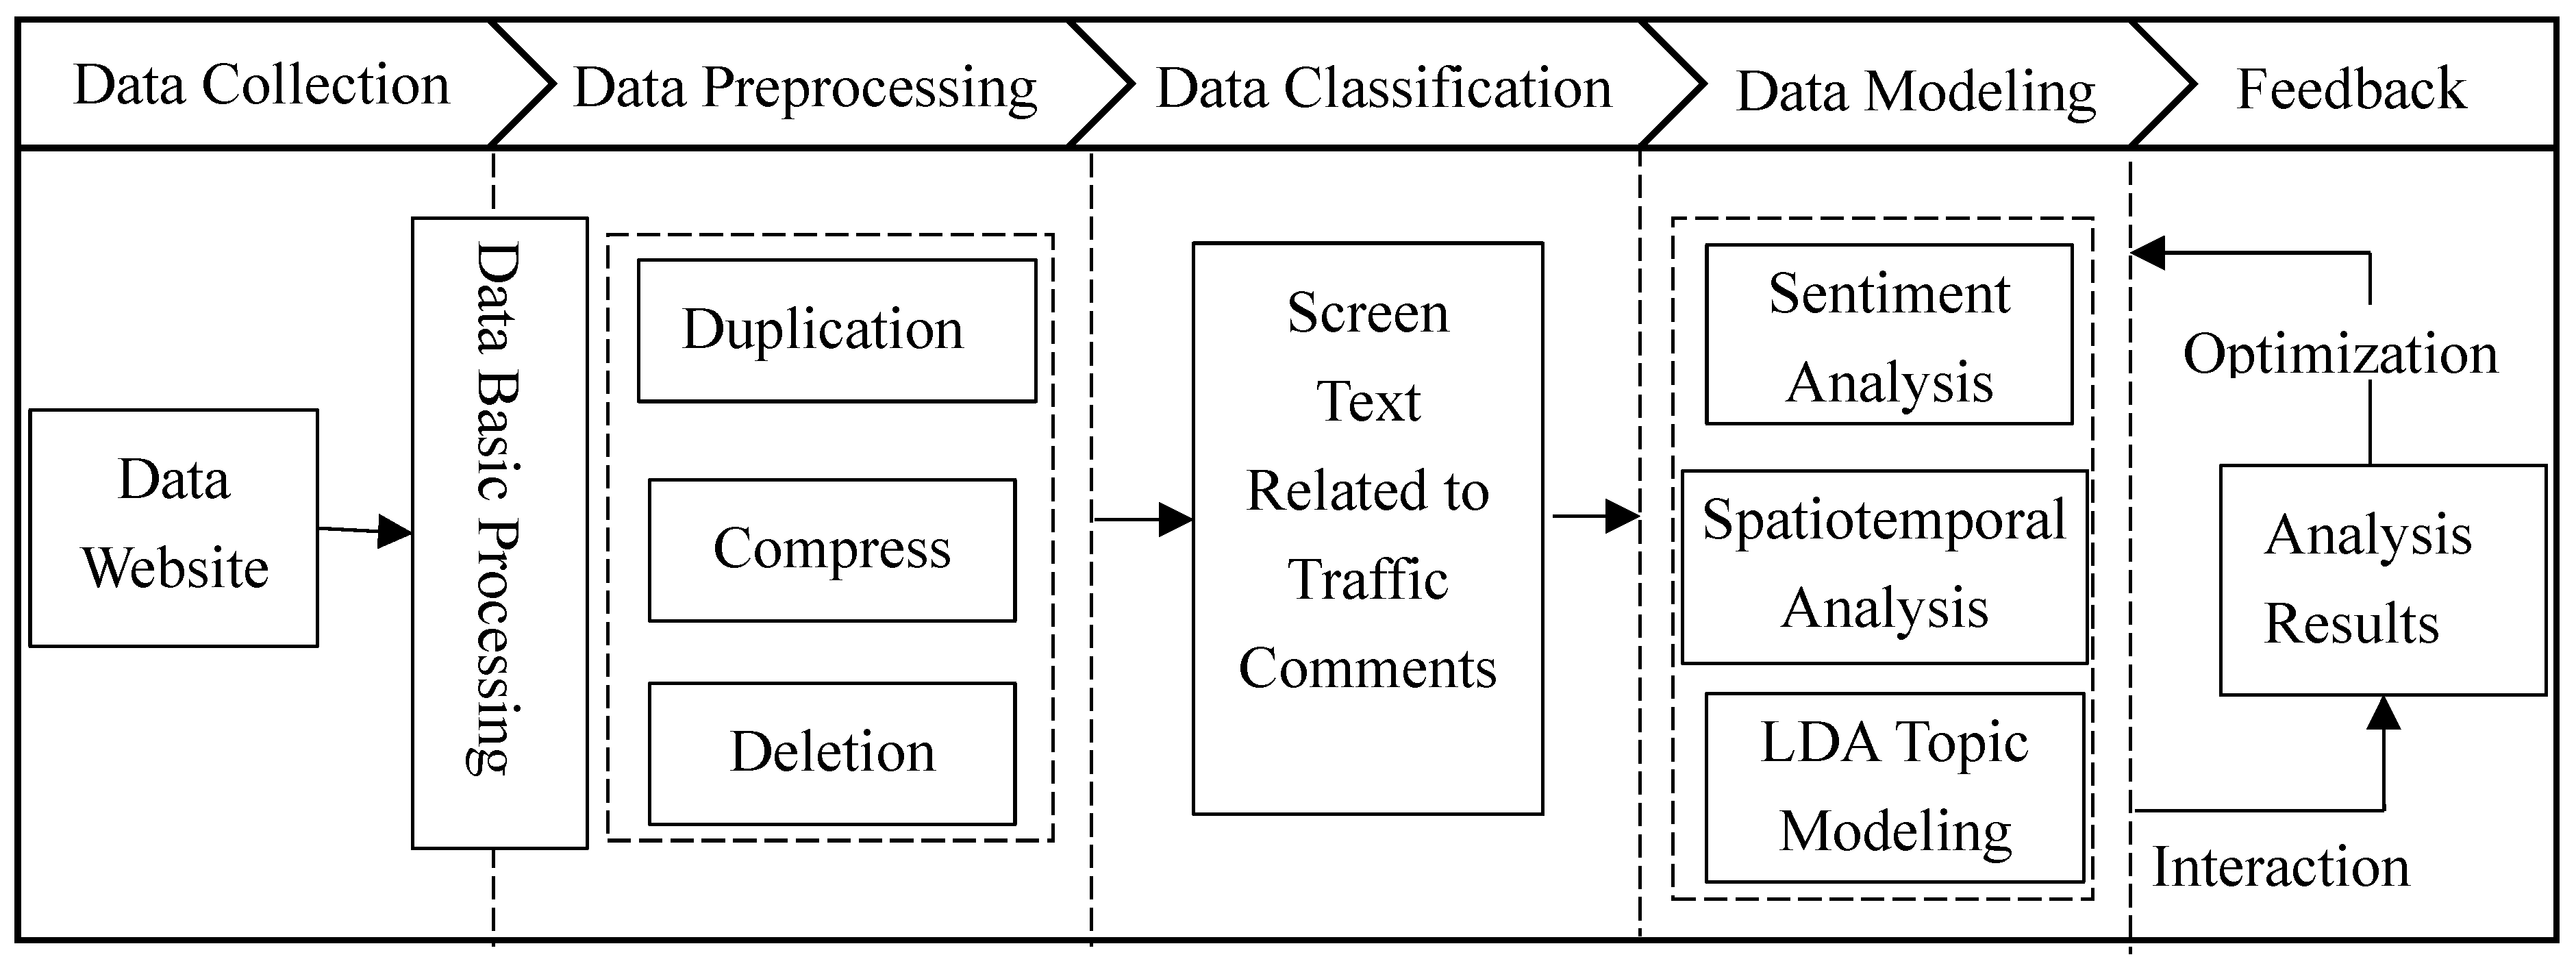
The analysis process is shown in
Figure 1. Firstly, public opinions are collected from common social network platforms such as microblog by using open platform SDK and API, and do basic processing such as de-duplication and word segmentation. As one of the most commonly used social media platforms in China, data in microblog have large mining and research value. However, as shown in the next section, the previous studies of microblog data in traffic field rarely focus on specific text semantic analysis and sentiment analysis, and therefore public comments and feedback cannot be collected. Thus, in this study, we apply a content classification method to extract valuable traffic comments from the whole data and conduct emotional orientation analysis. The latent Dirichlet allocation (LDA) topic model is used to mine the topic of text and analyze the subjective information behind the text. Finally, the temporal and spatial characteristics of the text are described. After summarizing the above analysis results, corresponding improvement measures are put forward.
The structure of this paper is as follows: The first chapter mainly introduces the research background and significance of the subject, and then lists the research content and chapter organization. The second chapter is about the research status at home and abroad, and summarizes the limitations and shortcomings of public participation. Chapter 3 is an introduction to the methodology of content analysis. Chapter 4 takes Nanjing Metro System as an example to collect public opinions on Nanjing Metro System for content analysis and topic modeling. Chapter 5 provides suggestions and conclusions for the improvement measures of Nanjing metro system according to the analysis results.
2. Literature Review
With the development of economy and society, the number of urban populations keeps increasing, which leads to the continuous increase of people’s demand for transportation. In recent years, traffic congestion, environmental pollution, and other problems caused by urban traffic have gradually emerged. The formulation and implementation of urban traffic policy will directly affect the allocation of urban traffic resources and the long-term development of urban traffic. As a group affected by traffic policy, the public should participate in the formulation of traffic policy in an appropriate way to make public policy scientific and reasonable.
Booth et al. argued that public participation is top-down in the formulation of transport policy, and to some extent it is insufficient [
2]. Bickerstaff et al. studied public participation in urban traffic planning and believed that public participation should be introduced as early as possible in decision-making planning, finding out the causes of different situations, and giving timely feedback [
3]. Kennedy et al. argued that in transportation management, public needs should be taken as one of the elements of decision-making. The introduction of public participation legally, reasonably, and actively is not only conducive to decision-making, but also conducive to the realization of public interests [
4]. Banister believes that in order to ensure the acceptability of traffic decision-making, it is far from enough to define the form of public participation as propaganda and consultation. Public participation should be actively introduced to educate the public through community or stakeholder social groups so as to make the public realize the importance of participation and truly participate in the decision-making process [
5]. Santos et al. put forward the coordination and cooperation between relevant institutions and decision makers to integrate environment and transportation resources so as to make the development goals of transportation consistent with social development goals [
6]. Gil researched that more and more stakeholders are involved in transportation management issues, and participants’ control ability is gradually enhanced, and their influence is gradually expanded [
7].
Schlag et al. analyzed the stakeholders of urban passenger transport policy considering the environmental impact factors, and put forward the road toll acceptance model, involving passengers, drivers, and management departments, in order to improve the acceptability of urban passenger transport policy [
8]. Rowe established a model of public participation in the research of relevant scholars, through which to evaluate the effect of public participation [
9]. Konisky and others have constructed a framework similar to the Thomas model, which involves participants, expected outcomes, decision-making bodies, and a certain type of public and expected outcomes in the process of participation [
10]. Figueredo establishes a model for evaluating the effectiveness of public participation in urban transport planning by investigating public participation activities in the U.S. Department of Transportation [
11]. Kramer (2008) proposed performance indicators for evaluating the effectiveness of public participation activities at the Center for Urban Transportation Research in Florida [
12]. Susilo et al. (2009) found that fairness and acceptability are two factors that the public believes have a greater impact on the implementation of urban passenger transport policy through interviews and diary surveys in Indonesia [
13].
In recent years, the big data provide more opportunities to better understand travelers’ behavior and the transportation systems [
14,
15,
16,
17,
18]. Social media is an important data source in social transportation research. Research and application of traffic based on social media big data is in the ascendant. Zeng et al. pointed out that social media information can provide traffic warning signals and road condition information prediction [
19]. Wanicbayapong et al. developed a traffic information collection and classification system based on Twitter data [
20]. Endarnoto et al. developed a Twitter traffic information acquisition system and designed an Android mobile software to display traffic information [
21]. D’ Andrea et al. developed a real-time traffic information monitoring system based on Twitter information flow, which can detect traffic information before news websites publish the same information [
22]. Hasan et al. use social media data to analyze traveler activity patterns [
23]. Gu et al. developed a traffic incident detection system based on social media and applied it in two cities [
24]. Kuflik et al. proposed a framework for extracting traffic-related information from social media information [
25]. Rashidi et al. discussed the behavior and challenges of social media data in mining human travel behavior [
26]. These application methods of social media data mostly focus on traffic status and traffic incidents detection, ignoring the text semantic analysis of the collected data. Therefore, it cannot reflect the severity of traffic incidents and public feedback.
Microblog, as a new social media, has been widely accepted by the public, and the amount of data per day has increased explosively. This provides a new research field for natural language processing and a large number of new forms of commentary text. However, as a short text with short length, strong emotion, and a single topic, microblogs need new technical means to understand the contents and tendencies. Sentiment analysis refers to processing and analyzing texts with emotions, which is a frontier research field in natural language processing. Combined with microblogs, a new social media on the Internet, it has important practical value. Content analysis of microblogs can track users’ attention and comment tendency to current hot topics. Through content analysis of comments on hot topics in microblog, it can provide managers with an effective tool to understand people’s feelings and guide public opinion.
3. Methodology
Content analysis is to mine the deep meaning of text. Text is the carrier of the author’s intention. Important information such as opinions and positions expressed by people in the text can be inferred through content analysis. In order to obtain the public’s evaluation of the traffic system and emotional tendency, this paper applies content analysis to the public’s traffic-related comments.
3.1. Data Collection
Data collection is a technique for directionally grabbing structured data from search engines or data sources. Sina microblog has a large number of users, known as the “sensor” of social phenomena, which has an open data platform and more effective information.
With the rapidly development of metro networks, the urban transportations heavily depend on the metro systems in some large cities of China, such as Nanjing [
27,
28]. Particularly, the rapid popularizations of free-floating sharing bicycle systems in recent years, which provide the conveniences of accessing the metro stations, further increase the travel mode shares of metro systems [
29,
30,
31]. Therefore, we take “Nanjing Metro” as the search keyword to filter the relevant microblogs. Web crawler is applied for collecting the content of searched webpages, which includes microblog author, release time, and microblog text. The time range is from January 2014 to April 2018.
3.2. Data Preprocessing
The textual comments obtained are generally large in number and contain a large amount of content that is not related to the subject or with low research value. Therefore, some basic simple preprocessing is required to remove the meaningless information. The main steps of preprocessing include text removal, mechanical compression, and short sentence deletion.
There are a large number of advertising or promotional text on some social platforms, which are published or repeated for many times. In addition, users often choose to repost relevant text to express their own opinions, which causes repetition in content. Useless text is required to be deleted before next step.
3.3. Chinese Word Segmentation
Chinese word segmentation refers to dividing a Chinese text into individual words due to no spaces as separators in Chinese writing.
If the frequency between adjacent words is high, the greater the probability that the system will recognize it as a word. The principle of word segmentation algorithm based on statistical learning is to use adjacent probability of occurrence to reflect the credibility and accuracy of discriminating it as a word.
There are many functional words that have no practical meaning in text writing, which are called “stop words” in content analysis. According to Internet resources, we obtain a complete stop words list, which needs to put the keywords used for searching microblogs.
3.4. Text Categorization
Text categorization is defined as the categorization of several texts into two or more categories according to requirements or predetermined rules. Text categorization is an important application of supervised learning in machine learning. This paper adopts support vector machine (SVM) classification algorithm to implement text categorization. The basic principle is to find an optimal decision plane so that it can segment two classified data points with the best effect, which is the most recognized text classification method at present.
The feature selection method used in this paper is TF-IDF algorithm. TF refers to word frequency and IDF refers to inverse document frequency, which is given as follows:
where the numerator is the number of occurrences of the word in the file and the denominator is the sum of the occurrences of all words in the file. Inverse document frequency is a measure of the universality and importance of a word, which is defined as follows:
where
is the total number of files in the corpus, and then the denominator is the number of documents containing the word. In general, we add 1 to denominator to avoid it equaling zero. Then, we calculate the product of TF and IDF. TF-IDF tends to filter out common words and retain important words.
3.5. LDA Topic Model
Latent Dirichlet allocation (LDA) topic model was proposed by David Blei, Andrew Ng, and Michael I. Jordan [
32]. It is also known as the three-layer Bayesian probability model: A three-layer structure of vocabulary, topic, and text. LDA topic model has excellent dimension reduction ability, which can reduce the original high-dimensional word space to a small topic space composed of a group of topics. For short text like microblogs, words in the text are very limited. The probability of the same word in two different short texts is low. It is difficult to accurately calculate the similarity between texts by using the traditional vector representation method characterized by words or phrases. For microblog text with poor standardization of language and a large number of new vocabularies, a topic model such as LDA is more suitable for accurate calculation in the uncertain environment.
We suppose the vocabulary size is M. An M-dimensional vector w = (1, 0, 0, ⋯, 0, 0) represents a word. The text is represented as a set of N words d = (, , ⋯, ). Then, the comments set D consists of L comments: D = (, , ⋯, ). There are K topics in L comments, expressed as (1, 2, ⋯, K)
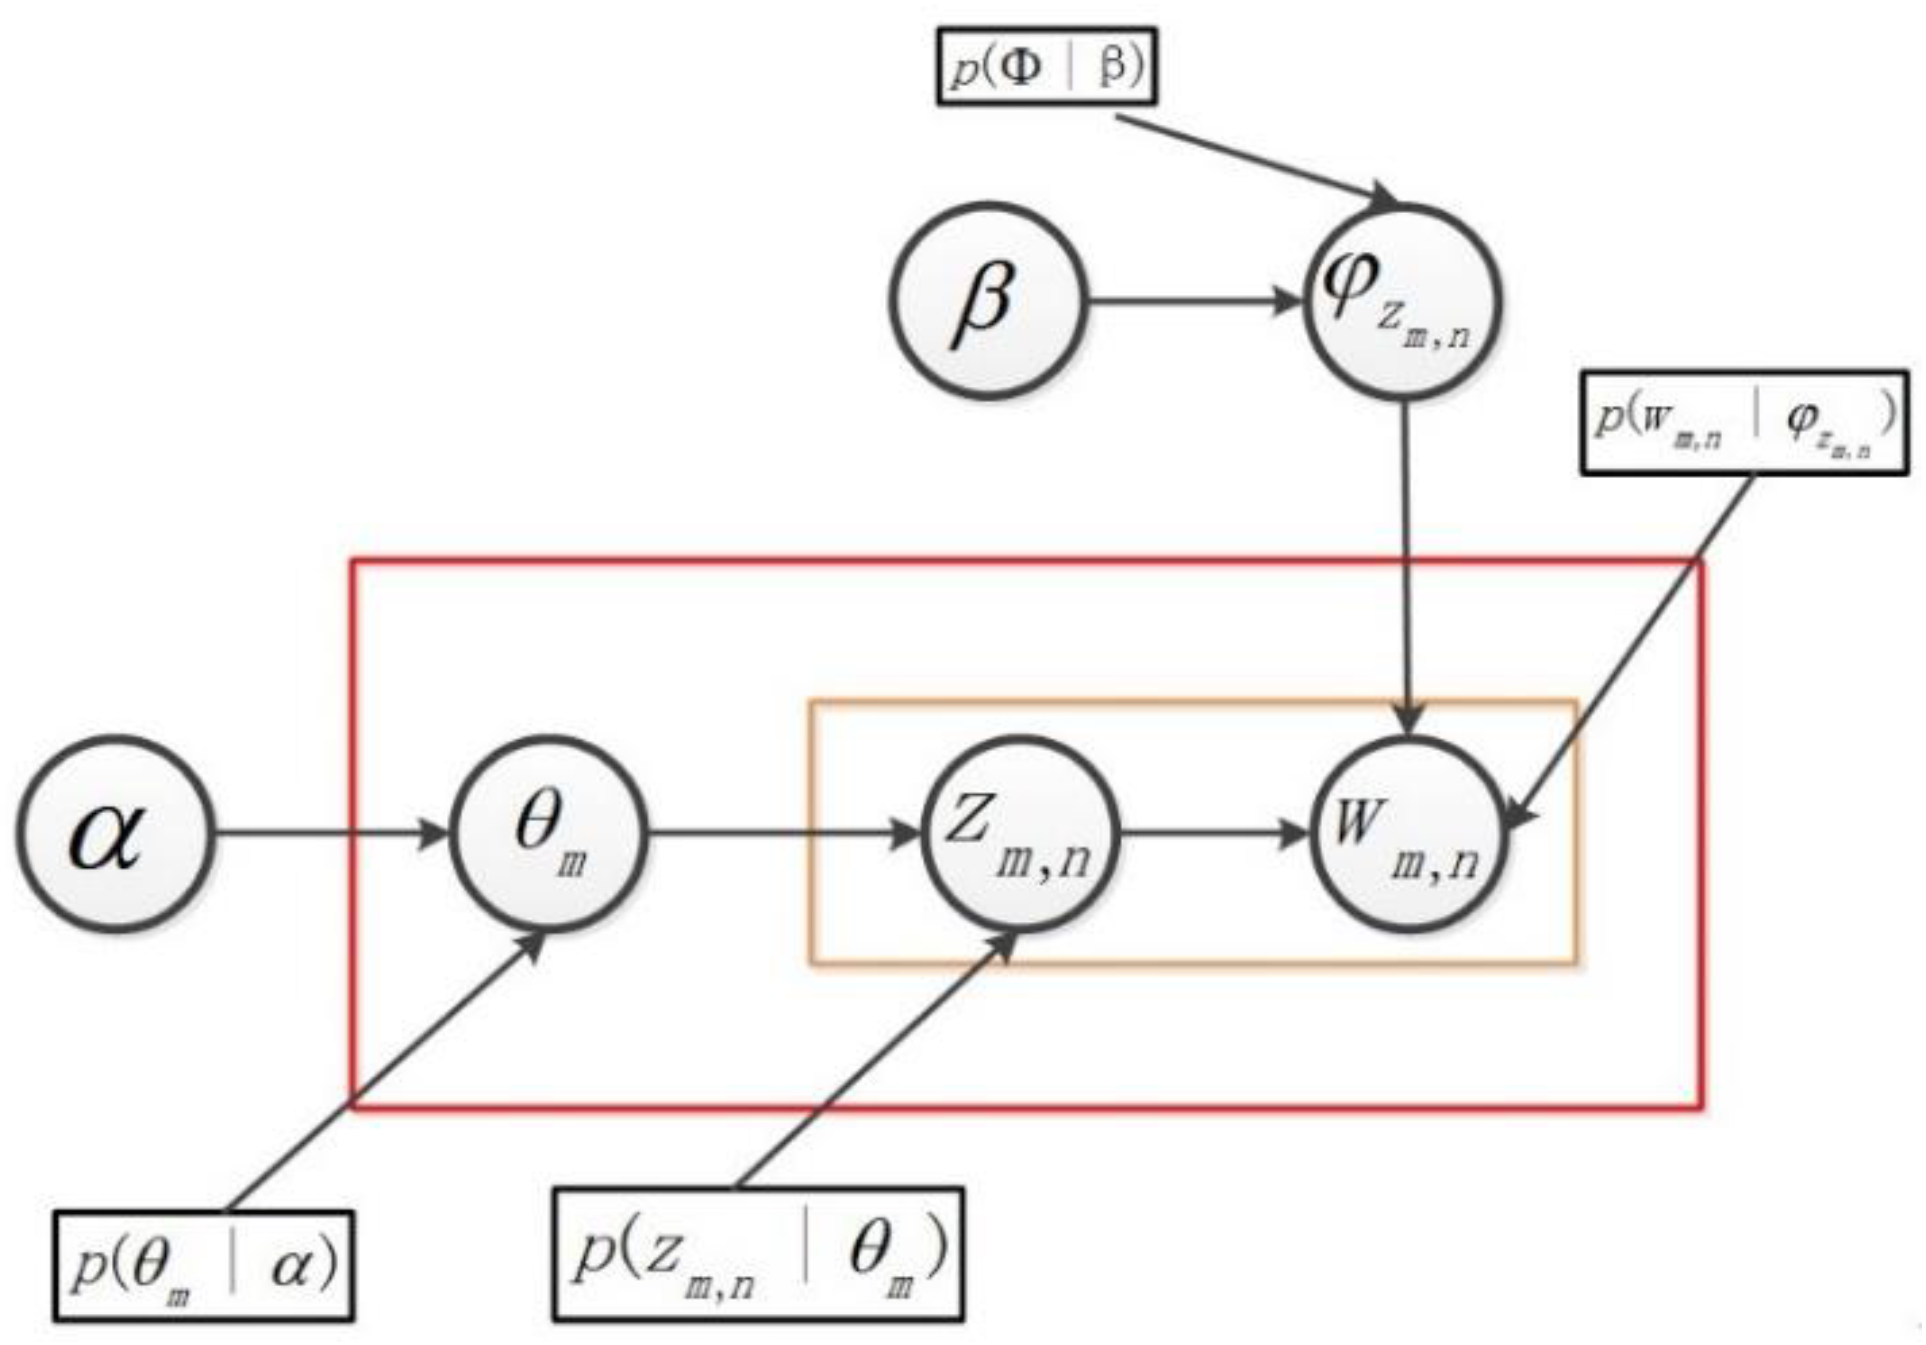
The LDA theme model is shown in
Figure 2, where α and β are priori parameters of the Dirichlet distribution. θ is the multi-distribution parameter of the subject in the document, obeying the Dirichlet prior distribution of the hyper parameter α. φ is the multiple distribution parameter of the word in the subject, obeying the Dirichlet prior distribution of the hyper parameter β.
LDA topic model assumes that each text is randomly combined in a specific proportion by its potential individual topics. The proportion of the composition obeys the polynomial distribution:
Each theme is randomly combined with the vocabulary in the word bag according to a specific ratio. The proportion of the composition is also subject to polynomial distribution:
Thus, the probability of generating the word
with the comment
can be expressed as:
where
indicates the probability that the word
belongs to the
topic and
indicates the probability of the
topic in the comment
.
Approximate estimation of the parameters
θ and
ϕ in the model is required while establishing LDA topic model. The parameter of the polynomial distribution of the word
in the subject
is
. The multi-distribution parameter of the topic
in the comment
is
. The estimated formulas are as follows:
where
represents the number of occurrences of the word
in the topic
and
represents the number of topics
included in the comment
.
4. Data Analysis and Results
In this section, we set Nanjing metro system as the research object and apply the method above to collect and analyze social media information in order to obtain public opinions for the metro system and summarize the spatiotemporal properties.
4.1. Classification Results
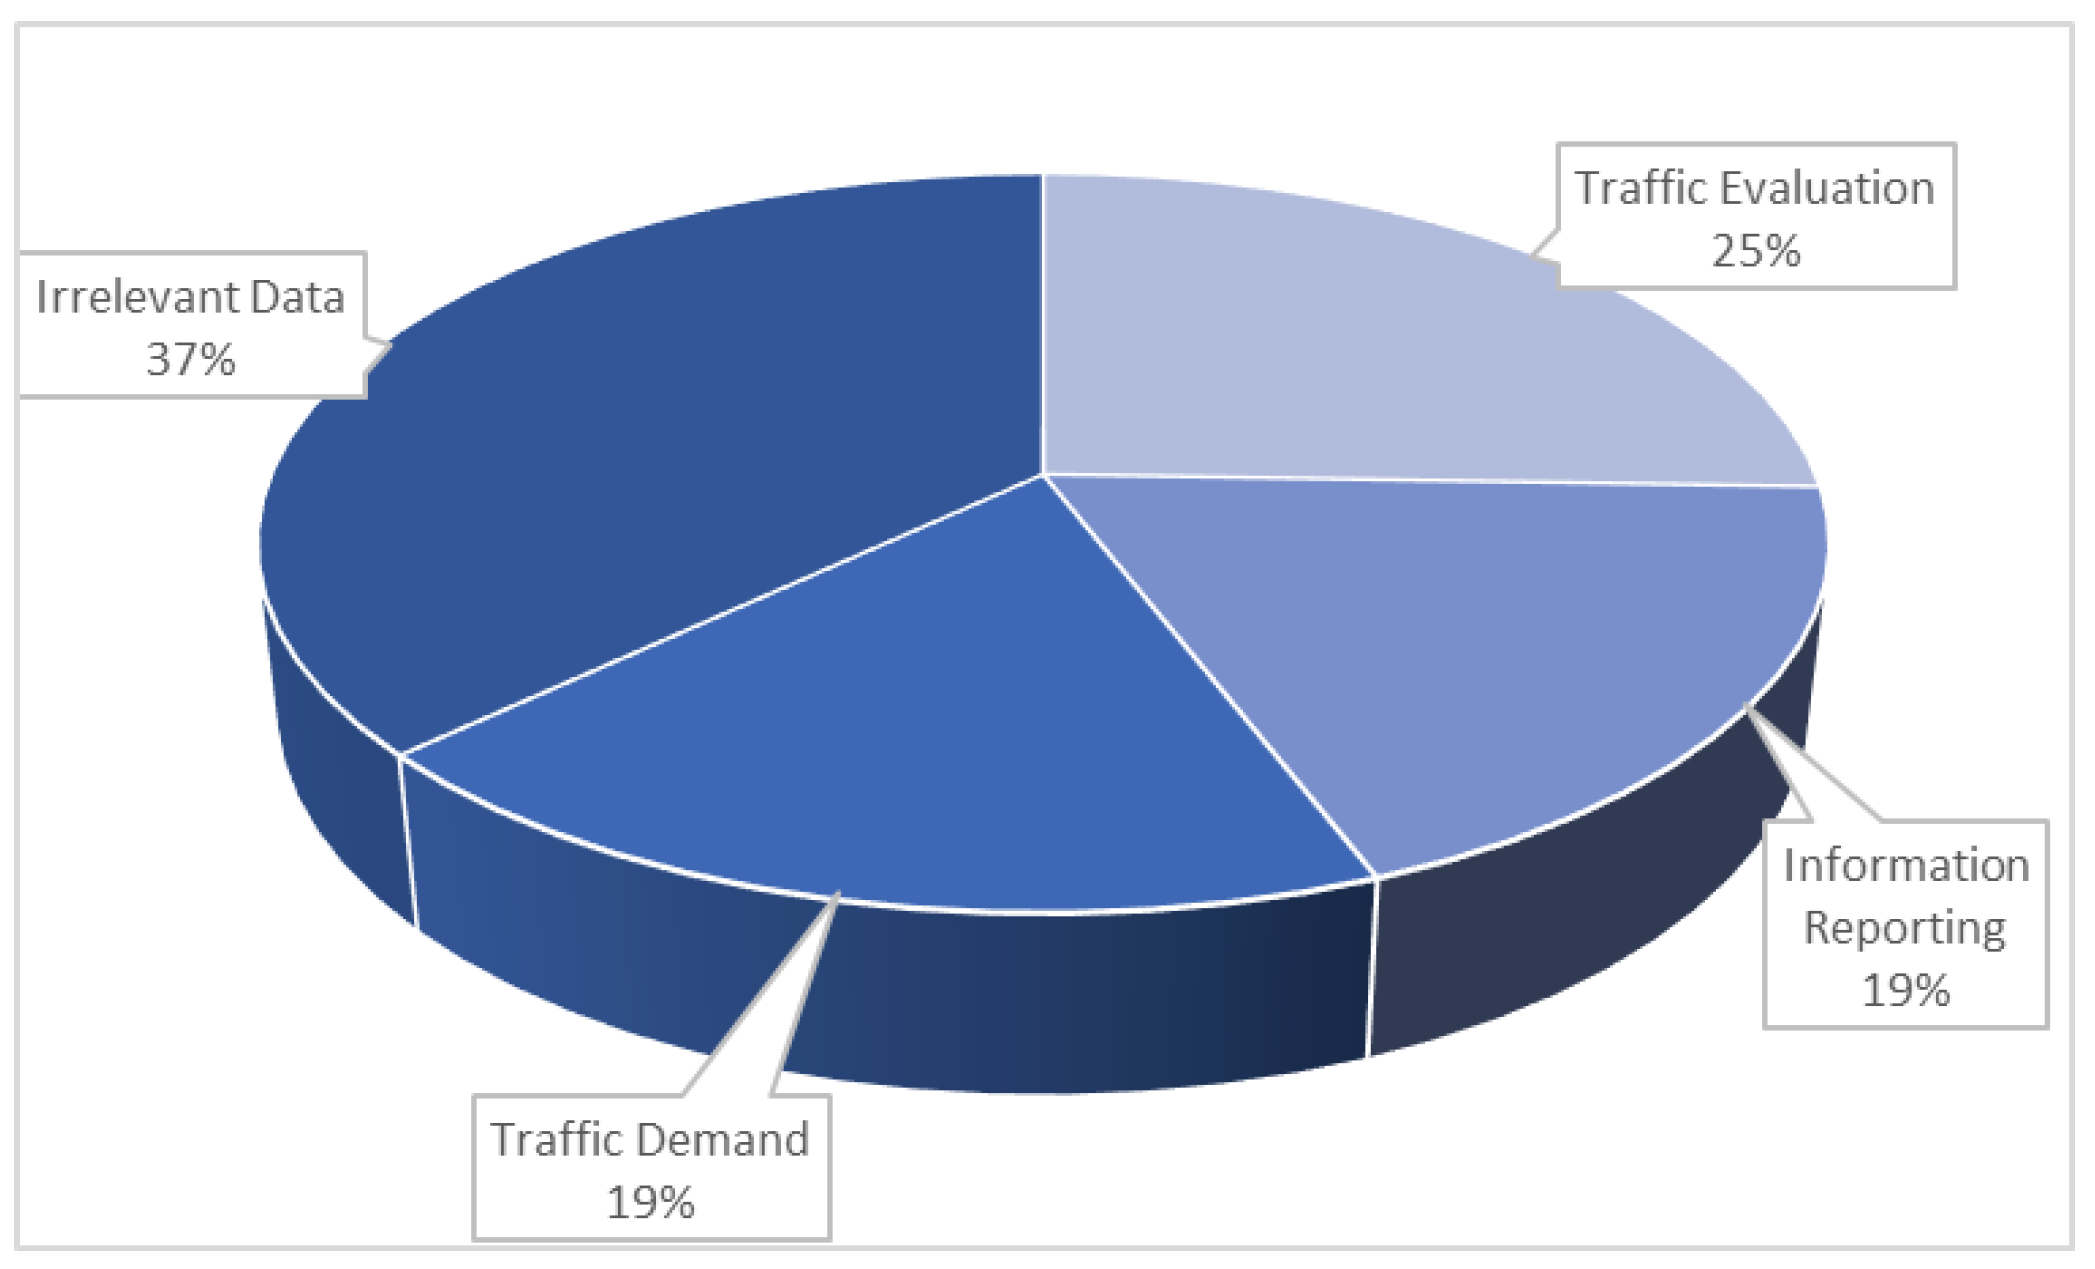
After data collection and basic preprocessing, LibSVM is used to classify all text data. Among the total of 50,970 pieces of data extracted, traffic evaluation accounts for 13,021 (25.5%), information reporting accounts for 9501 (18.6%), traffic demand accounts for 9557 (18.8%), and irrelevant data accounts for 18,891 (37.1%). The proportion of each of the categories is shown in the
Figure 3.
4.2. Sentiment Analysis
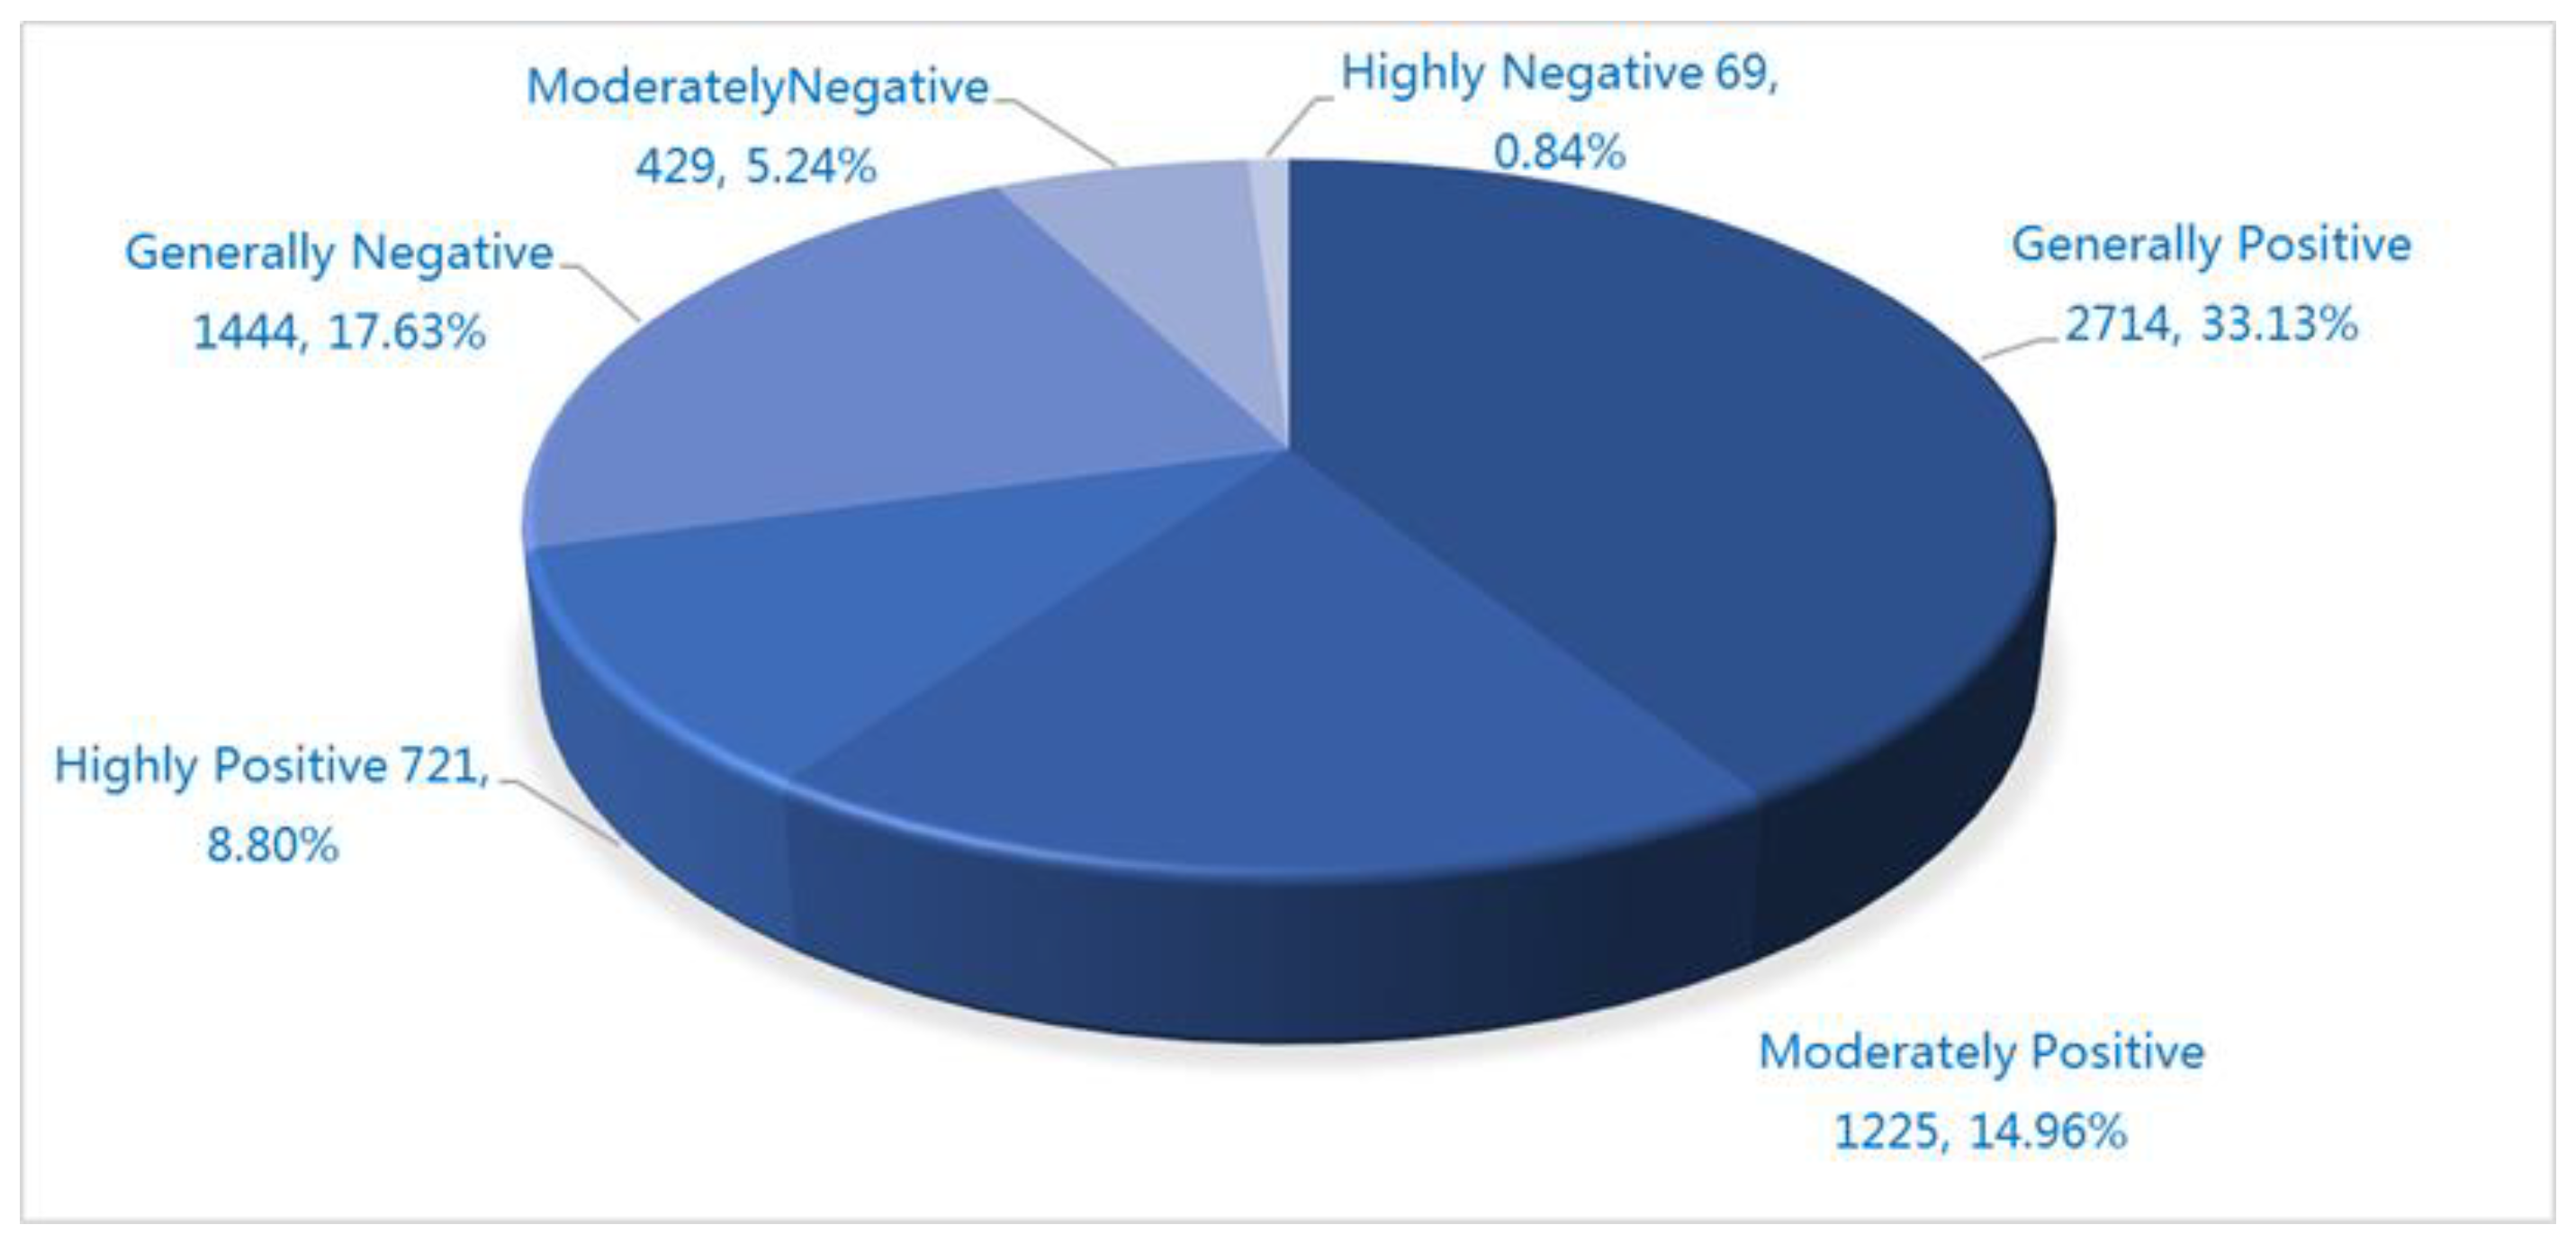
For the traffic evaluation text classified above, we use ROST Content Mining System Version 6.0 (ROSTCM 6) for sentiment analysis. Through sentiment analysis, positive emotions accounts for 4660 (56.89%), neutral emotions accounts for 1468 (17.92%), and negative emotions accounts for 2063 (25.19%). The detailed statistical results are shown in
Figure 4.
4.3. LDA Topic Model Analysis
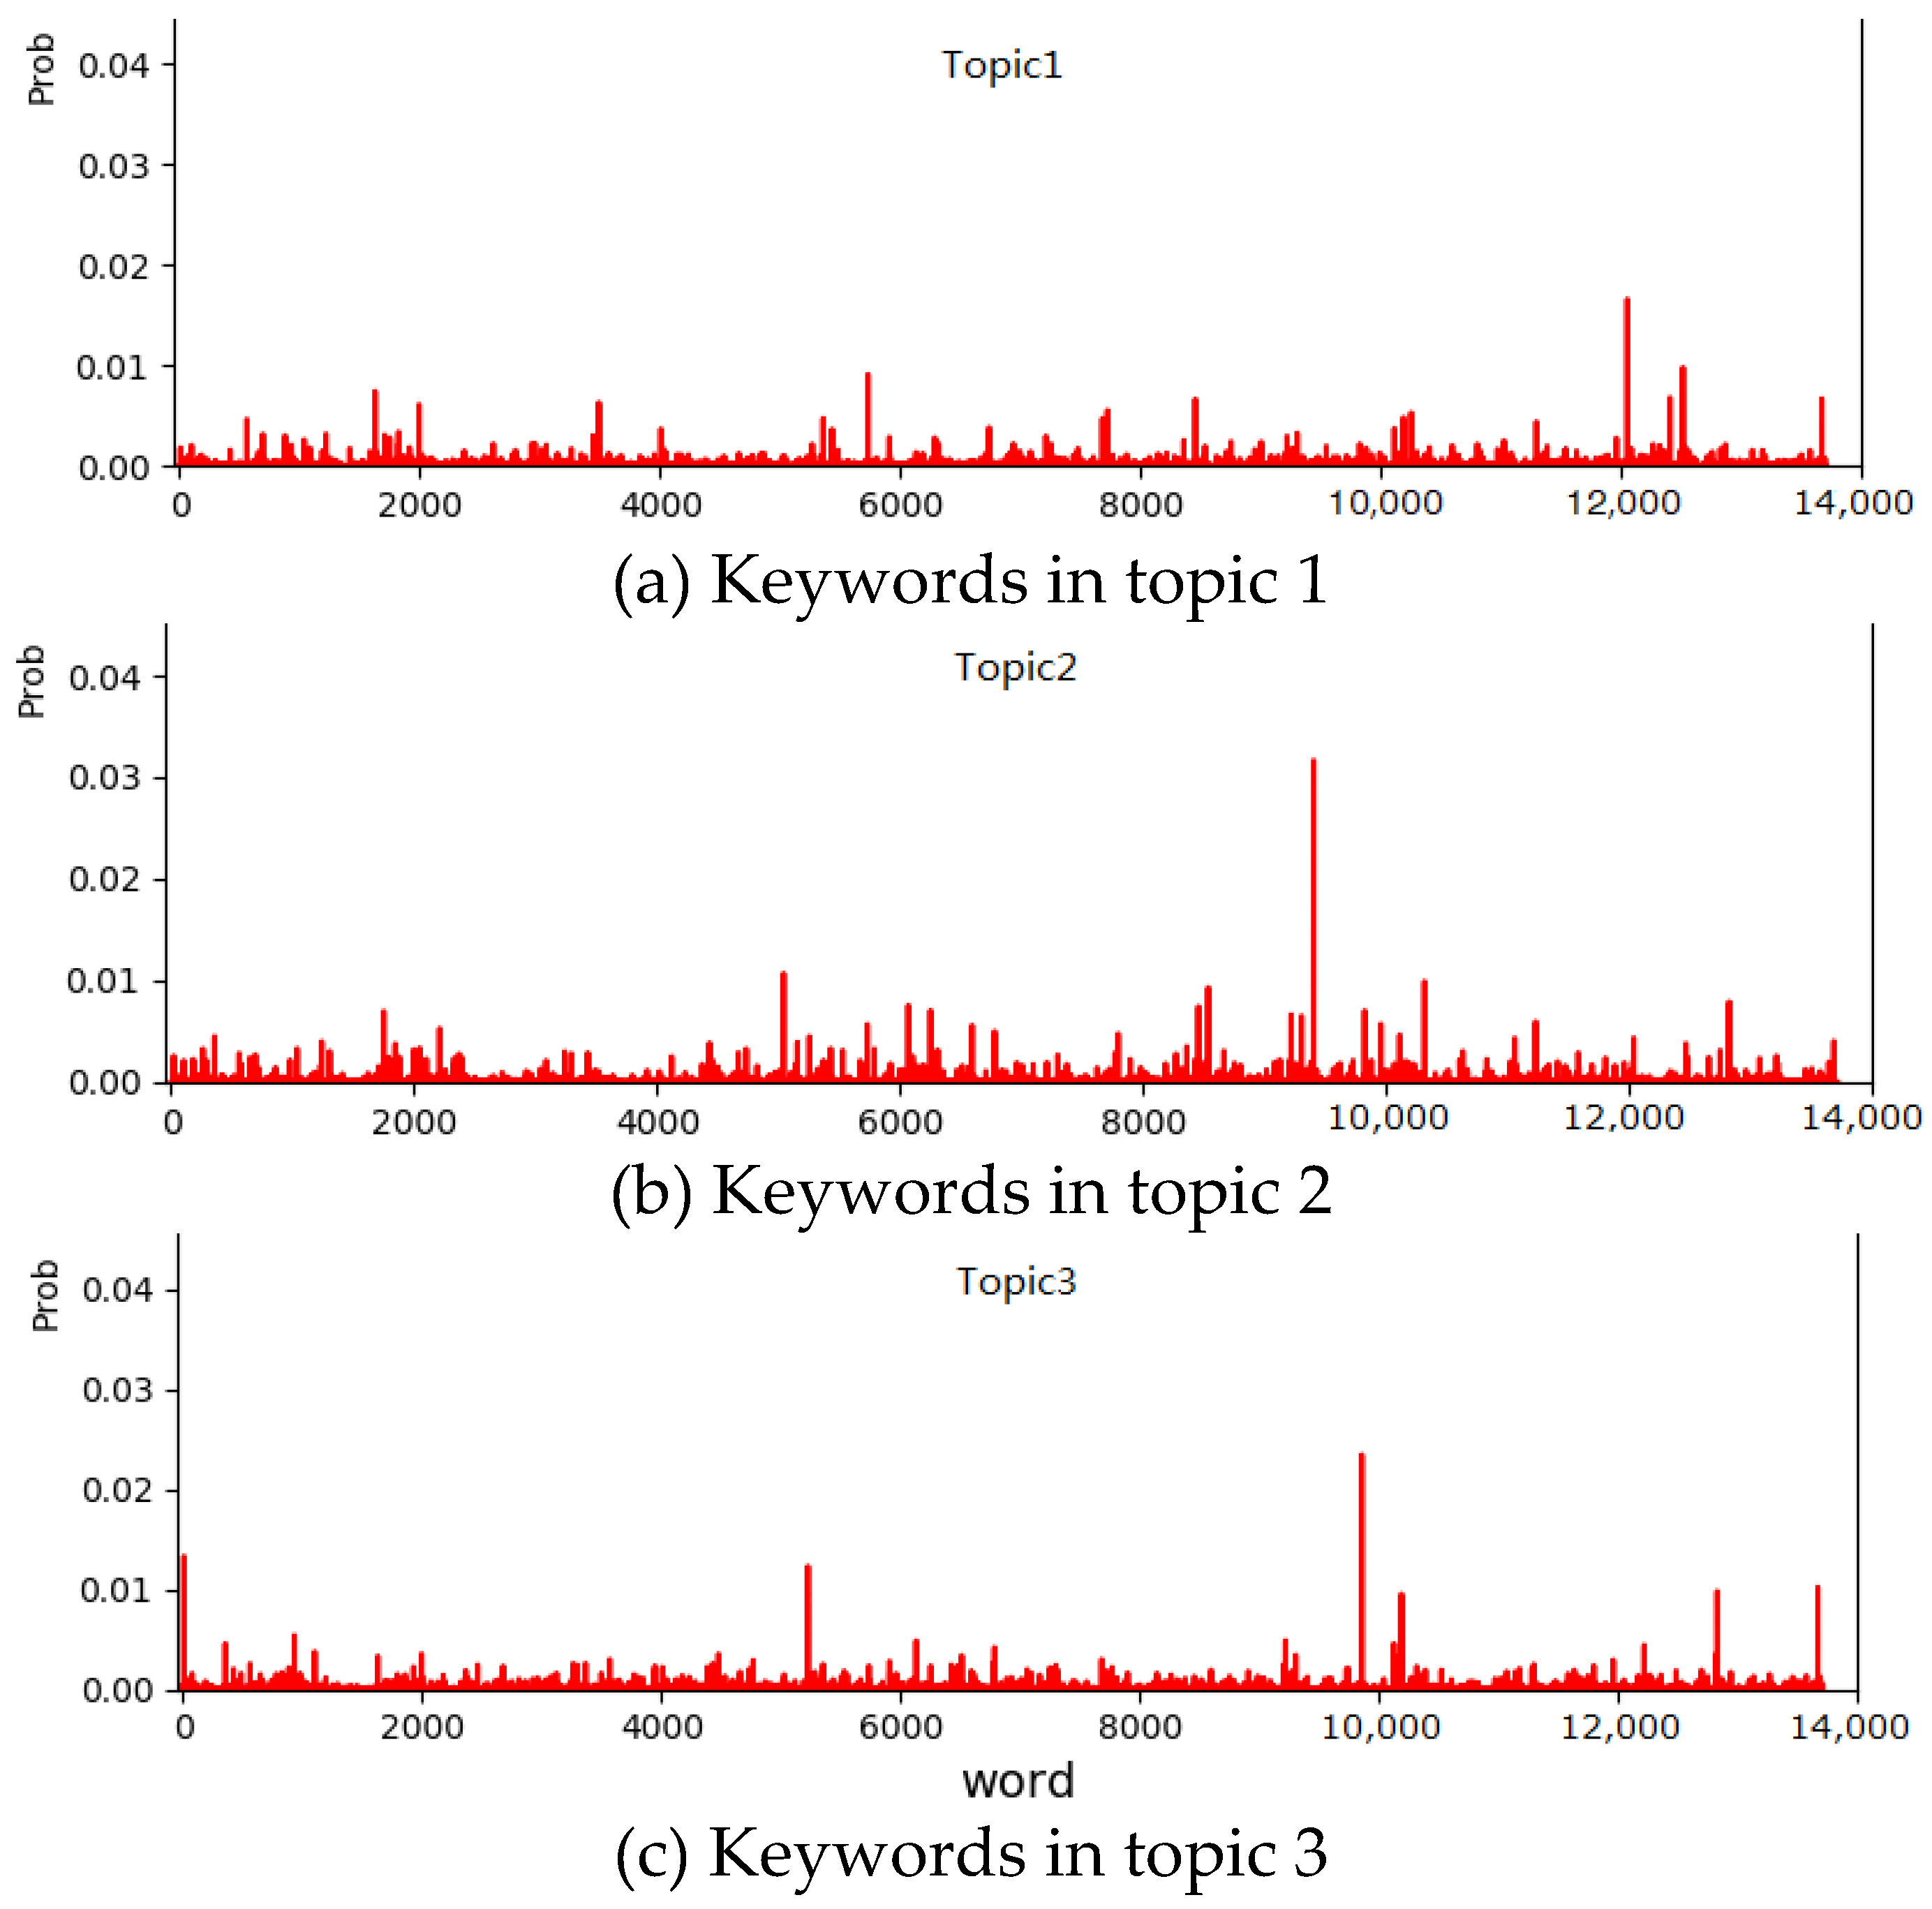
LDA topic analysis of positive and negative comments on Nanjing metro is conducted, respectively. When building the model, we take the following values for the parameters of the model: Dirichlet prior parameters take empirical values, respectively α = 50⁄K, β = 0.1. The text is clustered into 3 topics, while 10 words with the highest probability of occurrence and their probabilities are output as results.
Table 1 shows the potential topics of public opinions on Nanjing metro.
Table 2 shows the potential topics of negative opinions.
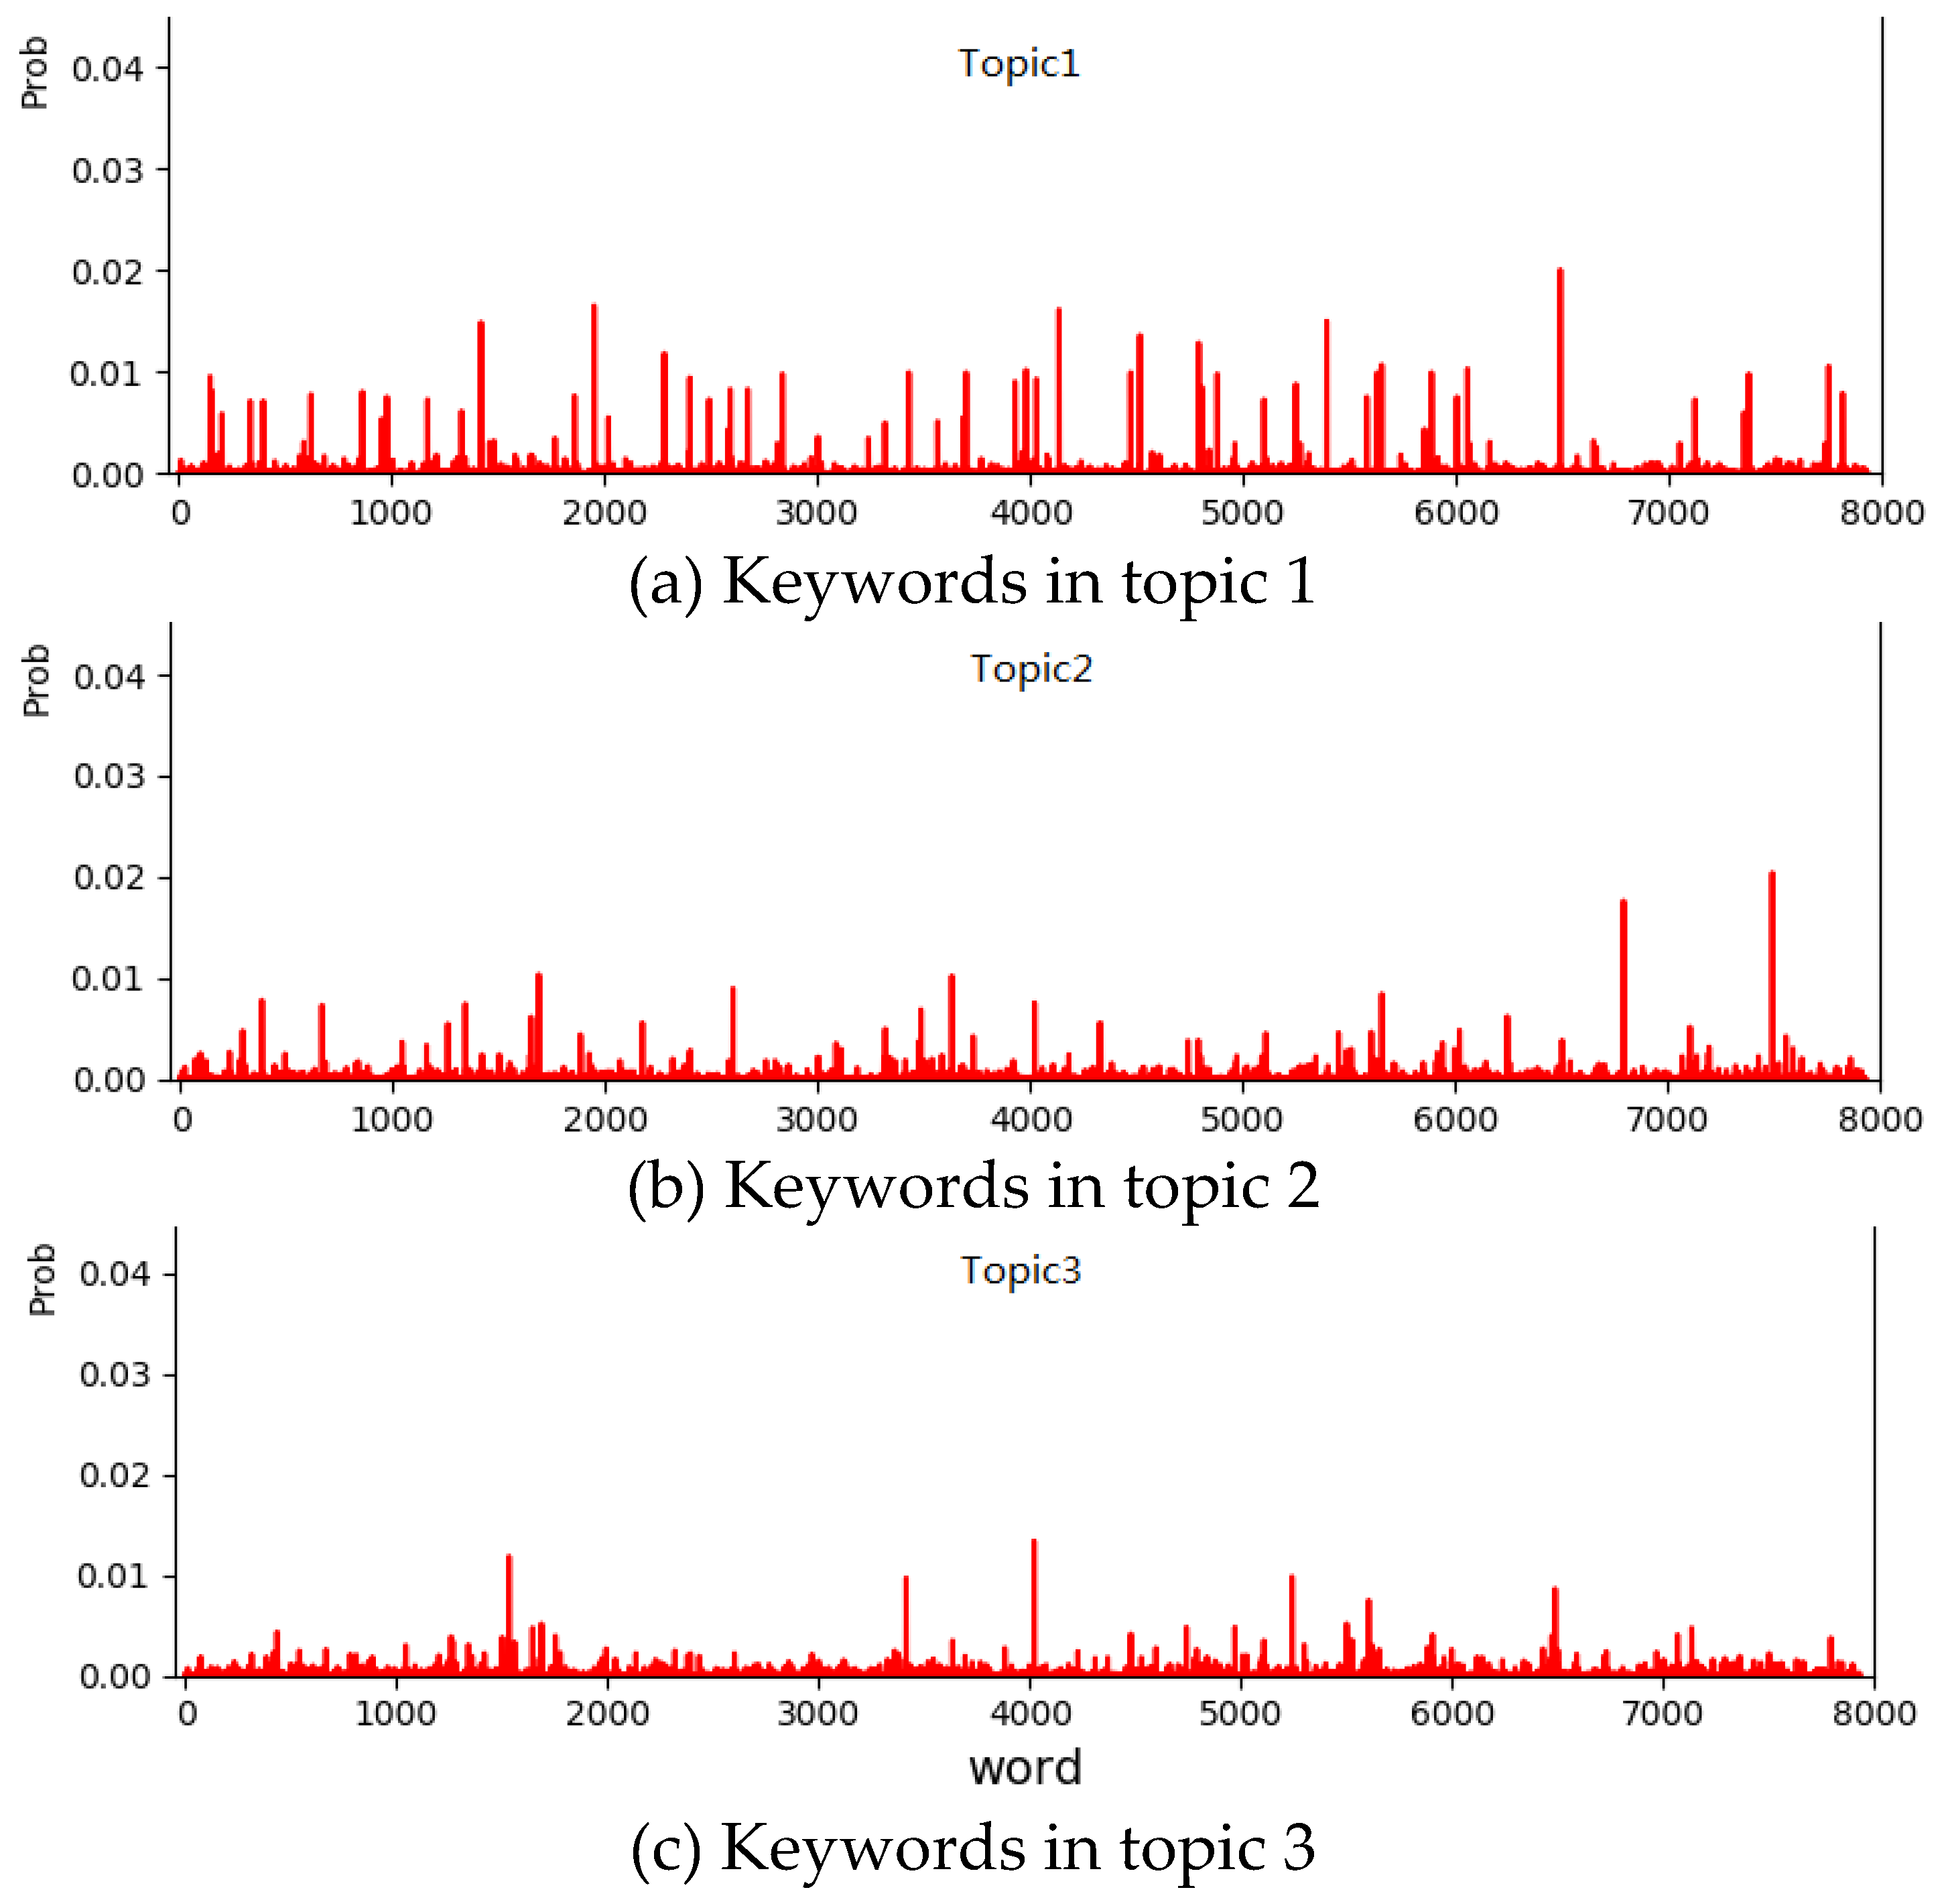
From the potential topics of positive comments, the high-frequency words in Topic 1 mainly reflect the situation that there are more seats in the subway when the subway is not crowded, and the cabin is carriage. Topic 2 mainly shows the public’s eager expectation and concern for the construction and opening of new metro lines. Topic 3 shows that Nanjing metro is convenient. Cultural atmosphere is good and passengers’ quality is high. From the potential topics of negative comments, the high-frequency words in Topic 1 show the inconvenience and troubles for passengers facing a subway operation failure and concerns about trip delays. For example, the faults of line 1 is more serious. Topic 2 shows the ideas of air conditioning in metro carriages. Topic 3 shows the exposure to uncivilized behavior in the carriages, such as eating or drinking something. The modeling results of positive and negative comments are shown in
Figure 5 and
Figure 6, respectively. The two graphs show the probability distribution of words under three topics. Ten words with the highest probability of occurrence are shown in
Table 1 and
Table 2 above.
4.4. Spatiotemporal Properties
4.4.1. Temporal Distribution of Text Data
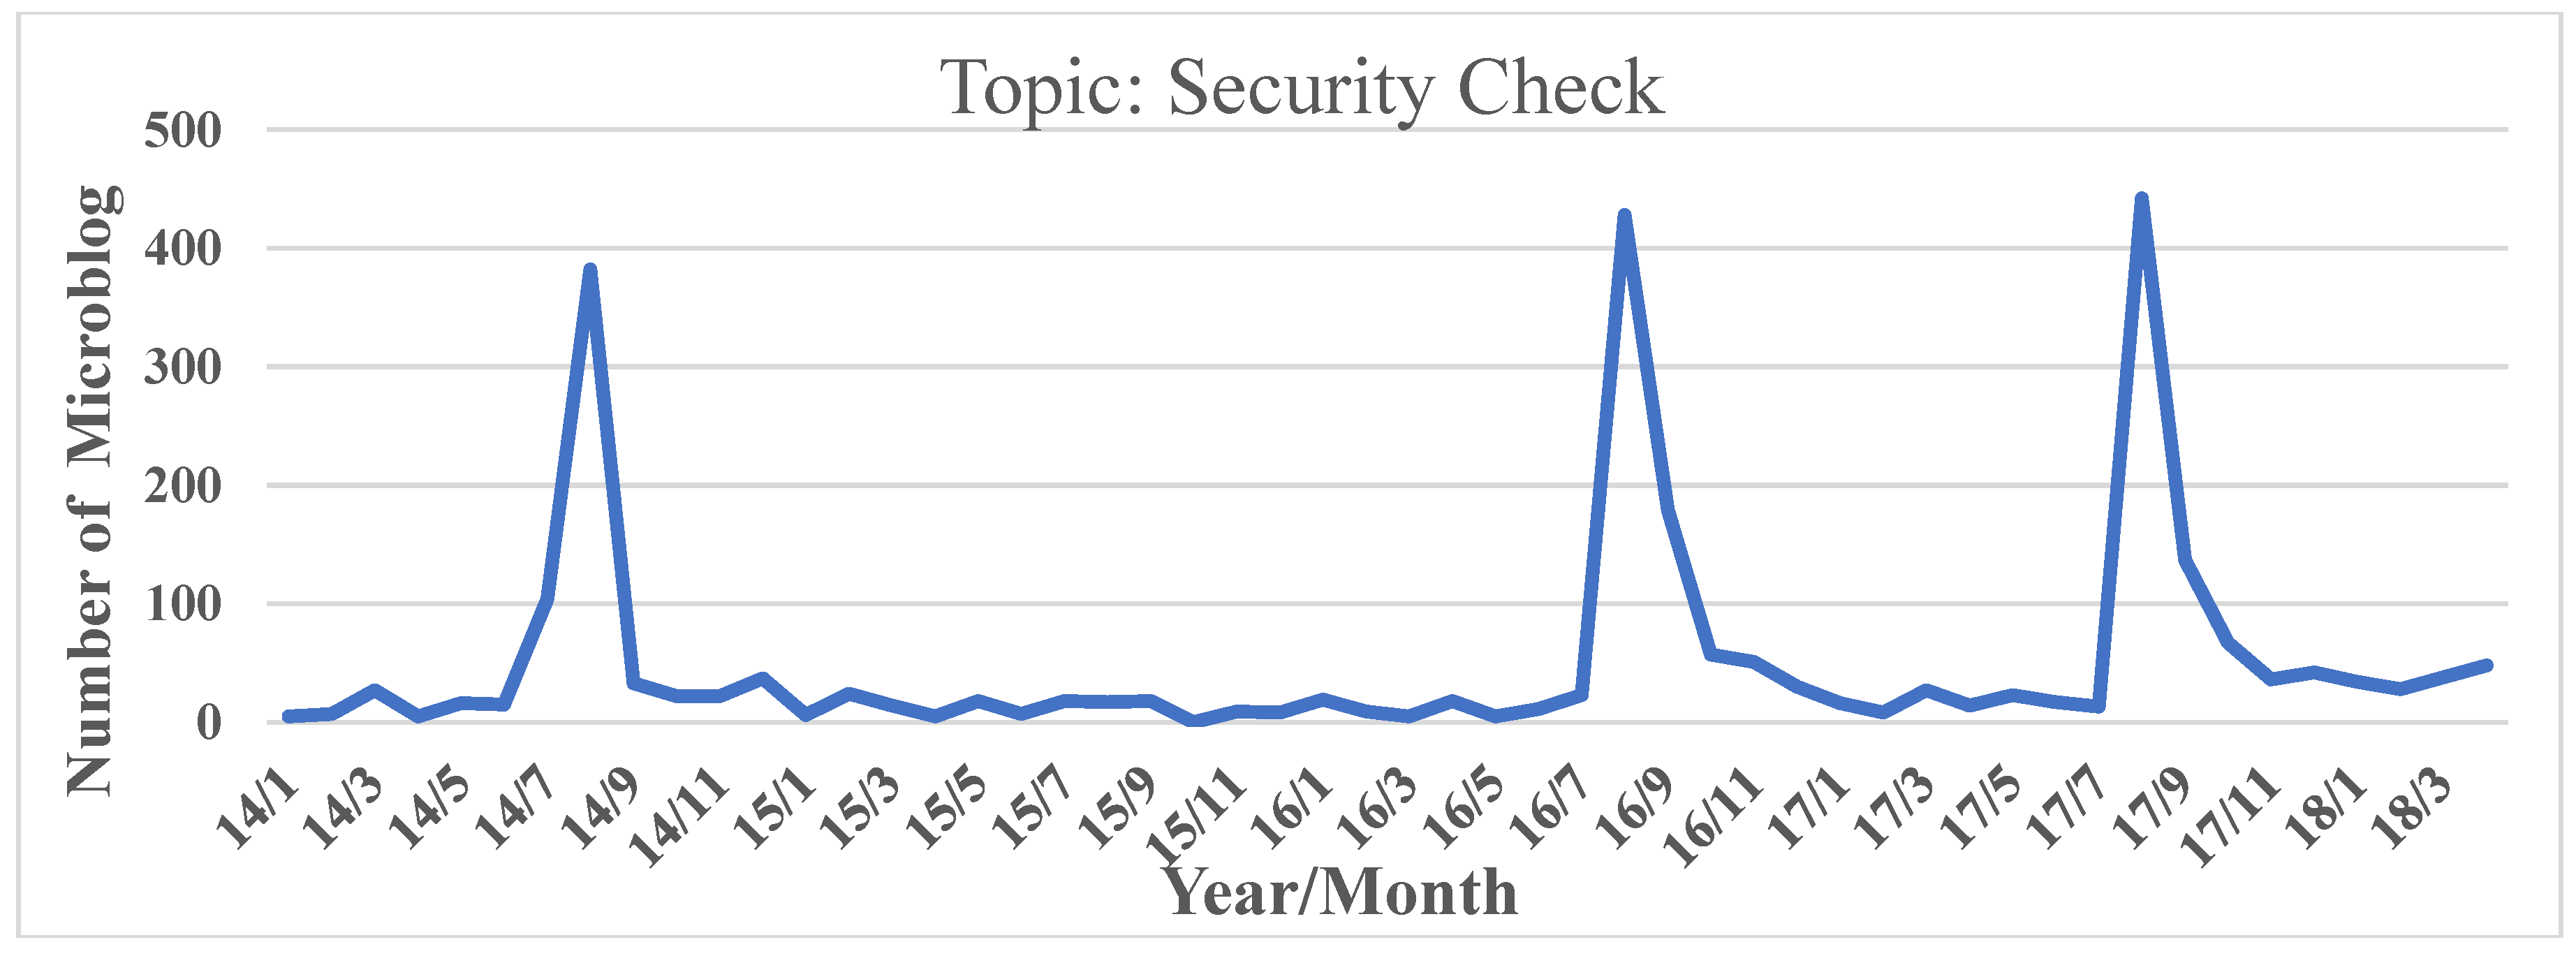
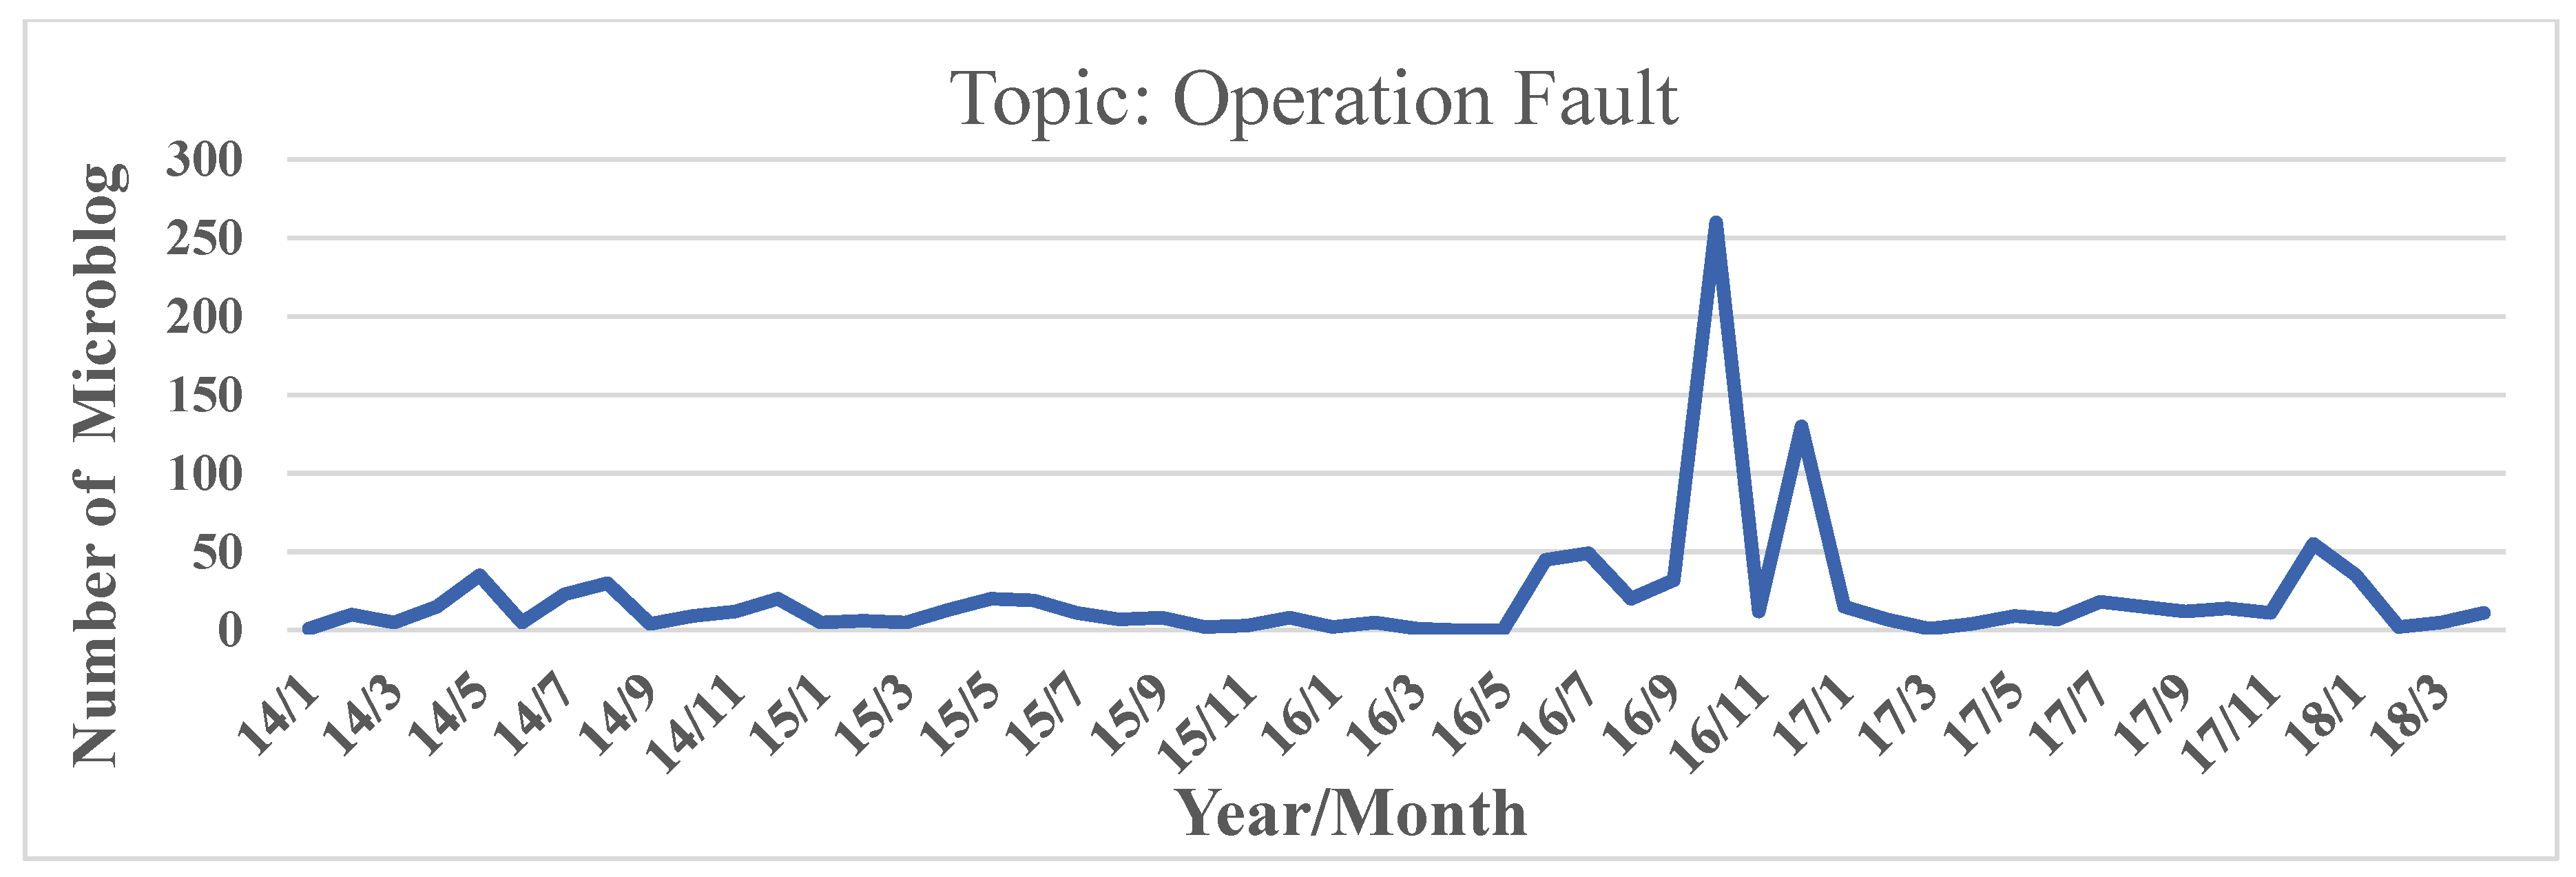
According to the keywords obtained from above analysis, we select two hot topics of high public discussion as research objects: Metro security check and metro operation faults. We add time sequence labels for them and the topic attention degree changing with time is shown in
Figure 7 and
Figure 8.
According to
Figure 7, the discussion on the topic metro security check peaked in August 2014, August 2016, and August 2017. Nanjing metro and Nanjing Public Security Bureau executed security checks for all lines during the Youth Olympic Games in 2014, 1 September 2016, and 21 August 2017, which led to a public discussion of security check and the impact.
Figure 8 shows that when faults occur, public often chooses to post an instant blog on social platforms such as Sina Microblog.
4.4.2. Spatial Properties
We count the numbers, dates, and locations of the metro line faults during the study period, as shown in
Table 3.
After screening the comment text related to “security check” and “operation fault”, LDA topic model analysis is carried out through the above process, and the text is clustered into two topics. The keywords and their probabilities under each topic are shown in
Table 4 and
Table 5.
From
Table 4, the high-frequency words in Topic 1 mainly reflect the public’s strong discussion on the news report: In Nanjing metro, a famous-brand bag can be exempted from security checker. After the news was issued, Nanjing Metro Department responded to it, saying that security checks will strictly implement the policy of “every Bag must be checked”. Regardless of brand, all bags should be subjected to security checks consciously, and it will not be treated differently because of its high price. The high-frequency words in Topic 2 mainly reflect the specific impact on public travel after the implementation of security checks on the whole lines of subway, such as too long of a wait for security inspection in queues travel time during rush hours being too long, etc. However, most of the public still express their understanding and active cooperation on the security check policy.
As can be seen from
Table 5, Topic 1 mainly reflects the equipment failure problems encountered by the public, such as complaints about air-conditioning failure in carriages or not being opened, damage of elevators and recharging machines for Metro cards. The high-frequency words in Topic 2 mainly reflect that passengers are blocked from traveling and late for work due to the malfunction of Metro operation, and also reflect that Nanjing Metro is prone to malfunction under the influence of bad weather such as rain, which needs the attention of relevant departments.
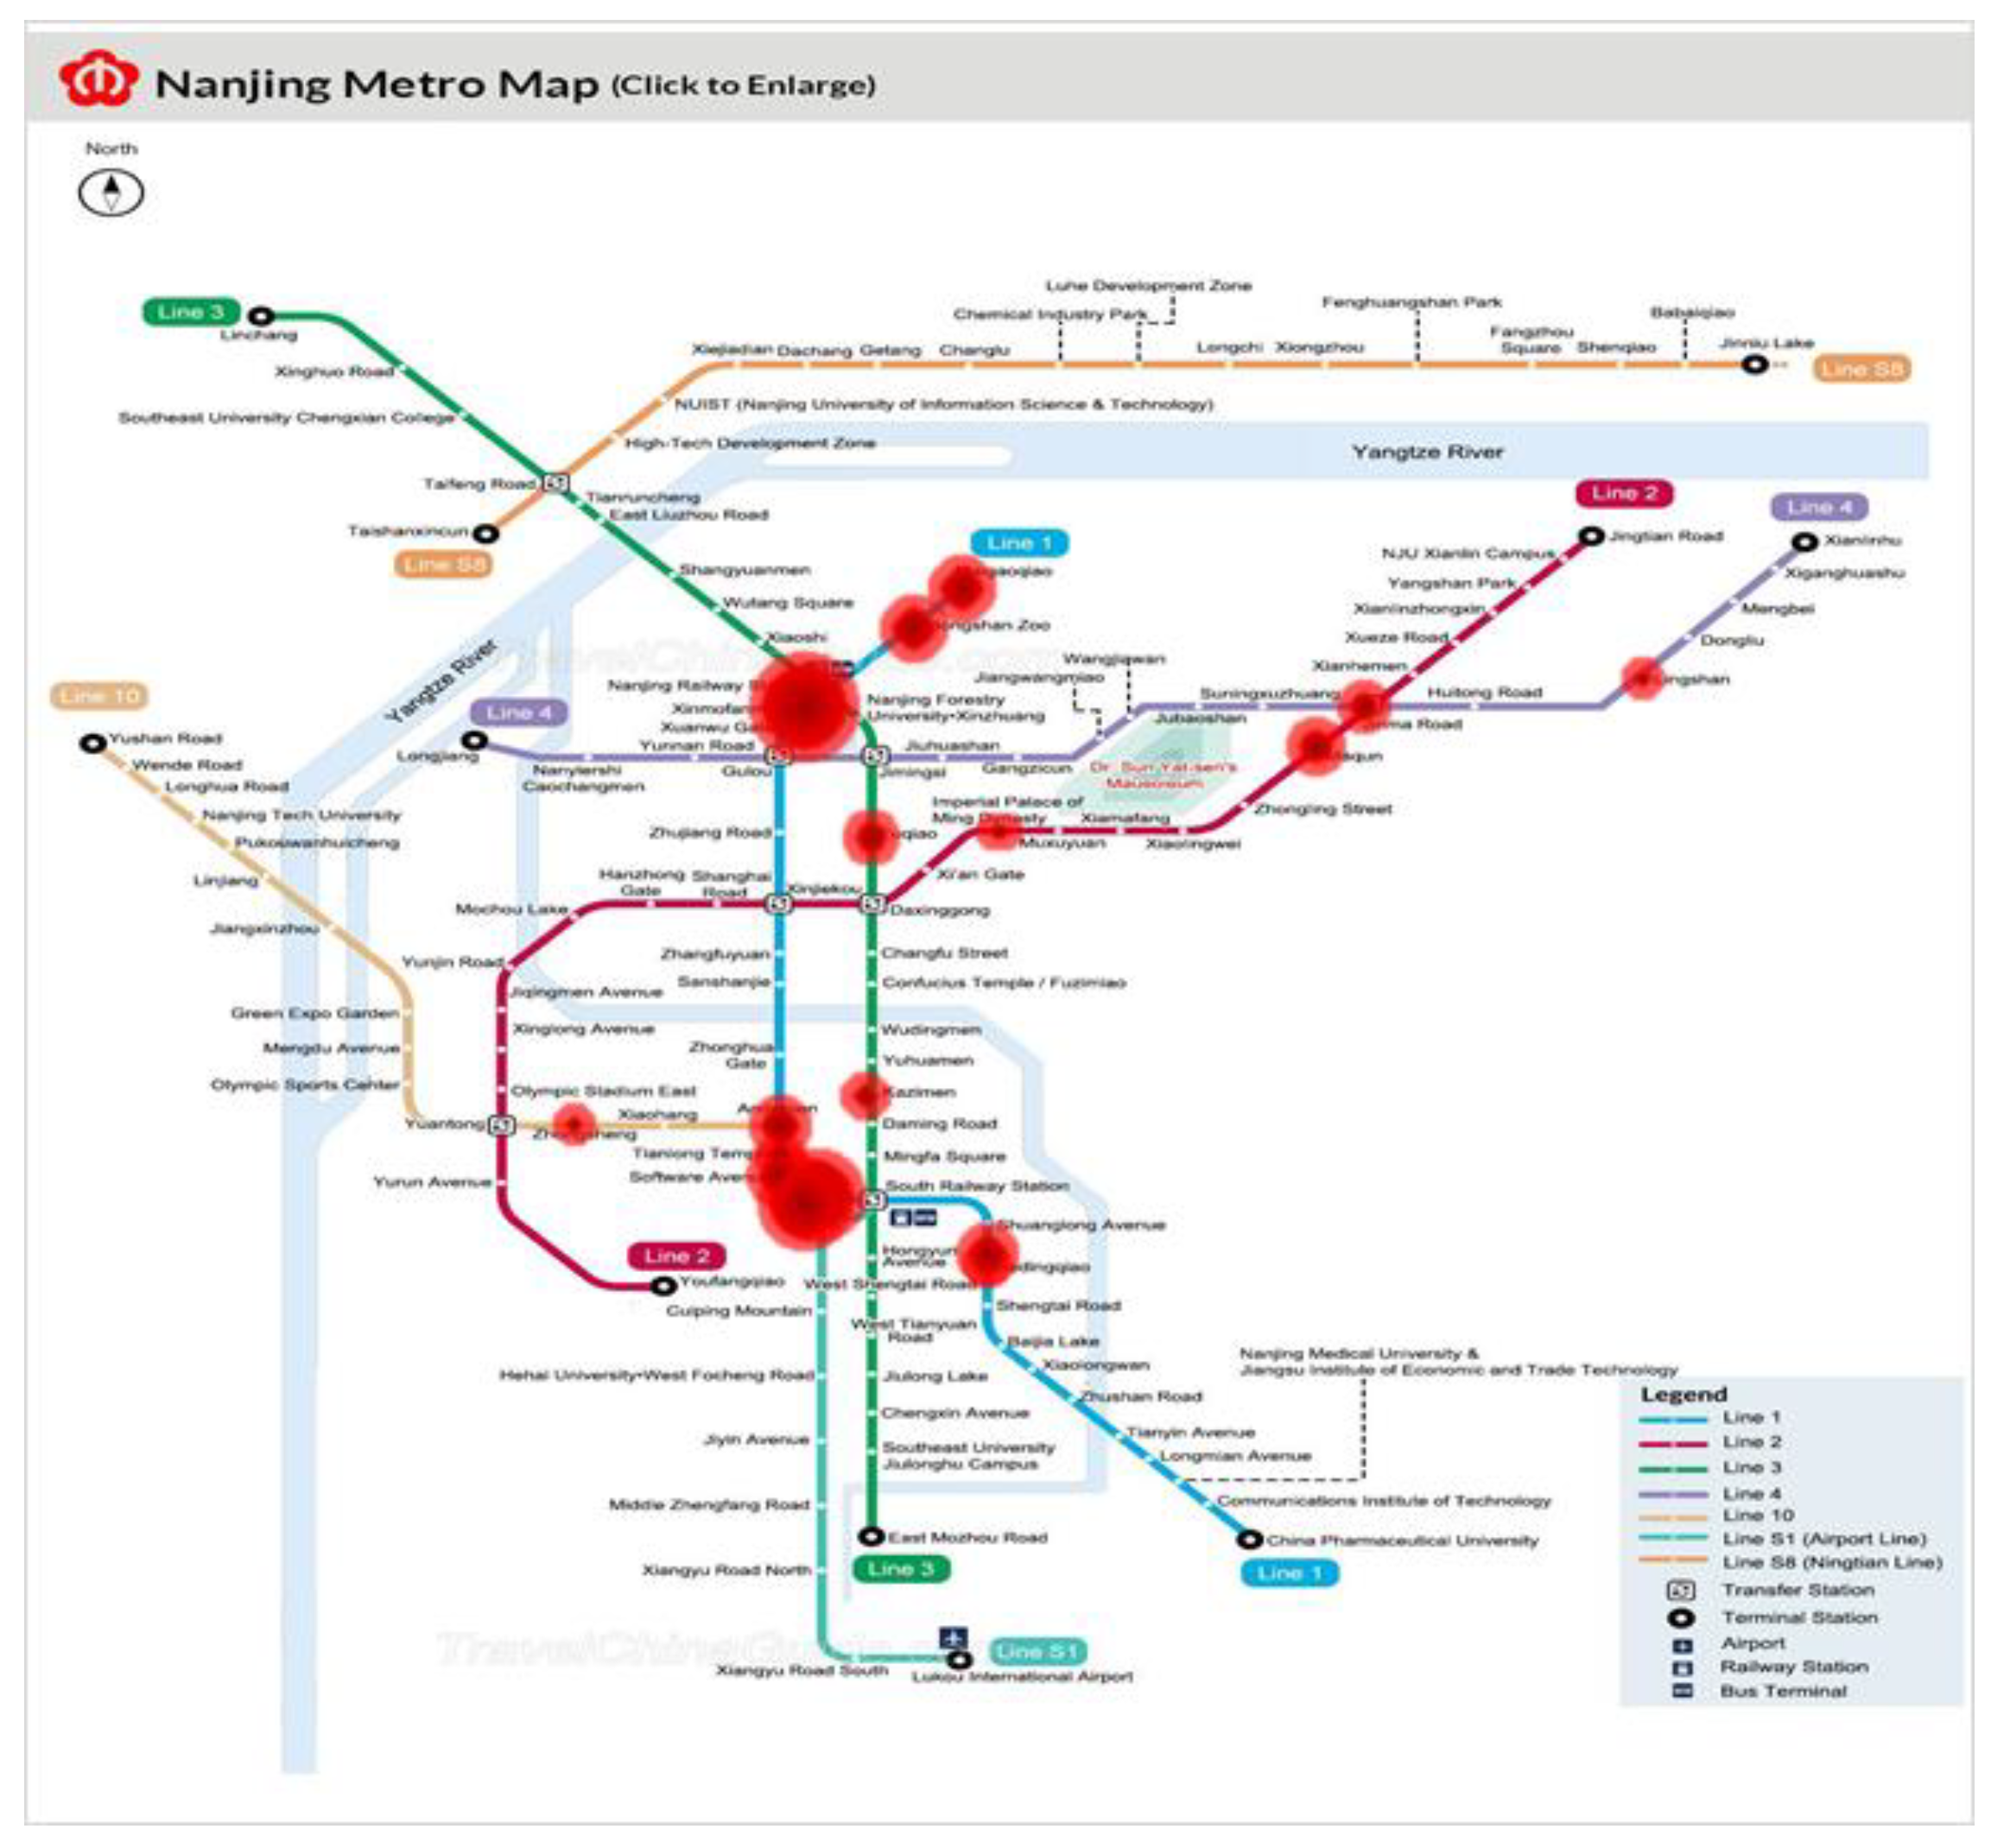
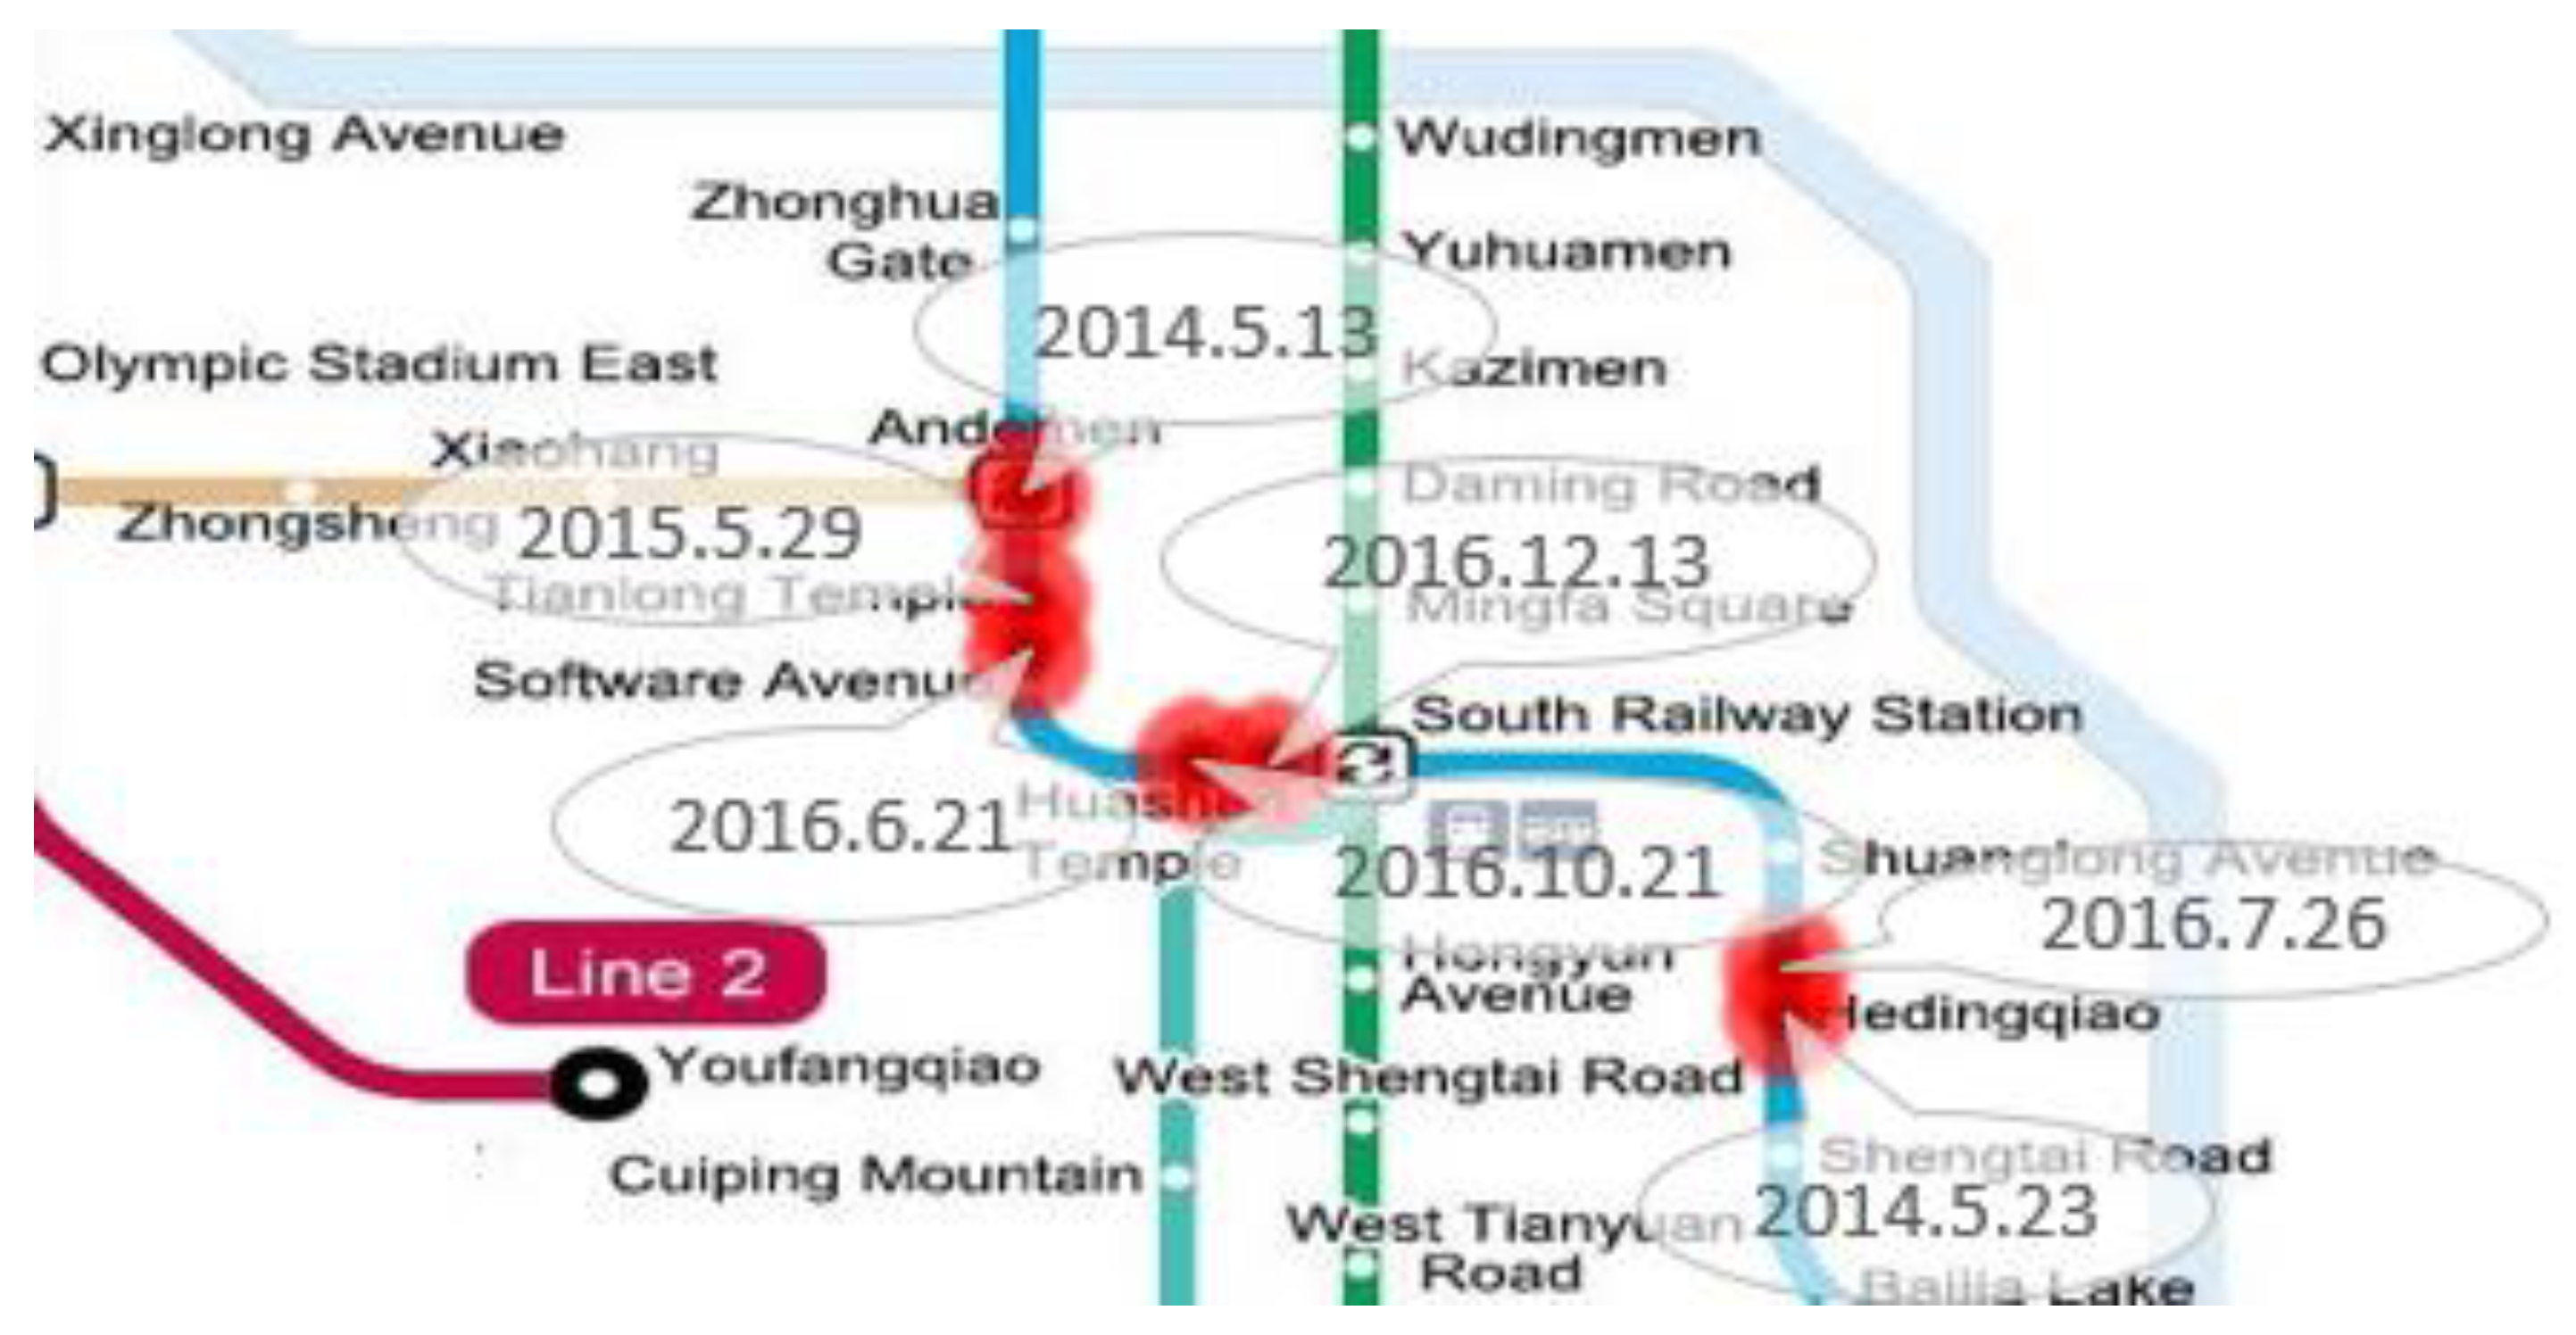
We filter relevant microblogs for metro operation faults above. We use the names of metro stations to determine the location of fault and measure the severity of the fault with the number of microblogs generated by public, which is shown in
Figure 9.
The location of the bubble in the figure indicates the location of the accidents mentioned in microblogs. The bubble size indicates the number of related microblogs. From the figure, the number of faults in metro line 1 is more intensive. We enlarge the image of the relevant area to
Figure 10 and add the time labels. It is known that there are many accidents in metro line 1 from Andemen Station to Hedingqiao Station, which has affected the trip of public and caused unsafe incidents such as confusion and panic.
5. Conclusions and Discussion
Based on the results of model analysis and spatiotemporal properties above, the public opinions on the improvement of Nanjing metro system are summarized as follows:
(1) Metro operation management
In the case of severe congestion in the morning and evening rush hours, try to apply express trains that only stop at important stations to alleviate the passenger flow pressure at some stations. The frequency of maintenance and overhaul should be increased for Metro line 1 and line 2, which have existed for a long time. From the analysis, it can be seen that the frequency of accidents in metro line 1 is higher, especially in heavy rain and other bad weather.
(2) Station safety management
Strengthen the security check of stations, especially in important stations and during large-scale events, which cannot be a mere formality. In order to maintain the cleanliness of the carriages, we should strictly supervise the uncivilized behavior of passengers in carriages and encourage the public to report and supervise the uncivilized phenomena.
(3) Auxiliary facilities management
For the controversial situation of air-conditioning temperature in the carriage, improve the air-conditioning system and optimize its temperature regulation system to make it more in line with the perception of the majority of people. Strengthen the supervision of damaged escalators, lamp boards, toilets, and other facilities in the stations, and promptly check out problems if they are found to be broken or reported by the public.
(4) Emergency handling
In case of unexpected situation, it is necessary to make a good plan in advance, and inform the public immediately of the causes and the progress of the treatment in order to help passengers obtain timely information and then change their travel plans.
This paper introduces the process of mining public opinions on social networks and discusses in detail the theoretical and practical processes from data collection, analysis, to modeling. On the basis of content analysis, this paper attempts to obtain the temporal and spatial attributes of text. Taking the Metro fault as the research topic, this paper discusses the location of the fault and the severity of the accident, and obtains the spatial distribution law of the fault on Metro lines. The results of content analysis show that passengers’ comments on metro system mainly focus on Metro congestion, air-conditioning temperature, environment in the carriage, equipment failure, and so on. From the analysis of the temporal and spatial characteristics of the text, it can be seen that the subway operation failure will cause a wide range of public discussion. According the accident location, it can be found the accidents mostly occurred in Metro Line 1 and Line 2 on rainy days, which are built in the early years and have a larger passenger flow.
This set of content analysis method can be applied to the field of traffic planning. The traditional public opinion collection is replaced by a large data collection method and manual processing is replaced by computer, which not only greatly improves the speed and efficiency of data collection and analysis, but also improves the accuracy. In the early stage of planning, it can be used to collect public needs and provide important data for planning. After the implementation of policies and projects, it can be used as a public supervision mechanism to collect public opinions in time to respond and deal with them as soon as possible. The timely handling of public opinions can also encourage the public to put forward their own valuable opinions for the development of urban traffic on the social network according to what they have seen and heard, and make up for the loopholes and shortcomings of planning.
In this paper, the extraction and processing of traffic-related microblog text is still imperfect, which may lead to subsequent results affected. Direct use of traditional LDA model for topic modeling of microblog, to a certain extent, is still affected by the size, content, scattered format, data noise, and other aspects. The efficiency of LDA topic model is also influenced by the length of documents. The lack of sufficient words in a short text will affect the effectiveness of topic modelling. Mining the temporal and spatial characteristics of text data is relatively simple, such as not using the geographic location information published by microblog users. In the future, we can fully mine all kinds of social media data and establish a traffic public opinion monitoring system, which can provide a better supplement for traffic planning and management.


