Evolution of Grazing Practices in Belgian Dairy Farms: Results of Two Surveys

 ,
,
Abstract
1. Introduction
- (1)
- Make an inventory of grazing practices in Wallonia.
- (2)
- Highlight the main evolutions of the dairy sector occurred during a three-year interval.
- (3)
- Investigate the effects of two subgroups on grazing problematic: The no-grazing farmers and the organic sector.
- (4)
- Evaluate the expectations and the perceptions of dairy farmers.
- (5)
- Identify the relationships between farmers and EU policies about land use and land use changes and define levers to improve the sustainable practices of Walloon dairy farms.
2. Materials and Methods
3. Results
3.1. General Overview of the Results
3.1.1. General Farms’ Description
3.1.2. Grazing Practices
3.1.3. Perceptions and Expectations
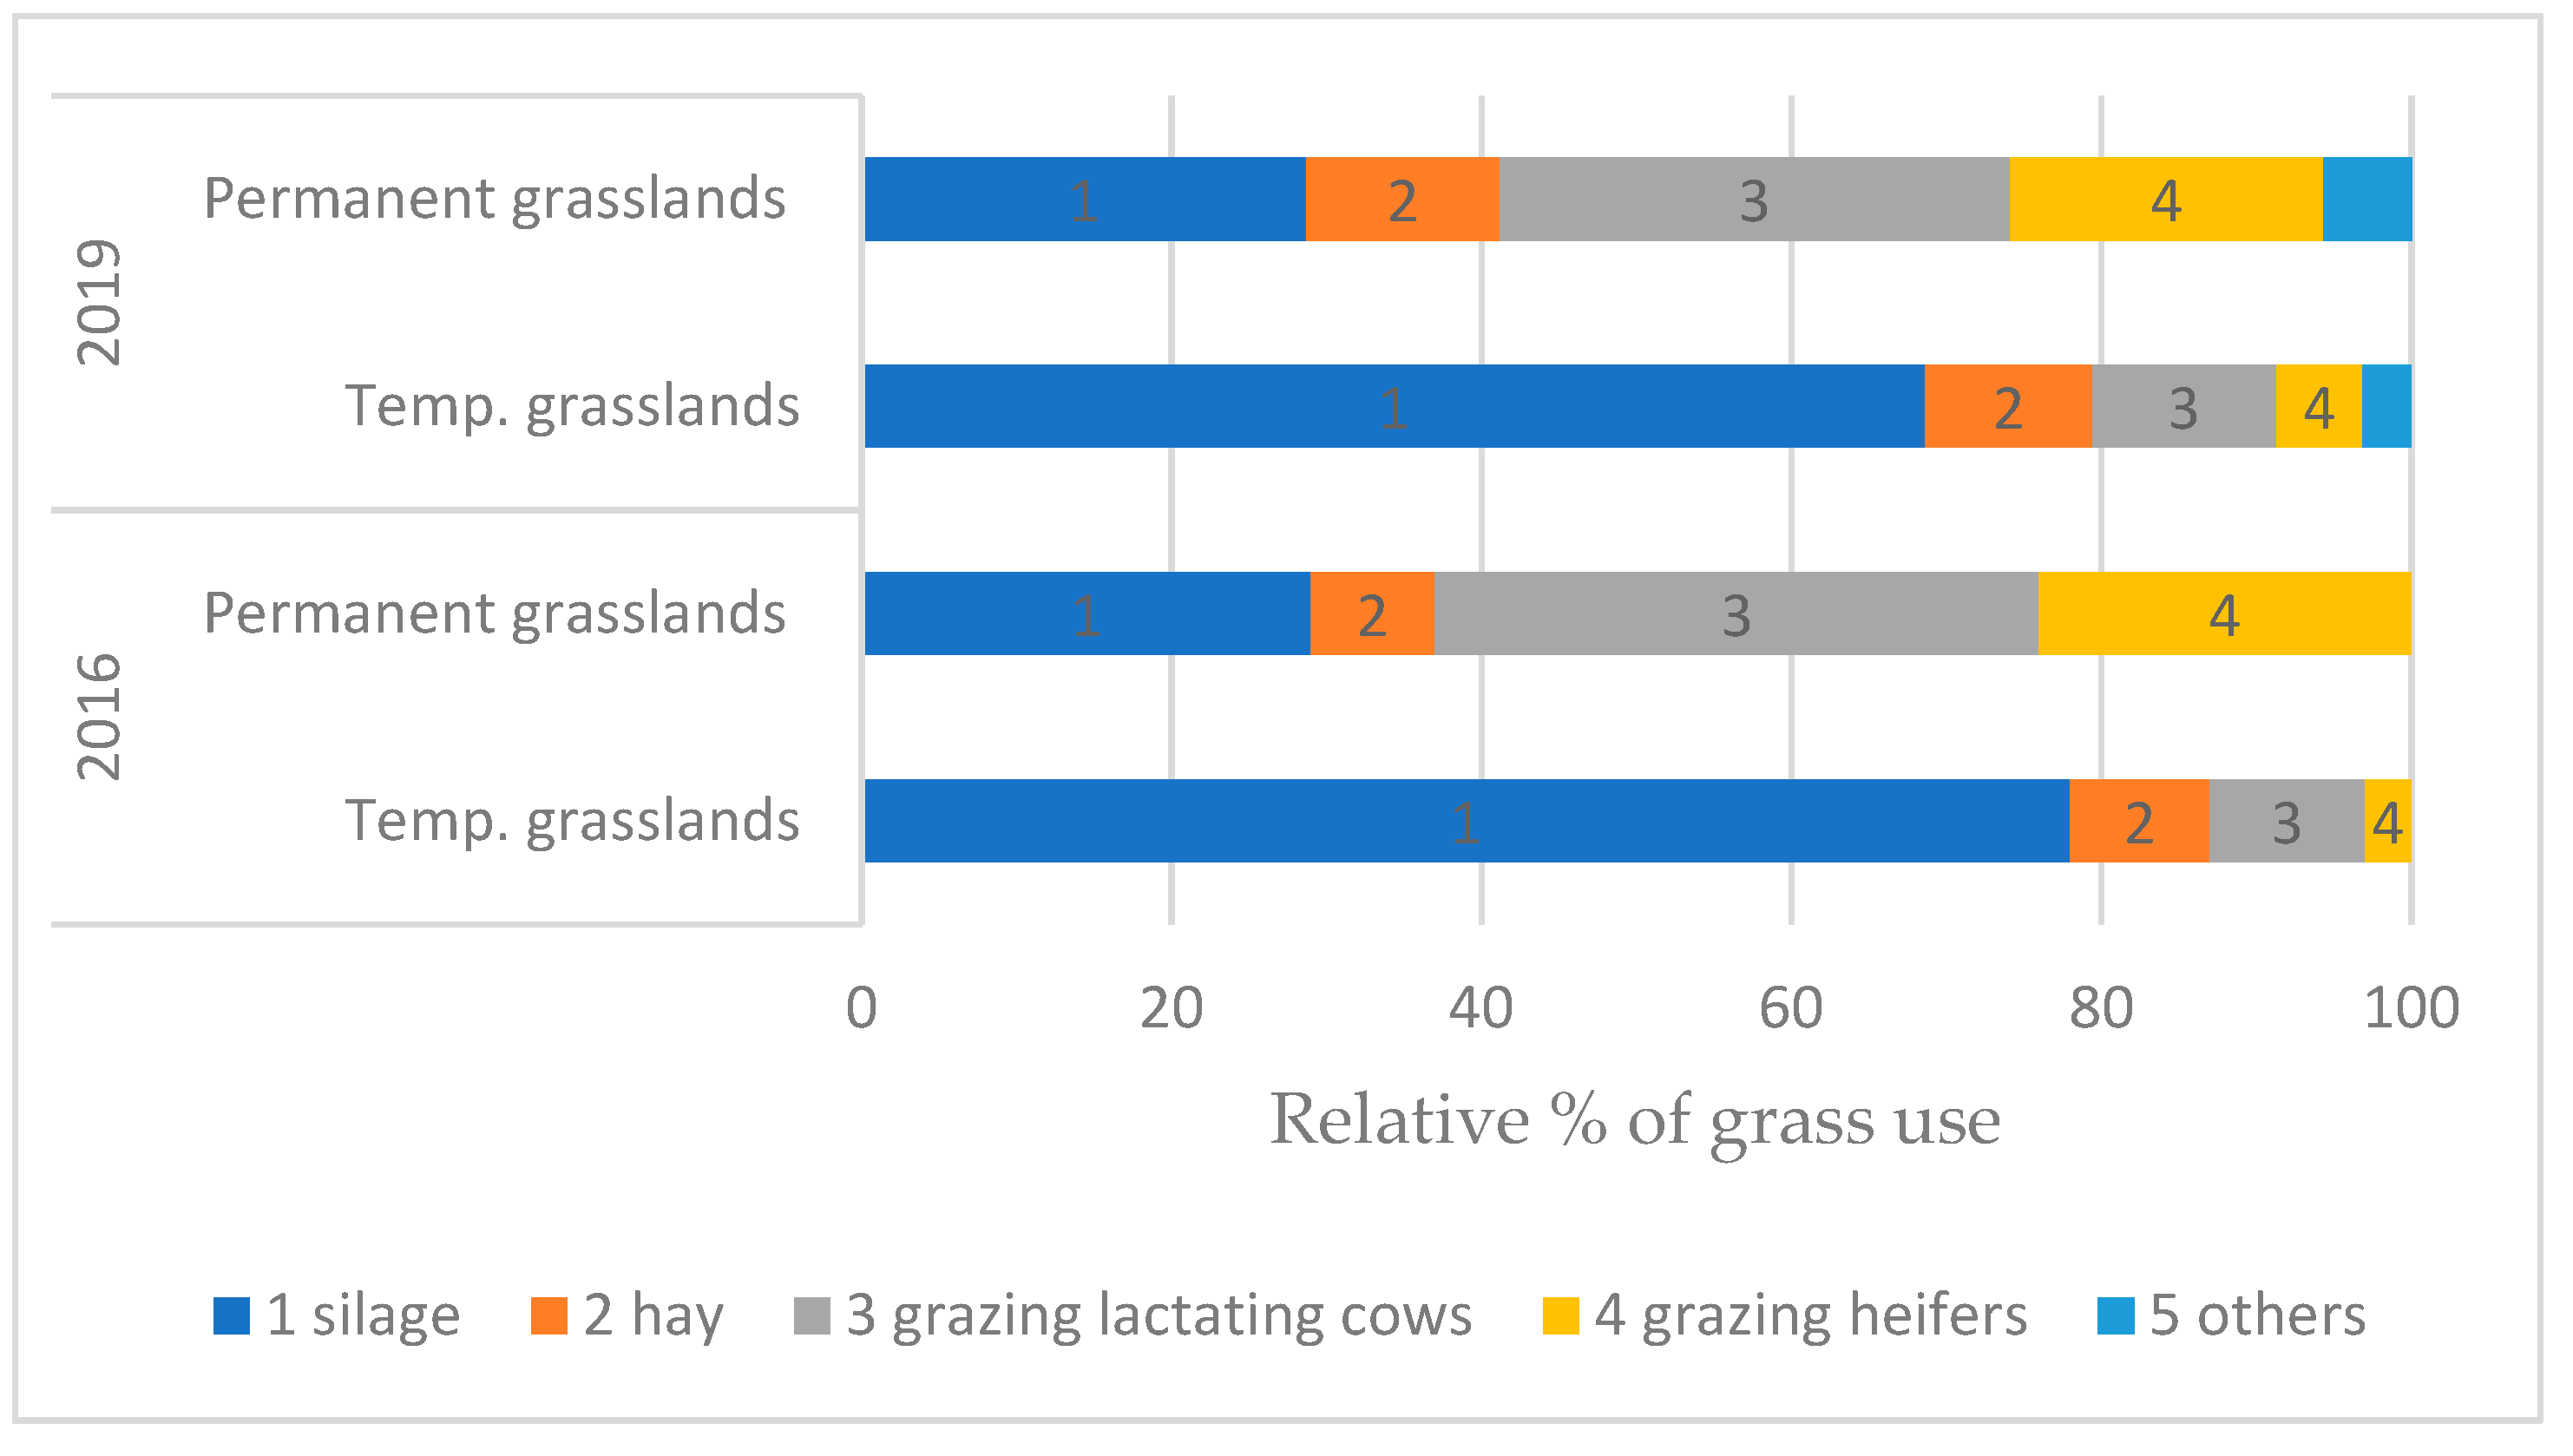
3.1.4. Management of Permanent and Temporary Grasslands
3.2. Influence of Grazing Management
3.3. Influence of Grazing Practices
3.3.1. General Description of NG Dairy Farms
3.3.2. Perceptions of NG Dairy Farms
3.4. Influence of the Sector of Activity
3.4.1. General Description of Organic Farms
3.4.2. Perceptions of Organic Farmers
4. Discussion
5. Conclusions
Author Contributions
Funding
Acknowledgments
Conflicts of Interest
Appendix A
| Questionnaire |  |
- ○
- Conventional
- ○
- Organic
- ○
- in Conversion
- ○
- Only milk
- ○
- Milk and meat
- ○
- Milk and crops
- ○
- Milk, meat and crops
- ○
- Less than 30 y?
- ○
- 30–40 y?
- ○
- 40–50 y?
- ○
- 50–60 y?
- ○
- More than 60 y?
- ○
- Less than 50 ha
- ○
- 50–75 ha
- ○
- 75–100 ha
- ○
- 100–125 ha
- ○
- 125–150 ha
- ○
- 150–200 ha
- ○
- 200–250 ha
- ○
- More than 250 ha
- ○
- Less than 50
- ○
- 50–100
- ○
- 100–150
- ○
- 150–200
- ○
- 200–250
- ○
- More than 250
- ○
- Less than or equal to 6000 L/y
- ○
- Between 6000 and 8000 L/y
- ○
- Between 8000 and 10,000 L/y
- ○
- Between 10,000 and 12,000 L/y
- ○
- More than 12,000 L/y
- ○
- Holstein
- ○
- Jersey
- ○
- Other
| Arable Grasslands | - | I don’t know |
| Superficie (ha) | ○ | |
| Production (t/ha/year) | ○ | |
| Proportion of the production (%) | ||
| ○ Silage | ○ | |
| ○ Hay | ○ | |
| ○ Grazing - Cows | ○ | |
| ○ Grazing - Heifers | ○ | |
| ○ Not used | ○ | |
| If silage, number of cuts? | ○ | |
| Arable grasslands (year) | ||
| ○ 1–2 | ○ | |
| ○ 2–3 | ○ | |
| ○ plus | ○ | |
| Manure (t/ha/year) | ○ | |
| Slurry (t/ha/year) | ○ | |
| Mineral N (kg N/ha/year) | ○ | |
| % legume in the grassland | ○ | |
| ○ 0% | ○ | |
| ○ 20% | ○ | |
| ○ 40% | ○ | |
| ○ more | ○ | |
| Permanent grasslands | I don’t know | |
| Superficies (ha) | ○ | |
| Production (t/ ha/year) | ○ | |
| Proportion of the production (%) | ||
| ○ Silage | ○ | |
| ○ Hay | ○ | |
| ○ Grazing - cows | ○ | |
| ○ Grazing - Heifers | ○ | |
| ○ Not used | ○ | |
| If silage, number of cuts? | ○ | |
| Manure (t/ha/year) | ○ | |
| Slurry (t/ha/year) | ○ | |
| Mineral N (kg N/ha/year) | ○ | |
| % legume in the grassland | ○ | |
| ○ 0% | ○ | |
| ○ 20% | ○ | |
| ○ 40% | ○ | |
| ○ more | ○ |
- ○
- Yes
- ○
- No
- ○
- Neutral
- ○
- Yes
- ○
- No
- ○
- Neutral
- ○
- Yes
- ○
- No
- ○
- Neutral
- ○
- Yes
- ○
- No
- ○
- Neutral
- ○
- Yes
- ○
- No
- ○
- Yes
- ○
- No
- ○
- Yes
- ○
- No
- ○
- Pastures too far from the stable
- ○
- Grazeable areas insufficient
- ○
- Lower milk yield at grazing
- ○
- Difficult or expensive management
- ○
- Poor climate conditions
- ○
- Poor soil conditions
- ○
- Economical: better opportunities for land use
- ○
- Less than 2 months
- ○
- 2–4 months
- ○
- More than 4 months
- ○
- Daytime
- ○
- Day and night
- ○
- Few hours a day
- ○
- Permanently
- ○
- Most of the time
- ○
- Occasionally
- ○
- Never
- ○
- Hay
- ○
- Grass silage
- ○
- Maize silage
- ○
- Cereals
- ○
- Composed compounds
- ○
- Other
- ○
- Less than 25%
- ○
- 50–75%
- ○
- 25–50%
- ○
- I don’t know
- ○
- Less than 25%
- ○
- 25–50%
- ○
- 50–75%
- ○
- More than 75%
- ○
- I don’t know
- ○
- Lower production costs
- ○
- Improves welfare
- ○
- Better image for consumer
- ○
- Preservation of landscape and biodiversity
- ○
- Requirements of dairy industry or authorities
- ○
- No other land use possible
- ○
- Premium/label
- ○
- Other
- ○
- I expect to increase
- ○
- I expect to decrease
- ○
- I expect to stop
- ○
- I expect to stay stable
References
- Gerber, P. Greenhouse Gas Emissions from the Dairy Sector; Report FAO; FAO: Rome, Italy, 2010. [Google Scholar]
- Tubiello, F.N.; Salvatore, M.; Ferrara, A.F.; House, J.; Federici, S.; Rossi, S.; Biancalani, R.; Condor Golec, R.D.; Jacobs, H.; Flammini, A.; et al. The Contribution of Agriculture, Forestry and other Land Use activities to Global Warming, 1990–2012. Glob. Chang. Biol. 2015, 21, 2655–2660. [Google Scholar] [CrossRef] [PubMed]
- Soussana, J.-F.; Loiseau, P.; Vuichard, N.; Ceschia, E.; Balesdent, J.; Chevallier, T.; Arrouays, D. Carbon cycling and sequestration opportunities in temperate grasslands. Soil Use Manag. 2004, 20, 219–230. [Google Scholar] [CrossRef]
- Dollé, J.B.; Faverdin, P.; Agabriel, J.; Sauvant, D.; Klumpp, K. Contribution de l’élevage bovin aux émissions de GES et au stockage de carbone selon les systèmes de production. Fourrages 2013, 215, 181–191. [Google Scholar]
- Garnett, T.; Müller, A.; Röös, E.; Smith, P.; de Boer, I.J.M.; Ermgassen, E.Z.; Herrero, M.; van Middelaar, C.; Schader, C.; van Zanten, H. Grazed and Confused? Ruminating on Cattle, Grazing Systems, Methane, Nitrous Oxide, the Soil Carbon Sequestration Question—What It All Means for Greenhouse Gas Emissions; Oxford University: Oxford, UK, 2017; pp. 1–149. [Google Scholar]
- Søegaard, K.; Gierus, M.; Hopkins, A.; Halling, M. Temporary grassland-challenges in the future. In Proceedings of the 14th Symposium of the European Grassland Federation on Permanent and Temporary Grassland: Plant, Environment and Economy, Ghent, Belgium, 3–5 September 2007; pp. 27–38. [Google Scholar]
- Kosztra, B.; Büttner, G.; Hazeu, G.; Arnold, S. Updated CLC Illustrated Nomenclature Guidelines; European Environment Agency: Wien, Austria, 2017; pp. 1–124. [Google Scholar]
- Soussana, J.F.; Allard, V.; Pilegaard, K.; Ambus, P.; Amman, C.; Campbell, C.; Ceschia, E.; Clifton-Brown, J.; Czobel, S.; Domingues, R.; et al. Full accounting of the greenhouse gas (CO2, N2O, CH4) budget of nine European grassland sites. Agric. Ecosyst. Environ. 2007, 121, 121–134. [Google Scholar] [CrossRef]
- Soussana, J.F.; Tallec, T.; Blanfort, V. Mitigating the greenhouse gas balance of ruminant production systems through carbon sequestration in grasslands. Animal 2010, 4, 334–350. [Google Scholar] [CrossRef] [PubMed]
- Abdalla, M.; Hastings, A.; Chadwick, D.R.; Jones, D.L.; Evans, C.D.; Jones, M.B.; Rees, R.M.; Smith, P. Critical review of the impacts of grazing intensity on soil organic carbon storage and other soil quality indicators in extensively managed grasslands. Agric. Ecosyst. Environ. 2018, 253, 62–81. [Google Scholar] [CrossRef] [PubMed]
- Follett, R.F.; Reed, D.A. Soil Carbon Sequestration in Grazing Lands: Societal Benefits and Policy Implications. Rangel. Ecol. Manag. 2010, 63, 4–15. [Google Scholar] [CrossRef]
- Henderson, B.B.; Gerber, P.J.; Hilinski, T.E.; Falcucci, A.; Ojima, D.S.; Salvatore, M.; Conant, R.T. Greenhouse gas mitigation potential of the world’s grazing lands: Modeling soil carbon and nitrogen fluxes of mitigation practices. Agric. Ecosyst. Environ. 2015, 207, 91–100. [Google Scholar] [CrossRef]
- European Commission. Rapport de la Commission au Parlement Européen sur la Mise en Oeuvre de L’obligation en Matière de Surfaces D’intérêt Écologique au Titre des Paiements Directs Verts; European Commission: Brussels, Belgium, 2017. [Google Scholar]
- McDonagh, J. Rural geography I: Changing expectations and contradictions in the rural. Prog. Hum. Geogr. 2013, 37, 712–720. [Google Scholar] [CrossRef]
- Gerbrandy, G.-J. What’s the Largest Multinational of Europe? Bees Br. -Nature Why Care? Belgium Ecosystem Services: Corbais, Belgium, 2012; pp. 1–8. [Google Scholar]
- Belgian National Focal Point. Biodiversity 2020, Update of Belgium’s National Strategy; Moreau, R., Ed.; Belgian National Focal Point: Brussels, Belgium, 2014; ISBN 9708907324. [Google Scholar]
- Rosset, P.M. The Multiple Functions and Benefits of Small Farm Agriculture; Food First: Oakland, CA, USA, 1999; Volume 6370, pp. 77–82. [Google Scholar]
- Kim, H.-Y. Statistical notes for clinical researchers: Chi-squared test and Fisher’s exact test. Restor. Dent. Endod. 2017, 42, 152–155. [Google Scholar] [CrossRef] [PubMed]
- Confédération Belge de L’industrie Laitière. Rapport Année 2018. Available online: www.bcz-cbl.be (accessed on 16 May 2019).
- L’agriculture Wallonne en Chiffres. Rapport 2019. Available online: https://agriculture.wallonie.be/ (accessed on 16 May 2019).
- Les Chiffres Clés de la Production Laitière Wallonne. Available online: http://www.celluleinfolait.be/le-lait-en-wallonnie/lait-de-vache/ (accessed on 19 May 2019).
- L’agriculture Belge en Chiffres. Available online: https://statbel.fgov.be/fr (accessed on 19 May 2019).
- Evolution de L’économie Agricole et Horticole de la Wallonie. 2017. Available online: https://agriculture.wallonie.be/ (accessed on 3 June 2019).
- Kristensen, T.; Madsen, M.L.; Noe, E. The use of grazing in intensive dairy production and assessment of farmers attitude towards grazing. Grassl. Sci. Eur. 2010, 15, 964–966. [Google Scholar]
- Comité du Lait Rapport D’activité. 2017. Available online: https://www.comitedulait.be/ (accessed on 16 May 2019).
- Comité du Lait Rapport D’activité. 2019. Available online: https://www.comitedulait.be/ (accessed on 16 May 2019).
- York, L.; Heffernan, C.; Rymer, C. A systematic review of policy approaches to dairy sector greenhouse gas (GHG) emission reduction. J. Clean. Prod. 2018, 172, 2216–2224. [Google Scholar] [CrossRef]


| n1 | Temporary Grassland | n1 | Permanent Grassland | |
|---|---|---|---|---|
| Surface (ha) | 427 | 16.7 ± 21.32 | 883 | 45.3 ± 28.8 |
| Production (t DM/ha) | 82 | 11.2 ± 3.6 | 105 | 10.2 ± 5.7 |
| Cuts (/grazing season) | 401 | 3.1 ± 1.3 | 829 | 2.3 ± 1.6 |
| Organic fertilizer (t/ha/year) | 324 | 29.0 ± 17.6 | 599 | 27.3 ± 33.1 |
| Mineral fertilizer (kg N/ha/year) | 323 | 172 ± 196 | 599 | 149 ± 175 |
| n1 | Temporary Grassland | n1 | Permanent Grassland | |
|---|---|---|---|---|
| Surface (ha) | 474 | 17.7 ± 22.22 | 828 | 49.0 ± 34.9 |
| Production (t DM/ha) | 91 | 10.5 ± 3.6 | 105 | 8.9 ± 3.0 |
| Cuts (/grazing season) | 424 | 3.4 ± 1.2 | 829 | 2.9 ± 1.2 |
| Organic fertilizer (t/ha/year) | 362 | 39.0 ± 26.0 | 599 | 40.9 ± 70.7 |
| Mineral fertilizer (kgN/ha/year) | 265 | 179 ± 104 | 440 | 158 ± 93 |
© 2019 by the authors. Licensee MDPI, Basel, Switzerland. This article is an open access article distributed under the terms and conditions of the Creative Commons Attribution (CC BY) license (http://creativecommons.org/licenses/by/4.0/).
Share and Cite
Lessire, F.; Jacquet, S.; Veselko, D.; Piraux, E.; Dufrasne, I. Evolution of Grazing Practices in Belgian Dairy Farms: Results of Two Surveys. Sustainability 2019, 11, 3997. https://doi.org/10.3390/su11153997
Lessire F, Jacquet S, Veselko D, Piraux E, Dufrasne I. Evolution of Grazing Practices in Belgian Dairy Farms: Results of Two Surveys. Sustainability. 2019; 11(15):3997. https://doi.org/10.3390/su11153997
Chicago/Turabian StyleLessire, Françoise, Samuel Jacquet, Didier Veselko, Emile Piraux, and Isabelle Dufrasne. 2019. "Evolution of Grazing Practices in Belgian Dairy Farms: Results of Two Surveys" Sustainability 11, no. 15: 3997. https://doi.org/10.3390/su11153997
APA StyleLessire, F., Jacquet, S., Veselko, D., Piraux, E., & Dufrasne, I. (2019). Evolution of Grazing Practices in Belgian Dairy Farms: Results of Two Surveys. Sustainability, 11(15), 3997. https://doi.org/10.3390/su11153997