1. Motivation and Related Literature
Environmental change or, more broadly, the adoption of green energies, has overwhelmingly entered the current political debate. The recent financial crisis has further led to increased criticism against the adoption of new technologies with the historical decision of the United States to withdraw from the Paris Agreement, in which countries committed themselves to exert consistent efforts in order to restrict the adverse consequences of climate change.
Although the relationship between investments in green energies and employment is complex, due to the possible reverse causality between economic activity and investments in cleaner technologies, there is compelling evidence showing that environmentally friendly technologies have positive effects on labor market outcomes.
Table 1 reports the main contributions that analyzed the nexus between investments in green energies and employment, along with a more detailed evaluation of these contributions within the text.
Horbach and Rennigs (2013) [
1], using data from the 2009 wave of the Community Innovation Survey (CIS), analyzed the impact of green technologies on employment, showing that clearer technologies boosted job creation, giving rise to new employment opportunities.
Pociovălișteanu et al. (2015) [
2] investigated the relationship between environmental policies and employment in the European Union, finding limited evidence of a positive impact on green policies on employment.
Connolly et al. (2016) [
3] studied the dynamics of employment in Low Carbon Environmental Goods and Services (LCEGS) in Scotland over the 2004–2012 period, showing that, over the period considered, Scotland experienced an increase in green employment, although this increase was largely more volatile than the increase of overall employment and characterized by a consistent reduction during recessionary episodes.
Kunapatarawong and Martínez-Ros (2016) [
4] provided a similar analysis for Spain over the 2007–2011 period, showing that investments in green technologies generated positive variations in employment and that firms which voluntarily adopted new technologies registered a higher increase in their employment levels than those that adopted green technologies only to meet specific regulation requirements.
Cecere and Mazzanti (2017) [
5] examined the impact of clean technologies on green jobs for European small and medium enterprises (SMEs), finding evidence of a positive relationship between clean technologies and green jobs.
Aldieri and Vinci (2019) [
6], using data from the United States, Europe, and Japan, i.e., the triad, analyzed both theoretically and empirically the effects of sustainable innovation on firm size, showing that, although a displacement effect could be determined by the introduction of sustainable technologies, this adverse effect was partially offset by the development of a new competitive environment, therefore determining a compensation effect
In this paper, we analyze the impact of green energies on employment for a set of 19 OECD countries over the 1985–2013 period (the choice of the sample period was driven by data availability), through the application of a fixed effects model. The investigation of this nexus comes from the assumption that increased access to green technology, making this type of technology competitive with other energies, has probably changed the constraints faced by firms when choosing the type of technology to adopt.
Apart from the contributions of Kunapatarawong and Martínez-Ros (2016) [
4] and Aldieri and Vinci (2019) [
6], the existing literature lacks robust econometric estimates concerning the relationship between green energies and employment and fails to control for factors which are assumed to be relevant in explaining the dynamics of employment. This paper aims to fill this existing gap, since in our econometric analysis we control for a large set of labor market institutions and policies, the development of the financial markets, various dimensions of globalization, and, in contrast to most of the literature considered which only examines the nexus between investments in green technologies and green jobs, we consider the effects of such technologies on overall employment. Existing literature, indeed, shows that improvements in green technology lead to increases in employment. Although it is reasonable to assume that new and sophisticated technologies are characterized by some degree of complementarity rather than substitutability with green employment, the opposite may hold when overall employment is considered. To test whether innovation increases or decreases overall employment, in our econometric framework we further control for the added value in R & D in the manufacturing sector.
Finally, and in contrast to other contributions, our analysis further deals with the effects of globalization, which, in our opinion, represents a major social, economic, and political phenomenon, whose importance and relevance is hard to deny and whose effects on labor market outcomes are little explored. Therefore, our motivation involves testing whether intense globalization can be thought of as a source of mismatch or whether it facilitates the creation of new jobs and the matching between demand and supply. To empirically assess this nexus, we introduce three alternative indices of globalization, namely economic, political, and social, to capture how different dimensions of globalization impact upon employment.
After controlling for all these factors, empirical evidence shown in this contribution clearly indicates that green energies, measured as the share of green energies over total basic energies, determine an increase in the total amount of employees. More precisely, the econometric analysis proposed in this paper suggests that a 10% increase in the share of green energies determines a 0.3% increase in employment and this result is robust to alternative specifications and to potential exogenous shocks. Since investments in green economy are found to affect overall employment, this result can be interpreted as a signal that the development of the green sector creates positive externalities which are not limited to the green sector only, but are widespread to the economy as a whole.
The paper is organized as follows:
Section 2 shows the patterns of both green energies and employment in the OECD from 1980 to 2013, trying to highlight differences across countries in their propensity toward the adoption of green energies and focusing, although not extensively, on the effects of the 2008 financial crisis on labor market outcomes. In
Section 3, we describe the main variables used for our econometric analysis and provide descriptive statistics, while
Section 4 is devoted to the methodology and the model specifications.
Section 5 discusses the empirical results obtained in our preferred specifications, while in
Section 6 a robustness check is performed to test the stability of the main parameters of interest, with great emphasis on the potential effects of different exogenous shocks.
Section 7 concludes and discusses the main policy implications drawn from the econometric analysis.
2. Green Energy and Employment in the OECD: Some Facts
In this section, we seek to illustrate the time-series patterns of the two main variables of interest in our empirical analysis, namely employment and green energy supply across the 19 OECD countries under scrutiny over the 1980–2013 period.
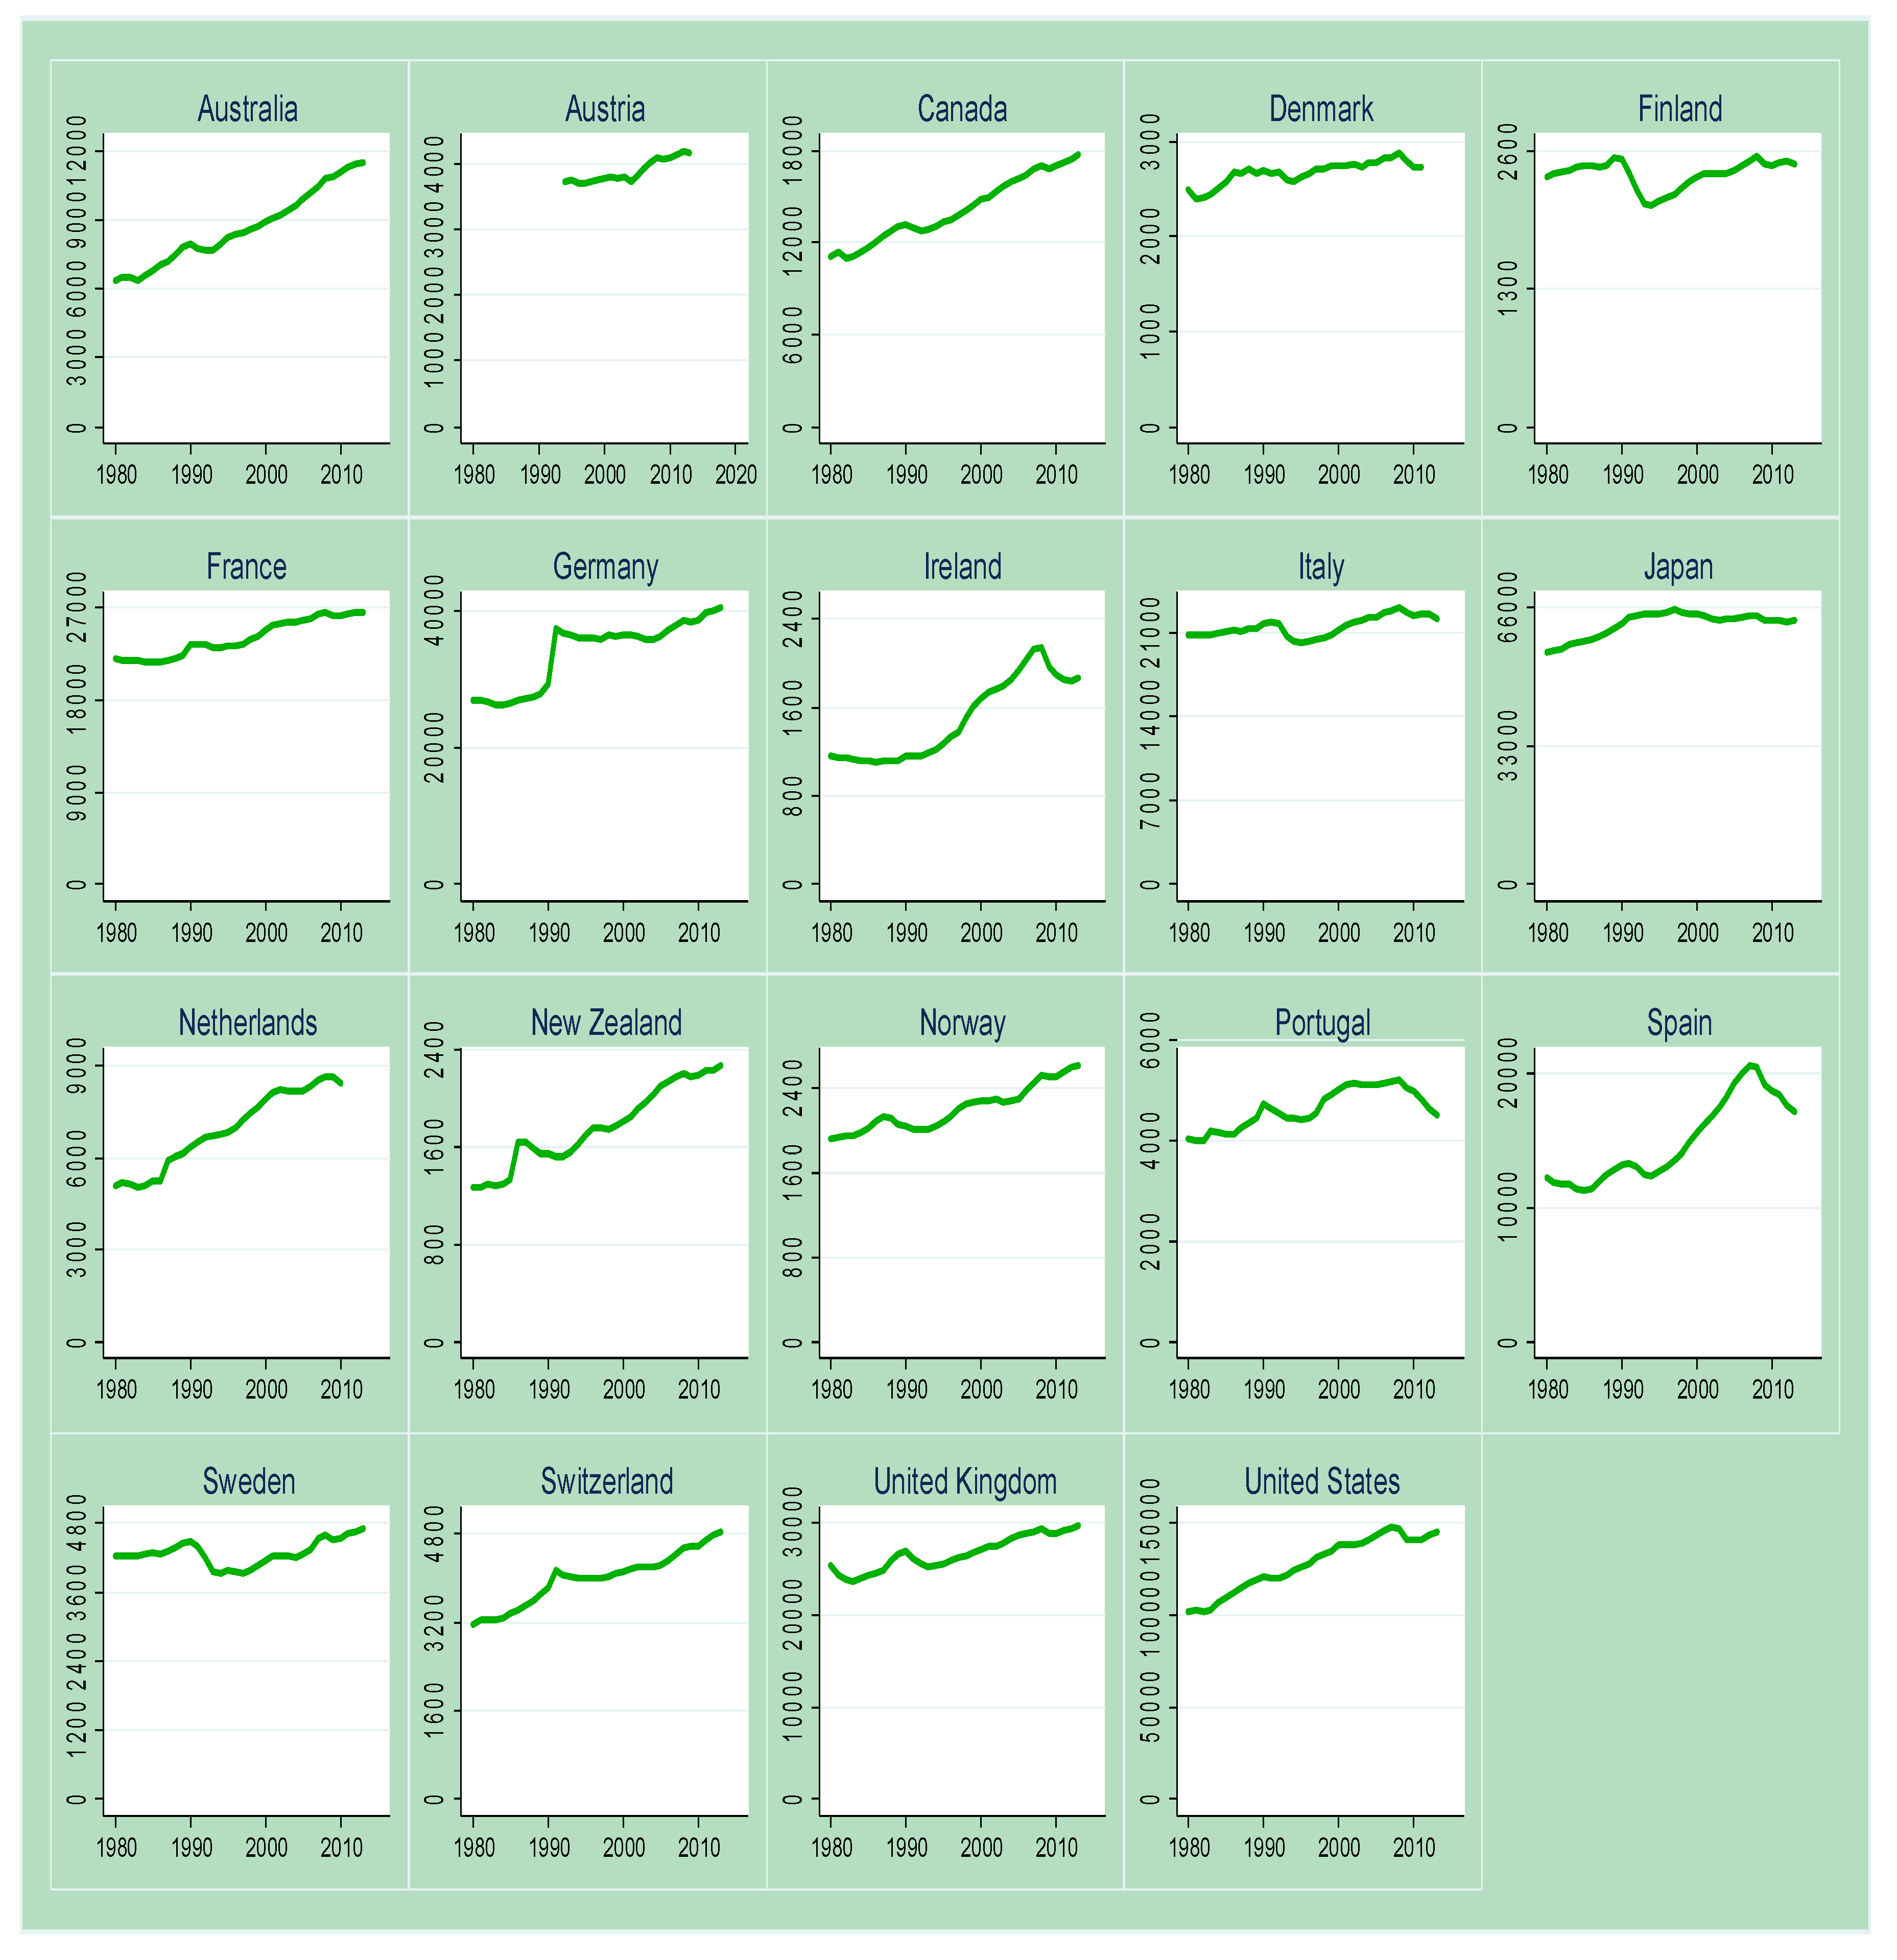
Figure 1 illustrates the dynamics of employment, in levels, over the time span considered.
The time series reported in
Figure 1 show that some countries experienced exponential growth in their employment levels over the period considered, except for Finland and Japan, where the trend is almost constant over time. Portugal, Spain, Ireland, and Italy were affected by the 2008 financial crisis quite severely in terms of labor market outcomes, as shown by the contraction in the employment levels registered after 2008. This implies that these countries suffered, more than others, the adverse consequences of the Great Recession.
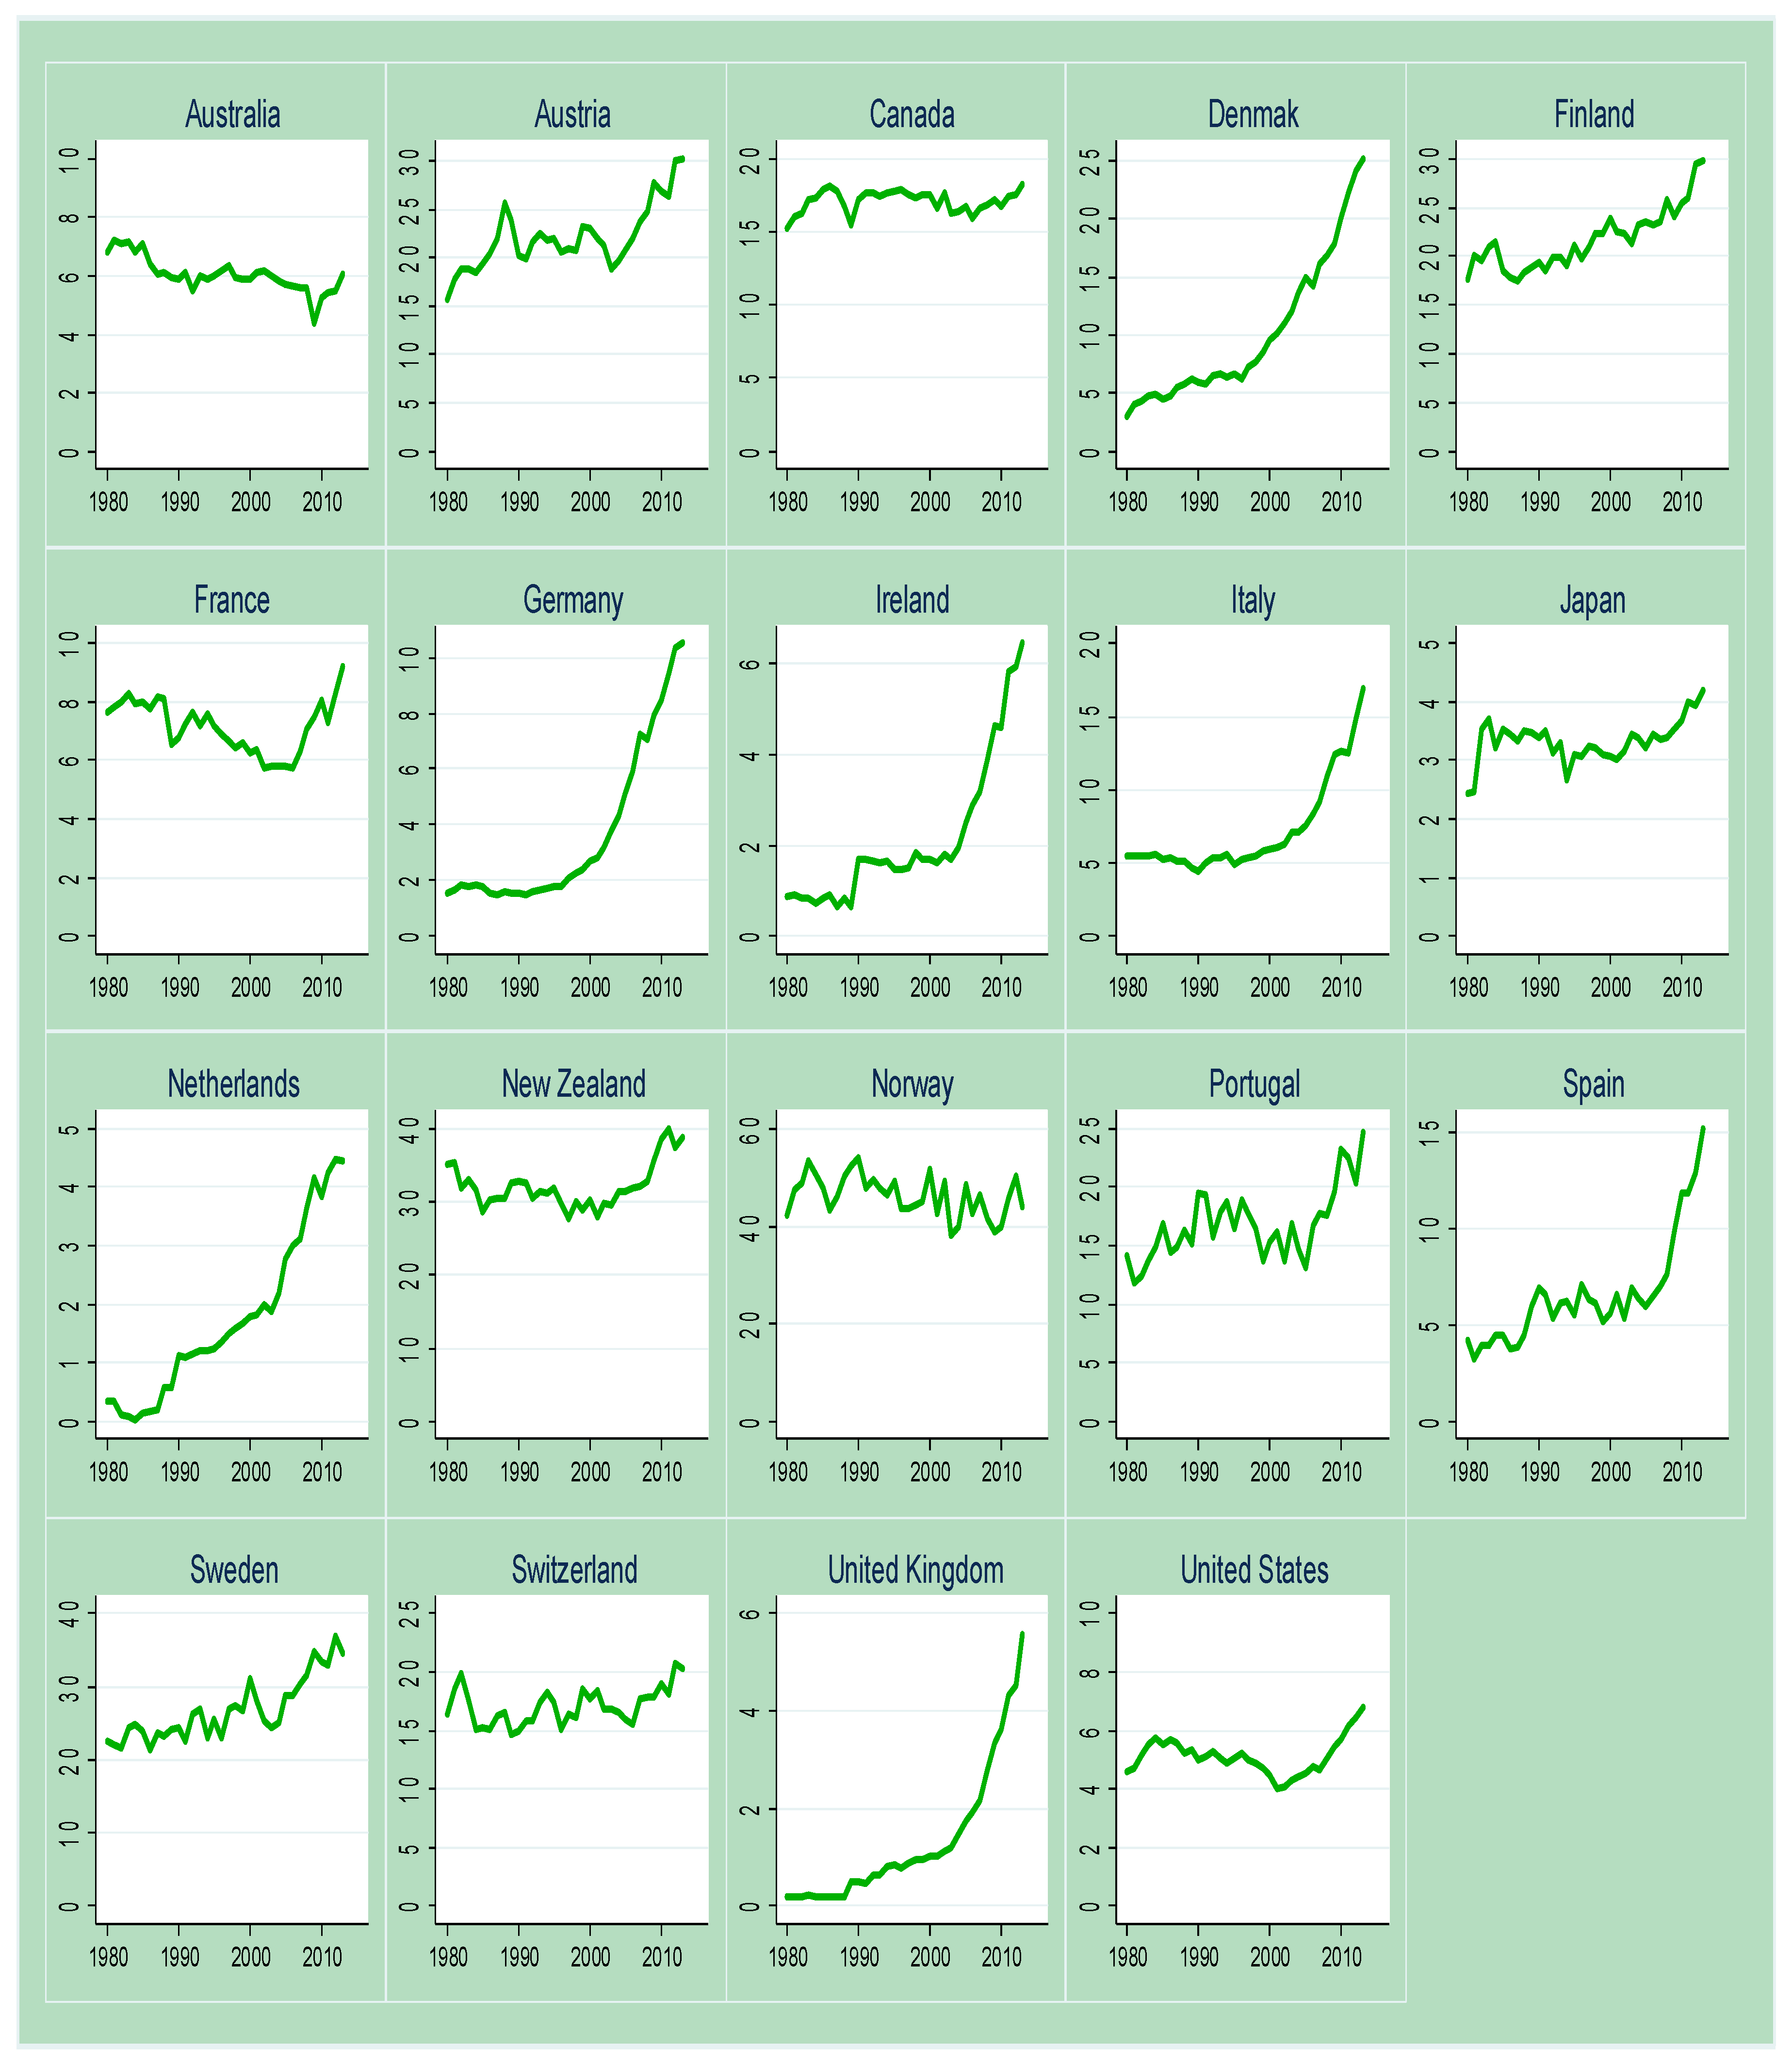
Figure 2 illustrates the dynamics of green energy supply in percentage of total basic energies supplied, revealing that, starting from the 80′s, almost every country in the OECD experienced a marked increase in the production of green energies. Interestingly, the share of green energies supplied was not affected by the financial crisis, since in almost every country we observed an increase in the amount of green energies produced, even after 2008.
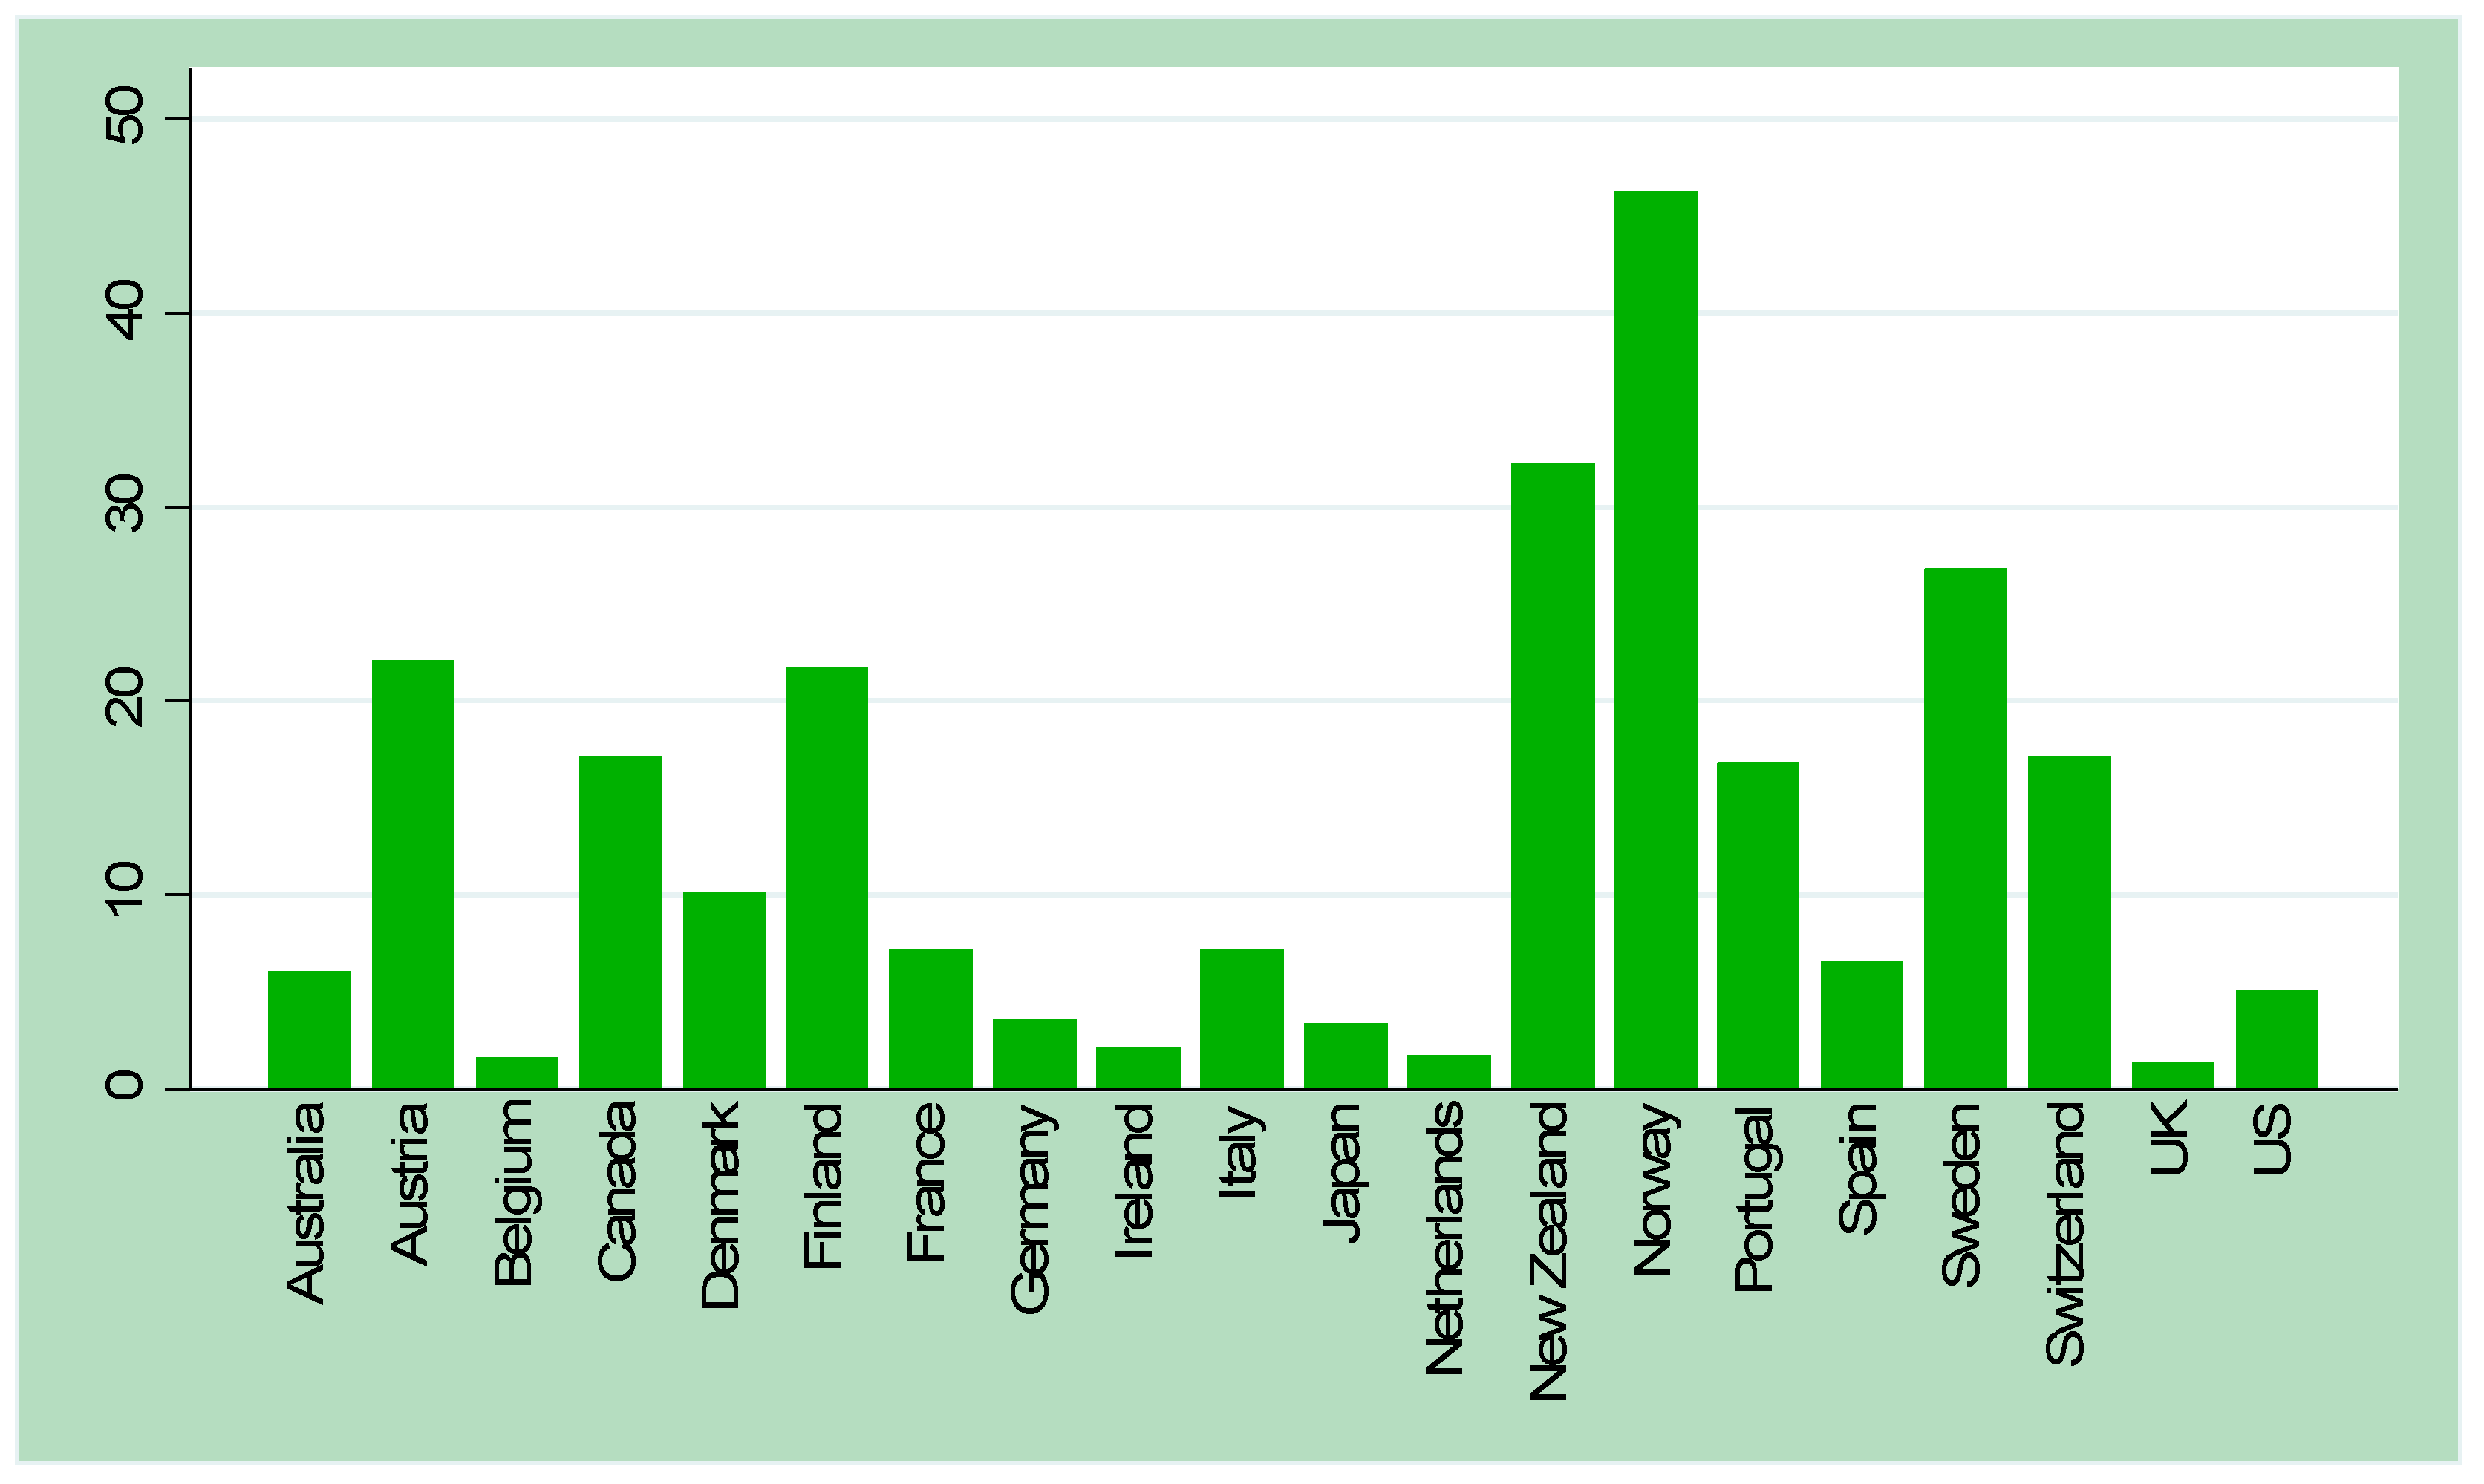
Although this marked increase shows the countries were unharmed by the crisis, it is possible to observe that large heterogeneity in the levels of green energies produced exists between the countries under scrutiny. To better capture these differences,
Figure 3 provides a bar graph containing the average shares of green energies in the set of countries examined in the paper. In particular, these statistics reveal that the efforts in introducing green technologies were not uniformly distributed across countries and that, among OECD countries, Norway led in terms of green energies produced with a share of 46.28%, followed by New Zealand (32.23%), Sweden (26.78), Austria (22.06), and Finland (21.70).
While these countries displayed high levels of green energy produced, other advanced economies, most notably the United Kingdom, the Netherlands, Japan, and Germany, were instead characterized by limited proportions of green energies produced. Over the period considered, the United Kingdom produced only 1.34% of green energies, while the Netherlands quota was estimated to be 1.74%. Limited shares of green energies were also found for Japan and Germany, whose estimated averages were 3.33% and 3.63%, respectively.
Statistics further suggest that, even in advanced economies, the development of green technologies is still limited and that a serious commitment in investing in these technologies would be desirable in order for economic systems to be sustainable and environmentally friendly.
3. Data and Descriptive Statistics
To empirically assess the relationship between green economy and employment, we considered a panel of 19 OECD countries over the 1985–2013 period. In the sample, the following economies were included: Australia, Austria, Canada, Denmark, Finland, France, Germany, Ireland, Italy, Japan, Netherlands, Norway, New Zealand, Portugal, Spain, Sweden, Switzerland, the United Kingdom, and the United States.
As a measure of employment, the number of civilian employees in the economy was considered from the OECD Population and Labor Force Dataset, while as a measure of green energy development, we proposed the percentage of green energy supplied over the total primary energy from the International Energy Agency World Energy Statistics and Balances: Extended World Energy Balances.
As a proxy for innovation, the added value in research and development in the industry sector, taken from the OECD Stan Database for Industrial Analysis, was included to test whether complementarity or substitutability between innovation and employment existed.
In our empirical analysis, we further controlled for a set of labor market institutions and policies which were assumed to be relevant in explaining the dynamics of employment. Among them, the generosity of the unemployment benefit system, minimum to median wages, trade union density, and bargaining coordination were used for the proposed empirical investigation. Data for the generosity of the unemployment benefit system were taken from the Comparative Welfare Entitlements Dataset (CWED), developed by Scruggs, Kuitto, and Jahn (2017) [
7]. The indicator depended on factors like the duration of benefits, their coverage, and the waiting periods necessary to collect benefits to test whether increased generosity in the unemployment benefits protocol discouraged workers to actively search for a job, therefore determining a contraction in the level of employment.
Data for minimum to median wage were taken from the OECD Minimum Relative to Average Wage Full-Time Workers Dataset and the variable was computed as the ratio between the minimum and the median wage. In this case, we wanted to test whether wage stickiness, which increases the cost of labor, reduced the incentive of firms in creating new jobs.
Trade union density, on the other hand, represented the ratio of wage and salary earners who were trade union members divided by the total amount of wage and salary earners. Statistics for this variable came from the OECD Trade Union Density Dataset. In this case, we wanted to test whether unions, which require more advantageous conditions for their workers, affected firms’ decisions and reduced the access to the labor market for non-unionized workers.
Statistics for bargaining coordination came from the ICTWSS Database, developed by Jan Visser (2019) [
8], which provided an index of bargaining coordination in the range [
1,
5]. Higher scores indicated that the bargaining process was highly centralized, while lower levels of the indicator suggested that the bargaining process was highly decentralized. We therefore expected that higher centralization improved labor market efficiency, with beneficial effects on employment.
As a measure of financial development, conventional privy was considered, which is the ratio between the total amount of credits provided by the financial sector to the domestic economy over GDP. The source for this variable was the World Development Indicators of the World Bank. A positive relationship was expected for this variable, since higher access to finance should facilitate firms in creating new jobs, therefore increasing employment.
Furthermore, in the empirical framework, we controlled for three different indices of globalization, namely economic globalization, political globalization, and social globalization, to capture whether increased openness of the economy had an effect on employment. In our opinion, the impact of these variables, being previously unclear, represented a relevant empirical issue.
The source of globalization indices was the KOF Index of Globalization of the Swiss Federal Institute of Technology, Zurich (2015), initially proposed by Dreher (2006) [
9].
It is worth noting that while economic globalization depends on trade flows, FDIs, portfolio investments, and income payments to foreign nationals, political globalization is determined by factors like the number of embassies, participation in international treaties, membership of international organizations, and participation in the United States Security Council Missions.
Finally, the social globalization index depends on cultural proximity, information flows, and personal contact information.
After having discussed the main variables and their sources, we provide summary statistics for the sample.
In
Table 2, we provide descriptive statistics for the main variables used in our empirical analysis.
Over the period considered, more than 19 million people were employed in the OECD, while the share of green energy supplied was, on average, 12.80% and the unemployment generosity index ranged between 2.60 and 14.50, with an average of 9.90.
Among the three dimensions of globalization, for the sample examined, the degree of political globalization was higher than its economic and social counterparts, while the proportion of unionized workers was 38%, on average.
Moderate bargaining coordination characterized the countries under scrutiny, since the estimated average was 3.10 over a maximum of 5, while the ratio between the minimum and the median wage was equal to 27%, on average.
With respect to the amount of R and D expenditures, we found that the added value of R and D activities was 6.55%, while the amount of credits was 94% of GDP, on average.
4. Methodology
In order to empirically address the relationship between green energies and employment, we propose the application of a fixed effects (FE) model, with three different baseline specifications, as follows:
where
Empit is the amount of civilian employees,
Empit-1 is the first lag of the dependent variable to capture the degree of persistence in the levels of employment (the choice of this lag structure was suggested by some preliminary estimates and by the Akaike information criterion (AIC)),
is the added value in research and development in manufacturing to test whether R and D activities boost new employment opportunities or destroy existing jobs,
Energyit represents the share of green energy supply over the total supply of basic energies expected to foster employment, hence the positive sign, and
Generosityit is the generosity of the unemployment benefit system, which was included in our specifications to test whether increased unemployment benefits reduced the incentive of unemployed workers to actively search for a job. We expected this variable to be inversely correlated with employment.
EcGlobit,
PolGlobit, and
SocGlobit represent, the three proposed indices of globalization, namely economic, political, and social globalization, respectively. The empirical effects of these were previously unclear.
is the ratio of wage and salary earners who were trade union members, divided by the total amount of wage and salary earners. We expected this variable to discourage new employment opportunities, therefore decreasing the amount of employees in the economy.
is the minimum to median wage and can be thought of as a measure of wage stickiness. The idea was that the higher the degree of wage rigidity, the lower the incentive for firms to create new jobs; we assumed this variable would be negative.
is a standard measure of financial development, simply defined as the ratio of credits to the private sector over GDP. The assumption was that the easier the access to credit markets for firms, the better their ability in creating new jobs, therefore we assumed that this variable would positively correlate with the dependent variable.
Coordinationit represents the bargaining coordination proposed by Visser (2019) [
9], which was expected to increase employment,
represents a set of time-dummies,
α,
β,
ρ,
λ,
,
μ,
,
γ,
η, and
are unknown parameters to be estimated, and
is the conventional error term.
Among the estimated parameters, the relevant one for the empirical purposes of the paper was ρ, which aimed at measuring the impact of green energies on employment.
We opted for a fixed effect model instead of a random effect model since, while the former assumes that fixed effects are correlated with the matrix of exogenous variables, the latter assumes that they are random.
It seemed reasonable to assume that the main variables used in the econometric analysis proposed in the following contribution, like the proportion of green energy produced, labor market institutions and policies, innovation strategies, globalization, and financial development, are correlated with the fixed effects, therefore suggesting the application of a least squares dummy variable (LSDV).
For each fixed effects specification, a random effects (RE) counterpart—not reported in the paper for the sake of convenience—was estimated to compute the Hausman specification test and to check whether there existed systematic differences in the estimates parameters, in order to test whether fixed or random effects erre appropriate for the empirical purposes of the paper. All models were estimated using STATA 14, via the XTREG routine.
5. Empirical Evidence
In this section, we show the results obtained in our preferred econometric estimates and the discussion begins by considering economic globalization as an initial measure of international openness.
According to
Table 3, the levels of employment were characterized by some, albeit small, degree of persistence, as shown by the estimated AR(1) coefficient which was positive, as expected, and highly significant. The development of the green economy, our main parameter of interest, was found to be positive, as one would expect, and highly significant, with an estimated elasticity of 0.03, confirming the previous findings of Horbach and Rennings (2013) [
1], Pociovălișteanu et al. (2015) [
2], Connolly et al. (2016) [
3], Kunapatarawong and Martínez-Ros (2016) [
4], and Cecere and Mazzanti (2017) [
5]. This result may be further interpreted as the existence of positive externalities driven by the development of the green sector, suggesting that the positive effects of green energies are not limited to the segment of green jobs, but involve the labor market as a whole.
Increased generosity of the unemployment benefit system, in line with the contributions of Carling et al. (1996) [
10], Korpi (1997) [
11], Card et al. (2007) [
12], and Krueger and Mueller (2010) [
13], was found to have a detrimental effect on the variable of interest, suggesting that higher generosity of the unemployment benefits protocol reduced the search intensity of unemployment workers and increased their reservation wages, therefore decreasing the probability for unemployment workers to fill available vacancies, with negative effects for employment.
Unionism, on the other hand, was found to be inversely correlated with the variable of interest and highly significant, therefore implying that the higher the share of unionized workers, the lower the levels of employment, a result which was in line with the previous contributions of Kahn (1978) [
14], Holzer (1982) [
15], Montgomery (1989) [
16], Blanchflower et al. (1991) [
17], Wooden and Hawke (2000) [
18], and Walsworth (2010) [
19].
Wage rigidities, measured by the ratio of minimum to median wages, were shown to be negative, as expected, and highly significant, consistent with the contributions of Dube et al. (2016) [
20] and Clemens and Wither (2019) [
21]. Intense globalization was found to determine a negative and statistically significant reduction in the level of employment, as suggested by Huwart and Verdier (2013) [
22] and Nayyar (2015) [
23].
Innovation, measured as the added value in R and D activities, was shown to be negative and highly significant, suggesting imperfect substitutability between innovation and labor, in line with the creative destruction model proposed by Aghion and Hewitt (1992) [
24] and, partially, with the contributions of Greenan and Guellec (2000) [
25] and Van Roy et al. (2018) [
26]. Improvements in the financial system were found to have a positive effect on employment, in line with the predictions of Musso and Schiavo (2008) [
27], Pagano and Pica (2012) [
28], and Boustanifar (2014) [
29], implying that the higher the credit constraints imposed to firms, the worse their ability to create new jobs, with negative effects for employment. Coordination was found to have no significant effect on the variable of interest.
In all the proposed econometric specifications, the p-value of the Hausman test suggested that the fixed effect model was preferred to the random effect model.
In
Table 4, the relationship between green energies and employment is further examined, using an index of political globalization instead of economic globalization.
Once again, we found that current levels of employment were influenced by their past realizations, as suggested by the lagged coefficient of the dependent variable, which was found to be positive and significant. The main parameter of interest, represented by the share of green energy, was again found to be positive and significant, implying that the development of green energies gives rise to a virtuous cycle which stimulates the creation of new jobs, with beneficial effects on employment.
Unemployment benefits were found to have a detrimental effect on the endogenous variable, therefore suggesting that generous unemployment insurance discouraged unemployment workers to actively search for a job. However, in contrast to estimates previously presented, we found that political globalization had a positive and significant effect on employment, implying that the involvement in international treaties and an active role in international organizations created new employment opportunities, with beneficial effects on employment.
Union density, in line with previous estimates, was shown to be negative and highly significant, suggesting that unionism and rising wages reduced the incentive for firms in creating new jobs, with adverse consequences on the endogenous variable. A similar effect was once again found for the minimum to median wage, which reinforced the idea that labor market rigidities represent an obstacle for firms in creating jobs, reducing the job-finding rate of unemployed of workers.
R and D activities were found to have an adverse impact on the endogenous variable, suggesting that innovation and employment were characterized by imperfect substitutability, while financial development spurred employment since it stimulated job creation. Increased coordination was found to have a limited impact on employment.
Once again, the econometric estimates reported in
Table 3 support the choice of a fixed effect model, as shown by the
p-value of the Hausman test.
We conclude our empirical analysis with
Table 5, where we provide a set of econometric estimates in which social globalization was used as a measure of international openness.
In line with previous estimates, the AR(1) coefficient of employment was found to be positive and significant and the log of the supply of green energy was once again shown to be positive and highly significant, suggesting that the development of the green economy was beneficial for employment.
Increased unemployment benefits, unionism, social globalization, and innovation were found to harm employment, while improvements in the financial sector had a positive and significant impact on the variable of interest. Bargaining coordination was shown to have limited impact on the endogenous variable and, in line with the previous estimates, the Hausman test suggested that the fixed effect model was appropriate for the nexus examined.
6. Robustness Check
In this section, we provide a robustness check for our preferred econometric specifications. We considered two main shocks that might have determined a structural change in the supply of green energy, therefore affecting the stability of the parameters of interest. These shocks were the 2005 introduction of the Kyoto Agreement and the 2008 financial crisis.
While the introduction of the Kyoto agreement might have determined an increase in the amount of green energies, the Great Recession might have driven its reduction, in favor of old and less efficient technologies. To determine to what extent this is true, we provide a set of econometric estimates pre-Kyoto and pre-crisis to test whether the parameters of interest remained stable or not.
In
Table 6, we consider whether the introduction of the Kyoto Agreement determined a structural break in the relationship analyzed, considering all the three different indices of globalization.
Results presented in
Table 6 clearly indicate that the introduction of the Kyoto agreement did not determine a structural increase in the amount of green energies, therefore suggesting that, even before the introduction of these environmental agreements, the countries under scrutiny were exerting some effort in order to develop new and most environmentally-friendly technologies. As our results suggest, the estimated coefficient of the green energy supply was in line with the previous estimates; the same holds for all other relevant factors included in our econometric analysis.
We then repeated the econometric exercise proposed above, but this time provided estimates before the financial crisis to understand whether the 2008 recession determined a decrease in green energies.
To empirically address the consequences of the financial crisis on green energies, we provided a set of econometric estimates which were constrained to the 1985–2008 period. The empirical evidence presented in
Table 7 reveals that the 2008 financial crisis did not lead to a structural change in the supply of green energies, as confirmed by the estimated coefficient of interest, which remained stable and in line with the previous estimates. A similar result held with respect to the impact of other relevant factors considered in the econometric analysis; this is proposed in the following contribution.
7. Conclusions and Policy Implications
In this paper, we investigated the effects of green energies on employment using data for a set of 19 OECD economies over the 1985–2013 period.
After controlling for a set of labor market institutions and policies, innovation, financial development, and various dimensions of globalization, we provided, in line with the existing literature (Horbach and Rennigs [
1], 2013; Pociovălișteanu et al., 2015 [
2]; Connolly et al., 2016 [
3]; Kunapatarawong and Martínez-Ros, 2016 [
4]; Cecere and Mazzanti [
5], 2017) favorable evidence of a positive and statistically significant relationship between green energies and employment.
More precisely, the estimated semi-elasticities suggested that a 10% increase in the share of green energy led to a 0.3% increase in the amount of employees in the economy. This result has some relevant policy implications in terms of environment, sustainability, and labor market outcomes. It turns out that investing in new and green technologies not only represents an environmentally friendly policy which is fundamental for the sustainability of our economic systems, but creates new employment opportunities as well.
The empirical evidence presented in the following contribution clearly indicates that investments in green energy lead to a positive externality, represented by the creation of new matches in the labor market which are not limited to green jobs but to the labor market as a whole. This has beneficial effects on overall employment, therefore suggesting that is reasonable to implement public policies aimed at incentivizing firms to invest in green technologies. One possibility could be tax cuts or the provision of subsidies to firms that invest in green technologies to reduce fixed costs related to investments, so that firms might have an incentive to invest in new and clean activities with beneficial effects not only for the sustainability of the economic system, but for employment as a whole. Results presented in this paper further suggest that there are several implications for industries and governments.
We believe that governments should create the ideal conditions for firms, encouraging the application of green technologies, since in this way social welfare can be improved. In particular, governments could improve the quality of the environment which would provide widespread benefits to citizens and further improve working conditions, while firms could benefit from governmental policies in terms of reduced costs and increased productivity via the creation of new and productive matches.
Moreover, governments should also identify areas characterized by poor performances in terms of green energies produced and where there are lower incentives in investing in green energies, since the application of green technologies is costly and is not considered as profitable by individuals. Therefore, tailored policies for poor, less developed, and less technologically endowed areas would be desirable in order to reduce the opportunity cost generated by investments in new and costly technologies.
Nevertheless, the results presented in the paper further reveal that labor market reforms aimed at improving the efficiency of unemployment benefit protocols and removing wage rigidities in the market are desirable policies, since they might represent an obstacle for firms in creating new jobs, and policies where the goal is to ease the access to the credit market are desirable as well. Our analysis suggests that the higher the amount of credits provided to the private sector, the higher the level of employment, implying that credit constraints represent a major obstacle for firms in opening new vacancies and creating new employment opportunities.
Our analysis, however, is not immune to limitations. One possible limitation comes from the fact that consistent statistics for some labor market institutions and policies are not available after 2013, therefore preventing us from obtaining additional insights concerning the relationship studies. Moreover, to the best of our knowledge, no time series indicators of skill mismatches exist at the cross-country level and we believe that this variable is particularly relevant in explaining the dynamics of employment in modern labor markets.
Beside the limitations highlighted so far, future research should also consider the potential role of additional control on employment, most notably the inclusion in the econometric estimates of monetary aggregates, to capture the effects of monetary policies on relevant macro-variables like employment, changes in the demographic structure, which might affect both the composition and the amount of employees in the economy, and finally, factors like product market regulation, to understand whether less regulated economies are more efficient and whether they display a better ability in investing in green energies and creating new jobs.
Moreover, although the existing literature has considered how green investments affect the creation of new jobs, a possible concern is the effect of reverse causality, which has received little attention in the literature. The adoption of new technologies should be driven by positive shocks on economic activity which, in turn, may determine an increase in labor demand and, therefore, an increase in the amount of available vacancies and new employment opportunities.
It turns out the future research, given the complexity of the topic, sheds light on the direction of causality between green energies and employment, e.g., through the application of conventional Granger (1969) [
30] tests to assess whether new technologies determine an increase in economic activity or whether higher economic activity drives investments in new and green technologies.


