Abstract
With the purpose of limiting the drastically increasing quantity of travel volumes and the sustainability of urban traffic systems, many cities have implemented urban traffic restriction (UTR) policies. However, insufficient stakeholder involvement in UTR policy assessment often leads to a lack of social and political support, in addition to a lack of acceptability with respect to policy implementation. In this background, participatory system dynamics modeling (PSDM) is presented as a methodology to engage stakeholders in UTR policy assessment. By the proposed methodology, a comprehensive case study of UTR policy in the city of Xi’an was illustrated. Based on the assessment results, the leverage point influencing the performance of the UTR policy was identified and discussed, with different policy scenarios simulated and tested. The simulation results show that developing public transportation while implementing UTR policy was indicated as the most reasonable solution at the present stage, and the annual growth rate of private cars should be monitored in the future. The results confirmed that the PSDM methodology can facilitate the system thinking of stakeholders, which is important to reach consensus-based assessment results and to enhance the social support for UTR policy.
1. Introduction
Urban traffic restriction (UTR) policies are widely applied in cities with heavy traffic jams or air pollution problems. Some scholars claim that UTR policies are able to instantly increase the sustainability of traffic systems [1,2] and reduce motor vehicle emissions [3,4]. However, controversies still exist with regard to this policy, due to the involvement of complex scientific and technical issues. The wide array of stakeholders, as well as the value conflicts and social dynamics involved, mean that effective UTR measures are difficult to design and implement. Further, insufficient stakeholder involvement often leads to a lack of social and political support, as well as of acceptability for policy implementation [3,4,5,6,7], which lead in turn to policy failure and to a decrease of trust in the government. UTR policy tries to solve the problems whose social complexity means that it has no determinable stopping point. Moreover, because of complex interdependencies, the effort to solve one aspect of a problem may reveal or create other problems [8]. To solve these “wicked problems” [9], this paper argues that it is essential to engage the stakeholders in the policy assessment process.
This paper builds on, and contributes to earlier studies on UTR policy research; it presents a system dynamics (SD)-based model [10,11] and uses participatory system dynamics modeling (PSDM) to engage stakeholders to support a social and policy complexity assessment [12]. This model allows stakeholders to understand the influences between different variables and the long-term effects of policy [12]. Moreover, the modeling experience and communication process may improve social support and consensus between stakeholders.
We investigated a case from Xi’an, China, a city with a population of 10 million and more than 3 million vehicles [13,14]. Besides serious traffic jams, the exhaust gas of motor vehicles contributes about 21.4% of particulate matter (PM) 2.5 emissions, which is one of the main factors of air pollution [15]. UTR policies are related to green development and sustainable development issues in China, and correspondingly, UTR policy advocated by the government of Xi’an has two effects. The most important one is to reduce motor vehicle travel volume, and the other is to control motor vehicle emissions. The Transportation Bureau of Xi’an is the policy issuing department, and the Environmental Protection Bureau has become the most active supporter. UTR policy assessment and analysis has been implemented in Xi’an to public discontent, with various technical and social issues, e.g., with scientific foundations and fairness discussed.
This paper is structured as follows. Section 2 presents the proposed UTR policy and how SD was adopted in traffic policy assessments. In Section 3, the PSDM methodology is applied in a case study related to the UTR policy in the city of Xi’an, China as well as the simulation design. Section 4 presents the results of a consensus-based assessment between stakeholders through multiple rounds of communication. Finally, Section 5 presents the findings and draws the main conclusions.
2. Literature Review and Background
2.1. Urban Traffic Restriction Policy
The recent increase in environmental pollution and traffic congestion has negatively affected urban sustainable development. With an increasing number of vehicles on the road, the need to control urban traffic flow has become increasingly important in order to maximize safety and capacity, and to minimize both the time loss and air pollution associated with congestion [16]. In order to limit the drastically increasing quantity of private cars, travel volumes, and emissions, over the past few decades several cities have attempted to reduce the demand for car usage by implementing private car control policies within their territory [17,18].
These types of policies are called urban traffic restriction (UTR) policies [19]; they consist of strategies that aim to reduce travel volume and to control private car ownership. These policies are not new in the world. Buenos Aires, Caracas, Athens, Sao Paulo, Santiago, Mexico City, and other cities have already introduced driving restrictions to reduce automobile use. More recently, several large and growing Chinese cities, including Beijing, Tianjin, Changchun, Lanzhou, Hangzhou, Guiyang, and Chengdu, adopted traffic restriction policies to adjust trip volumes and reduce emissions. As recent practices in China show, UTR policies have been extended to include car plate restrictions, whereby vehicles are forbidden to be used on one or more weekdays, depending on plate numbers [20]. In this line, other Chinese cities are currently considering the introduction of such policies to control the rapid growth of cars and related traffic problems.
However, effective UTR measures are difficult to design and implement. UTR policies connected with social, economic, urban design, and environmental issues may have extensive impacts throughout the city. UTR policies are usually transplanted from other regions, or designed through static and empirical analyses, and this negatively affects both scientific foundations and practical results. Apart from technological problems, the lack of public support is usually recognized as one of the main obstacles to the achievement of the expected goals of UTR measures [3]. These measures are closely related to the vital interests of stakeholders, including government departments, ordinary citizens, corporate employees, bus and taxi drivers. Hence, the settlement of urban traffic problems can be understood as the consequence of both conflicting interests or values between stakeholders and the dilemmas present in the decision-making.
UTR policies may also lack the required social and political support, in addition to acceptability for policy implementation [3,4,6,21]. Jia et al. [3] took the restriction policy of Tianjin, China as an example, which indicated that lower acceptance may weaken the policy’s effectiveness. In addition, the main factors affecting the level of stakeholder acceptance of the policy were found, such as the perceived effectiveness, social norms, perceived cost-benefit, and different problem perceptions among stakeholders. Anciaes [22] analyzed the traffic restriction policy of Lisbon’s old city center, and pointed out that the reasons for social opposition and abandonment are constitute insufficient consideration of the terms of restriction policy in terms of the distribution to different social groups. Choocharukul et al. [23] compared the social acceptance and support of the restriction policy in Japan and Thailand to propose that different communicative strategies for different stakeholders should be effective in increasing the public acceptance of restriction policy measures. Overall, most of the research on restriction policy acceptance focuses on the post-acceptance and identification of their influencing factors, while few studies focus on the stakeholders’ involvement in the policy process to enhance social acceptance and social support. Unfortunately, there has been scant research on the social acceptance of stakeholders of UTR policies in China, even though such policies are currently being widely implemented.
Additionally, multi-variable regression and multi-actor multi-criteria analysis have been adopted in a few studies to determine stakeholder objectives and values, as well as the acceptance of traffic restriction policies. There is little evidence that the dynamic approach may demonstrate the complex dimensions and factors implied in UTR policies, this in turn encourages stakeholders’ participation to improve policy support. To fill this gap, system dynamics is an invaluable tool to show the complex interrelations between economic, social, and environmental elements [24,25,26]. Moreover, participatory system dynamics modeling has the potential to improve stakeholders’ participation in UTR policy assessment by providing a framework for structured deliberation, as well as a more transparent way to persuade them to help implement decisions.
2.2. System Dynamics Application in Traffic Policy Assessments
System dynamics (SD), proposed by J.W. Forrester in the early 1960s, is a methodology to help us to see the world as a set of unfolding behavior patterns, and to shift our focus from single pieces of a system [10]. Forrester developed world dynamics (WD) to present a preliminary version of a model to show the consequences of population and economic growth [27]. Under the direction of Dennis Meadows, and based on Forrester’s original, a more elaborate world model entitled “The Limits to Growth” (LTG) was built [28]. LTG is a popularized version of WD and a more complete explanation of the data used.
In the past several decades, cities have progressively absorbed a larger part of the human population. Especially, urban dynamics (UD) presented in the late 1960s is applied to model various elements of the metropolitan system to support the decision-making process. Erickson [29] developed an integrated urban transportation and land use model to simulate the choice behaviors that determine future population movement, employment opportunities, housing availability, and allocates these elements to zones. Haghani, Sang, and Byun [30] constructed a model based on the causality functions between a large number of physical, socioeconomic, and policy variables and tested it on a data set from Montgomery County.
Recently, SD modeling has also been employed as an effective learning tool for complex urban public policies in a number of areas such as environmental and sustainable development issues, welfare reform, education, and health. It captures real-world policy problems through a feedback structure for further discussion, debate, and consensus building. The construction of a system dynamics model follows the continuous progression of iterative and interconnecting steps, namely (1) system thinking; (2) problem definition; (3) conceptualization; (4) model formulation; (5) simulation; (6) policy analysis [12]. When implementing model-based recommendations in the real world, the modeling cycle will be closed.
Urban traffic problems are usually complex and dynamic, and SD has shown the capacity to solve urban traffic problems. Zhang [31] underlined the importance of studying urban traffic, energy consumption, and emissions by using the SD. Cao and Menendez [32] used SD to assess urban parking problems macroscopically. Stave [33] analyzed traffic and environmental problems in Las Vegas and indicated that SD has the potential to improve public participation in the decision-making process and solve complicated policy issues. MacDonald and Carpenter [34] developed an SD model to assess the trade-offs between programs, emphasizing education and enforcement in traffic safety management. Goh [35] used SD to simulate the interactions between driver, infrastructure, and vehicle to improve traffic safety policy. All these studies show the widespread and dynamic use of SD in traffic-related policy assessment; however, when the results of the scientific analyses are introduced into public policy, further efforts are needed.
As Lindblom [36] demonstrated, the complexity and multifaceted nature of policy make it particularly difficult for public managers to make decisions. Policy assessment, being characterized by multi-objectiveness and dynamic relevance, must present a comprehensive picture of the endogenous complexity of policies, including technical and value analysis. The formulation or implementation of policies sometimes triggers implicit or real conflicts in other fields [11], while some policy effects may appear only at a later stage. As a mechanism for the authoritative allocation of values, policies are a complex mixture of both social resources and values; hence, the pressure to involve a broader representation of the public in decision-making continues to increase. Scientific experts and city managers make decisions and then try to ‘‘tell people what is good for them’’ [37]; this in turn does not lead to wide and long-lasting support for these policies [38]. Therefore, the involvement of stakeholders in complex traffic policy assessment is urgent.
3. Research Design
3.1. Methodology Description
Participatory approaches are required in transport policy assessment [39,40] as different stakeholders play important roles and decision makers face the added challenge to enhance social support [41]. “Modeling with problem-owners” is a defining feature of the SD method [42,43], which allows for the identification of the values of a stakeholder-based modeling process at the earliest stages of its history. PSDM is a combination of public participation, system thinking, and simulation. It uses a system perspective to engage stakeholders in different stages of policy assessment, including problem definition, system description, the identification of policy levers, model development, and/or policy analysis. PSDM has been used on a variety of policy problems such as air quality, organizational change, and sustainable environmental management. Stave [12] describes four case studies using PSDM to incorporate diverse stakeholder knowledge, support stakeholder learning and changing environmental conditions. Weeks et al. [44] used group system dynamics modeling to enhance members’ communication and consensus, seek a deeper understanding of the system, and address problems in the system of HIV testing services. Schweiger et al. [45] showed how resistance affects organizational change, by providing a participatory system dynamics perspective. In addition, other models have been developed e.g., for water quantity and quality management [33,46,47,48], wildlife health [49], tourism management [50], as well as a social-ecological model of syndemic risk [51]. As the application of PSDM in these studies shows, model building and facilitated group problem solving emerge as two important processes in participatory modeling, which are both of great benefit to stakeholder participation and consensus building.
As shown in Figure 1, a generic participatory modeling methodology involves four main phases [12,52]. Moreover, understanding of the system developed during the modeling process contributes to social learning to build consensus [41,53]. The modeling and learning between stakeholders emphasize the rationality of the assessment results and the dynamic behavioral patterns, rather than simply emphasizing the predictive accuracy of the assessment results [54]. Hence, the correspondence between each phase and the stakeholders involved is highlighted, as well as the duration of each phase and the activities developed “behind the scenes.”
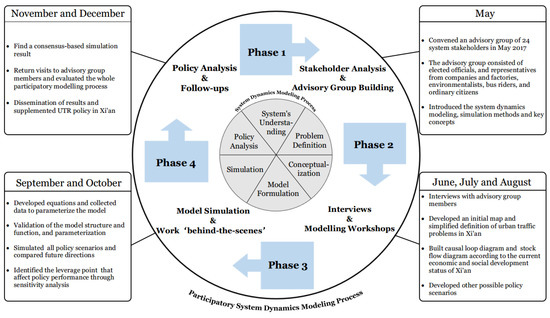
Figure 1.
Participatory system dynamics modeling of UTR Policy in Xi’an.
We used the methodology illustrated in Figure 1, based on the PSDM approach, in conjunction with the UTR policy assessment in order to engage stakeholder participation in Xi’an. The research was performed in four phases which are briefly described below. The chronology of model development and stakeholder interaction was summarized in Table A1.
3.1.1. Phase 1: Stakeholders Analysis and Advisory Group Building
Stakeholders are identified as social actors who are influenced by the outcome of a decision, or who have a strong interest in the outcome of policy [55]. In the first phase, we analyzed the stakeholders of the UTR Policy in Xi’an and invited them to form advisory groups. After a series of preparatory meetings between the Xi’an Transportation Bureau staff and our research team members, the relevant driving forces and pressures affecting the management of urban traffic problems and the restriction policy in Xi’an were identified.
In May 2017, we convened an advisory group of 24 stakeholders with the support of Xi’an Transportation Bureau and Xi’an Environmental Protection Bureau. They met once per month until December 2017 and performed activities such as problem identification, system conceptualization, model formulation, deliberative feedback, and scenarios assessment and simulation [56,57]. Except the two key bureaus mentioned above, representatives of the Public Security Bureau, the Development and Reform Commission, the Finance Bureau, the Municipal Bureau, the Science and Technology Bureau, the City Investment Group, the Urban Construction Committee, the Industrial and Commercial Bureau, the Urban Management Bureau, the Meteorology Bureau, the Price Bureau, and the Industry and Information Committee are involved in the advisory group. These group members had no particular knowledge of the modeling process and the system dynamics and had other full-time jobs. The aim of the group was to develop UTR policy recommendations to address the rapidly worsening and interconnected problems of urban traffic in Xi’an. We introduced the group members to the fundamental system dynamics modeling and to simulation methods, goals, and expected outcomes, as well as to the problems to be solved in the subsequent participatory system dynamics modeling.
3.1.2. Phase 2: Interviews and Modeling Workshops
At the beginning of the second phase, a comprehensive literature review was conducted, followed by exploratory interviews with policymakers, scholars, and citizens [42,53]. These interviews could help to set system boundaries and map stakeholder perceptions. Specifically, we conducted interviews with the advisory team members in June. Through the brainstorming method, the team members listed the factors and the causal links of traffic and related environmental problems in the city according to their own experience, and answered questions such as: “How do you think the traffic and environmental problems can be solved?” and “What are the key factors affecting the traffic and environmental governance in Xi’an?”. After the meeting, the research team sorted out and listed these opinions based on the answers. The interviews and the questionnaires provided valuable information to identify the problem to be solved and to capture the “mental model” of the stakeholders before participating in the modeling process.
Participatory modeling processes help to understand the diversity of public values, as these values are reflected in the modeling process through simulated “what-if” scenarios. At the end of the second phase, the government staff and the public were invited to develop other policy scenarios and try more possibilities (see Table 1).

Table 1.
Description of the policy scenarios considered.
3.1.3. Phase 3: Model Simulation and Work ‘behind-the-scenes’
Model parameters and equations were set in September and October with the collected data. The parameter values are shown in Table A2. Additionally, we tested the validity of the SD model and discussed the changes in several meetings with group members. Based on these ‘behind-the-scenes’ activities such as developing detailed scripts for the workshop activities, collecting historical data on the variables represented in the system dynamics model, identifying interrelationships between problems, improving reference patterns, and model validation and testing, all the elements of the model have been formalized to show behavior over a time range.
Reducing the total travel volume of urban motor vehicles is the most important goal of the UTR policy in Xi’an. Therefore, in the third phase, we first simulated the model with this goal, and then we assessed the policy leverage point with sensitivity analysis and the overall trends of the policy scenarios selected by the advisory group members. The specific simulation design is presented in Section 3.2.
3.1.4. Phase 4: Policy Analysis and Follow-ups
In phase 4, the participatory modeling process was concluded with a series of dissemination and evaluation activities. The PSDM methodology aims to further refine the UTR policy, better solve the urban traffic and related environmental problems in Xi’ an, and enhance social support. Therefore, in this last phase, the assessment results should be returned to the stakeholders for consideration and review. Specifically, after simulating and assessing the trends of the policy scenarios, we did not identify directly the optimal solution, but presented again these results to the advisory group members, asking them to find consensus over the assessment results based on policy costs, implementation possibilities, potential risks, and public satisfaction.
After the end of the workshops and the meetings, we summarized and reviewed the results to gain insight into the impact of the whole PSDM process, along with the following four aspects [48]: (1) Is the PSDM methodology useful? (2) Does this process promote social learning and mutual trust building? (3) Does the participatory process improve communication and promote consensus? (4) Are the assessment results available in the real world? Have the UTR policy problems in Xi’an been alleviated? Follow-ups actions included the dissemination of the policy assessment results. To this end, our research team reported the results to the government departments for UTR policy improvement.
3.2. Simulation Design
Before July 2017, our research team held several meetings with advisory group members to brainstorm the key challenges in this case. According to their insights/knowledge, group members presented the following solutions: adding more roads, optimizing urban layout, encouraging public participation in green commuting, as well as reducing the motor vehicle travel volume and travel time (hexagons in Figure 2a). Solutions can be divided into five main problem dimensions including traffic flow, traffic volume, air quality, public transportation and public participation (circles in Figure 2a). This diagram was used to facilitate further discussion about how the system works, and it was eventually simplified by the advisory group into three problem dimensions and measures (circles in Figure 2b). The simplified definition of problems including improve air quality, reduce travel volume and develop public transportation, which covered important concerns from the Transportation Bureau, the Environmental Protection Bureau and the public. Simplified problems can be measured by the SD model, and related to specific policies.
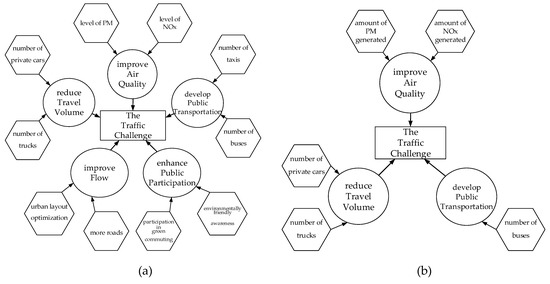
Figure 2.
Definition of problems. (a) Initial map of problem dimensions and measures; (b) Simplified map of problem dimensions and measures.
In the subsequent several months, our research team worked with the advisory group as shown in Table A1, to confirm that our representation of the system was reasonable and to collect data to parameterize the model from government departments (see Table A2). We also came to advisory group meetings as observers and to respond to any questions that came up in the discussion.
Based on problem dimensions and measures, Figure 3 shows the causal loop of urban traffic system models. As the objective of UTR policy in Xi’an, the total travel volume of urban motor vehicles is determined by the number of private cars, buses, and trucks. Traffic congestion is influenced by the total travel volume of urban motor vehicles, public transportation, and road capacity. UTR policy will limit the total travel volume of urban motor vehicles and stimulate the willingness of purchasing a second private car. An increase in traffic congestion, which in turn stimulates energy consumption and traffic pollutant emissions including nitrogen oxides (NOx) and PM. Increasing environmental pollution will reduce the city’s GDP; then decreasing GDP inhibited private car purchases, urban logistic development, and transport investment. The promotion of the city’s GDP will increase transportation investment, including public transport and road construction. The increase in the number of buses and the enhancement of road capacity will alleviate traffic congestion and thus reduce traffic emissions. The number of taxis accounts for a small proportion of the total urban motor vehicles in Xi’an; therefore, the number of taxis was not considered in the system model.
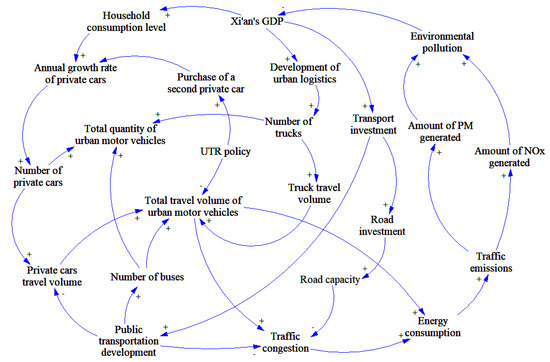
Figure 3.
Causal Loop Diagram.
The Stock flow diagram (see Figure 3) is normally used to show dynamic processes and clearly illustrate the accumulation effect between variables. The system dynamics simulation software Vensim DSS (www.vensim.com) was used to establish the system‘s stock flow diagram; results are shown in Figure 4. The model ran from 2016 to 2030.
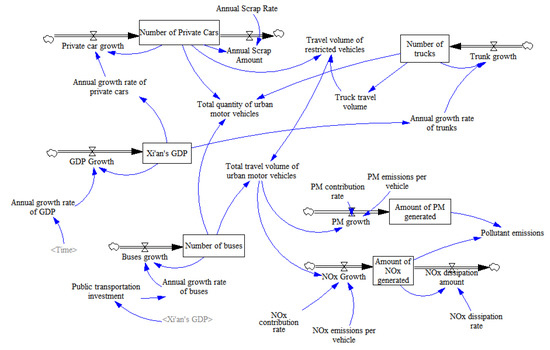
Figure 4.
Stock Flow Diagram.
As Forrester [58] argued, system dynamics models rely on three sources of information: numerical data, written databases (reports, operations manuals, published works, etc.), and expert knowledge of the key participants in the system. Based on this, in the simulation process, we used the official economic and social development statistics of Xi’an as the system input and as the basis for the variables and the parameters. The main sources of data used include the following: Xi’an Statistical Yearbook; China Urban Statistical Yearbook; Statistics Bulletin of the National Economic and Social Development of Xi’an; Report on the State of Xi’an’s Environment; Annual Report on Motor Vehicle Pollution Prevention and Control in Xi’an; and the Comprehensive Xi’an Transportation System Planning.
In order to verify whether the model could reflect the essential characteristics of the real world, we make simulations of beginning from the year of 2010 to make comparisons with statistical data of 2016. Xi’an’s GDP, amount of NOx generated, and number of trucks were selected as test variables to make comparisons and subsequently examine.
As can be seen from the results in Table 2, the deviation of Xi’an’s GDP, Amount of NOx generated and Number of trucks were all within ±3%, which is quite reliable. Therefore, the model can be used to analyze the long-term effects of UTR policy in Xi’an.
Table 2.
Results of model validation.
4. Results and Discussions
Two types of analysis were established for the components of the urban traffic system in Xi’an. First, we assessed what will happen to the system if the pattern of behavior continues over time, with all possible scenarios proposed in Table 1. Second, we performed a sensitivity analysis to recognize the key variables that will affect the system behavior.
4.1. Assessment Results
Reducing the total travel volume of urban motor vehicles is the objective of UTR policy in Xi’an, after assessing each policy scenario proposed by the advisory group members, their future trends were compared and visualized. The results are shown in Figure 5.
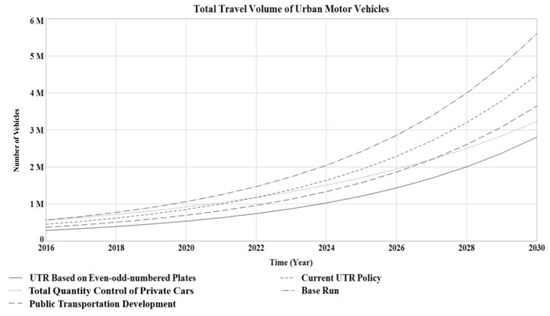
Figure 5.
Total travel volume of urban motor vehicles in all policy scenarios.
The base run of the model represents a scenario where without taking any policy measures. According to the results, the total travel volume of motor vehicles in Xi’an may continue to rise from 0.57 million units in 2016 to 5.6 million units in 2030. This unlimited rise is unmatched with urban capacity and will bring a huge press to society and the environment. The Base Run outcome helps group numbers to understand how serious the urban traffic problem is, and call them to action for related policy issues.
The current UTR Policy represents a scenario where the travel of motor vehicles is restricted according to the last number of car plates, whereby two numbers are restricted every day. Under this scenario, the total travel volume of motor vehicles in Xi’an will be 4.48 million by 2030. In the Public Transportation Development scenario, the number of buses will increase while the UTR policy will be implemented, in order to improve bus travel sharing ratio and reduce travel volume. In 2030, under this scenario, the total travel volume of motor vehicles in Xi’an will be 3.67 million. The total quantity control of private cars represents a series of traffic demand management policies that aim to reduce private car usage and to control private car ownership, such as car license plate lottery/license plate auction policies. Under this scenario, the reduction of travel volume before 2021 is not as good as in the current UTR Policy. It is also not as effective as the public transportation development scenario until 2027. However, the total travel volume of motor vehicles gradually diminished over time, at 3.23 million units in 2030. Finally, the UTR based on even and odd-numbered license plates, whereby five car plate numbers are restricted every day, is the more effective strategy in the long-term, with 2.81 million cars expected to circulate in 2030.
4.2. Sensitivity Analysis
In previous meetings, the advisory team members mentioned that after the introduction of the UTR policy in Xi’an, citizens had a strong willingness to purchase a second private car with a different plate tail number, so as to cope with the inconvenience caused by the UTR policy. However, the purchase of a second private car will stimulate the annual growth rate of private cars, which will greatly weaken the effect of the restriction policy. This problem enables us to observe that the annual growth rate of private cars is affecting the total travel volume, an issue that has been analyzed more deeply in the sensitivity analysis.
The sensitivity analysis considered variables that influence system behavior [59]. As Meadows [60] observed, in a sensitivity analysis the value of a small shift in one variable can create considerable changes in the whole system performance, this is called a leverage point. For this reason, the annual growth rate of private cars was adjusted to be in the interval [0.2, 0.25] by using Vensim DSS, so to obtain the leverage point at 22.41%. As shown in Figure 6, after UTR policy causes the annual growth rate of private cars to increases from 20% to 22.41%, the travel volume caused by the purchase of a second car will reach 5.85 million by 2030, surpassing the current UTR policy of 1.37 million units. A more serious implication of this result is that the travel volume will exceed even the base run in 2028. In the long run, the purchase of a second car aggravates road congestion and vehicle emissions in Xi’an, thus deviating from the original goals of the UTR policy.
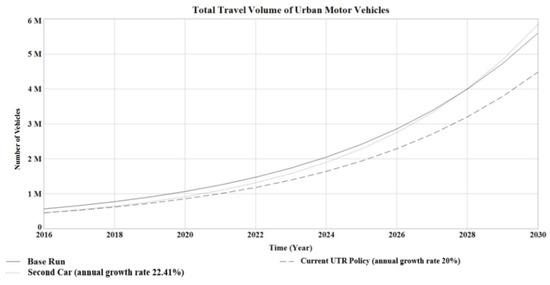
Figure 6.
Sensitivity analysis results for the annual growth rate of private cars.
4.3. Follow-Ups
The results of the assessment were illustrated to the advisory group members in November and December 2017, for further discussion and to find the consensus-based solution. After the whole participatory modeling process, all advisory group members begin to analyze traffic challenges and problems in Xi’an with a more systematic scale. Advisory group members used to talk about problems by their personal experiences, had only a rough understanding of the influences between different traffic-related problems and long-term outcomes. The participatory modeling process helped to reach member’s widely disparate concerns together into a workable problem definition and makes the discussion focused on systemic policy options. A manager from the Xi’an Transportation Bureau was impressed by the modeling process helped him to get a bigger picture of the problem, remarking that “this is an interrelated issue, it has a wider impact on citizen’s lives, and [is] related to traffic policy we use to release. The participatory modeling process makes me think more systematic”.
During this process, stakeholders’ concerns are valued more than in the beginning. Group members argued that convenient public transport is important if UTR policy was released, and that public feelings should be respected. All members reached a consensus that a mixed UTR policy was preferred. Although the assessment result of public transport development was at an intermediate level in Figure 5, increasing the number of buses while implementing the UTR policy would have a stronger positive externality and less opposition in the implementation process.
Group members also pointed that the control of the total quantity of private cars, for example through a car license plate lottery or license plate auction policies, involves consumer rights and property rights of the public, and its policy effect is not clear in the short term. For this reason, they agreed that it is not advisable to start immediately without an extensive demonstration of the effectiveness of the envisaged measures. Moreover, they also pointed out that a UTR based on even-odd-numbered plates can be considered as an emergency measure. Additionally, based on the results of the sensitivity analysis, they advised that the annual growth rate of private cars should be monitored in the future. In this way, a consensus has been established on the assessment results among the advisory group members.
Finally, the assessment result and consensus-based solution were disseminated and promoted. Our research team submitted them to the Xi’an Municipal Government, after which Xi’an introduced the latest implementation notice of its UTR policy in late 2018, which explicitly proposed in the official policy documents to monitor the annual growth rate of private cars and prioritize the development of public transportation. In early 2019, we observed the traffic and environmental problems in Xi’an have been greatly alleviated. For example, the congestion index in Xi’an dropped by 13.1% compared with before the implementation of the UTR policy. In addition, the days of heavily polluted weather in 2018 decreased by 26 days compared with 2017 [61]. In a return visit of the advisory group members, they believed the support to policy measures, such as restriction policy and public transportation priority strategy, was rising. Besides, we also conducted interviews on the PSDM process, they were satisfied with the openness of discussions, and the diversity of stakeholder representation. It was possible to establish a better understanding of feedback and refinement.
5. Conclusions
This paper presents a participatory system dynamics modeling of the urban traffic restriction policy in Xi’an. Our research allows stakeholders to understand the influences between the different variables that describe the system, and the impact of the urban traffic restriction policy. Furthermore, we assessed and simulated different UTR policy scenarios and identified the leverage point. Finally, a consensus was reached among stakeholders with respect to the assessment results. Based on a consideration of the impacts of the scenarios, and on the discussion of the assessment results among stakeholders, we conclude that the most reasonable option for Xi’an is to foster public transportation development while implementing the current UTR policy. The sensitivity analysis showed that the annual growth rate of private cars should also be monitored.
The results show that participatory system dynamics modeling methodology is of great help to provides stakeholders with an effective and structured platform to see their views put into action, and to enhance consensus on complex public policy. Firstly, stakeholders were selected and invited to the participatory modeling process. After conducting a comprehensive literature review and interviews with policy-makers and researchers, we developed a preliminary list of stakeholders and invited them to form an advisory group. Some of them were directly involved in the early formulation and implementation of the UTR policy, while others had opinions and suggestions on the policy. These stakeholders were willing to dedicate time to improve urban traffic problems in Xi’an without remuneration and were happy to learn about modeling and system thinking. Secondly, a series of interviews were conducted to elicit stakeholders’ views to form the SD model. The problem dimensions were gradually refined through multiple modeling workshops, and the main variables and the causal interrelationships needed for model construction were clarified. Through several discussions, the causal loop diagram and a stock-flow diagram were constructed and used as a platform for virtual experimentation with different “what-if” long-term policy scenarios. Overall, this phase facilitated an open exploration of the issue, and different perspectives helped the SD model simulation and identification of the leverage point. Thirdly, policy application, dissemination, and follow-up activities were performed as the last phase of the participatory system dynamics modeling process. After assessing and comparing trends in policy scenarios, we considered that the optimal solution should not be to deliver a direct output, but to provide again the assessment results to the stakeholders, asking them to find consensus and the most reasonable results, based on potential policy risks and public satisfaction.
Overall, the participatory modeling process is a sustainable way of reducing the hindrances of confrontation and execution caused by the different perceptions of stakeholders. Moreover, both researchers and practitioners in other cities with similar traffic restriction policies can use the participatory system dynamics modeling method to provide a platform for stakeholders such as governments, experts, and the public, to develop a collective definition of the problem, identify the most critical criteria for determining consensus-based solutions, organize and connect a large amount of seemingly unrelated criteria new to most of the stakeholders, keep track of where the process is going, set boundaries for the types of policy scenario that are possible, document the activity of the advisory group, identify and assess policy scenarios, perform social learning, as well as enhance social support for the UTR policy.
Author Contributions
J.S. and X.G. conceptualized and designed the study. J.S. and X.H. conducted the data analyses and drafted the manuscript. X.G. contributed in supervising the paper writing, reviewing and revising the manuscript. All the authors contributed to collecting data and approved the final version of the manuscript.
Funding
This research was funded by the National Social Science Fund of China (No. 16BZZ052; No. 19AZZ007); China Postdoctoral Science Foundation Grant (No. 2019M653686); and China Scholarship Council. An early version of the paper was presented in 2019 Annual Conference of American Society of Public Administration in Washington DC, USA.
Conflicts of Interest
The authors declare no conflict of interest.
Appendix A
Table A1.
Chronology of model development and stakeholders’ interaction.
Table A1.
Chronology of model development and stakeholders’ interaction.
| Date | Advisory Group Meeting Agenda | Research Team Agenda |
|---|---|---|
| May 25 | 1. Interviewed with the team members 2. Introduced the system dynamics modeling, simulation methods and key concepts | 1. Problem definition 2. Collection and analysis of relevant policy documents |
| June 28 | 1. Used brainstorming to list the factors and causal links of the traffic and environmental problems | 1. Opinion collection on social media 2. Key variables identification |
| July 21 | 1. Presenting the initial map of problems to the members (Figure 2a) 2. Ask the officials and the public separately explain different views of UTR policy 3. Developed other possible policy scenarios (See Table 1) | 1. Identified the cognitive differences between the officials and the public 2. Simplified Figure 2a |
| August 24 | 1. Simplified the problem dimensions in Figure 2a to the three problem dimensions and measures in Figure 2b | 1. Converted problem dimensions and measures into system models; Key variables mapped in relation to each other 2. Initial construction of the causal loop and stock flow diagrams |
| September 28 | 1. Presented causal loop and stock flow diagrams to group members, and modified them according to the current economic and social development status of Xi’an 2. Validation of the model structure and function, and parameterization | 1. Collected data such as yearbooks, development plans and communique 2. Developed equations |
| October 27 | 1. Determined the simulation time step, initial and final time, etc. | 1. Assessed all policy scenarios |
| November 21 | 1. Compared directions of policy scenarios listed in Table 1 2. Analyzed the risks, advantages, and disadvantages of each policy scenario | 1. Identified the leverage points that affect policy future direction through sensitivity analysis |
| December 21 | 1. Find a consensus-based assessment result to improve social support of UTR policy and better solve the environmental and traffic problems in Xi’an |
Table A2.
Parameters values.
Table A2.
Parameters values.
| Parameter | Meaning | Value | Unit |
|---|---|---|---|
| PM Contribution Rate | The percentage of exhaust gas of motor vehicles to total PM emissions each year. | 0.21 | — |
| NOx Contribution Rate | The percentage of exhaust gas of motor vehicles to total NOx emissions each year. | 0.5 | — |
| NOx Dissipation Rate | The percentage of NOx lost and dissipate in the air each year. | 0.28 | — |
| NOx Emissions Per Vehicle | The average amount of NOx emitted per vehicle per year (Note: it is the average state of all types of vehicles) | 20 | Kg |
| Annual Growth Rate of Private Cars | 0.2 | — | |
| Annual Growth Rate of Trunks | 0.11 | — | |
| Annual Scrap Rate | 0.01 | — |
References
- University of California Transportation Center. Road Pricing for Congestion Management: The Transition from Theory to Policy. 1998. Available online: https://escholarship.org/uc/item/8kk909p1 (accessed on 17 June 2019).
- Small, K.A.; Verhoef, E.T.; Lindsey, R. The Economics of Urban Transportation; Routledge: London, UK, 2007. [Google Scholar]
- Jia, N.; Zhang, Y.; He, Z.; Li, G. Commuters’ acceptance of and behavior reactions to license plate restriction policy: A case study of Tianjin, China. Transp. Res. Part D Transp. Environ. 2017, 52, 428–440. [Google Scholar] [CrossRef]
- Yang, H.; Sun, L.; Lan, S.; Yang, C. Freight group behavior under freight traffic restriction policy: The case of Beijing city distribution. Ind. Manag. Data Syst. 2017, 117, 2287–2304. [Google Scholar] [CrossRef]
- Eriksson, L.; Garvill, J.; Nordlund, A.M. Acceptability of travel demand management measures: The importance of problem awareness, personal norm, freedom, and fairness. J. Environ. Psychol. 2006, 26, 15–26. [Google Scholar] [CrossRef]
- Eriksson, L.; Garvill, J.; Nordlund, A.M. Acceptability of single and combined transport policy measures: The importance of environmental and policy specific beliefs. Transp. Res. Part A Policy Pract. 2008, 42, 1117–1128. [Google Scholar] [CrossRef]
- Gärling, T.; Jakobsson, C.; Loukopoulos, P.; Fujii, S. Acceptability of road pricing. In Pricing in Road Transport: A Multi-Disciplinary Perspective; Verhoef, E., Bliemer, M., Steg, L., Eds.; Edward Elgar Publishing: Gloucestershire, UK, 2008; pp. 193–208. [Google Scholar]
- Tonkinwise, C. Design for transitions–from and to what? Des. Philos. Pap. 2015, 13, 85–92. [Google Scholar] [CrossRef]
- Churchman, C.W. Guest Editorial: Wicked Problems. Manag. Sci. 1967, 14, B141–B142. [Google Scholar]
- Forrester, J.W. Industrial Dynamics; Pegasus Communications Inc.: Waltham, MA, USA, 1961. [Google Scholar]
- Ghaffarzadegan, N.; Lyneis, J.; Richardson, G.P. How small system dynamics models can help the public policy process. Syst. Dyn. Rev. 2011, 27, 22–44. [Google Scholar] [CrossRef]
- Stave, K. Participatory system dynamics modeling for sustainable environmental management: Observations from four cases. Sustainability 2010, 2, 2762–2784. [Google Scholar] [CrossRef]
- The Permanent Population of Xi’an Reached 10.37 Million by the End of 2018. Available online: http://sn.ifeng.com/a/20190319/7287647_0.shtml (accessed on 17 June 2019). (In Chinese).
- The Number of Motor Vehicles in Xi’an has Exceeded 3 Million. Available online: http://news.xiancity.cn/system/2018/03/22/030558899.shtml (accessed on 17 June 2019). (In Chinese).
- What is the Contribution of Xi’an Motor Vehicle Exhaust to PM2.5? Available online: http://www.sohu.com/a/124017704_351303 (accessed on 12 July 2019). (In Chinese).
- Hamilton, A.; Waterson, B.; Cherrett, T.; Robinson, A.; Snell, I. The evolution of urban traffic control: Changing policy and technology. Transp. Plan. Technol. 2013, 36, 24–43. [Google Scholar] [CrossRef]
- Gärling, T.; Eek, D.; Loukopoulos, P.; Fujii, S.; Johansson-Stenman, O.; Kitamura, R.; Pendyala, R.; Vilhelmson, B. A conceptual analysis of the impact of travel demand management on private car use. Transp. Policy 2002, 9, 59–70. [Google Scholar] [CrossRef]
- Friman, M.; Larhult, L.; Gärling, T. An analysis of soft transport policy measures implemented in Sweden to reduce private car use. Transportation 2013, 40, 109–129. [Google Scholar] [CrossRef]
- Carvalho, L.; Mingardo, G.; Van Haaren, J. Green urban transport policies and cleantech innovations: Evidence from Curitiba, Göteborg and Hamburg. Eur. Plan. Stud. 2012, 20, 375–396. [Google Scholar] [CrossRef]
- Wang, L.; Xu, J.; Qin, P. Will a driving restriction policy reduce car trips? —The case study of Beijing, China. Transp. Res. Part A Policy Pract. 2014, 67, 279–290. [Google Scholar] [CrossRef]
- Vermote, L.; Macharis, C.; Boeykens, F.; Schoolmeester, C.; Putman, K. Traffic-restriction in Ramallah (Palestine): Participatory sustainability assessment of pedestrian scenarios using a simplified transport model. Land Use Policy 2014, 41, 453–464. [Google Scholar] [CrossRef]
- Anciaes, P.R. Area-wide traffic restriction in Lisbon city center: Opportunity lost or mistake avoided? Transp. Res. Procedia 2015, 8, 237–246. [Google Scholar] [CrossRef]
- Choocharukul, K.; Van, H.T.; Fujii, S. Psychological determinants of moral obligation of car use reduction and acceptance of car use restriction in Japan and Thailand. IATSS Res. 2006, 30, 70–76. [Google Scholar] [CrossRef]
- Kim, Y.; Johnston, E.W.; Kang, H. A computational approach to managing performance dynamics in networked governance systems. Public Perform. Manag. Rev. 2011, 34, 580–597. [Google Scholar] [CrossRef]
- Ghaffarzadegan, N.; Andersen, D.F. Modeling behavioral complexities of warning issuance for domestic security: A simulation approach to develop public management theories. Int. Public Manag. J. 2012, 15, 337–363. [Google Scholar] [CrossRef]
- Espinoza, A.; Bautista, S.; Narváez, P.; Alfaro, M.; Camargo, M. Sustainability assessment to support governmental biodiesel policy in Colombia: A system dynamics model. J. Clean. Prod. 2017, 141, 1145–1163. [Google Scholar] [CrossRef]
- Forrester, J.W. World Dynamics; Wright-Allen Press: Lawrence, KS, USA, 1971. [Google Scholar]
- Meadows, D.; Randers, J.; Meadows, D. The Limits to Growth: The 30-Year Update; Chelsea Green Publishing: Hartford, VT, USA, 2004. [Google Scholar]
- Erickson, D.J. Integrated Urban Transportation and Land Use Modeling by Application of System Dynamics. Ph.D. Thesis, Virginia Polytechnic Institute and State University, Blacksburg, VA, USA, 16 January 1995. [Google Scholar]
- Haghani, A.; Lee, S.Y.; Byun, J.H. A system dynamics approach to land use/transportation system performance modeling part I: Methodology. J. Adv. Transp. 2003, 37, 1–41. [Google Scholar] [CrossRef]
- Zhang, Y.; Wan, L.J.; Zhang, L.; Cheng, D.X. Forecast of Energy Consumption and Carbon Emission of Urban Traffic by Using System Dynamics. Adv. Mater. Res. 2014, 989, 1248–1251. [Google Scholar] [CrossRef]
- Cao, J.; Menendez, M. System dynamics of urban traffic based on its parking-related-states. Transp. Res. Part B Methodol. 2015, 81, 718–736. [Google Scholar] [CrossRef]
- Stave, K.A. Using system dynamics to improve public participation in environmental decisions. Syst. Dyn. Rev. J. Syst. Dyn. Soc. 2002, 18, 139–167. [Google Scholar] [CrossRef]
- MacDonald, R.; Carpenter, K. Reducing Traffic Safety Deaths: A System Dynamics Perspective. In Proceedings of the 16th International Conference of the System Dynamics Society, Québec City, QC, Canada, 20–23 July 1998; Volume 98. [Google Scholar]
- Goh, Y.M.; Love, P.E. Methodological application of system dynamics for evaluating traffic safety policy. Saf. Sci. 2012, 50, 1594–1605. [Google Scholar] [CrossRef]
- Lindblom, C.E. The science of muddling through. Public Adm. Rev. 1959, 19, 79–88. [Google Scholar] [CrossRef]
- Johnson, P.T. How I turned a critical public into useful consultants. Harv. Bus. Rev. 1993, 71, 56–64. [Google Scholar]
- Walesh, S.G. Dad is out, pop is in. J. Am. Water Resour. Assoc. 1999, 35, 535–544. [Google Scholar] [CrossRef]
- Marcucci, E.; Le Pira, M.; Gatta, V.; Inturri, G.; Ignaccolo, M.; Pluchino, A. Simulating participatory urban freight transport policy-making: Accounting for heterogeneous stakeholders’ preferences and interaction effects. Transp. Res. Part E Logist. Transp. Rev. 2017, 103, 69–86. [Google Scholar] [CrossRef]
- Fouracre, P.; Sohail, M.; Cavill, S. A participatory approach to urban transport planning in developing countries. Transp. Plan. Technol. 2006, 29, 313–330. [Google Scholar] [CrossRef]
- Videira, N.; Antunes, P.; Santos, R.; Lopes, R. A participatory modeling approach to support integrated sustainability assessment processes. Syst. Res. Behav. Sci. 2010, 27, 446–460. [Google Scholar] [CrossRef]
- Rouwette, E.A.; Vennix, J.A. System dynamics and organizational interventions. Syst. Res. Behav. Sci. 2006, 23, 451–466. [Google Scholar] [CrossRef]
- Lane, D.C. The power of the bond between cause and effect: Jay Wright Forrester and the field of system dynamics. Syst. Dyn. Rev. 2007, 23, 95–118. [Google Scholar] [CrossRef]
- Weeks, M.R.; Li, J.; Lounsbury, D.; Green, H.D.; Abbott, M.; Berman, M.; Rohena, L.; Gonzalez, R.; Lang, S.; Mosher, H. Using participatory system dynamics modeling to examine the local HIV test and treatment care continuum in order to reduce community viral load. Am. J. Community Psychol. 2017, 60, 584–598. [Google Scholar] [CrossRef]
- Schweiger, A.K.; Cavender-Bares, J.; Townsend, P.A.; Hobbie, S.E.; Madritch, M.D.; Wang, R.; Tilman, D.; Gamon, J.A. Plant spectral diversity integrates functional and phylogenetic components of biodiversity and predicts ecosystem function. Nat. Ecol. Evol. 2018, 2, 976–982. [Google Scholar] [CrossRef]
- Guidi, G.C.; Poli, G.; Bassi, A.; Giobelli, L.; Benetollo, P.P.; Lippi, G. Development and implementation of an automatic system for verification, validation and delivery of laboratory test results. Clin. Chem. Lab. Med. 2009, 47, 1355–1360. [Google Scholar] [CrossRef]
- Schmitt Olabisi, L.K.; Kapuscinski, A.R.; Johnson, K.A.; Reich, P.B.; Stenquist, B.; Draeger, K.J. Using scenario visioning and participatory system dynamics modeling to investigate the future: Lessons from Minnesota 2050. Sustainability 2010, 2, 2686–2706. [Google Scholar] [CrossRef]
- Beall, A.; Fiedler, F.; Boll, J.; Cosens, B. Sustainable water resource management and participatory system dynamics. Case study: Developing the Palouse basin participatory model. Sustainability 2011, 3, 720–742. [Google Scholar] [CrossRef]
- Semeniuk, C.A.; Haider, W.; Cooper, A.; Rothley, K.D. A linked model of animal ecology and human behavior for the management of wildlife tourism. Ecol. Model. 2010, 221, 2699–2713. [Google Scholar] [CrossRef]
- Pizzitutti, F.; Walsh, S.J.; Rindfuss, R.R.; Gunter, R.; Quiroga, D.; Tippett, R.; Mena, C.F. Scenario planning for tourism management: A participatory and system dynamics model applied to the Galapagos Islands of Ecuador. J. Sustain. Tour. 2017, 25, 1117–1137. [Google Scholar] [CrossRef]
- Batchelder, A.; Gonzalez, J.; Palma, A.; Schoenbaum, E.; Lounsbury, D.W. A social ecological model of syndemic risk affecting women with and at-risk for HIV in impoverished urban communities. Am. J. Community Psychol. 2015, 56, 229–240. [Google Scholar] [CrossRef]
- Sedlacko, M.; Martinuzzi, A.; Røpke, I.; Videira, N.; Antunes, P. Participatory systems mapping for sustainable consumption: Discussion of a method promoting systemic insights. Ecol. Econ. 2014, 106, 33–43. [Google Scholar] [CrossRef]
- Van den Belt, M.; Dietz, T. Mediated Modeling: A System Dynamics Approach to Environmental Consensus Building; Island Press: Washington, DC, USA, 2013. [Google Scholar]
- Kelly, R.A.; Jakeman, A.J.; Barreteau, O.; Borsuk, M.E.; ElSawah, S.; Hamilton, S.H.; Henriksen, H.J.; Kuikka, S.; Maier, H.R.; Rizzoli, A.E.; et al. Selecting among five common modelling approaches for integrated environmental assessment and management. Environ. Model. Softw. 2013, 47, 159–181. [Google Scholar] [CrossRef]
- Beierle, T.C.; Cayford, J. Evaluating Dispute Resolution as an Approach to Public Participation. In Resources for the Future; AgEcon Search: Washington, DC, USA, 2001; pp. 1–40. [Google Scholar]
- Martinez-Moyano, I.J.; Richardson, G.P. Best practices in system dynamics modeling. Syst. Dyn. Rev. 2013, 29, 102–123. [Google Scholar] [CrossRef]
- Sabounchi, N.S.; Triantis, K.P.; Sarangi, S.; Liu, S. Dynamic simulation modeling and policy analysis of an area-based congestion pricing scheme for a transportation socioeconomic system. Transp. Res. Part A Policy Pract. 2014, 59, 357–383. [Google Scholar] [CrossRef]
- Forrester, J.W. Information sources for modeling the national economy. J. Am. Stat. Assoc. 1980, 75, 555–566. [Google Scholar] [CrossRef]
- Liu, X.; Ma, S.; Tian, J.; Jia, N.; Li, G. A system dynamics approach to scenario analysis for urban passenger transport energy consumption and CO2 emissions: A case study of Beijing. Energy Policy 2015, 85, 253–270. [Google Scholar] [CrossRef]
- Meadows, D.H. Leverage Points. Places to Intervene in a System; The Sustainability Institute: Hartland, VT, USA, 1999. [Google Scholar]
- How Big is the Change Brought by UTR Policy to Xi’an? Available online: https://www.baidu.com/link?url=nqLYumCV4qM1Sj9gE1gS11FvAdydPeqMAo2Uk00krCjYsQE2Ol0Ooi9MZBzDDUleghMWEDkUgfT52JNyqKfcR_&wd=&eqid=f3b19635005aaa74000000035d20c2fe (accessed on 12 July 2019). (In Chinese).
© 2019 by the authors. Licensee MDPI, Basel, Switzerland. This article is an open access article distributed under the terms and conditions of the Creative Commons Attribution (CC BY) license (http://creativecommons.org/licenses/by/4.0/).