Mapping Obesogenic Food Environments in South Africa and Ghana: Correlations and Contradictions

 , , , , , , , , , , and
Abstract
1. Introduction
1.1. Obesogenic Food
1.2. Changing Food Retail Environments
1.3. Food Environments in South Africa and Ghana
1.4. Framing Food Environments as Objects of Governance
1.5. Research Question
2. Materials and Methods
2.1. Sites, Instruments and Analysis
2.2. Analysis
2.3. Food Outlet Typology
2.4. Obesogenic Food Consumption and Provision Indices
3. Results
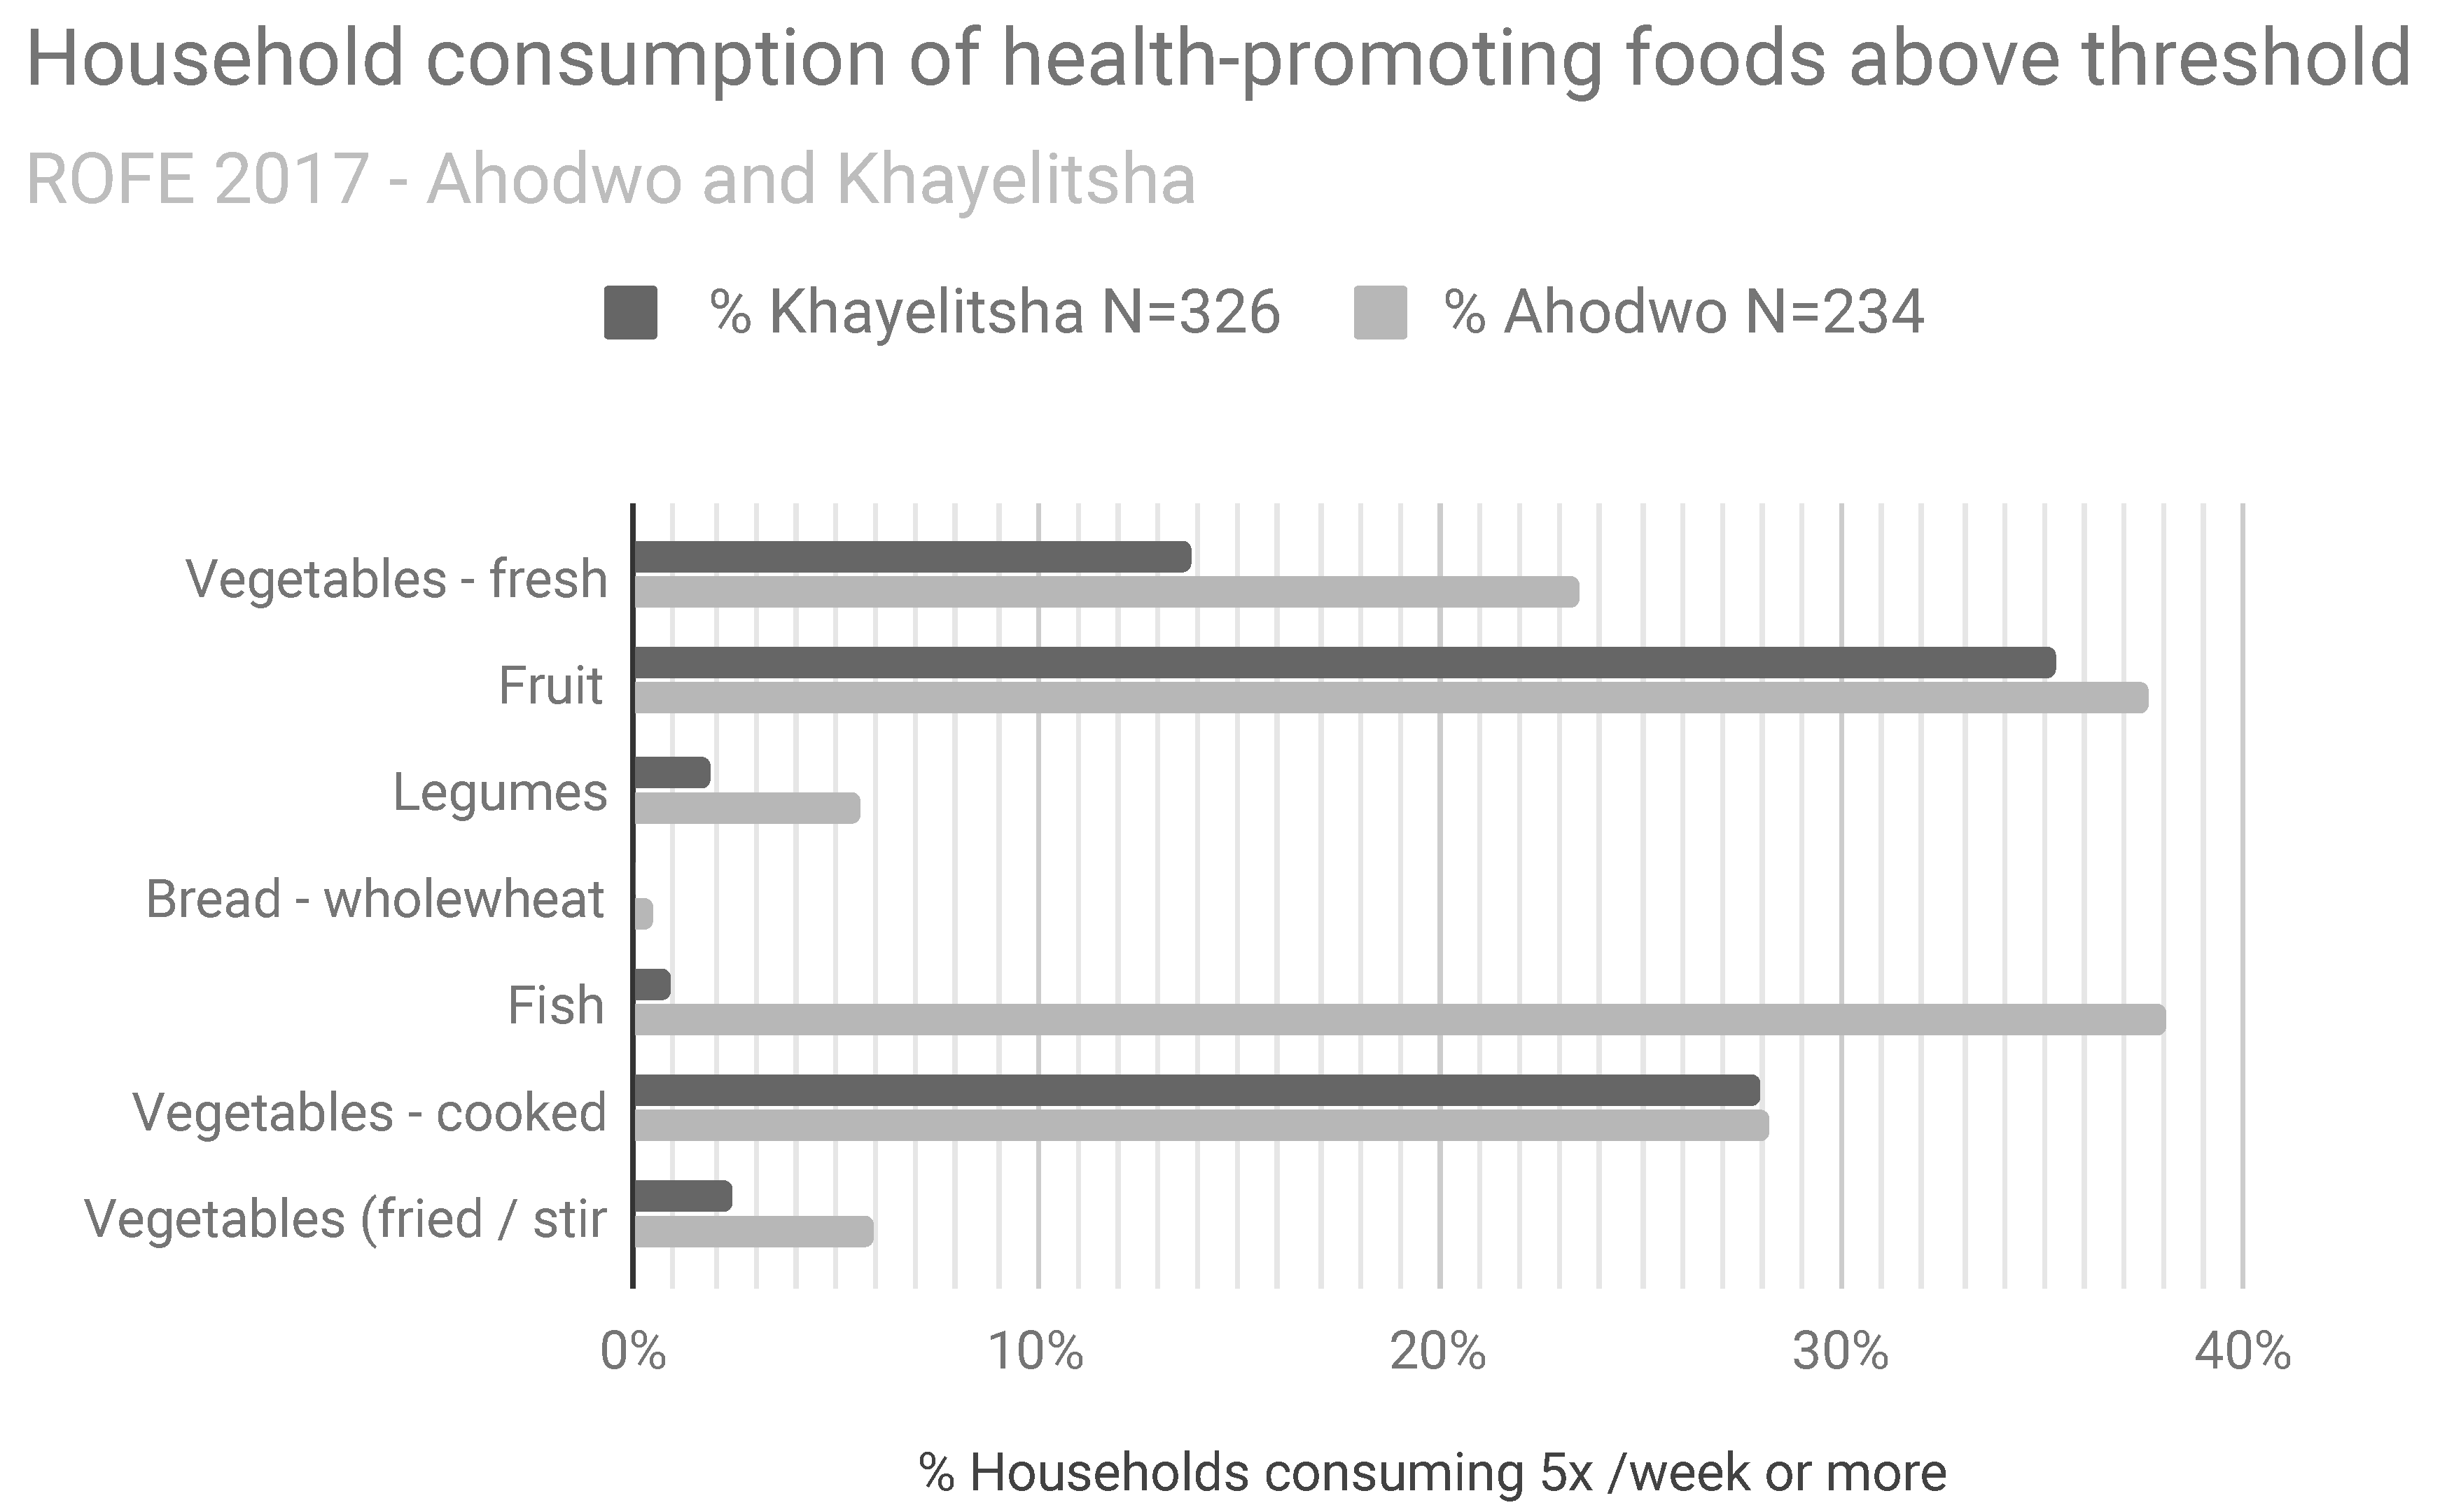
3.1. Household Food Environment
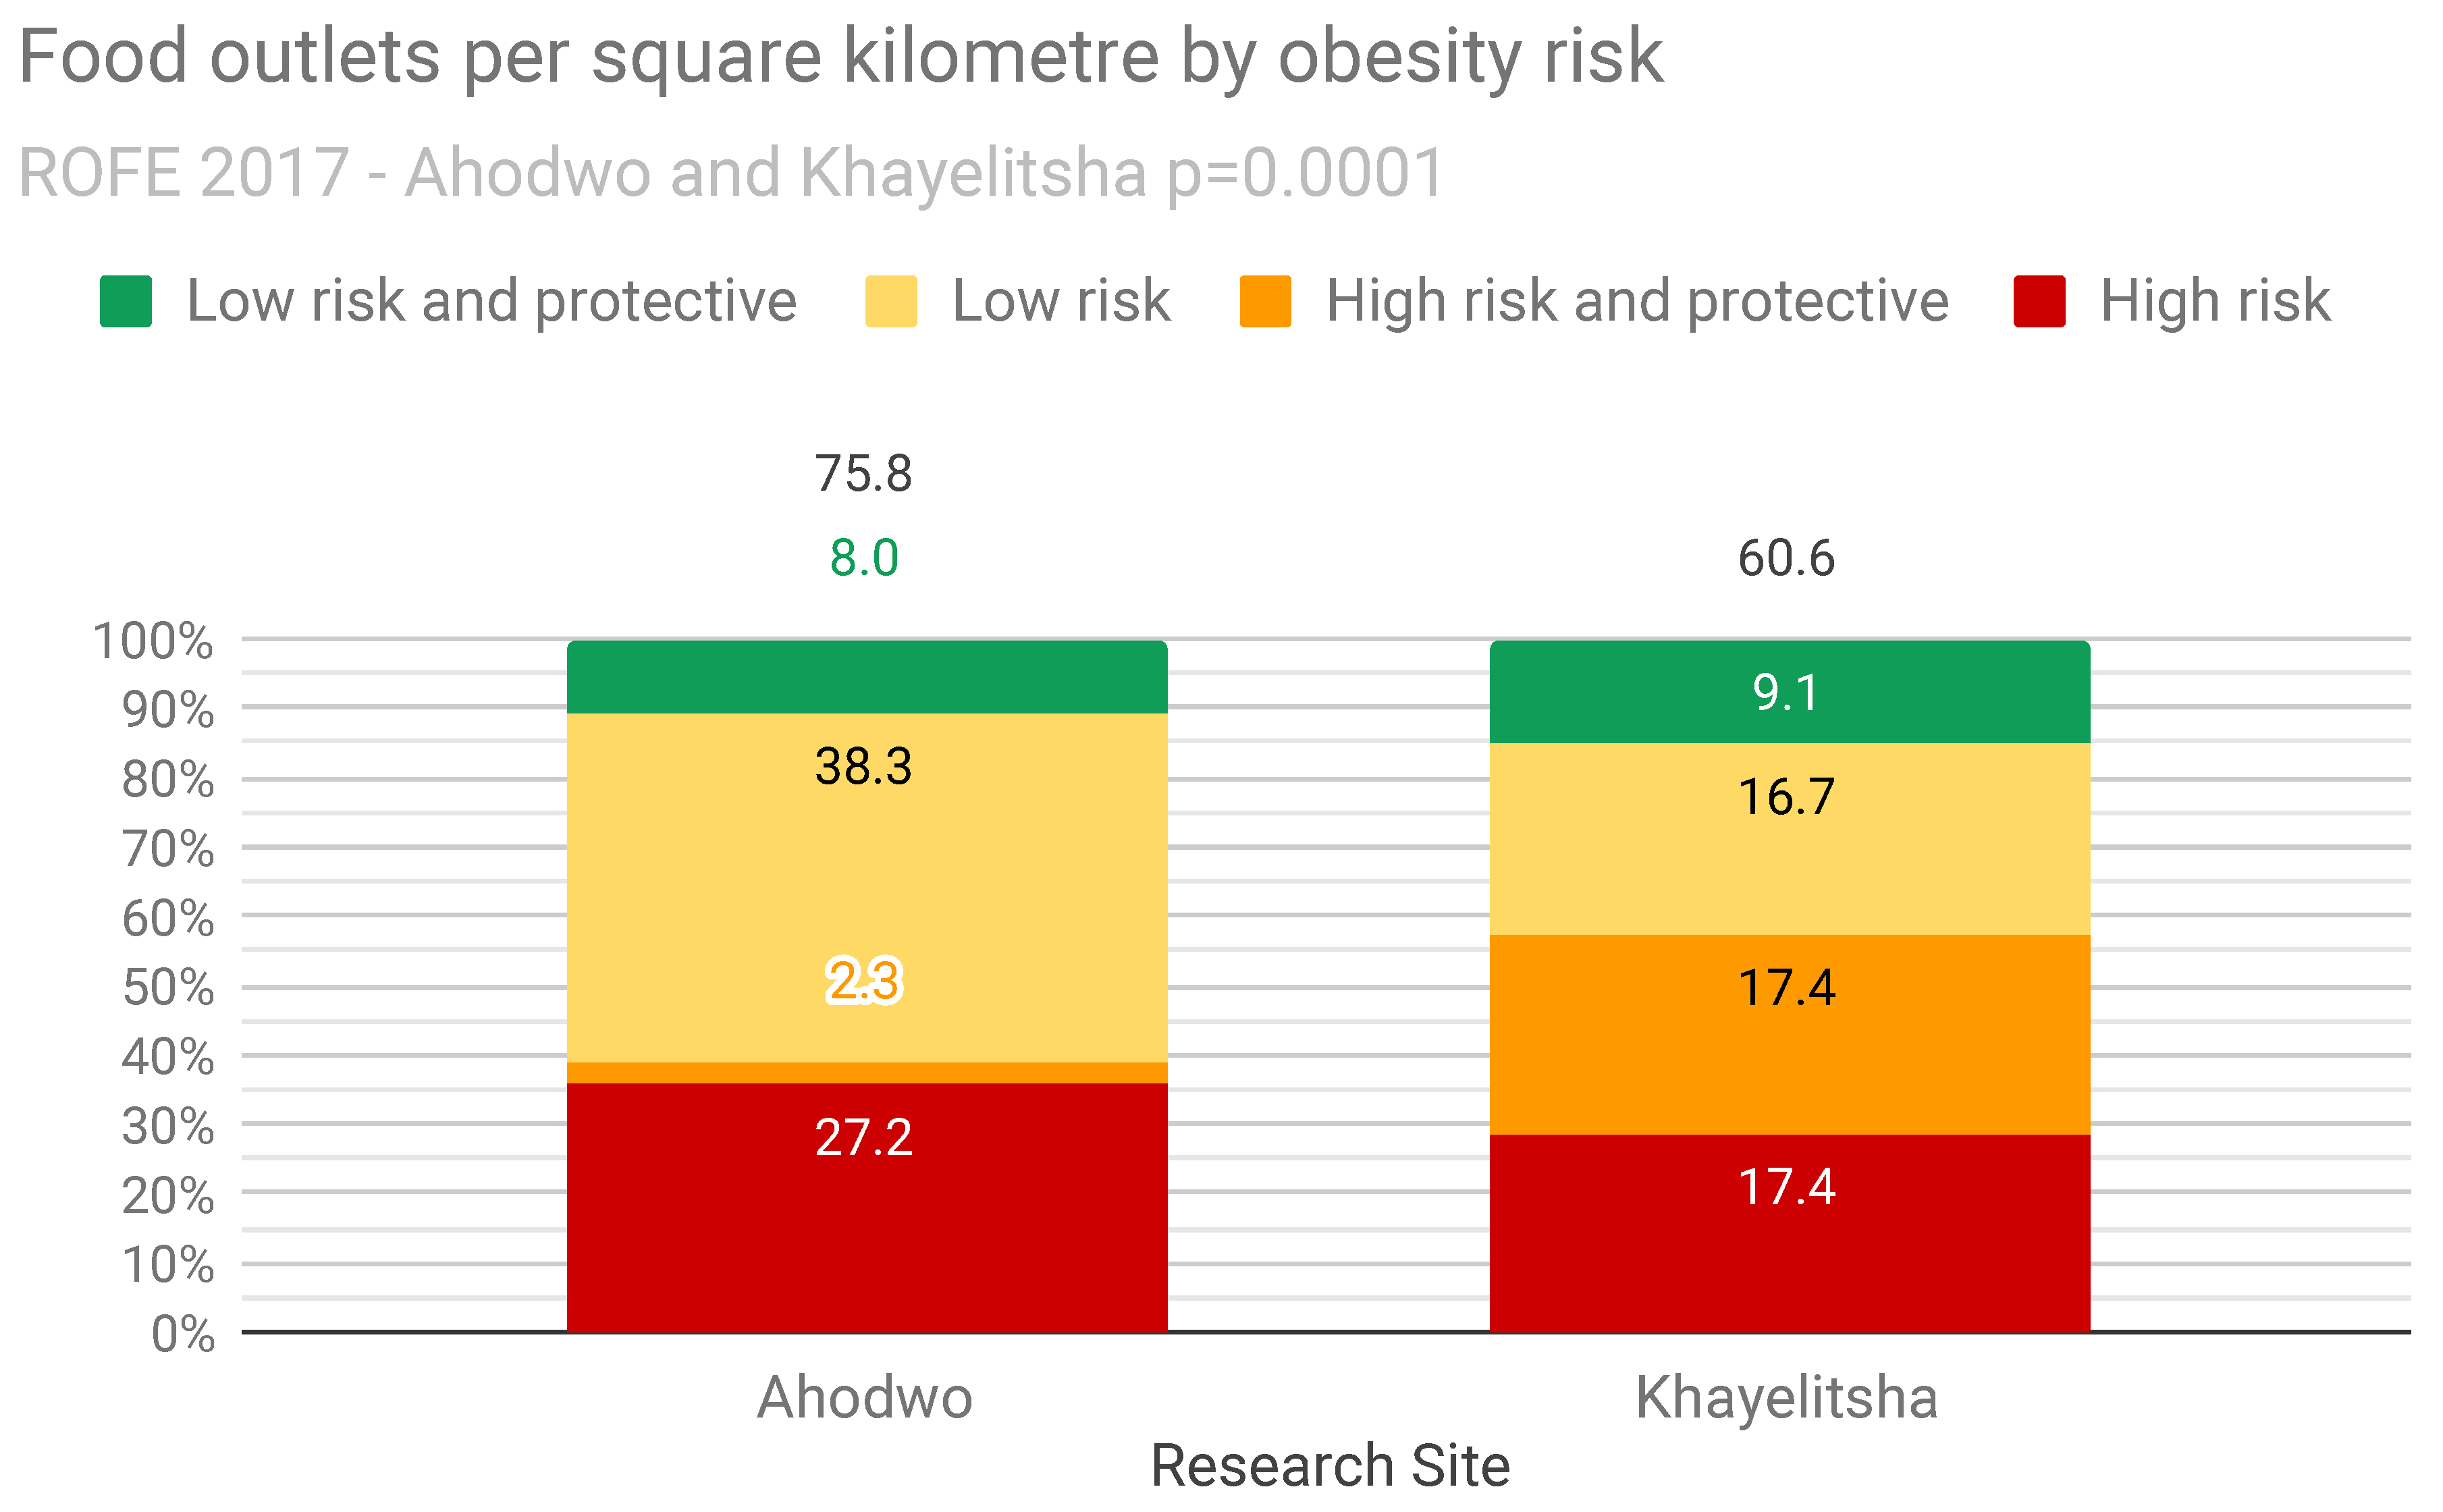
3.2. Neighbourhood Food Environment
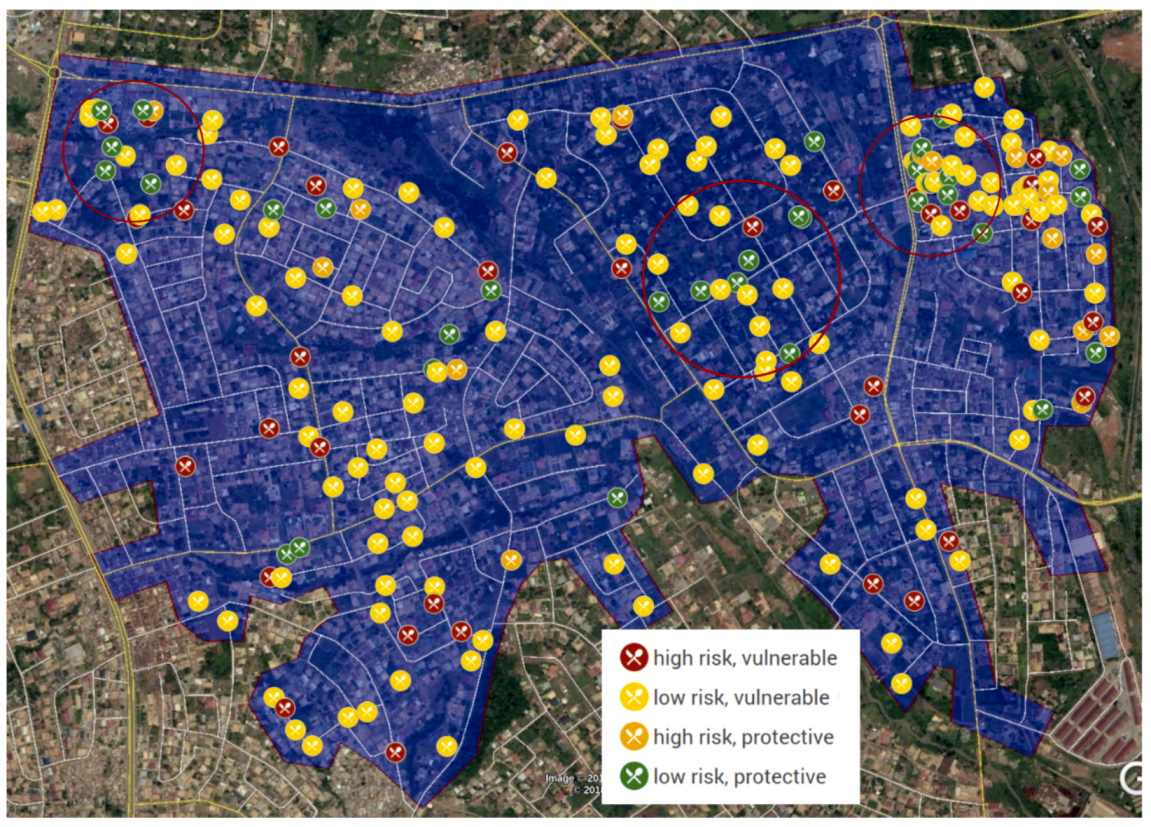
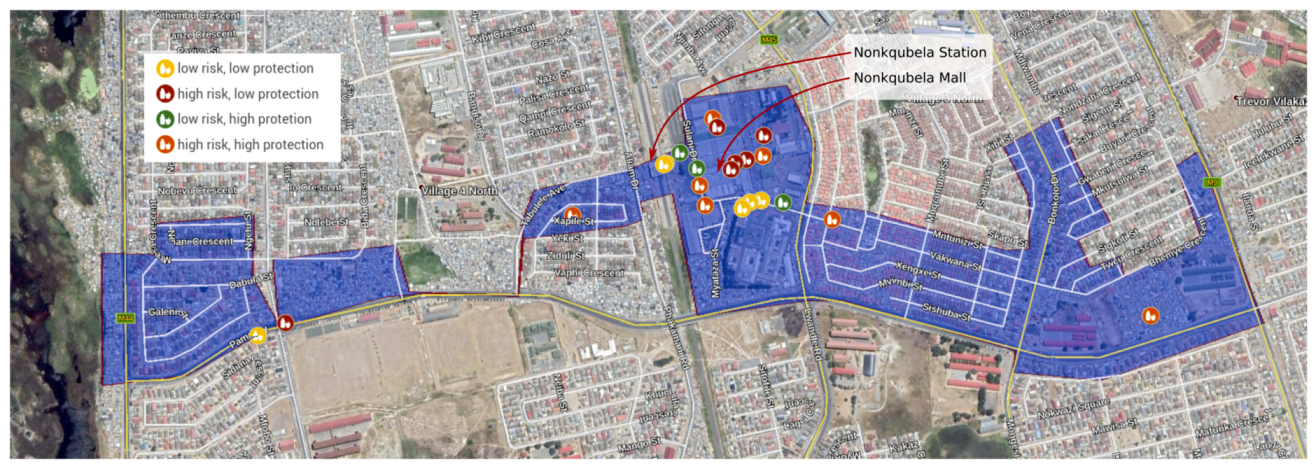
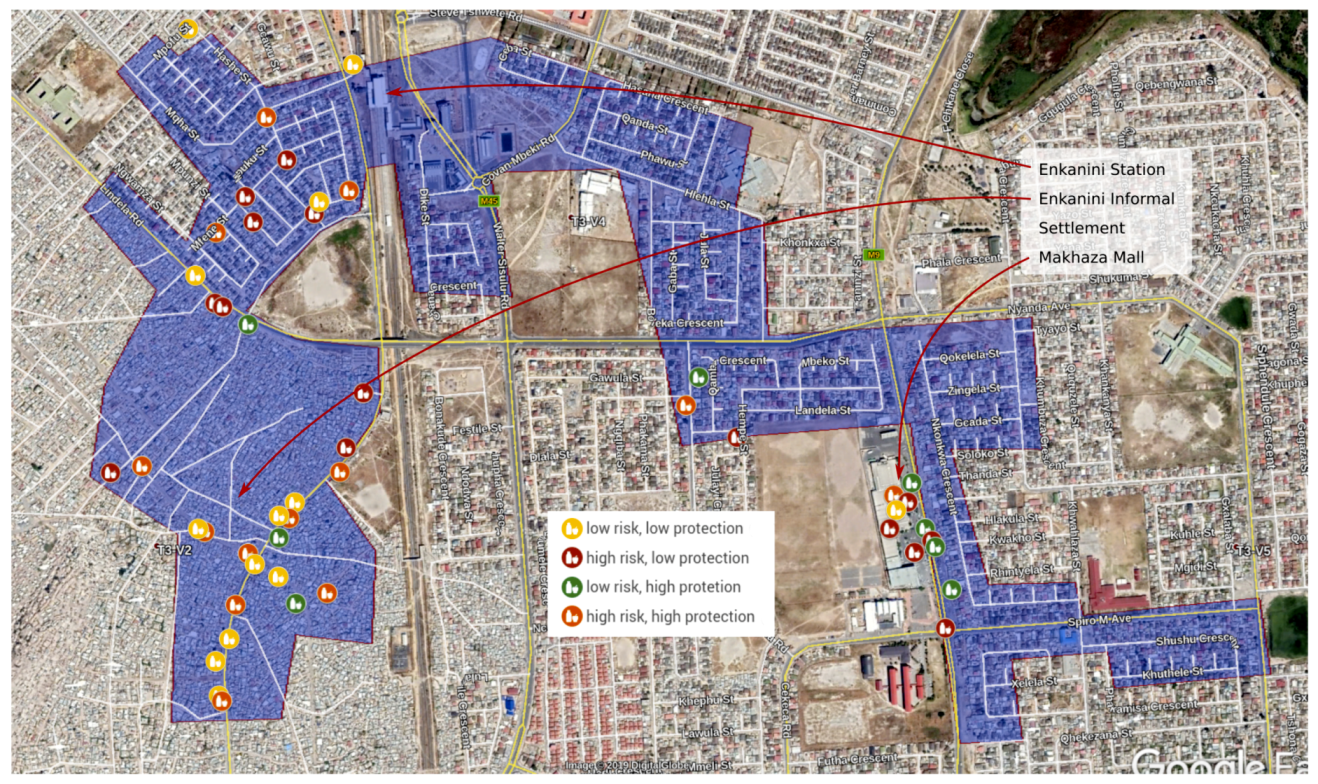
3.3. Mapping Obesogenic Food Provision and Consumption
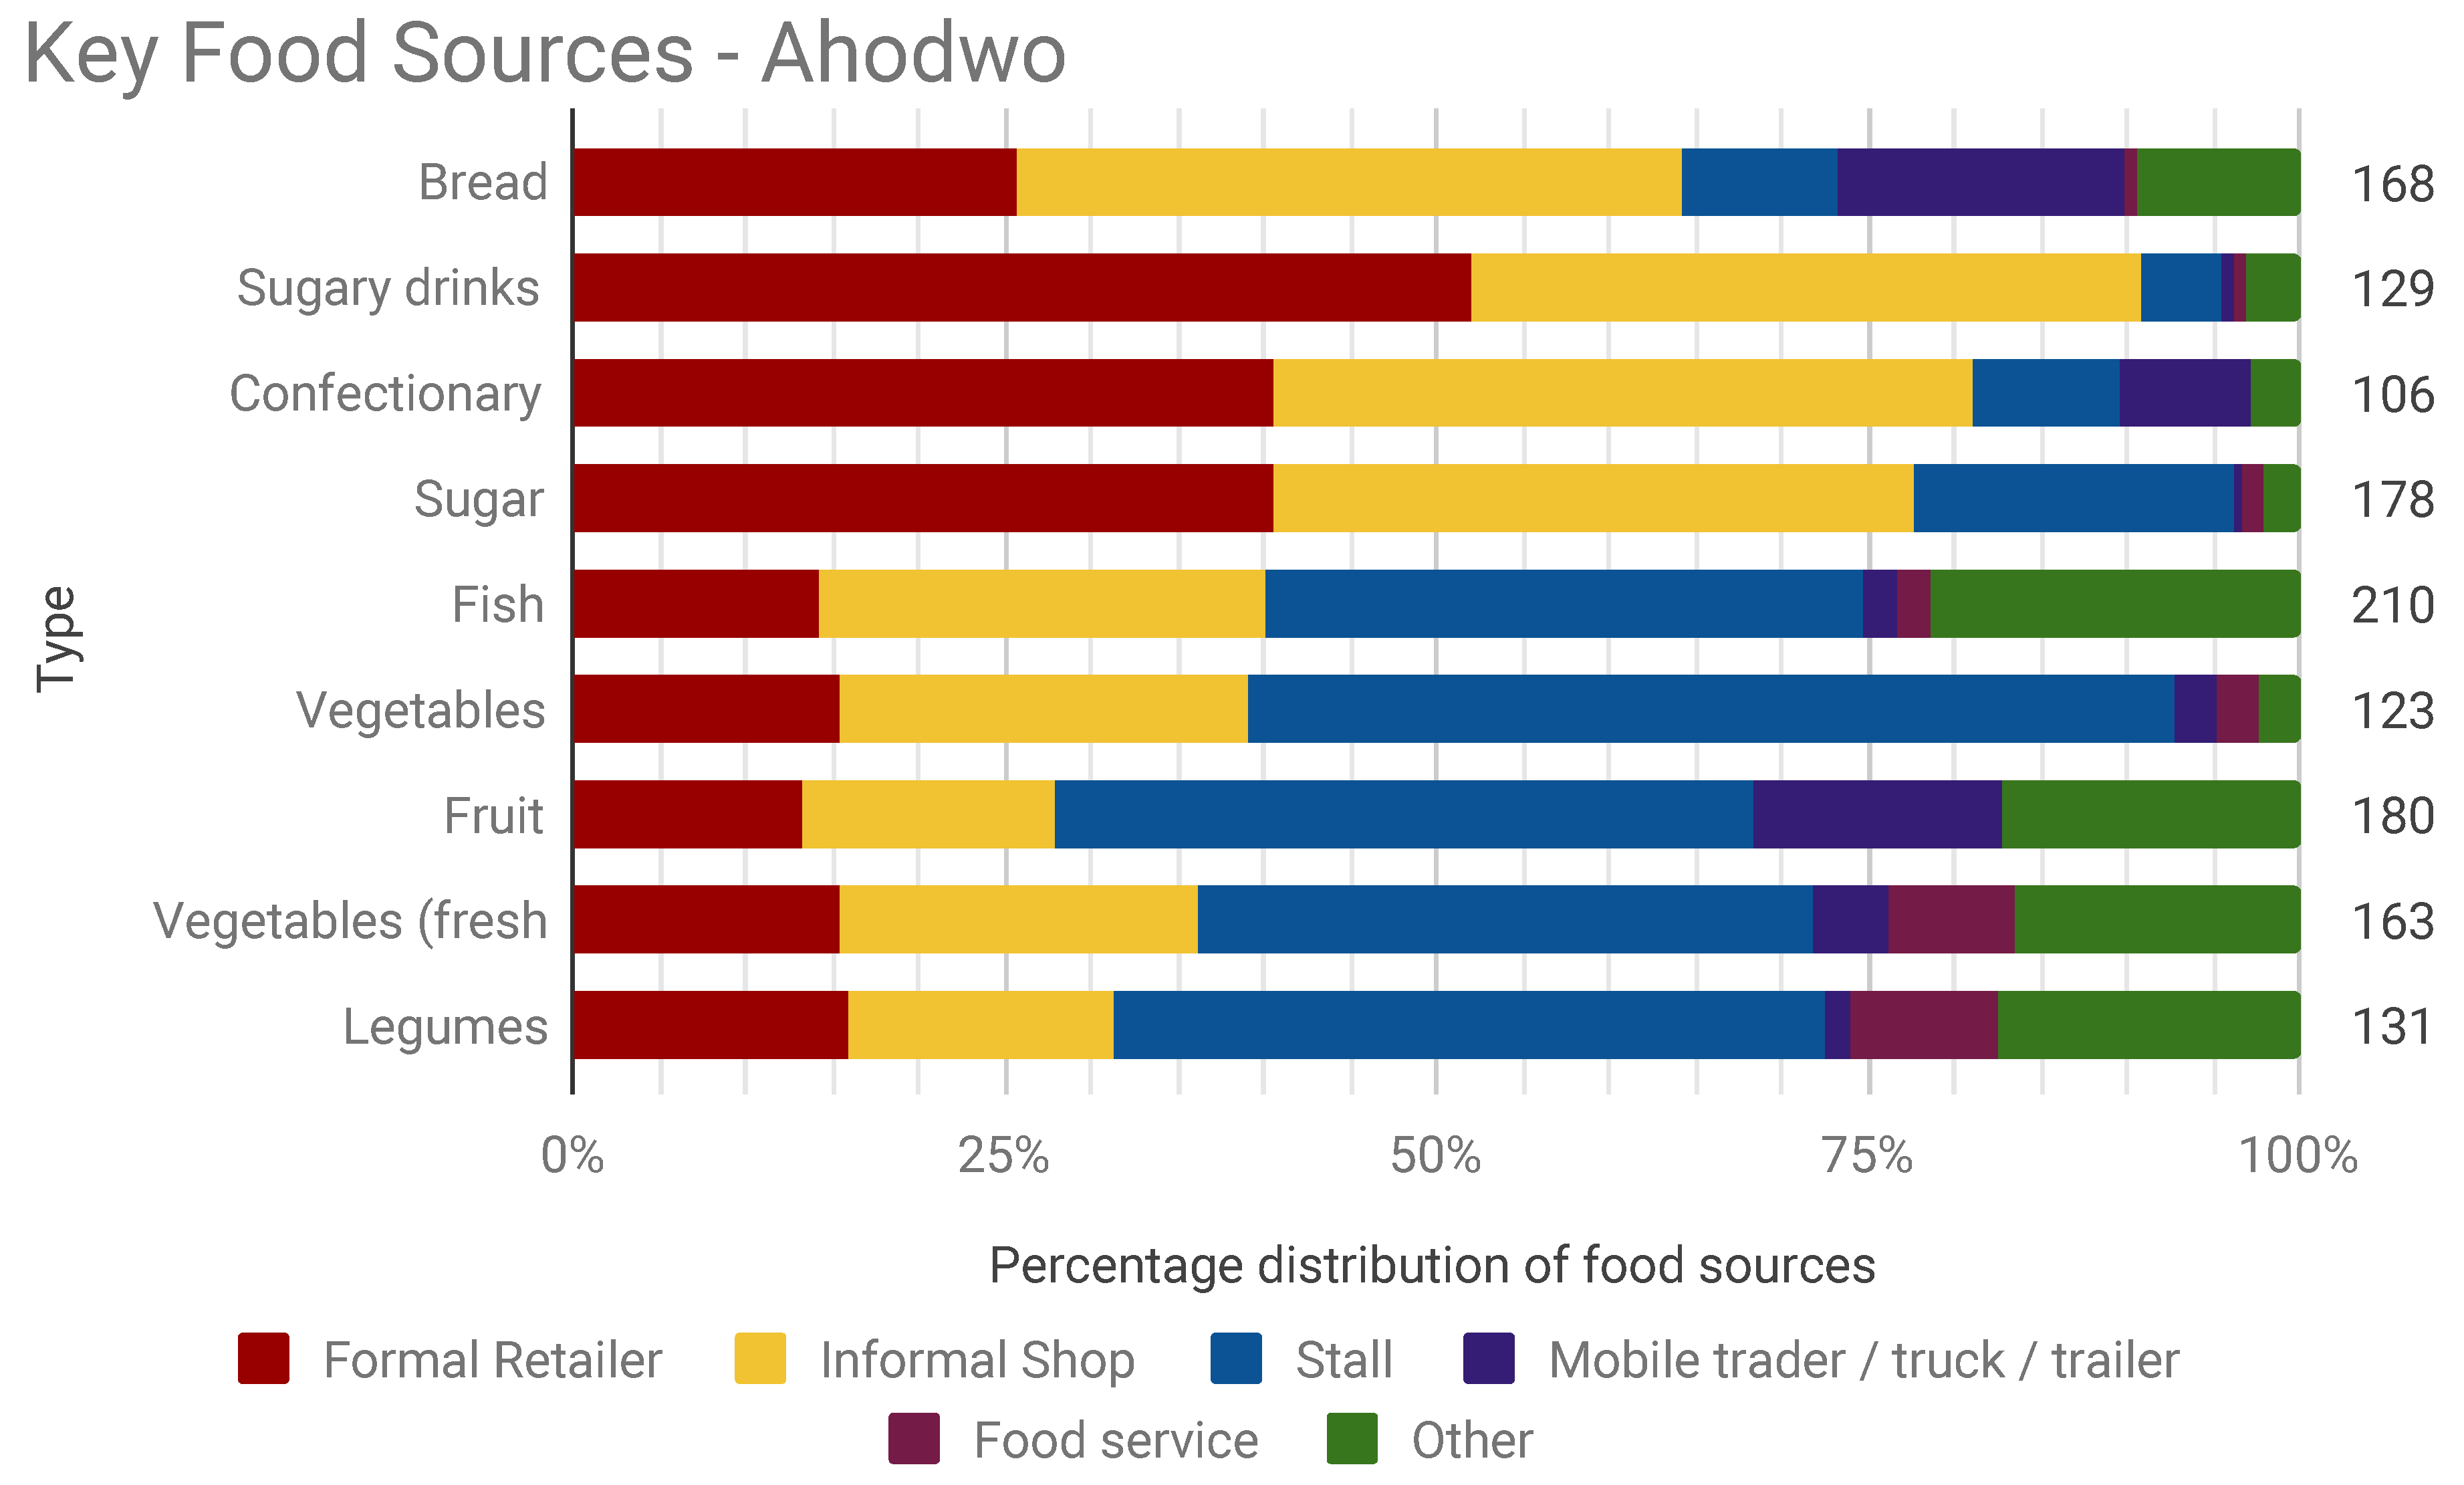
3.3.1. Food Provision and Consumption—Ahodwo
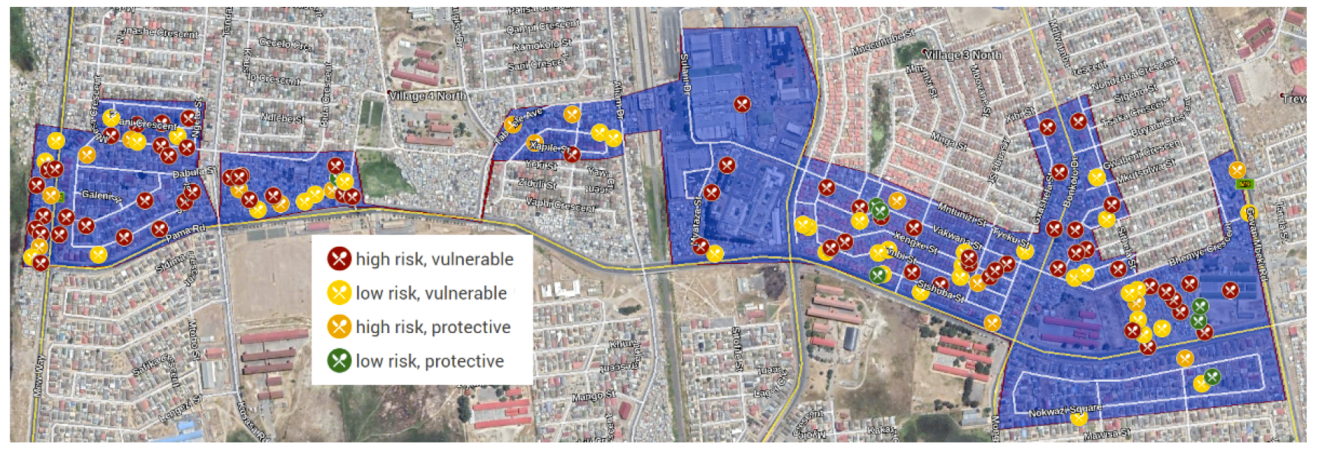
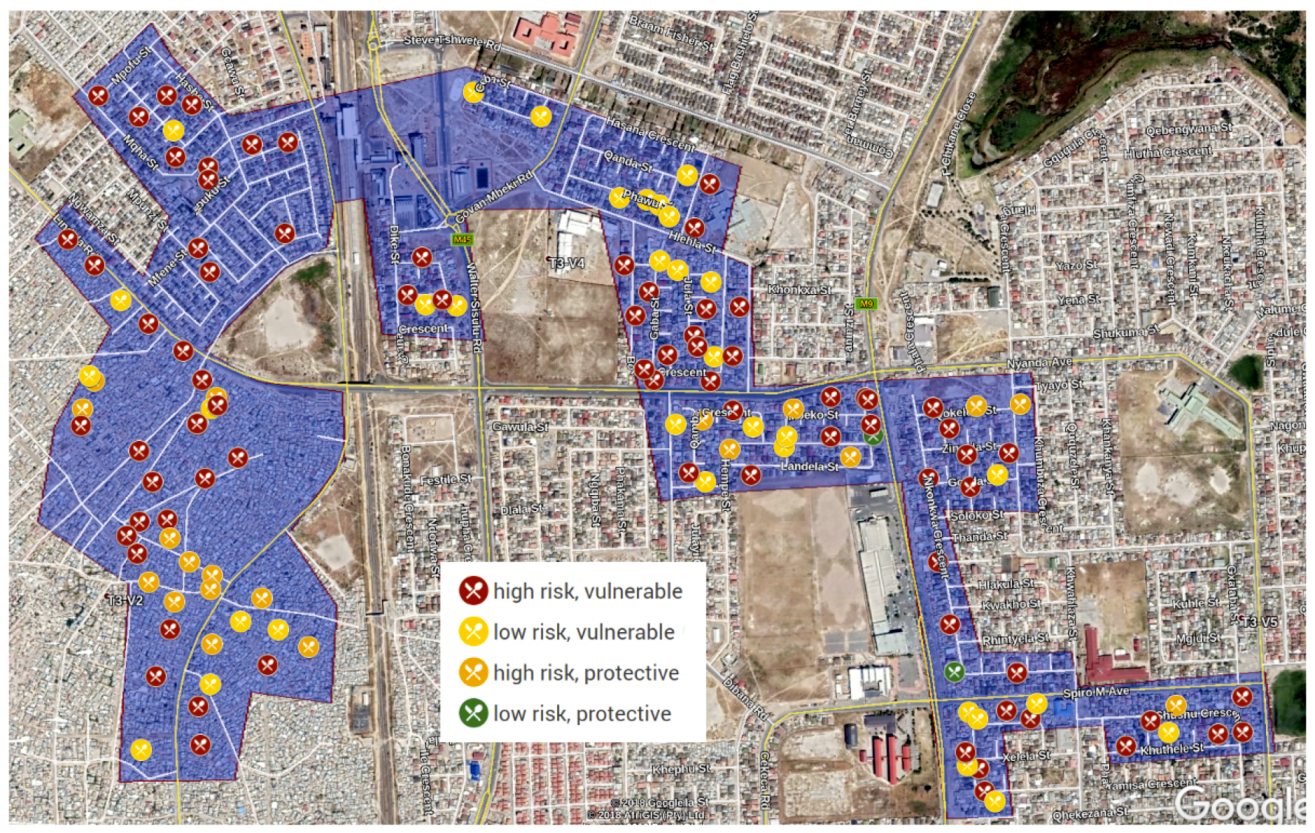
3.3.2. Food Provision and Consumption—Khayelitsha
3.4. Summary
4. Discussion
4.1. Limitations
4.2. Key Insights
4.3. Implications for Food Environment Research Methods
4.4. Implications for the Dietary Transition and Non-Communicable Disease
4.5. Implications for Food Environments Theory
4.6. Implications for Planning, Governance and Policy
5. Conclusions
Author Contributions
Funding
Acknowledgments
Conflicts of Interest
References
- Holt Giménez, E.; Shattuck, A. Food crises, food regimes and food movements: Rumblings of reform or tides of transformation? J. Peasant Stud. 2011, 38, 109–144. [Google Scholar] [CrossRef]
- Campbell, H. Breaking new ground in food regime theory: Corporate environmentalism, ecological feedbacks and the ‘food from somewhere’ regime? Agric. Hum. Values 2009, 26, 309–319. [Google Scholar] [CrossRef]
- McMichael, P. A food regime analysis of the ‘world food crisis’. Agric. Hum. Values 2009, 26, 281–295. [Google Scholar] [CrossRef]
- Haysom, G. Food and the City: Urban Scale Food System Governance. Urban Forum 2015, 26, 263–281. [Google Scholar] [CrossRef]
- Battersby, J. Food System transformation in the Absence of Food System Planning: The Case of Supermarket and Shopping Mall Retail Expansion in Cape Town, South Africa. Built Environ. 2017, 43, 417–430. [Google Scholar] [CrossRef]
- Drewnowski, A.; Popkin, B.M. The nutrition transition: New trends in the global diet. Nutr. Rev. 1997, 55, 31–43. [Google Scholar] [CrossRef]
- Popkin, B.M. Urbanization, Lifestyle Changes and the Nutrition Transition. World Dev. 1999, 27, 1905–1916. [Google Scholar] [CrossRef]
- Popkin, B.M.; Gordon-Larsen, P. The nutrition transition: Worldwide obesity dynamics and their determinants. Int. J. Obes. Relat. Metab. Disord. 2004, 28 (Suppl. 3), S2–S9. [Google Scholar] [CrossRef]
- Popkin, B.M.; Adair, L.S.; Ng, S.W. Global nutrition transition and the pandemic of obesity in developing countries. Nutr. Rev. 2012, 70, 3–21. [Google Scholar] [CrossRef]
- Popkin, B.M.; Slining, M.M. New dynamics in global obesity facing low- and middle-income countries. Obes. Rev. 2013, 14 (Suppl. 2), 11–20. [Google Scholar] [CrossRef]
- Doak, C.M.; Adair, L.S.; Bentley, M.; Monteiro, C.; Popkin, B.M. The dual burden household and the nutrition transition paradox. Int. J. Obes. 2005, 29, 129–136. [Google Scholar] [CrossRef]
- Stringhini, S.; Carmeli, C.; Jokela, M.; Avendaño, M.; Muennig, P.; Guida, F.; Ricceri, F.; d’Errico, A.; Barros, H.; Bochud, M.; et al. Socioeconomic status and the 25 × 25 risk factors as determinants of premature mortality: A multicohort study and meta-analysis of 1·7 million men and women. Lancet 2017, 389, 1229–1237. [Google Scholar] [CrossRef]
- Vorster, H.H.; Kruger, A.; Margetts, B.M. The nutrition transition in Africa: Can it be steered into a more positive direction? Nutrients 2011, 3, 429–441. [Google Scholar] [CrossRef]
- Steyn, N.P.; McHiza, Z.J. Obesity and the nutrition transition in Sub-Saharan Africa. Ann. N. Y. Acad. Sci. 2014, 1311, 88–101. [Google Scholar] [CrossRef]
- Abrahams, Z.; McHiza, Z.; Steyn, N.P. Diet and mortality rates in Sub-Saharan Africa: Stages in the nutrition transition. BMC Public Health 2011, 11, 801. [Google Scholar] [CrossRef]
- Bosu, W.K. An overview of the nutrition transition in West Africa: Implications for non-communicable diseases. Proc. Nutr. Soc. 2015, 74, 466–477. [Google Scholar] [CrossRef]
- Ofori-Asenso, R.; Agyeman, A.A.; Laar, A.; Boateng, D. Overweight and obesity epidemic in Ghana—A systematic review and meta-analysis. BMC Public Health 2016, 16, 1239. [Google Scholar] [CrossRef]
- South African National Department of Health; Statistics South Africa; South African Medical Research Council; ICF. South Africa Demographic and Health Survey 2016: Key Indicator Report. Technical Report. 2017. Available online: http://www.health.gov.za/index.php/2014-03-17-09-09-38/strategic-documents/category/536-south-african-demographic-health-survey?download=3311:key-findings-sadhs-2016-final-compressed (accessed on 21 May 2019).
- Service, G.S. Ghana Multiple Indicator Cluster Survey with an Enhanced Malaria Module and Biomarker. Technical Report. 2011. Available online: https://www.unicef.org/ghana/Ghana_MICS_Final.pdf (accessed on 21 May 2019).
- Mattah, A.; Akpakli, J. Effects of the Global Financial Crisis on the Food Security of Poor Urban Households. Case Study Accra, Ghana, Technical Report. 2010. Available online: https://www.ruaf.org/sites/default/files/Case%20study%20Accra%20report.pdf (accessed on 21 May 2019).
- Shisana, O.; Labadarios, D.; Rehle, T.; Simbayi, L.; Zuma, K.; Dhansay, A.; Reddy, P.; Parker, W.; Hoosain, E.; Naidoo, P.; et al. South African National Health and Nutrition Examination Survey (SANHANES-1), Technical Report. 2013. Available online: http://www.hsrc.ac.za/uploads/pageNews/72/SANHANESlaunch%20edition%20(online%20version).pdf (accessed on 21 May 2019).
- Said-Mohamed, R.; Micklesfield, L.K.; Pettifor, J.M.; Norris, S.A. Has the prevalence of stunting in South African children changed in 40 years? A systematic review. BMC Public Health 2015, 15, 534. [Google Scholar] [CrossRef]
- Muzigaba, M.; Puoane, T.; Sanders, D. The paradox of undernutrition and obesity in South Africa: A contextual overview of food quality, access and availability in the new democracy. In Food Poverty and Insecurity: International Food Inequalities; Caraher, M., Coveney, J., Eds.; Food Policy; Springer International Publishing: Cham, Switzerland, 2016; pp. 31–41. [Google Scholar]
- Mattes, R. The Material and Political Bases of Lived Poverty in Africa: Insights from the Afrobarometer. In Barometers of Quality of Life around the Globe; Møller, V., Huschka, D., Michalos, A.C., Eds.; Springer: Dordrecht, The Netherlands, 2009; pp. 161–185. [Google Scholar]
- Frayne, B.; Crush, J.; McLachlan, M. Urbanization, nutrition and development in Southern African cities. Food Secur. 2014, 6, 101–112. [Google Scholar] [CrossRef]
- Bourne, L.T.; Lambert, E.V.; Steyn, K. Where does the black population of South Africa stand on the nutrition transition? Public Health Nutr. 2002, 5, 157–162. [Google Scholar] [CrossRef]
- Mayosi, B.M.; Flisher, A.J.; Lalloo, U.G.; Sitas, F.; Tollman, S.M.; Bradshaw, D. The burden of non-communicable diseases in South Africa. Lancet 2009, 374, 934–947. [Google Scholar] [CrossRef]
- Agyei-Mensah, S.; de Graft Aikins, A. Epidemiological transition and the double burden of disease in Accra, Ghana. J. Urban Health 2010, 87, 879–897. [Google Scholar] [CrossRef]
- Adom, P. Determinants of food availability and access in Ghana: What can we learn beyond the regression results? Stud. Agric. Econ. 2014, 116, 153–164. [Google Scholar] [CrossRef]
- Darfour, B.; Rosentrater, K. Agriculture and food security in ghana. In Proceedings of the 2016 American Society of Agricultural and Biological Engineers (ASABE) International Meeting, Orlando, FL, USA, 17–20 July 2016. [Google Scholar] [CrossRef]
- Hjelm, L.; Dasori, W. Ghana Comprehensive Food Security & Vulnerability Analysis. Technical Report. 2012. Available online: https://documents.wfp.org/stellent/groups/public/documents/ena/wfp257009.pdf?_ga=2.27925884.1549009827.1558443370-396782588.1558443370 (accessed on 21 May 2019).
- Maxwell, D.; Levin, C.; Armar-Klemesu, M.; Ruel, M.; Morris, S.; Ahiadeke, C. Urban Livelihoods and Food and Nutrition Security in Greater Accra, Ghana. Technical Report. 2000. Available online: https://www.who.int/nutrition/publications/WHO_multicountry_%20study_Ghana.pdf (accessed on 21 May 2019).
- Lopéz-Carr, A.C.; Weeks, J.; Lopéz-Carr, D. Examining the Role of Urban Food Spaces: A Neighborhood Level Exploration of Food Geographies in Accra, Ghana; ETH: Zurich, Switzerland, 2010. [Google Scholar]
- Codjoe, S.N.A.; Okutu, D.; Abu, M. Urban household characteristics and dietary diversity: An analysis of food security in Accra, Ghana. Food Nutr. Bull. 2016, 37, 202–218. [Google Scholar] [CrossRef]
- Devas, N. City governance and poverty: The case of Kumasi. Environ. Urban 2000, 12, 123–136. [Google Scholar] [CrossRef]
- Prain, G. Effects of the Global Financial Crisis on the Food Security of Poor Urban Households; Synthesis Report on Five City Case Studies; Synthesis Report; RUAF: Leusden, The Netherlands, 2010. [Google Scholar]
- Frayne, B.; Pendleton, W.; Crush, J.; Acquah, B.; Battersby-Lennard, J.; Bras, E.; Chiweza, A.; Dlamini, T.; Fincham, R.; Kroll, F.; et al. The State of Urban Food Insecurity in Southern Africa. AFSUN Urban Food Security Series. 2010. Available online: http://www.afsun.org/wp-content/uploads/2013/09/AFSUN_2.pdf (accessed on 21 May 2019).
- Crush, J.; Frayne, B. Supermarket expansion and the informal food economy in southern african cities: Implications for urban food security. J. S. Afr. Stud. 2011, 37, 781–807. [Google Scholar] [CrossRef]
- Battersby, J. The State of Urban Food Insecurity in Cape Town; Urban Food Security Series; Queen’s University and AFSUN: Kingston, ON, Canada; Cape Town, South Africa, 2011; Available online: https://www.google.com.tw/url?sa=t&rct=j&q=&esrc=s&source=web&cd=1&ved=2ahUKEwi29fSS5r3jAhVPG6YKHYED-cQFjAAegQIABAC&url=http%3A%2F%2Fwww.afsun.org%2Fwp-content%2Fuploads%2F2013%2F09%2FAFSUN_11.pdf&usg=AOvVaw3CWbyA289GpcqPCvi3Mlwp (accessed on 18 July 2019).
- Kennedy, G.; Nantel, G.; Shetty, P.; Food and Agriculture Organization of the United Nations. Globalization of Food Systems in Developing Countries: Impact on Food Security and Nutrition; FAO Food Nutr Paper; FAO: Rome, Italy, 2004; Volume 83, pp. 1–300. [Google Scholar]
- Ericksen, P.J. Conceptualizing food systems for global environmental change research. Glob. Environ. Chang. 2008, 18, 234–245. [Google Scholar] [CrossRef]
- Ingram, J. A food systems approach to researching food security and its interactions with global environmental change. Food Secur. 2011, 3, 417–431. [Google Scholar] [CrossRef]
- Igumbor, E.U.; Sanders, D.; Puoane, T.R.; Tsolekile, L.; Schwarz, C.; Purdy, C.; Swart, R.; Durão, S.; Hawkes, C. “Big food”, the consumer food environment, health, and the policy response in South Africa. PLoS Med. 2012, 9, e1001253. [Google Scholar] [CrossRef]
- Thow, A.M.; Sanders, D.; Drury, E.; Puoane, T.; Chowdhury, S.N.; Tsolekile, L.; Negin, J. Regional trade and the nutrition transition: Opportunities to strengthen NCD prevention policy in the Southern African Development Community. Glob. Health Action 2015, 8, 28338. [Google Scholar] [CrossRef]
- Schram, A.; Labonté, R.; Sanders, D. Urbanization and international trade and investment policies as determinants of noncommunicable diseases in Sub-Saharan Africa. Prog. Cardiovasc. Dis. 2013, 56, 281–301. [Google Scholar] [CrossRef]
- Hawkes, C. Dietary implications of supermarket development: A global perspective. Dev. Policy Rev. 2008, 26, 657–692. [Google Scholar] [CrossRef]
- Hruby, A.; Manson, J.E.; Qi, L.; Malik, V.S.; Rimm, E.B.; Sun, Q.; Willett, W.C.; Hu, F.B. Determinants and consequences of obesity. Am. J. Public Health 2016, 106, 1656–1662. [Google Scholar] [CrossRef]
- Mozaffarian, D.; Hao, T.; Rimm, E.B.; Willett, W.C.; Hu, F.B. Changes in diet and lifestyle and long-term weight gain in women and men. N. Engl. J. Med. 2011, 364, 2392–2404. [Google Scholar] [CrossRef]
- Malik, V.S.; Li, Y.; Tobias, D.K.; Pan, A.; Hu, F.B. Dietary protein intake and risk of type 2 diabetes in US men and women. Am. J. Epidemiol. 2016, 183, 715–728. [Google Scholar] [CrossRef]
- Malik, V.S.; Willett, W.C.; Hu, F.B. Global obesity: Trends, risk factors and policy implications. Nat. Rev. Endocrinol. 2013, 9, 13–27. [Google Scholar] [CrossRef]
- Mozaffarian, D. Dietary and policy priorities for cardiovascular disease, diabetes, and obesity: A comprehensive review. Circulation 2016, 133, 187–225. [Google Scholar] [CrossRef]
- Forouhi, N.G.; Krauss, R.M.; Taubes, G.; Willett, W. Dietary fat and cardiometabolic health: Evidence, controversies, and consensus for guidance. BMJ 2018, 361, k2139. [Google Scholar] [CrossRef]
- Willett, W.C. Dietary fat plays a major role in obesity: No. Obes. Rev. 2002, 3, 59–68. [Google Scholar] [CrossRef]
- de Souza, R.J.; Mente, A.; Maroleanu, A.; Cozma, A.I.; Ha, V.; Kishibe, T.; Uleryk, E.; Budylowski, P.; Schünemann, H.; Beyene, J.; et al. Intake of saturated and trans unsaturated fatty acids and risk of all cause mortality, cardiovascular disease, and type 2 diabetes: Systematic review and meta-analysis of observational studies. BMJ 2015, 351, h3978. [Google Scholar] [CrossRef]
- Hu, F.B.; van Dam, R.M.; Liu, S. Diet and risk of Type II diabetes: The role of types of fat and carbohydrate. Diabetologia 2001, 44, 805–817. [Google Scholar] [CrossRef]
- Bhupathiraju, S.N.; Tobias, D.K.; Malik, V.S.; Pan, A.; Hruby, A.; Manson, J.E.; Willett, W.C.; Hu, F.B. Glycemic index, glycemic load, and risk of type 2 diabetes: Results from 3 large US cohorts and an updated meta-analysis. Am. J. Clin. Nutr. 2014, 100, 218–232. [Google Scholar] [CrossRef]
- Hall, R.; Cousins, B. Exporting contradictions: The expansion of South African agrarian capital within Africa. Globalizations 2018, 15, 12–31. [Google Scholar] [CrossRef]
- Canella, D.S.; Levy, R.B.; Martins, A.P.B.; Claro, R.M.; Moubarac, J.C.; Baraldi, L.G.; Cannon, G.; Monteiro, C.A. Ultra-processed food products and obesity in Brazilian households (2008–2009). PLoS ONE 2014, 9, e92752. [Google Scholar] [CrossRef]
- Juul, F.; Hemmingsson, E. Trends in consumption of ultra-processed foods and obesity in Sweden between 1960 and 2010. Public Health Nutr. 2015, 18, 3096–3107. [Google Scholar] [CrossRef]
- da Costa Louzada, M.L.; Baraldi, L.G.; Steele, E.M.; Martins, A.P.B.; Canella, D.S.; Moubarac, J.C.; Levy, R.B.; Cannon, G.; Afshin, A.; Imamura, F.; et al. Consumption of ultra-processed foods and obesity in Brazilian adolescents and adults. Prev. Med 2015, 81, 9–15. [Google Scholar] [CrossRef]
- Mendonça, R.D.; Pimenta, A.M.; Gea, A.; de la Fuente-Arrillaga, C.; Martinez-Gonzalez, M.A.; Lopes, A.C.S.; Bes-Rastrollo, M. Ultraprocessed food consumption and risk of overweight and obesity: The University of Navarra Follow-Up (SUN) cohort study. Am. J. Clin. Nutr. 2016, 104, 1433–1440. [Google Scholar] [CrossRef]
- PAHO. Ultra-Processed Food and Drink Products in Latin America: Trends, Impact on Obesity, Policy Implications; Technical Report; PAHO: Washington, DC, USA, 2015. [Google Scholar]
- Weatherspoon, D.D.; Reardon, T. The rise of supermarkets in Africa: Implications for agrifood systems and the rural poor. Dev. Policy Rev. 2003, 21, 333–355. [Google Scholar] [CrossRef]
- Monteiro, C.A.; Moubarac, J.C.; Cannon, G.; Ng, S.W.; Popkin, B. Ultra-processed products are becoming dominant in the global food system. Obes. Rev. 2013, 14 (Suppl. 2), 21–28. [Google Scholar] [CrossRef]
- Andam, K.S.; Tschirley, D.; Asante, S.B.; Al-Hassan, R.M.; Diao, X. The transformation of urban food systems in Ghana: Findings from inventories of processed products. Outlook Agric. 2018, 47, 003072701878591. [Google Scholar] [CrossRef]
- Peyton, S.; Moseley, W.; Battersby, J. Implications of supermarket expansion on urban food security in Cape Town, South Africa. Afr. Geogr. Rev. 2015, 34, 36–54. [Google Scholar] [CrossRef]
- Greenberg, S. Corporate power in the agro-food system and the consumer food environment in South Africa. J. Peasant Stud. 2017, 44, 467–496. [Google Scholar] [CrossRef]
- Battersby, J.; Crush, J. Africa’ urban food deserts. Urban Forum 2014, 25, 143–151. [Google Scholar] [CrossRef]
- Greenberg, S. Contesting the Food System in South Africa: Issues and Opportunities. Research Report. 2010. Available online: http://repository.uwc.ac.za/xmlui/bitstream/handle/10566/572/RR42.pdf?sequence=1&isAllowed=y (accessed on 21 May 2019).
- Charman, A.; Petersen, L.; Piper, L. From local survivalism to foreign entre-preneurship: The transformation of the spaza sector in Delft, Cape Town1. Transformation 2012, 78, 47–73. [Google Scholar] [CrossRef]
- Ecker, O.; Breisinger, C. The Food Security System: A New Conceptual Framework, Technical Report. 2012. Available online: http://www.ifpri.org/cdmref/p15738coll2/id/126837/filename/127048.pdf (accessed on 21 May 2019).
- Glanz, K.; Sallis, J.F.; Saelens, B.E.; Frank, L.D. Healthy nutrition environments: Concepts and measures. Am. J. Health Promot. 2005, 19. [Google Scholar] [CrossRef]
- Turner, C.; Aggarwal, A.; Walls, H.; Herforth, A.; Drewnowski, A.; Coates, J.; Kalamatianou, S.; Kadiyala, S. Concepts and critical perspectives for food environment research: A global framework with implications for action in low- and middle-income countries. Glob. Food Sec. 2018, 18, 93–101. [Google Scholar] [CrossRef]
- Herforth, A.; Ahmed, S. The food environment, its effects on dietary consumption, and potential for measurement within agriculture-nutrition interventions. Food Secur. 2015, 7, 505–520. [Google Scholar] [CrossRef]
- Losch, B. The Need for a Paradigm Shift towards Territorial Development in Sub-Saharan Africa; Working Paper Series; RIMISP: Santiago, Chile, 2016. [Google Scholar]
- Losch, B. Can We Still Only Think ‘Rural’? Bridging the rural–urban divide for rural transformation in a globalized world. Development 2015, 58, 169–176. [Google Scholar] [CrossRef]
- Chen, M. The Informal Economy: Definitions, Theories and Policies. Working Paper. 2012. Available online: http://www.wiego.org/sites/default/files/publications/files/Chen_WIEGO_WP1.pdf (accessed on 21 May 2019).
- Crush, J.; Hovorka, A.; Tevera, D. Food security in Southern African cities. Prog. Dev. Stud. 2011, 11, 285–305. [Google Scholar] [CrossRef]
- Rudolph, M.; Kroll, F.; Ruysenaar, S.; Dlamini, T. The State of Food Insecurity in Johannesburg, Research Report. 2012. Available online: http://www.afsun.org/wp-content/uploads/2013/09/AFSUN_12.pdf (accessed on 21 May 2019).
- Skinner, C.; Haysom, G. The Informal Sector’ Role in Food Security: A Missing Link in Policy Debates? Working Paper, Cape Town. 2016. Available online: https://www.africaportal.org/documents/16322/WP44_SkinnerHaysom.pdf (accessed on 21 May 2019).
- Even-Zahav, E.; Kelly, C. Systematic review of the literature on ‘informal economy’ and ‘food security’: South Africa, 2009–2014. Working Paper. 2016. Available online: https://www.africaportal.org/documents/15874/WP35Even-Zahavfinal.pdf (accessed on 21 May 2019).
- Battersby, J.; Marshak, M.; Mngqibisa, N. Mapping the invisible: The informal food economy of Cape Town, South Africa. Technical Report. 2016. Available online: http://www.afsun.org/wp-content/uploads/2017/06/AFSUN24.pdf (accessed on 21 May 2019).
- Sinclair-Smith, K.; Turok, I. The changing spatial economy of cities: An exploratory analysis of Cape Town. Dev. S. Afr. 2012, 29, 391–417. [Google Scholar] [CrossRef]
- Turok, I.; Borel-Saladin, J. Is urbanisation in South Africa on a sustainable trajectory? Dev. S. Afr. 2014, 31, 675–691. [Google Scholar] [CrossRef]
- Meng, T.; Florkowskib, W.; Sarpongc, D.; Chinn, M.; Resurreccione, A. Consumer’s Food Shopping Choice in Ghana: Supermarket or Traditional Outlets? Supermarket or Traditional Outlets? IFAMA 2014, 17, 107–130. [Google Scholar]
- Davis, J. Selling Wares on the Streets of Accra: A Case Study of Street Hawkers in Ghana’s Capital. Focus Geogr. 2008, 51, 32–37. [Google Scholar] [CrossRef]
- Dake, F.A.A.; Thompson, A.L.; Ng, S.W.; Agyei-Mensah, S.; Codjoe, S.N.A. The Local Food Environment and Body Mass Index among the Urban Poor in Accra, Ghana. J. Urban Health 2016, 93, 438–455. [Google Scholar] [CrossRef]
- Hughes, F.; Adu-Gyamfi, A.; Appiah, V. Microbiological and Parasitological Quality of Local Beef Retailed in Accra and Radiation Sensitivity of Salmonella sp. Int. J. Curr. Microbiol. App. Sci. 2015, 4, 86–96. [Google Scholar]
- Duedu, K.O.; Yarnie, E.A.; Tetteh-Quarcoo, P.B.; Attah, S.K.; Donkor, E.S.; Ayeh-Kumi, P.F. A comparative survey of the prevalence of human parasites found in fresh vegetables sold in supermarkets and open-aired markets in Accra, Ghana. BMC Res Notes 2014, 7, 836. [Google Scholar] [CrossRef]
- Bempah, C.K.; Donkor, A.K. Pesticide residues in fruits at the market level in Accra Metropolis, Ghana, a preliminary study. Environ. Monit. Assess. 2011, 175, 551–561. [Google Scholar] [CrossRef]
- Steyn, N.P.; Labadarios, D.; Nel, J.H. Factors which influence the consumption of street foods and fast foods in South Africa—A national survey. Nutr J 2011, 10, 104. [Google Scholar] [CrossRef]
- Libman, K.; Freudenberg, N.; Sanders, D.; Puoane, T.; Tsolekile, L. The role of urban food policy in preventing diet-related non-communicable diseases in Cape Town and New York. Public Health 2015, 129, 327–335. [Google Scholar] [CrossRef]
- Smit, W. Urban governance and urban food systems in Africa: Examining the linkages. Cities 2016, 58, 80–86. [Google Scholar] [CrossRef]
- Rhodes, R.A.W. The New Governance: Governing without Government. Political Stud. 1996, 44, 652–667. [Google Scholar] [CrossRef]
- Smit, W.; de Lannoy, A.; Dover, R.V.H.; Lambert, E.V.; Levitt, N.; Watson, V. Making unhealthy places: The built environment and non-communicable diseases in Khayelitsha, Cape Town. Health Place 2016, 39, 196–203. [Google Scholar] [CrossRef]
- Jessop, B. The Governance of Complexity and the Complexity of Governance: Preliminary Remarks on some Problems and Limits of Economic Guidance. Technical Report. 2003. Available online: https://www.lancaster.ac.uk/fass/resources/sociology-online-papers/papers/jessop-governance-of-complexity.pdf (accessed on 21 May 2019).
- Candel, J.J.L. Food security governance: A systematic literature review. Food Secur. 2014, 6, 585–601. [Google Scholar] [CrossRef]
- Pereira, L.; Drimie, S. Governance arrangements for the future food system: Addressing complexity in South Africa. Environ. Sci. Policy Sustain. Dev. 2016, 58, 18–31. [Google Scholar] [CrossRef]
- Pereira, L.M.; Ruysenaar, S. Moving from traditional government to new adaptive governance: The changing face of food security responses in South Africa. Food Sec. 2012, 4, 41–58. [Google Scholar] [CrossRef]
- Termeer, C.J.; Drimie, S.; Ingram, J.; Pereira, L.; Whittingham, M.J. A diagnostic framework for food system governance arrangements: The case of South Africa. NJAS—Wagening. J. Life Sci. 2017, 84, 85–93. [Google Scholar] [CrossRef]
- Pothukuchi, K.; Kaufman, J.L. Kameshwari Pothukuchi & Jerome L. Kaufman, Placing the Food System on the Urban Agenda: The Role of Municipal Institutions in Food Systems Planning—PhilPapers. 1999. Available online: http://archive.clas.wayne.edu/Multimedia/seedwayne/files/kami/1_5AHV.pdf (accessed on 21 May 2019).
- Foucault, M. Security, Territory, Population; Palgrave: Macmillan, UK, 2009. [Google Scholar]
- Haysom, G.; Tawodzera, G. ‘Measurement drives diagnosis and response’: Gaps in transferring food security assessment to the urban scale. Food Policy 2018, 74, 117–125. [Google Scholar] [CrossRef]
- Scott, J. Seeing Like a State. How Certain Schemes to Improve the Human Condition Have Failed; Yale University Press: Yale, CT, USA, 1999. [Google Scholar]
- Stevens, A. Telling Policy Stories: An Ethnographic Study of the Use of Evidence in Policy-making in the UK. J. Soc. Policy 2011, 40, 237–255. [Google Scholar] [CrossRef]
- Du Toit, A. Making Sense of ’Evidence’. Notes on the Discursive Politics of Research and Pro—Poor Policy Making; Working Paper; Institute for Poverty, Land and Agrarian Studies (PLAAS): Bellville, South Africa, 2012. [Google Scholar]
- Petersen, L.M.; Charman, A.J.E. The scope and scale of the informal food economy of South African urban residential townships: Results of a small-area micro-enterprise census. Dev. S. Afr. 2017, 1–23. [Google Scholar] [CrossRef]
- Turok, I.; Watson, V. Divergent development in South African cities: Strategic challenges facing Cape Town. Urban Forum 2001, 12, 119–138. [Google Scholar] [CrossRef]
- Arambepola, C.; Scarborough, P.; Rayner, M. Validating a nutrient profile model. Public Health Nutr. 2008, 11, 371–378. [Google Scholar] [CrossRef]
- Scarborough, P.; Rayner, M.; Stockley, L. Developing nutrient profile models: A systematic approach. Public Health Nutr. 2007, 10, 330–336. [Google Scholar] [CrossRef]
- Townsend, M.S. Where is the science? What will it take to show that nutrient profiling systems work? Am. J. Clin. Nutr. 2010, 91, 1109S–1115S. [Google Scholar] [CrossRef]
- van der Walt, K. Thorough-Bread? A Study of the System of Provision of Bread in South Africa. Available online: http://wiredspace.wits.ac.za/jspui/bitstream/10539/22221/1/Final%20Masters%20Research%20Research%20Report%2031%20August%20Katharina%20v.pdf (accessed on 21 May 2019).
- Gastrow, V. Problematizing the Foreign Shop: Justifications for Restricting the Migrant Spaza Sector in South Africa. Technical Report. 2018. Available online: https://www.africaportal.org/documents/18314/Problematizing_the_Foreign_Shop.pdf (accessed on 21 May 2019).
- Cooke, E.; Hague, S.; McKay, A. The Ghana Poverty and Inequality Report: Using the 6th Ghana Living Standards Survey, Technical Report. 2016. Available online: https://www.unicef.org/ghana/Ghana_Poverty_and_Inequality_Analysis_FINAL_Match_2016(1).pdf (accessed on 21 May 2019).
- Maluleke, R. National Poverty Lines 2018, Statistical Release. 2019. Available online: http://www.statssa.gov.za/publications/P03101/P031012018.pdf (accessed on 21 May 2019).
- Smith, J.; Abrahams, M. 2016 PACSA Food Price Barometer Annual Report October 2016. Available online: https://drive.google.com/file/d/1qva4R0wArjvU8HYCmHNLdqHHihhP8g-s/view?usp=sharing (accessed on 21 May 2019).
- Anand, S.S.; Hawkes, C.; de Souza, R.J.; Mente, A.; Dehghan, M.; Nugent, R.; Zulyniak, M.A.; Weis, T.; Bernstein, A.M.; Krauss, R.M.; et al. Food consumption and its impact on cardiovascular disease: Importance of solutions focused on the globalized food system: A report from the workshop convened by the world heart federation. J. Am. Coll. Cardiol. 2015, 66, 1590–1614. [Google Scholar] [CrossRef]
- Dixon, J.; Omwega, A.M.; Friel, S.; Burns, C.; Donati, K.; Carlisle, R. The health equity dimensions of urban food systems. J. Urban Health 2007, 84, 118–129. [Google Scholar] [CrossRef]
- Battersby, J. Beyond the food desert: Finding waysto speak about urban food security in South Africa. Geogr. Ann. Ser. B Hum. Geogr. 2012, 94, 141–159. [Google Scholar] [CrossRef]
- Temple, N.J.; Steyn, N.P. The cost of a healthy diet: A South African perspective. Nutrition 2011, 27, 505–508. [Google Scholar] [CrossRef]
- Faber, M.; Schwabe, C.; Drimie, S. Dietary diversity in relation to other household food security indicators. IJFSNPH 2009, 2, 1. [Google Scholar] [CrossRef]
- Ahmed, A.U.; Vargas Hill, R.; Smith, L.C.; Wiesmann, D.M.; Frankenberger, T. The World’s Most Deprived. Characteristics and Causes of Extreme Poverty and Hunger. Discussion Paper. 2007. Available online: http://citeseerx.ist.psu.edu/viewdoc/download?doi=10.1.1.139.5305&rep=rep1&type=pdf (accessed on 21 May 2019).
- das Nair, R. The internationalisation of supermarkets and the nature of competitive rivalry in retailing in southern Africa. Dev. S. Afr. 2018, 35, 315–333. [Google Scholar] [CrossRef]
- Abrahams, C. Transforming the region: Supermarkets and the local food economy. Afr. Aff. 2010, 109, 115–134. [Google Scholar] [CrossRef]
- Lindell, I. Informality and Collective Organising: Identities, alliances and transnational activism in Africa. Third World Q 2010, 31, 207–222. [Google Scholar] [CrossRef]
- Li, T.M. The Will to Improve. Governmentality, Development, and the Practice of Politics.; Duke University Press: Durham, UK; London, UK, 2007. [Google Scholar]
- Akinwumi, A. The Will to Transform: Nation-building and the Strategic State in South Africa. Space Polity 2013, 17, 145–163. [Google Scholar] [CrossRef]


| Outlet Type | Outlet Detail |
|---|---|
| Formal retailer | Wholesaler/Distributor; Supermarket; General dealer |
| Small or informal shop | Small shop/Convenience store/Spaza (dedicated shop with a sign); House-shop (informal shop attached to or part of a home; no sign; not dedicated to food retail only); Container shop |
| Stall or mobile trader | Fixed municipal stall (with shelter and display); Permanent stall (fixed shelter, table and display shelves which stays in place after trading hours); Temporary stall (boxes with board; removable stall and shelter; trailer with wheels); Mobile trader (trolley, wheelbarrow; carry-tray, basket or buckets); Bakkie (pick-up truck) trader or trike. |
| Formal food service | Formal restaurant; Corporate fast food shop; Independent take-away/fast-food. |
| Informal food service | Informal restaurant; Informal take-away or grill. |
| Household Consumption Risk Class | Risky | Protective |
|---|---|---|
| Description | Ultra-processed, processed and fried foods and ingredients | Minimally-processed, plant-based foods |
| Cutoff frequency | 2–4 times a week or more | 5 times a week or more |
| Cutoff number of foods | 4 | 3 |
| Food types | Processed Meat; Instant Noodles; Salty snacks; Sugary drinks; Ready-to-eat foods; Fast food; Fried potatoes/hot chips; Processed Dairy; Breakfast cereals; Sweets; Confectionery; Sugar; Vetkoek/Dumpling; Commercial Bread—White; Commercial Bread—brown | Vegetables—fresh; Vegetables—cooked; Vegetables (fried/stir fry); Fruit; Legumes; Bread—wholewheat; Fish |
| Class | Risky | Protective |
|---|---|---|
| Description | Ultraprocessed and obesogenic foods high in salt, sugar and saturated fats | Minimally processed, nutrient-dense foods |
| Threshold | 2 | 2 |
| Foods | Instant Noodles; Confectionery and Sweet Snacks; Sweets; Sugar-sweetened beverages; Salty Snacks; Dairy, Ultraprocessed; Meat, Ultraprocessed; Commercial bread; Breakfast Cereals; Flour-based meal with roasted or baked additions, (e.g., burger, pizza, dagwood, gatsby, kota); Dessert; Confectionery (Cookies, scones, muffins); Sugar; Deep fried starchy food (deep-fried dumpling, potato chips) | Fruit; Vegetables; Legumes; Legumes, cooked; Vegetables, cooked or fried; vegetables and relish; Fish, cooked or grilled; Fish |
| Household | PI 1 | PI 0 |
|---|---|---|
| RI 1 | high risk, protective (households frequently consume risky foods but also protective foods) | high risk, vulnerable (households frequently consume risky foods, but lacking adequate protective food consumption) |
| RI 0 | low risk, protective (households consume risky foods infrequently, and frequently consume protective foods) | low risk, vulnerable (households infrequently consume risky foods but also consume inadequate protective foods) |
| Neighbourhood | ||
| RI 1 | High risk and protective (outlet stocks a wide variety of high risk and protective foods) | High risk (outlet stocks a variety of high risk foods but few protective) |
| RI 0 | Low risk and protective (outlet stocks a variety of low-risk and protective foods) | Low risk (outlet stocks mainly low-risk staple foods and few protective or high-risk foods) |
| Outlet Type | Ahodwo | Khayelitsha | % Ahodwo | % Khayelitsha |
|---|---|---|---|---|
| Formal Retailer | 27 | 6 | 7% | 7% |
| Informal Shop | 109 | 27 | 27% | 33% |
| Stall or mobile trader | 89 | 19 | 22% &23% | |
| Formal food service | 58 | 12 | 15% | 14% |
| Informal food service | 116 | 19 | 29% | 23% |
© 2019 by the authors. Licensee MDPI, Basel, Switzerland. This article is an open access article distributed under the terms and conditions of the Creative Commons Attribution (CC BY) license (http://creativecommons.org/licenses/by/4.0/).
Share and Cite
Kroll, F.; Swart, E.C.; Annan, R.A.; Thow, A.M.; Neves, D.; Apprey, C.; Aduku, L.N.E.; Agyapong, N.A.F.; Moubarac, J.-C.; Toit, A.d.; et al. Mapping Obesogenic Food Environments in South Africa and Ghana: Correlations and Contradictions. Sustainability 2019, 11, 3924. https://doi.org/10.3390/su11143924
Kroll F, Swart EC, Annan RA, Thow AM, Neves D, Apprey C, Aduku LNE, Agyapong NAF, Moubarac J-C, Toit Ad, et al. Mapping Obesogenic Food Environments in South Africa and Ghana: Correlations and Contradictions. Sustainability. 2019; 11(14):3924. https://doi.org/10.3390/su11143924
Chicago/Turabian StyleKroll, Florian, Elizabeth Catherina Swart, Reginald Adjetey Annan, Anne Marie Thow, David Neves, Charles Apprey, Linda Nana Esi Aduku, Nana Ama Frimpomaa Agyapong, Jean-Claude Moubarac, Andries du Toit, and et al. 2019. "Mapping Obesogenic Food Environments in South Africa and Ghana: Correlations and Contradictions" Sustainability 11, no. 14: 3924. https://doi.org/10.3390/su11143924
APA StyleKroll, F., Swart, E. C., Annan, R. A., Thow, A. M., Neves, D., Apprey, C., Aduku, L. N. E., Agyapong, N. A. F., Moubarac, J.-C., Toit, A. d., Aidoo, R., & Sanders, D. (2019). Mapping Obesogenic Food Environments in South Africa and Ghana: Correlations and Contradictions. Sustainability, 11(14), 3924. https://doi.org/10.3390/su11143924